
Preclinical Evaluation of [18F]FACH in Healthy Mice and Piglets: An 18F-Labeled Ligand for Imaging of Monocarboxylate Transporters with PET

 ,
,  , , , , , , ,
  , ,
, ,
Abstract
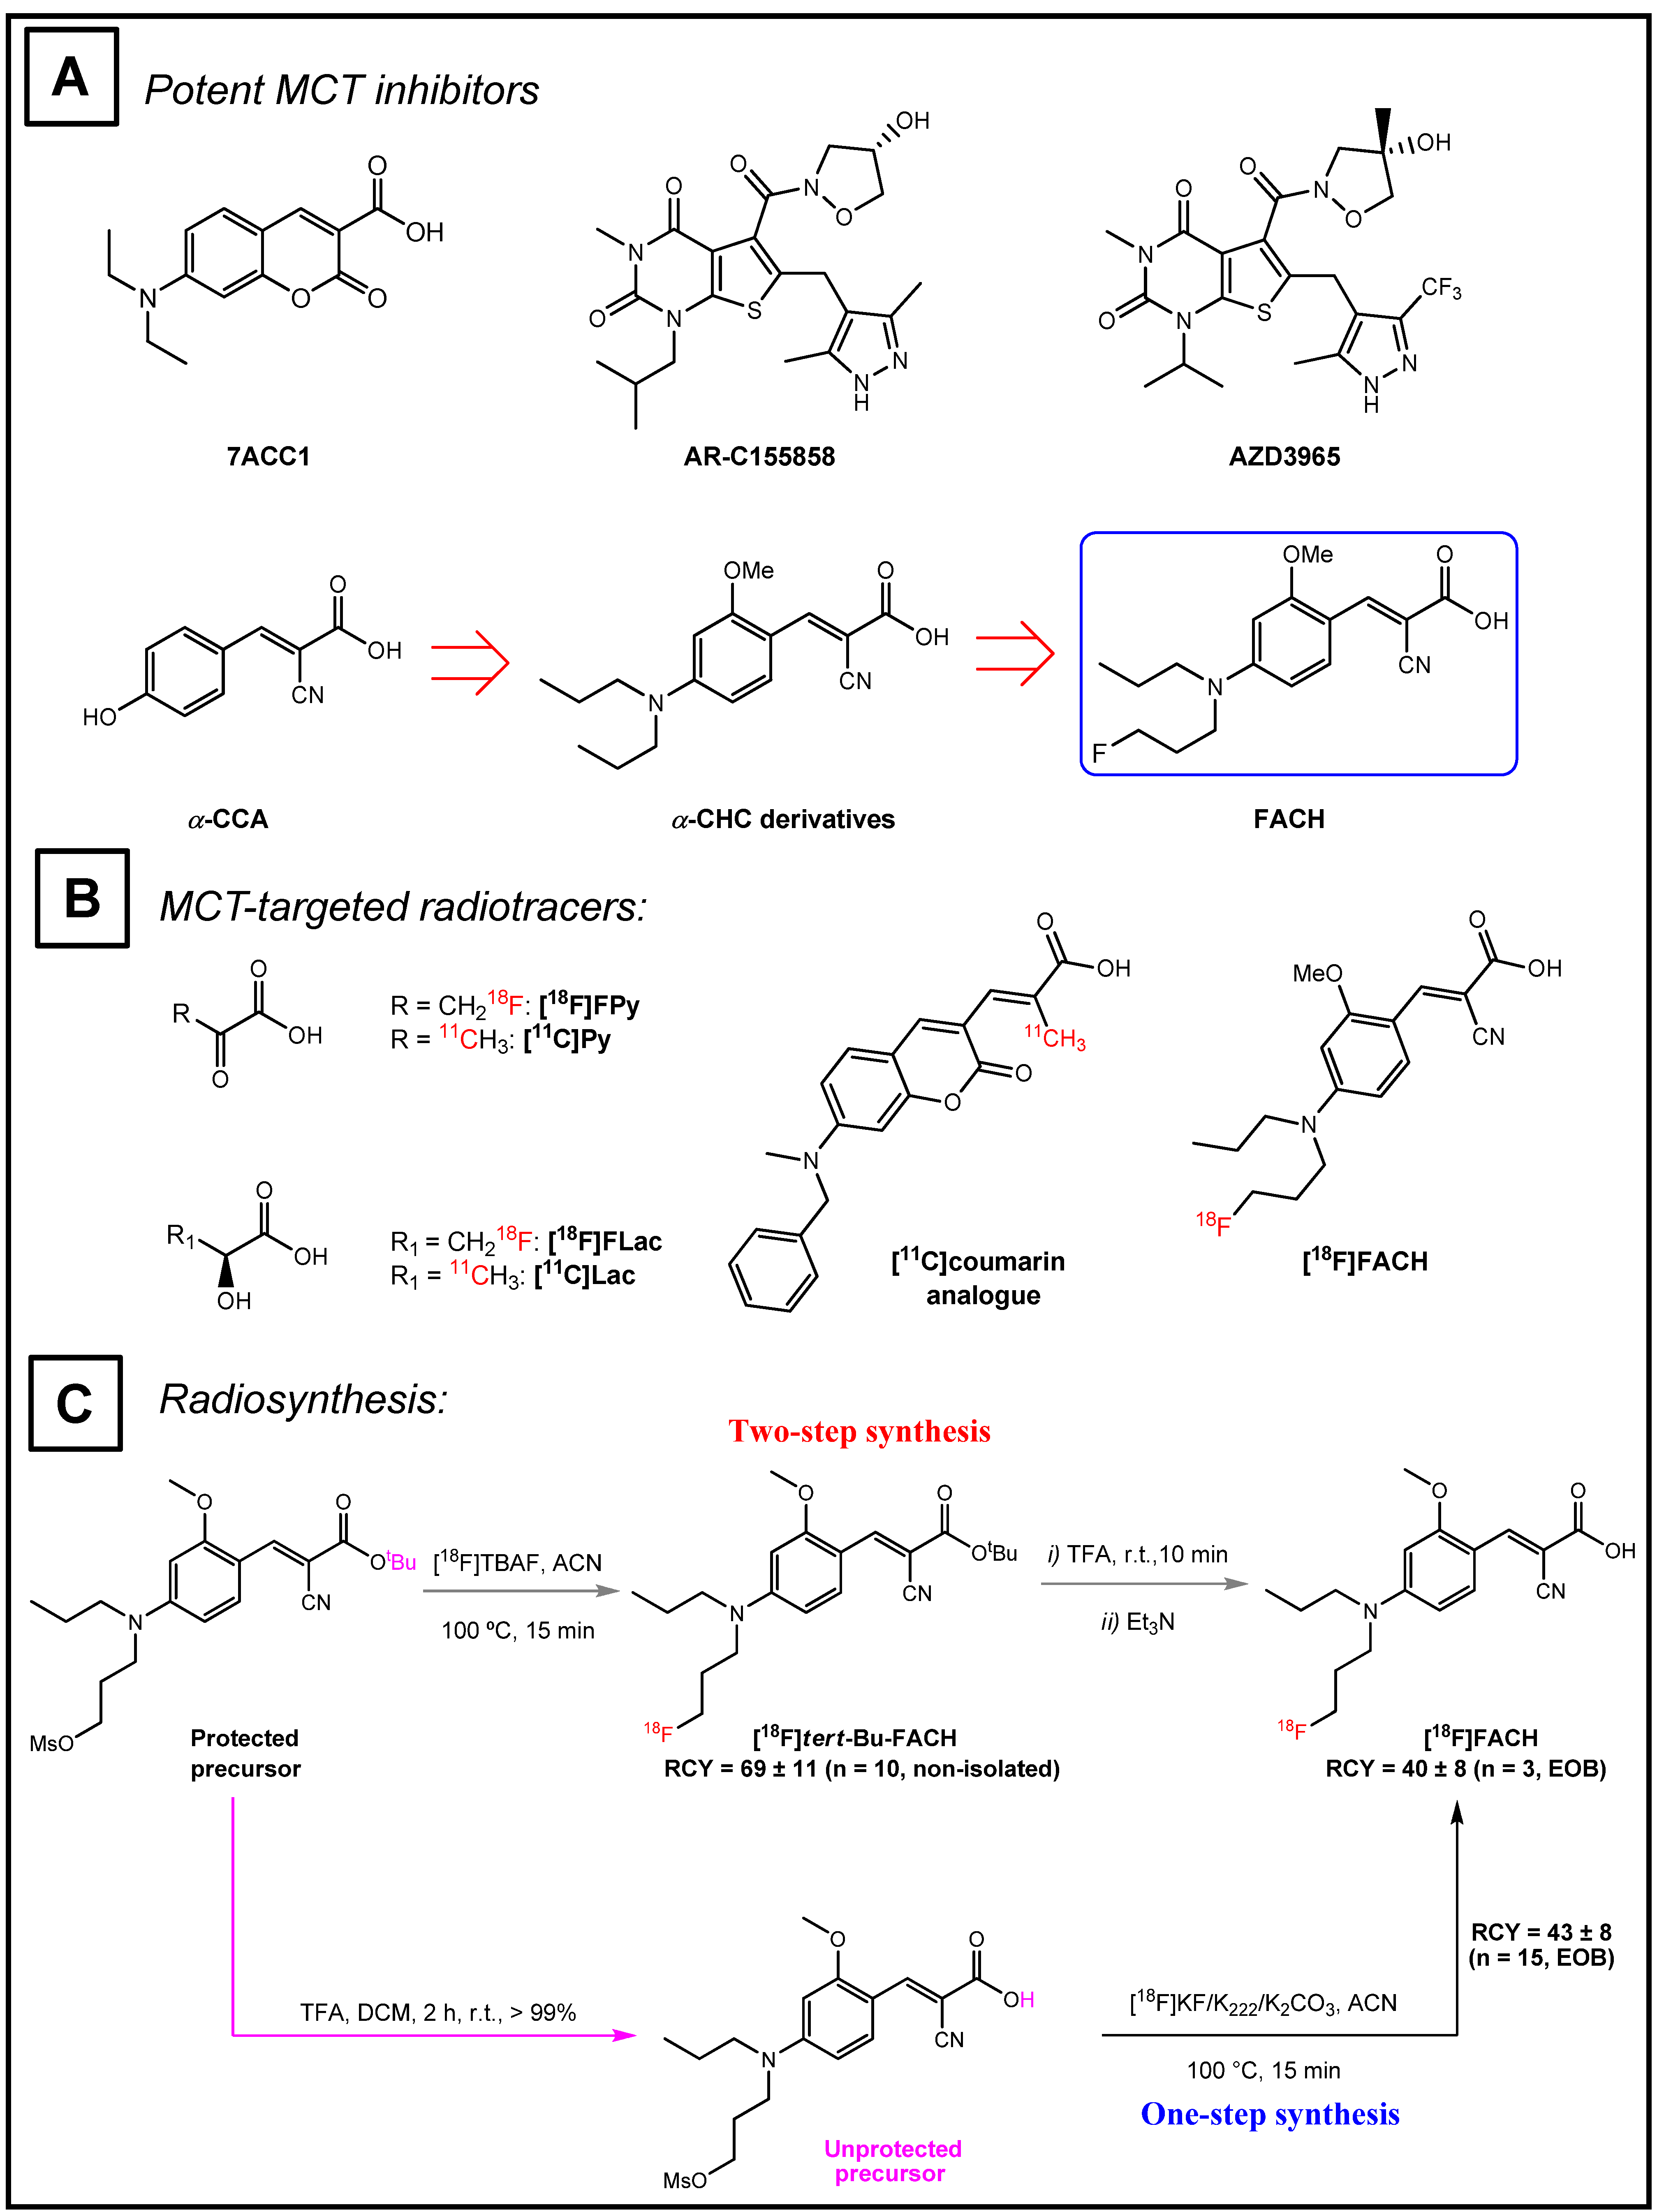
:1. Introduction
2. Results
2.1. Plasma Protein Binding
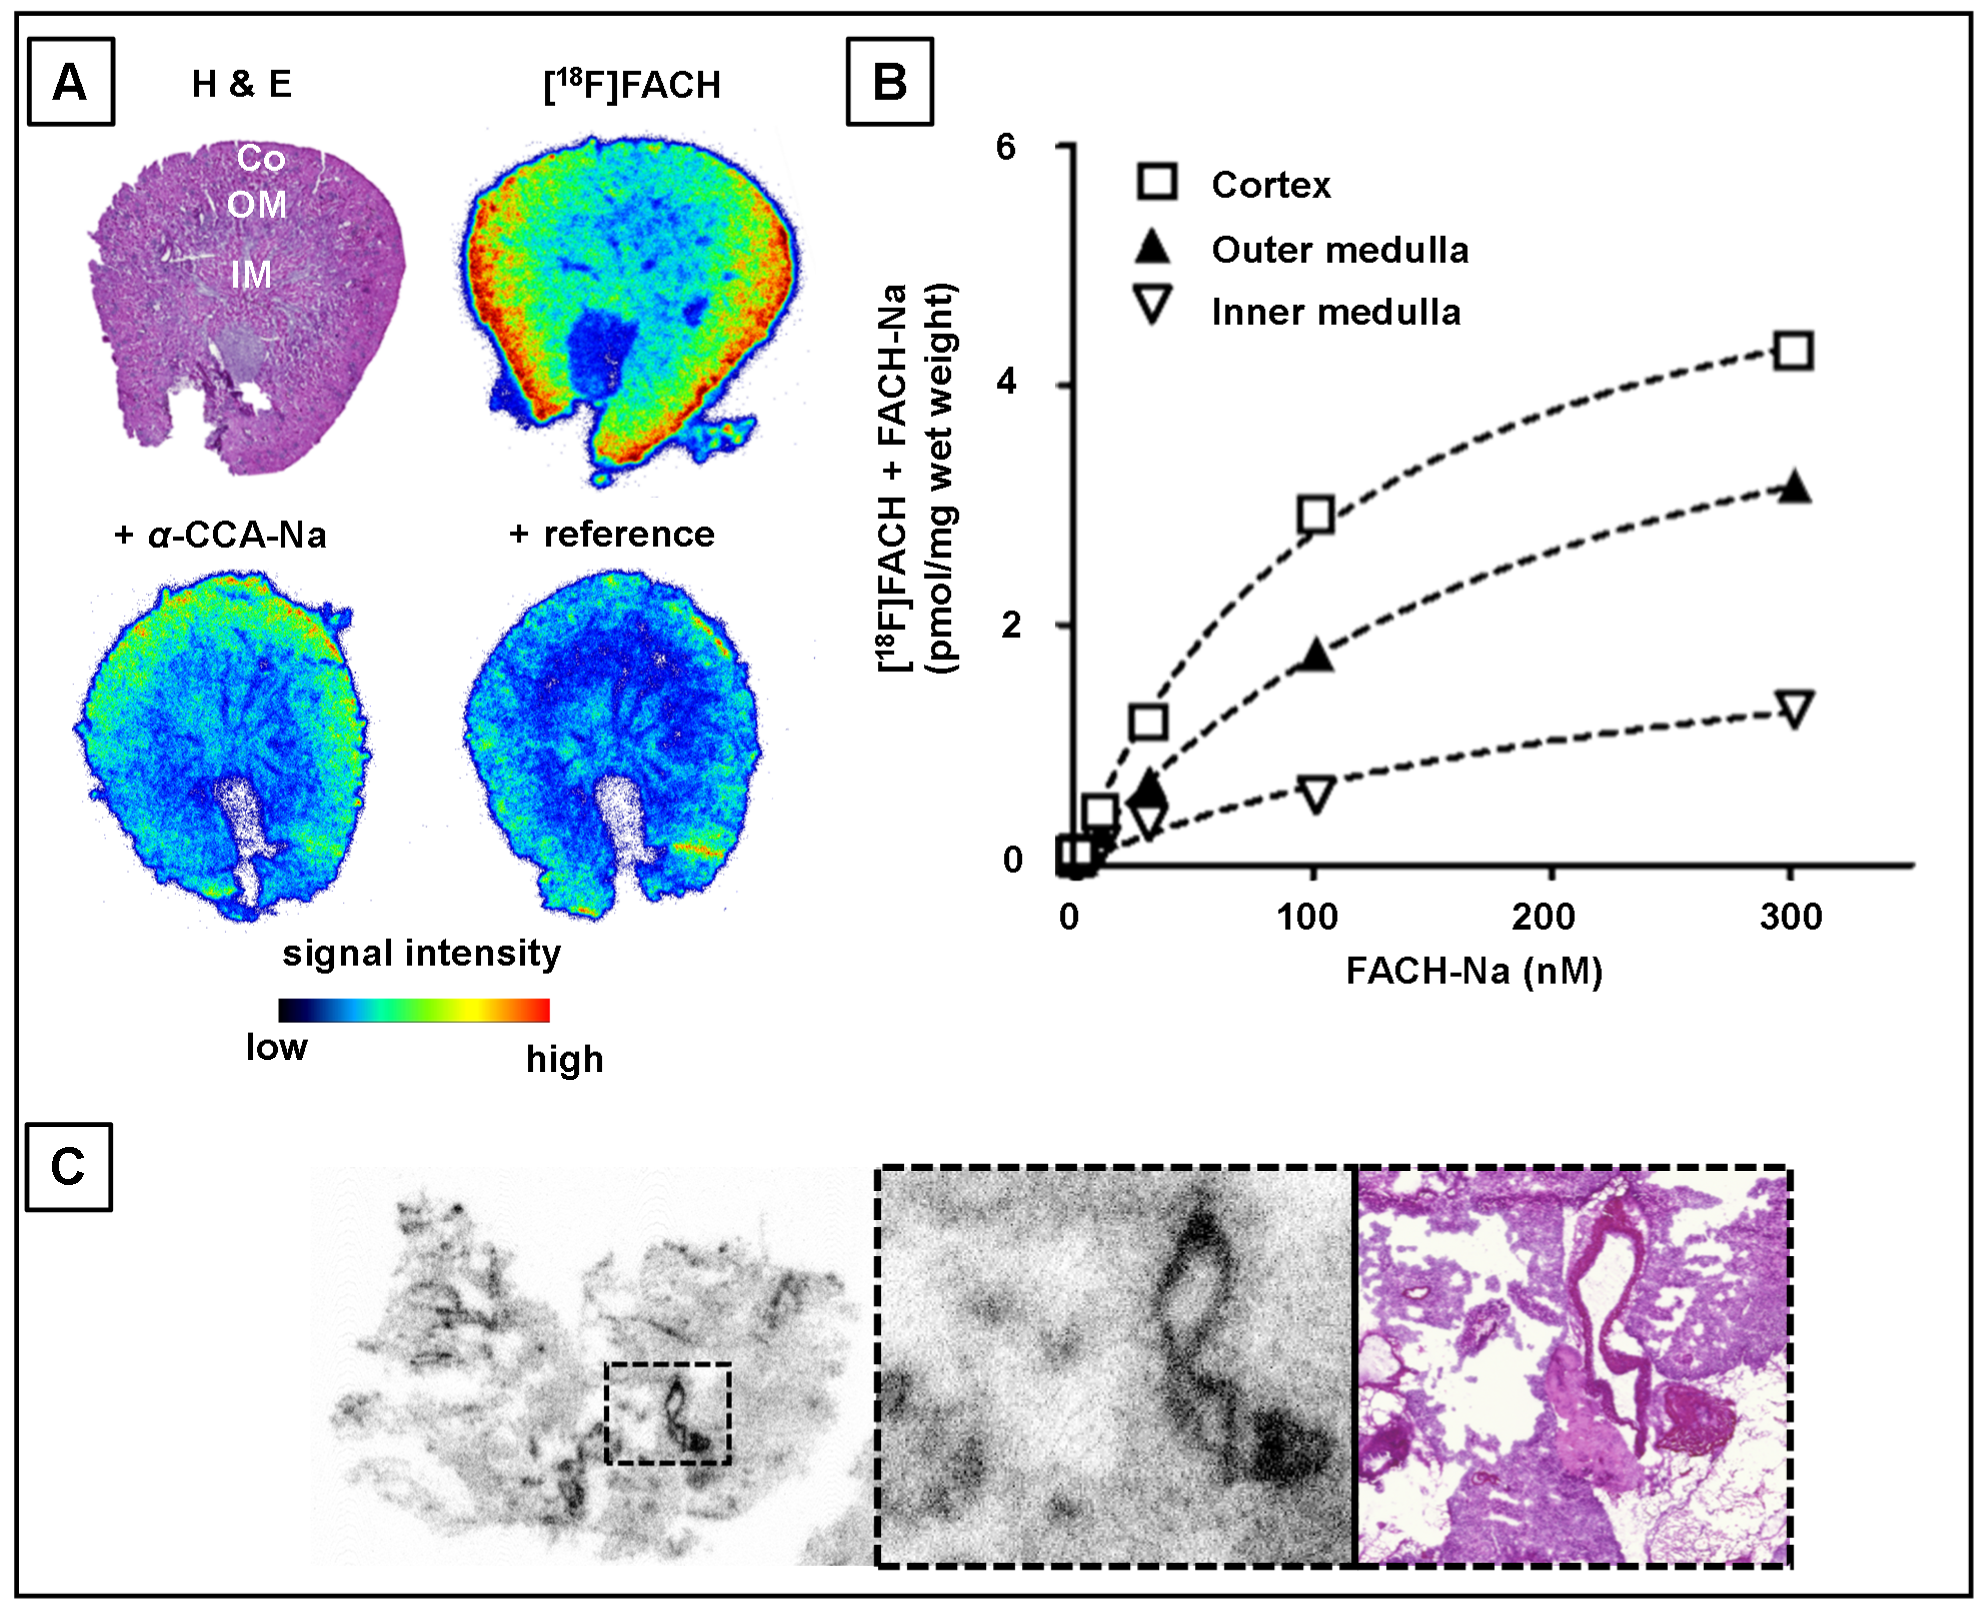
2.2. In Vitro Determination of Binding Parameters of [18F]FACH in Mouse Tissues
2.3. Biodistribution of [18F]FACH in Mice
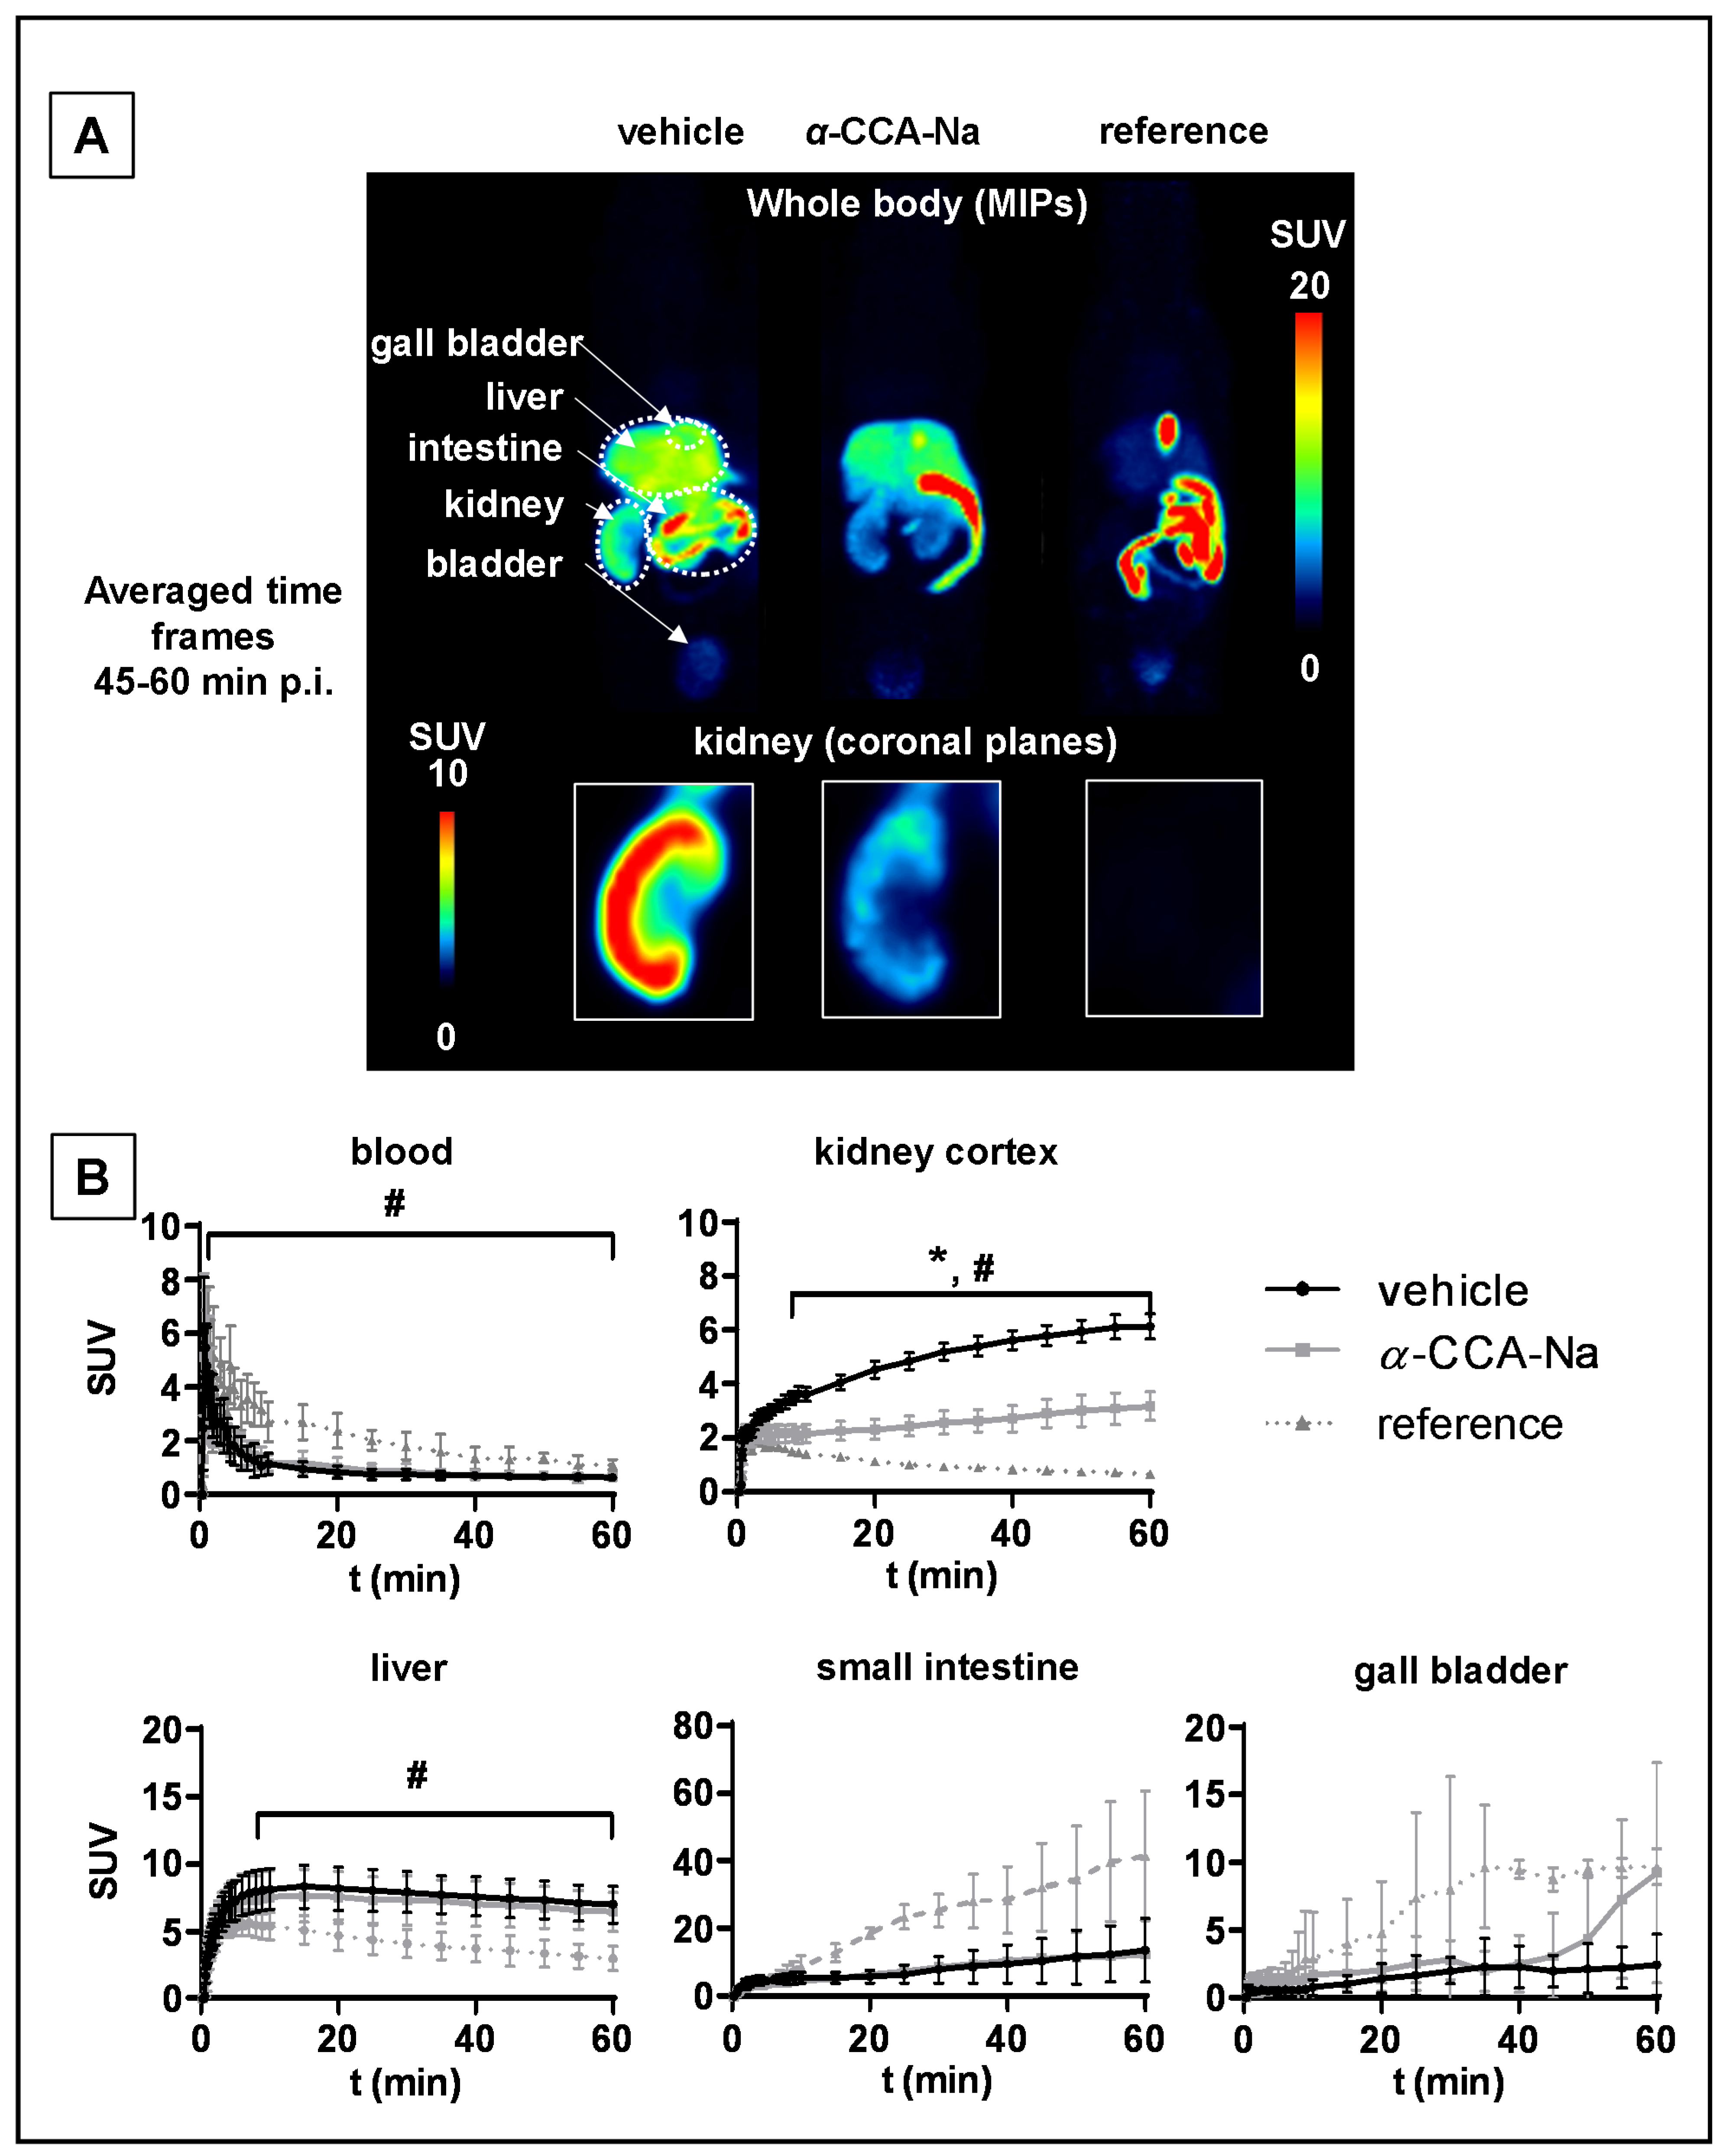
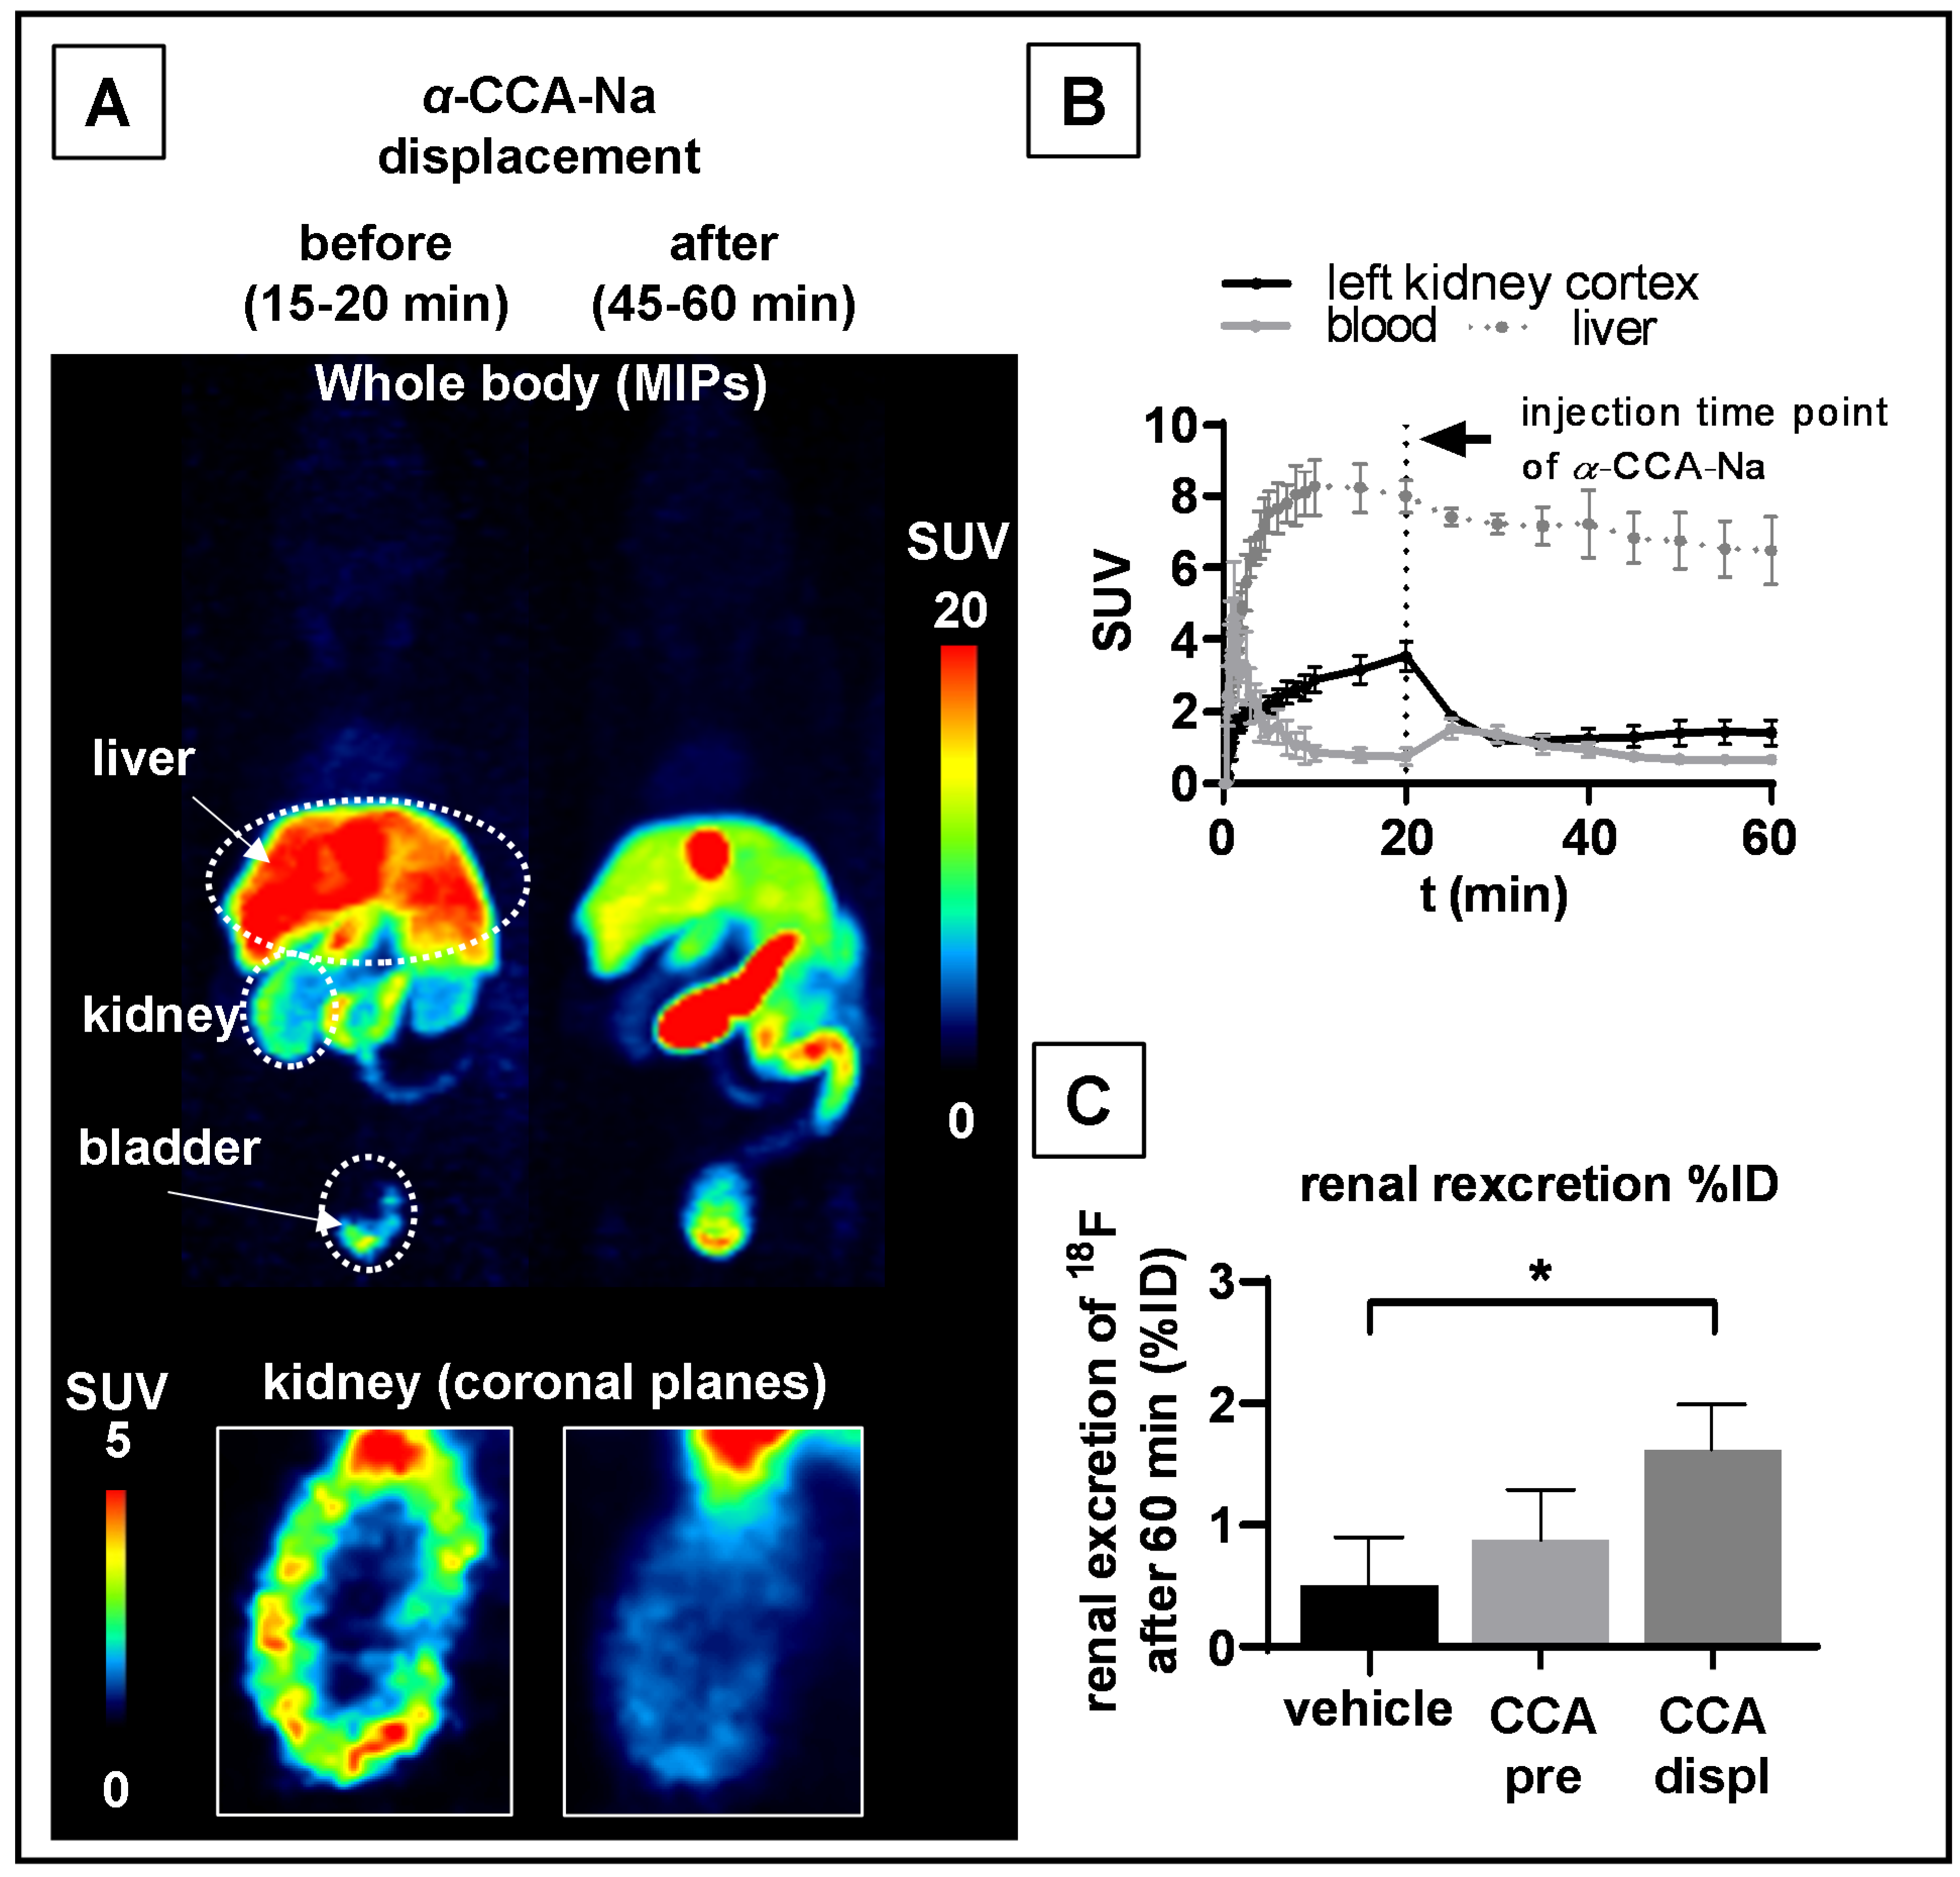
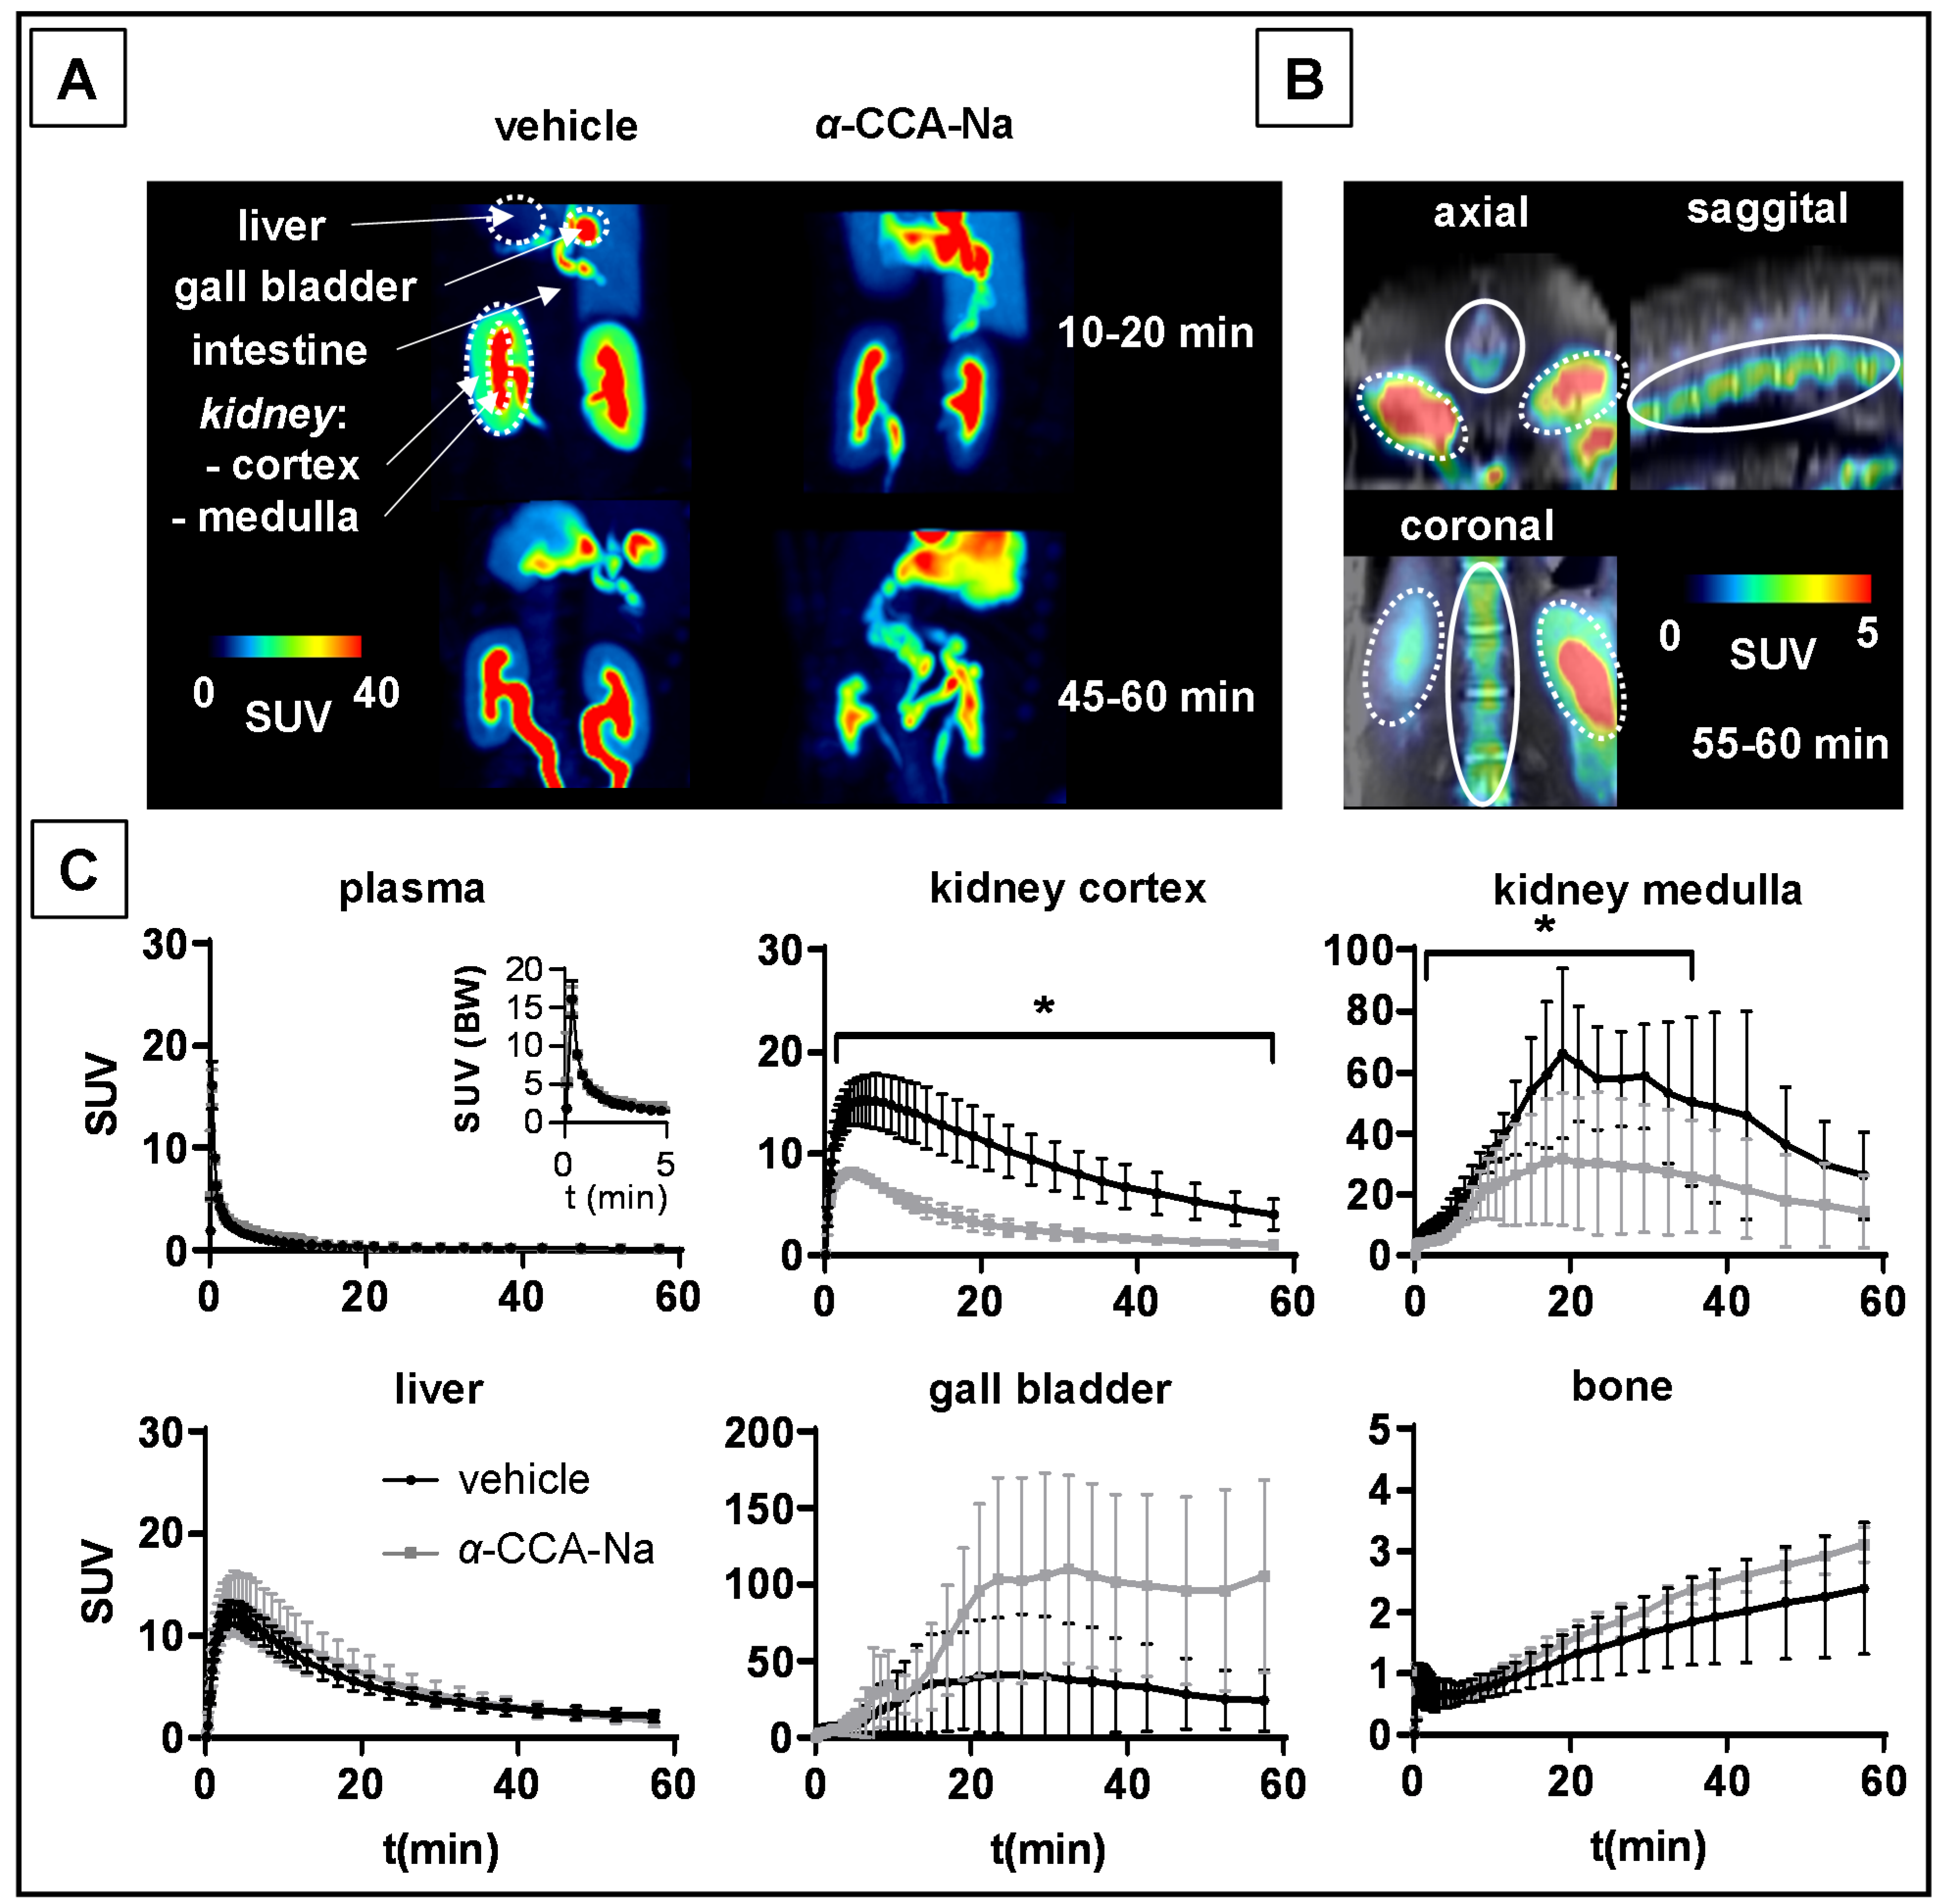
2.4. PET Studies in Mice
2.5. PET Studies in Piglets
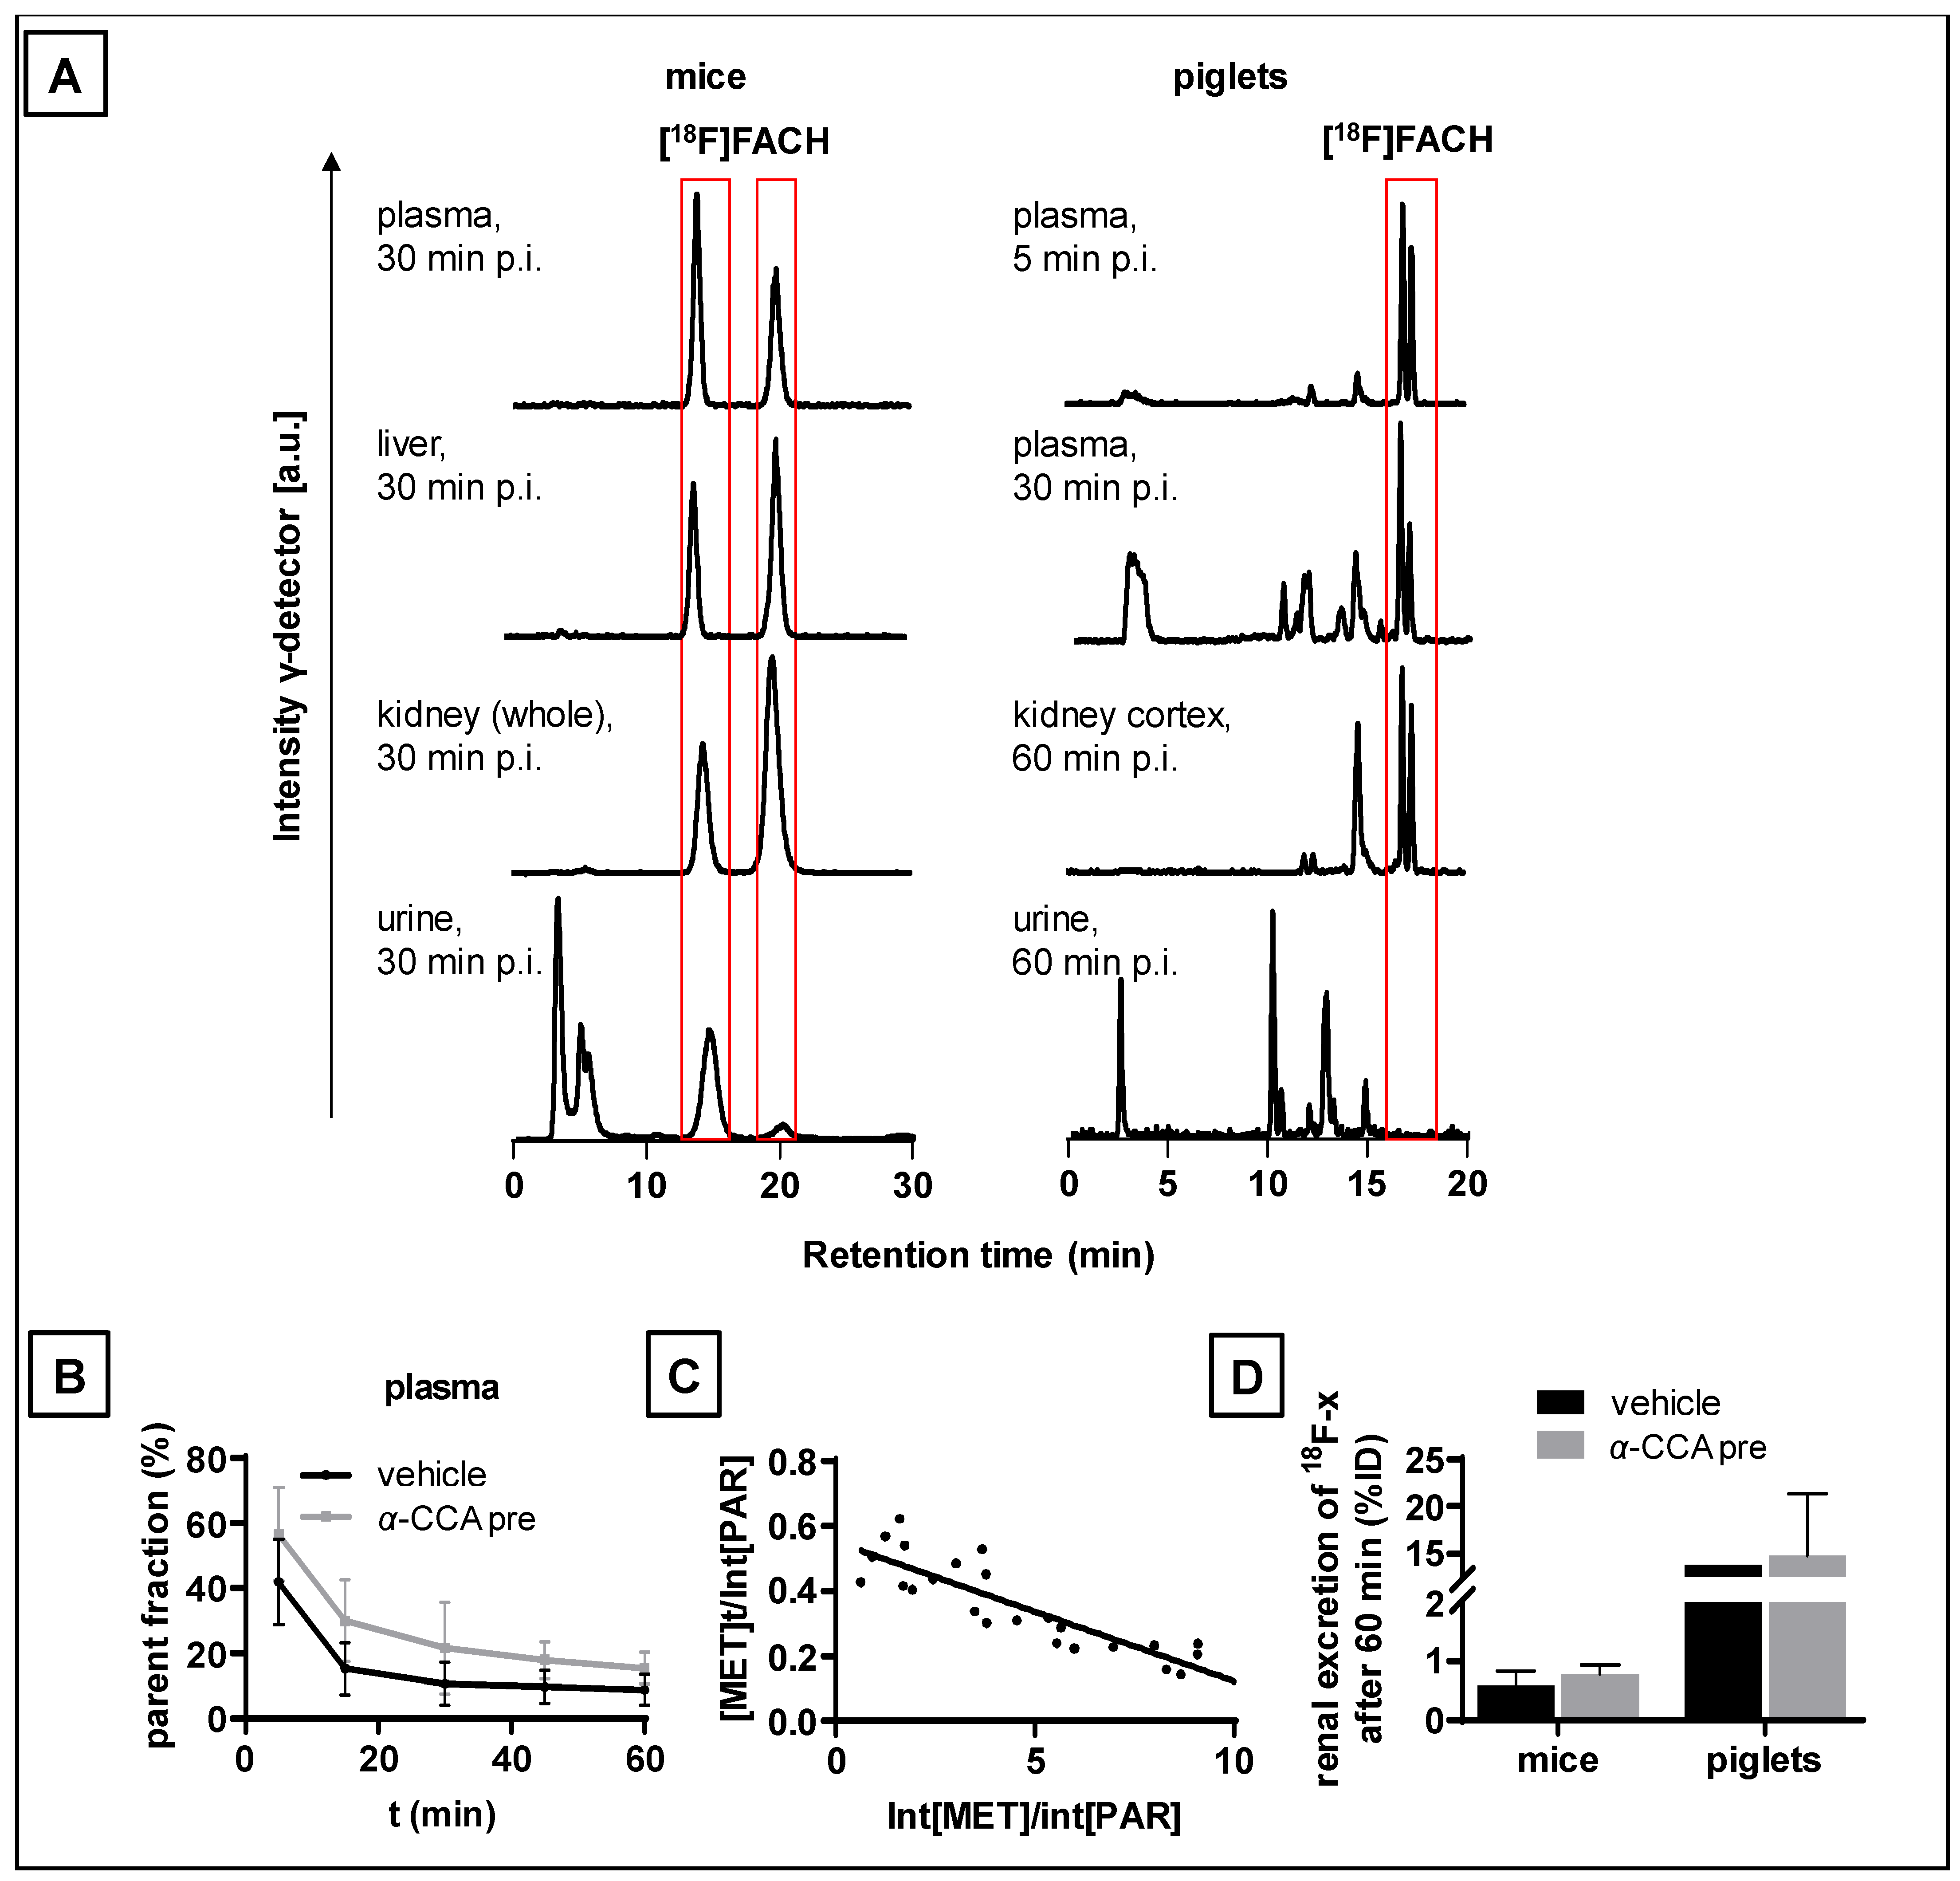
2.6. Metabolism of [18F]FACH in Mice and Piglets In Vivo
2.7. Kinetic Modelling of Renal [18F]FACH Uptake in Mice and Piglets
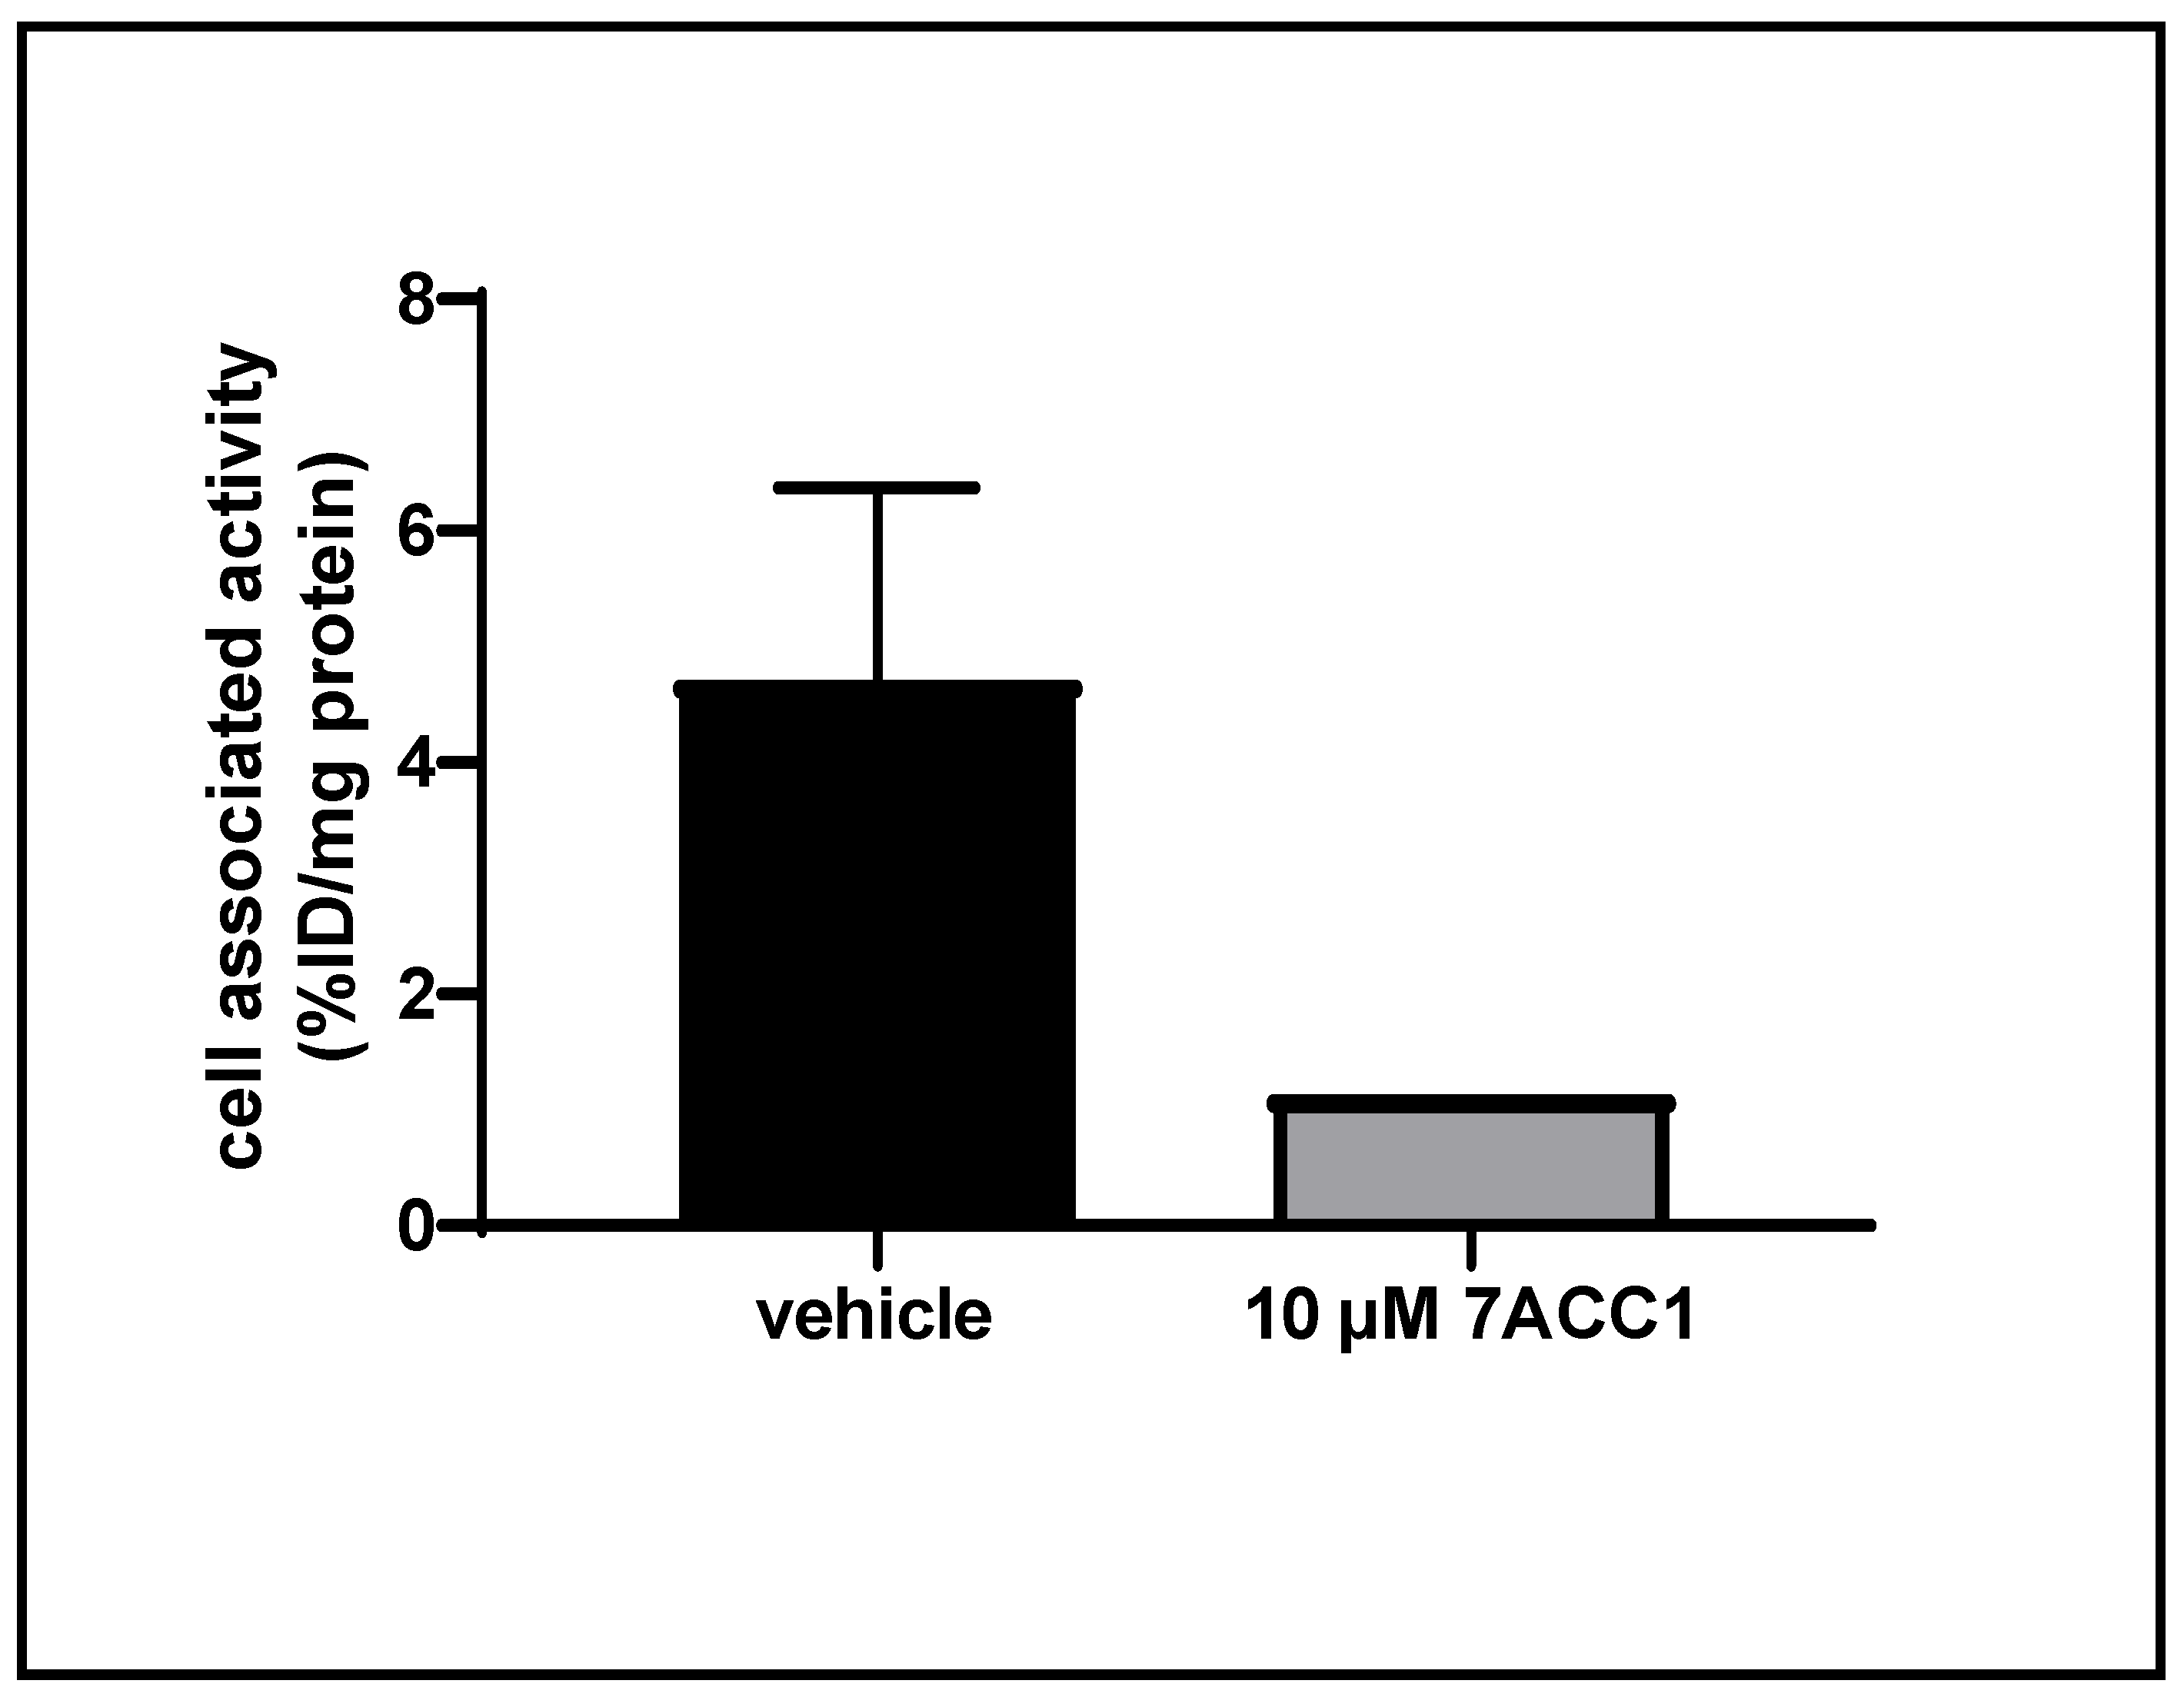
2.8. Cellular Uptake Studies of [18F]FACH in a Triple Negative Breast Cancer (TNBC) Cell Line of Mouse
2.9. Toxicity Studies of the Reference Compound in Rats
3. Discussion
4. Materials and Methods
4.1. General
4.2. Animals
4.3. In Vitro and Ex Vivo Plasma Protein Binding Studies
4.4. Autoradiographic Analysis of Radioligand Binding in Mouse Tissues In Vitro
4.5. Ex vivo Biodistribution Study
4.6. PET/MRI Scans
4.7. Metabolism Studies of [18F]FACH in Mice and Piglets
4.8. Kinetic Modelling
4.9. Toxicity Studies of the Reference Compound in Rats
4.10. Cell Uptake Studies
4.11. Statistics
5. Conclusions
Supplementary Materials
Author Contributions
Funding
Institutional Review Board Statement
Informed Consent Statement
Data Availability Statement
Acknowledgments
Conflicts of Interest
References
- Halestrap, A.P.; Wilson, M.C. The monocarboxylate transporter family-Role and regulation. IUBMB Life 2012, 64, 109–119. [Google Scholar] [CrossRef]
- Adijanto, J.; Philp, N.J. The SLC16A family of monocarboxylate transporters (MCTs)-physiology and function in cellular metabolism, pH homeostasis, and fluid transport. Curr. Top. Membr. 2012, 70, 275–312. [Google Scholar] [CrossRef] [PubMed]
- Payen, V.L.; Mina, E.; Van Hée, V.F.; Porporato, P.E.; Sonveaux, P. Monocarboxylate transporters in cancer. Mol. Metab. 2020, 33, 48–66. [Google Scholar] [CrossRef] [PubMed]
- Benjamin, D.; Robay, D.; Hindupur, S.K.; Pohlmann, J.; Colombi, M.; El-Shemerly, M.Y.; Maira, S.M.; Moroni, C.; Lane, H.A.; Hall, M.N. Dual Inhibition of the Lactate Transporters MCT1 and MCT4 Is Synthetic Lethal with Metformin due to NAD+ Depletion in Cancer Cells. Cell Rep. 2018, 25, 3047–3058.e4. [Google Scholar] [CrossRef] [PubMed] [Green Version]
- Contreras-Baeza, Y.; Sandoval, P.Y.; Alarcón, R.; Galaz, A.; Cortés-Molina, F.; Alegría, K.; Baeza-Lehnert, F.; Arce-Molina, R.; Guequén, A.; Flores, C.A.; et al. Monocarboxylate transporter 4 (MCT4) is a high affinity transporter capable of exporting lactate in high-lactate microenvironments. J. Biol. Chem. 2019, 294, 20135–20147. [Google Scholar] [CrossRef] [PubMed]
- Gómez, H.; Mizock, B.A. Hyperlactatemia and Lactic Acidosis. In Critical Care Nephrology, 3rd ed.; Elsevier Health Sciences: Amsterdam, The Netherlands, 2018; pp. 394–404. ISBN 9780323449427. [Google Scholar]
- Van Hall, G. Lactate kinetics in human tissues at rest and during exercise. Acta Physiol. 2010, 199, 499–508. [Google Scholar] [CrossRef]
- Gurung, P.; Jialal, I. Plasma Glucose; StatPearls Publishing: Treasure Isalnd, FL, USA, 2019. [Google Scholar]
- Hoehmann, B.; Frohnert, P.P.; Kinne, R.; Baumann, K. Proximal tubular lactate transport in rat kidney: A micropuncture study. Kidney Int. 1974, 5, 261–270. [Google Scholar] [CrossRef] [Green Version]
- Halestrap, A.P. Monocarboxylic Acid Transport. Compr. Physiol. 2013, 3, 1611–1643. [Google Scholar] [CrossRef]
- Iwanaga, T.; Kishimoto, A. Cellular distributions of monocarboxylate transporters: A review. Biomed. Res. 2015, 36, 279–301. [Google Scholar] [CrossRef] [Green Version]
- Becker, H.M.; Mohebbi, N.; Perna, A.; Ganapathy, V.; Capasso, G.; Wagner, C.A. Localization of members of MCT monocarboxylate transporter family Slc16 in the kidney and regulation during metabolic acidosis. Am. J. Physiol. Physiol. 2010, 299, F141–F154. [Google Scholar] [CrossRef] [PubMed]
- Bonen, A. The expression of lactate transporters (MCT1 and MCT4) in heart and muscle. Eur. J. Appl. Physiol. 2001, 86, 6–11. [Google Scholar] [CrossRef]
- Schutkowski, A.; Wege, N.; Stangl, G.I.; König, B. Tissue-Specific Expression of Monocarboxylate Transporters during Fasting in Mice. PLoS ONE 2014, 9, e112118. [Google Scholar] [CrossRef]
- Zhu, Y.; Wu, J.; Yuan, S.Y. MCT1 and MCT4 expression during myocardial ischemic-reperfusion injury in the isolated rat heart. Cell. Physiol. Biochem. 2013, 32, 663–674. [Google Scholar] [CrossRef]
- Payen, V.L.; Hsu, M.Y.; Rädecke, K.S.; Wyart, E.; Vazeille, T.; Bouzin, C.; Porporato, P.E.; Sonveaux, P. Monocarboxylate transporter MCT1 promotes tumor metastasis independently of its activity as a lactate transporter. Cancer Res. 2017, 77, 5591–5601. [Google Scholar] [CrossRef] [PubMed] [Green Version]
- van Hasselt, P.M.; Ferdinandusse, S.; Monroe, G.R.; Ruiter, J.P.N.; Turkenburg, M.; Geerlings, M.J.; Duran, K.; Harakolova, M.; van der Zwaarg, B.; Monavari, A.A.; et al. Monocarboxylate Transporter 1 Deficiency and Ketone Utilization. N. Engl. J. Med. 2014, 371, 1900–1907. [Google Scholar] [CrossRef] [Green Version]
- Lord, K.; De León, D.D. Monogenic hyperinsulinemic hypoglycemia: Current insights into the pathogenesis and management. Int. J. Pediatr. Endocrinol. 2013, 2013, 1–9. [Google Scholar] [CrossRef] [Green Version]
- Droździk, M.; Szeląg-pieniek, S.; Grzegółkowska, J.; Łapczuk-romańska, J.; Post, M.; Domagała, P.; Miętkiewski, J.; Oswald, S.; Kurzawski, M. Monocarboxylate transporter 1 (MCT1) in liver pathology. Int. J. Mol. Sci. 2020, 21, 1606. [Google Scholar] [CrossRef] [Green Version]
- He, L.; Wang, H.; Zhang, Y.; Geng, L.; Yang, M.; Xu, Z.; Zou, K.; Xu, W.; Gong, S. Evaluation of Monocarboxylate Transporter 4 in Inflammatory Bowel Disease and Its Potential Use as a Diagnostic Marker. Dis. Markers 2018, 2018, 1–6. [Google Scholar] [CrossRef] [PubMed] [Green Version]
- Pérez-Escuredo, J.; Van Hée, V.F.; Sboarina, M.; Falces, J.; Payen, V.L.; Pellerin, L.; Sonveaux, P. Monocarboxylate transporters in the brain and in cancer. Biochim. Biophys. Acta Mol. Cell Res. 2016, 1863, 2481–2497. [Google Scholar] [CrossRef] [PubMed] [Green Version]
- Fisel, P.; Schaeffeler, E.; Schwab, M. Clinical and Functional Relevance of the Monocarboxylate Transporter Family in Disease Pathophysiology and Drug Therapy. Clin. Transl. Sci. 2018, 11, 352–364. [Google Scholar] [CrossRef]
- Van Hée, V.F.; Labar, D.; Dehon, G.; Grasso, D.; Grégoire, V.; Muccioli, G.G.; Frédérick, R.; Sonveaux, P. Radiosynthesis and validation of (±)-[18F]-3-fluoro-2-hydroxypropionate ([18F]-FLac) as a PET tracer of lactate to monitor MCT1-dependent lactate uptake in tumors. Oncotarget 2017, 8, 24415–24428. [Google Scholar] [CrossRef] [PubMed]
- Tateishi, H.; Tsuji, A.B.; Kato, K.; Sudo, H.; Sugyo, A.; Hanakawa, T.; Zhang, M.-R.; Saga, T.; Arano, Y.; Higashi, T. Synthesis and evaluation of 11C-labeled coumarin analog as an imaging probe for detecting monocarboxylate transporters expression. Bioorg. Med. Chem. Lett. 2017, 27, 4893–4897. [Google Scholar] [CrossRef] [PubMed]
- Herrero, P.; Dence, C.S.; Coggan, A.R.; Kisrieva-Ware, Z.; Eisenbeis, P.; Gropler, R.J. L-3-11C-lactate as a PET tracer of myocardial lactate metabolism: A feasibility study. J. Nucl. Med. 2007, 48, 2046–2055. [Google Scholar] [CrossRef] [PubMed] [Green Version]
- Yokoi, F.; Hara, T.; Iio, M.; Nonaka, I.; Satoyoshi, E. 1-[11C]Pyruvate turnover in brain and muscle of patients with mitochondrial encephalomyopathy. A study with positron emission tomography (PET). J. Neurol. Sci. 1990, 99, 339–348. [Google Scholar] [CrossRef]
- Graham, K.; Müller, A.; Lehmann, L.; Koglin, N.; Dinkelborg, L.; Siebeneicher, H. [18F]Fluoropyruvate: Radiosynthesis and initial biological evaluation. J. Label. Compd. Radiopharm. 2014, 57, 164–171. [Google Scholar] [CrossRef]
- Sadeghzadeh, M.; Moldovan, R.P.; Fischer, S.; Wenzel, B.; Ludwig, F.A.; Teodoro, R.; Deuther-Conrad, W.; Jonnalagadda, S.; Jonnalagadda, S.K.; Gudelis, E.; et al. Development and radiosynthesis of the first 18F-labeled inhibitor of monocarboxylate transporters (MCTs). J. Label. Compd. Radiopharm. 2019, 62, 411–424. [Google Scholar] [CrossRef]
- Sadeghzadeh, M.; Moldovan, R.P.; Teodoro, R.; Brust, P.; Wenzel, B. One-step radiosynthesis of the MCTs imaging agent [18F]FACH by aliphatic 18F-labelling of a methylsulfonate precursor containing an unprotected carboxylic acid group. Sci. Rep. 2019, 9, 1–8. [Google Scholar] [CrossRef]
- Wang, X.; Levi, A.J.; Halestrap, A.P. Substrate and inhibitor specificities of the monocarboxylate transporters of single rat heart cells. Am. J. Physiol. Hear. Circ. Physiol. 1996, 270, H476–H484. [Google Scholar] [CrossRef]
- Sattler, B.; Kranz, M.; Wenzel, B.; Jain, N.T.; Moldovan, R.P.; Toussaint, M.; Deuther-Conrad, W.; Ludwig, F.A.; Teodoro, R.; Sattler, T.; et al. Preclinical incorporation dosimetry of [18F]FACH—a novel 18F-labeled MCT1/MCT4 lactate transporter inhibitor for imaging cancer metabolism with PET. Molecules 2020, 25, 2024. [Google Scholar] [CrossRef] [PubMed]
- Cumming, P.; Yokoi, F.; Chen, A.; Deep, P.; Dagher, A.; Reutens, D.; Kapczinski, F.; Wong, D.F.; Gjedde, A. Pharmacokinetics of radiotracers in human plasma during positron emission tomography. Synapse 1999, 34, 124–134. [Google Scholar] [CrossRef]
- Forker, E.L.; Luxon, B.A. Albumin helps mediate removal of taurocholate by rat liver. J. Clin. Investig. 1981, 67, 1517–1522. [Google Scholar] [CrossRef]
- Chang, J.H.; Chen, Y.-C.; Cheong, J.; Jones, R.S.; Pang, J. Investigating the Impact of Albumin on the Liver Uptake of Pitavastatin and Warfarin in Nagase Analbuminemic Rats s. Drug Metab. Dispos. 2019, 47, 1307–1313. [Google Scholar] [CrossRef] [PubMed]
- Gündel, D.; Pohle, U.; Prell, E.; Odparlik, A.; Thews, O. Assessing Glomerular Filtration in Small Animals Using [68Ga]DTPA and [68Ga]EDTA with PET Imaging. Mol. Imaging Biol. 2018, 20, 457–464. [Google Scholar] [CrossRef]
- Trüssel, S.; Dumelin, C.; Frey, K.; Villa, A.; Buller, F.; Neri, D. New strategy for the extension of the serum half-life of antibody fragments. Bioconjug. Chem. 2009, 20, 2286–2292. [Google Scholar] [CrossRef] [PubMed]
- Benešová, M.; Umbricht, C.A.; Schibli, R.; Müller, C. Albumin-Binding PSMA Ligands: Optimization of the Tissue Distribution Profile. Mol. Pharm. 2018, 15, 934–946. [Google Scholar] [CrossRef]
- Yanase, H.; Takebe, K.; Nio-Kobayashi, J.; Takahashi-Iwanaga, H.; Iwanaga, T. Cellular expression of a sodium-dependent monocarboxylate transporter (Slc5a8) and the MCT family in the mouse kidney. Histochem. Cell Biol. 2008, 130, 957–966. [Google Scholar] [CrossRef]
- Nakai, M.; Chen, L.; Nowak, R.A. Tissue distribution of basigin and monocarboxylate transporter 1 in the adult male mouse: A study using the wild-type and basigin gene knockout mice. Anat. Rec. Part A Discov. Mol. Cell. Evol. Biol. 2006, 288, 527–535. [Google Scholar] [CrossRef] [Green Version]
- Guan, X.; Bryniarski, M.A.; Morris, M.E. In Vitro and In Vivo Efficacy of the Monocarboxylate Transporter 1 Inhibitor AR-C155858 in the Murine 4T1 Breast Cancer Tumor Model. AAPS J. 2019, 21, 1–10. [Google Scholar] [CrossRef]
- Halestrap, A.P.; Meredith, D. The SLC16 gene family—From monocarboxylate transporters (MCTs) to aromatic amino acid transporters and beyond. Pflugers Arch. Eur. J. Physiol. 2004, 447, 619–628. [Google Scholar] [CrossRef] [PubMed]
- Cupeiro, R.; Pérez-Prieto, R.; Amigo, T.; Gortázar, P.; Redondo, C.; González-Lamuño, D. Role of the monocarboxylate transporter MCT1 in the uptake of lactate during active recovery. Eur. J. Appl. Physiol. 2016, 116, 1005–1010. [Google Scholar] [CrossRef] [PubMed] [Green Version]
- Sonveaux, P.; Végran, F.; Schroeder, T.; Wergin, M.C.; Verrax, J.; Rabbani, Z.N.; De Saedeleer, C.J.; Kennedy, K.M.; Diepart, C.; Jordan, B.F.; et al. Targeting lactate-fueled respiration selectively kills hypoxic tumor cells in mice. J. Clin. Invest. 2008, 118, 3930–3942. [Google Scholar] [CrossRef] [PubMed] [Green Version]
- Yung-Chi, C.; Prusoff, W.H. Relationship between the inhibition constant (KI) and the concentration of inhibitor which causes 50 per cent inhibition (I50) of an enzymatic reaction. Biochem. Pharmacol. 1973, 22, 3099–3108. [Google Scholar] [CrossRef]
- Bower, S. The uptake of fentanyl by erythrocytes. J. Pharm. Pharmacol. 1982, 34, 181–185. [Google Scholar] [CrossRef]
- Hall, C.; Lueshen, E.; Mošat’, A.; Linninger, A.A. Interspecies scaling in pharmacokinetics: A novel whole-body physiologically based modeling framework to discover drug biodistribution mechanisms in vivo. J. Pharm. Sci. 2012, 101, 1221–1241. [Google Scholar] [CrossRef]
- Cumming, P.; Léger, G.C.; Kuwabara, H.; Gjedde, A. Pharmacokinetics of plasma 6-[18F]fluoro-L-3,4-dihydroxyphenylalanine ([18F]FDOPA) in humans. J. Cereb. Blood Flow Metab. 1993, 13, 668–675. [Google Scholar] [CrossRef] [Green Version]
- Gagnon, R.C.; Peterson, J.J. Estimation of confidence intervals for area under the curve from destructively obtained pharmacokinetic data. J. Pharmacokinet. Biopharm. 1998, 26, 87–102. [Google Scholar] [CrossRef] [PubMed]


| Tissue | Control | α-CCA-Na | p-Value (30 min) | ||||||
|---|---|---|---|---|---|---|---|---|---|
| 5 min | 15 min | 30 min | 30 min | ||||||
| Mean | SD | Mean | SD | Mean | SD | Mean | SD | ||
| kidney | 7.97 | 0.36 | 12.81 | 0.94 | 15.97 | 1.07 | 5.94 | 1.01 | 0.001 |
| urine | 0.82 | 0.19 | 4.32 | 1.30 | 4.57 | 3.99 | 11.30 | 6.84 | 0.108 |
| liver | 9.65 | 0.53 | 10.65 | 1.11 | 8.48 | 1.00 | 8.81 | 0.77 | 0.335 |
| gall bladder | 4.61 | 2.69 | 5.36 | 0.58 | 10.96 | 3.26 | 8.21 | 5.03 | 0.250 |
| blood | 1.85 | 0.29 | 0.91 | 0.20 | 0.82 | 0.05 | 0.95 | 0.06 | 0.021 |
| plasma | 3.77 | 0.57 | 1.76 | 0.45 | 1.69 | 0.17 | 1.92 | 0.07 | 0.044 |
| brain | 0.08 | 0.02 | 0.04 | 0.01 | 0.04 | 0.01 | 0.04 | 0.00 | 0.209 |
| bladder | 0.17 | 0.03 | 0.35 | 0.05 | 0.31 | 0.07 | 0.27 | 0.17 | 0.389 |
| ovar | 0.38 | 0.20 | 0.33 | 0.12 | 0.32 | 0.08 | 0.54 | 0.24 | 0.106 |
| adipose tissue | 0.12 | 0.07 | 0.18 | 0.10 | 0.15 | 0.05 | 0.11 | 0.03 | 0.144 |
| spleen | 0.37 | 0.04 | 0.21 | 0.07 | 0.22 | 0.06 | 0.28 | 0.06 | 0.161 |
| pancreas | 0.51 | 0.07 | 0.44 | 0.12 | 0.38 | 0.12 | 0.47 | 0.19 | 0.256 |
| adrenal gland | 0.80 | 0.33 | 0.94 | 0.31 | 0.51 | 0.16 | 0.61 | 0.18 | 0.242 |
| stomach | 0.16 | 0.02 | 0.13 | 0.03 | 0.20 | 0.03 | 0.27 | 0.10 | 0.215 |
| lung | 0.89 | 0.12 | 0.59 | 0.05 | 0.52 | 0.02 | 0.76 | 0.14 | 0.020 |
| heart | 0.74 | 0.05 | 0.53 | 0.10 | 0.58 | 0.02 | 0.76 | 0.10 | 0.016 |
| femur | 0.17 | 0.03 | 0.12 | 0.02 | 0.15 | 0.02 | 0.21 | 0.02 | 0.004 |
| small intestine | 0.56 | 0.11 | 0.66 | 0.06 | 1.11 | 0.13 | 1.29 | 0.34 | 0.225 |
| caecum | 0.18 | 0.03 | 0.15 | 0.02 | 0.19 | 0.05 | 0.27 | 0.06 | 0.054 |
| large intestine | 0.24 | 0.02 | 0.19 | 0.03 | 0.26 | 0.02 | 0.25 | 0.03 | 0.055 |
| Tissue | Vehicle | α-CCA-Na | Reference Compound | |||
|---|---|---|---|---|---|---|
| AUC0–60 min (SUV min) | CI95% | AUC0–60 min (SUV min) | CI95% | AUC0–60 min (SUV min) | CI95% | |
| whole blood | 59 | 54–64 | 63 | 57–69 | 125 | 113–136 |
| kidney cortex | 290 | 265–315 | 153 | 132–174 | 62 | 60–64 |
| liver | 450 | 417–483 | 417 | 379–456 | 250 | 227–273 |
| gall bladder | 481 | 360–602 | 486 | 349–624 | 1388 | 1156–1620 |
| small intestine | 99 | 67–131 | 180 | 105–255 | 405 | 316–494 |
| Tissue | Vehicle | α-CCA-Na | ||
|---|---|---|---|---|
| AUC0–60 min (SUV min) | CI95% | AUC0–60 min (SUV min) | CI95% | |
| plasma | 36 | 33–38 | 40 | 35–44 |
| kidney cortex | 529 | 489–569 | 178 | 168–188 |
| kidney medulla | 2414 | 2022–2807 | 1264 | 956–1571 |
| liver | 317 | 293–340 | 286 | 273–299 |
| gall bladder | 1693 | 1168–2219 | 4453 | 3392–5513 |
| vertebrae | 88 | 74–102 | 100 | 105–144 |
| Tissue | Pre- Treatment | K1 (mL/g/min) | p-Value | k2 (1/min) | p-Value | VT (mL/g) | p-Value | BPND | AIC |
|---|---|---|---|---|---|---|---|---|---|
| kidney cortex | control | 0.13 ± 0.06 | 0.02 ± 0.01 | 8.60 ± 4.55 | 1.29 | –8.3 to 109.9 | |||
| α-CCA-Na | 0.12 ± 0.06 | 0.321 | 0.04 ± 0.01 | 0.013 | 3.84 ± 2.59 | 0.038 | |||
| reference compound | 0.09 ± 0.04 | 0.120 | 0.66 ± 0.22 | <0.001 | 0.14 ± 0.03 | 0.005 | |||
| liver | control | 0.49 ± 0.24 | 0.08 ± 0.02 | 6.47 ± 2.49 | 0.04 | 11.1 to 88.3 | |||
| α-CCA-Na | 0.53 ± 0.19 | 0.390 | 0.09 ± 0.01 | 0.172 | 6.21 ± 2.61 | 0.431 | |||
| reference compound | 0.49 ± 0.07 | 0.497 | 0.58 ± 0.16 | <0.001 | 0.91 ± 0.38 | 0.002 |
| Tissue | Pre- treatment | K1 (mL/g/min) | p-Value | k2 (1/min) | p-Value | VT (mL/g) | p-Value | BPND | AIC |
|---|---|---|---|---|---|---|---|---|---|
| kidney cortex | control | 0.69 ± 0.11 | 0.06 ± 0.01 | 11.29 ± 1.47 | 5.2 | 9.5 to 155.7 | |||
| α-CCA-Na | 0.29 ± 0.06 | <0.001 | 0.17 ± 0.04 | <0.001 | 1.82 ± 0.75 | <0.001 | |||
| liver | control | 0.64 ± 0.10 | 0.13 ± 0.05 | 5.12 ± 1.27 | 0.18 | 11.0 to 94.9 | |||
| α-CCA-Na | 0.57 ± 0.14 | 0.283 | 0.17 ± 0.11 | 0.399 | 4.34 ± 2.30 | 0.323 |
Publisher’s Note: MDPI stays neutral with regard to jurisdictional claims in published maps and institutional affiliations. |
© 2021 by the authors. Licensee MDPI, Basel, Switzerland. This article is an open access article distributed under the terms and conditions of the Creative Commons Attribution (CC BY) license (http://creativecommons.org/licenses/by/4.0/).
Share and Cite
Gündel, D.; Sadeghzadeh, M.; Deuther-Conrad, W.; Wenzel, B.; Cumming, P.; Toussaint, M.; Ludwig, F.-A.; Moldovan, R.-P.; Kranz, M.; Teodoro, R.; et al. Preclinical Evaluation of [18F]FACH in Healthy Mice and Piglets: An 18F-Labeled Ligand for Imaging of Monocarboxylate Transporters with PET. Int. J. Mol. Sci. 2021, 22, 1645. https://doi.org/10.3390/ijms22041645
Gündel D, Sadeghzadeh M, Deuther-Conrad W, Wenzel B, Cumming P, Toussaint M, Ludwig F-A, Moldovan R-P, Kranz M, Teodoro R, et al. Preclinical Evaluation of [18F]FACH in Healthy Mice and Piglets: An 18F-Labeled Ligand for Imaging of Monocarboxylate Transporters with PET. International Journal of Molecular Sciences. 2021; 22(4):1645. https://doi.org/10.3390/ijms22041645
Chicago/Turabian StyleGündel, Daniel, Masoud Sadeghzadeh, Winnie Deuther-Conrad, Barbara Wenzel, Paul Cumming, Magali Toussaint, Friedrich-Alexander Ludwig, Rareş-Petru Moldovan, Mathias Kranz, Rodrigo Teodoro, and et al. 2021. "Preclinical Evaluation of [18F]FACH in Healthy Mice and Piglets: An 18F-Labeled Ligand for Imaging of Monocarboxylate Transporters with PET" International Journal of Molecular Sciences 22, no. 4: 1645. https://doi.org/10.3390/ijms22041645