Establishment of a p53 Null Murine Oral Carcinoma Cell Line and the Identification of Genetic Alterations Associated with This Carcinoma

 , , and
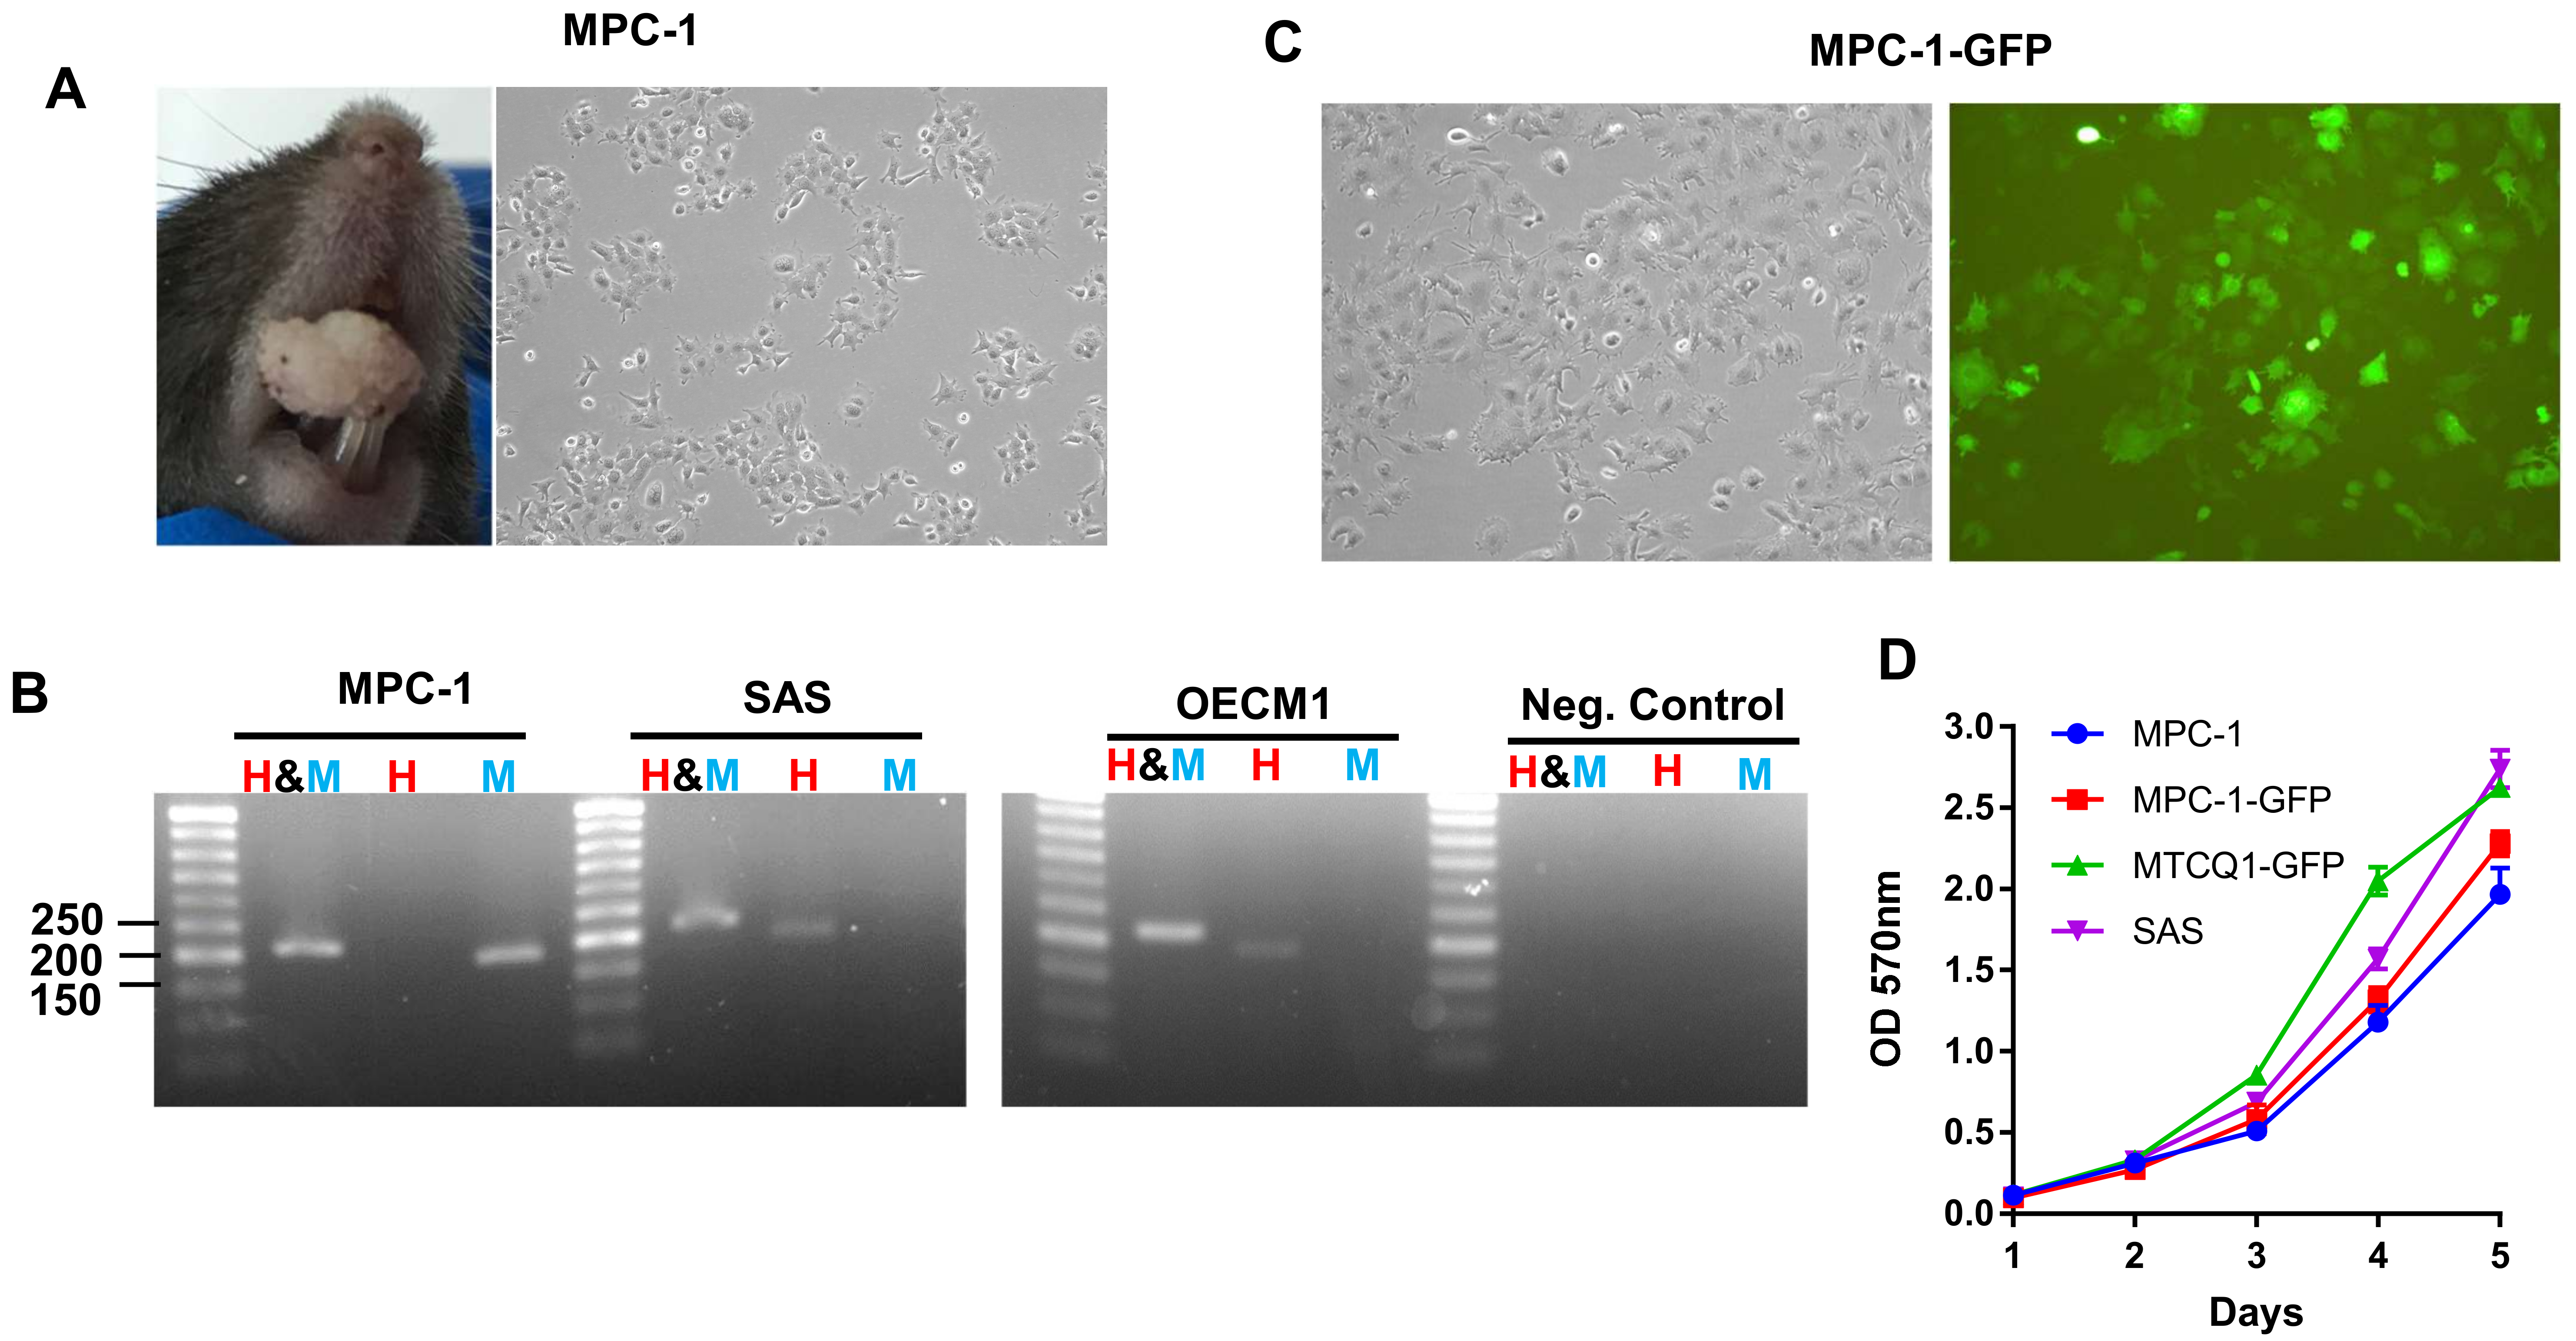
Abstract
:1. Introduction
2. Results
2.1. The Establishment of p53 Null MPC-1 the Cell Lines
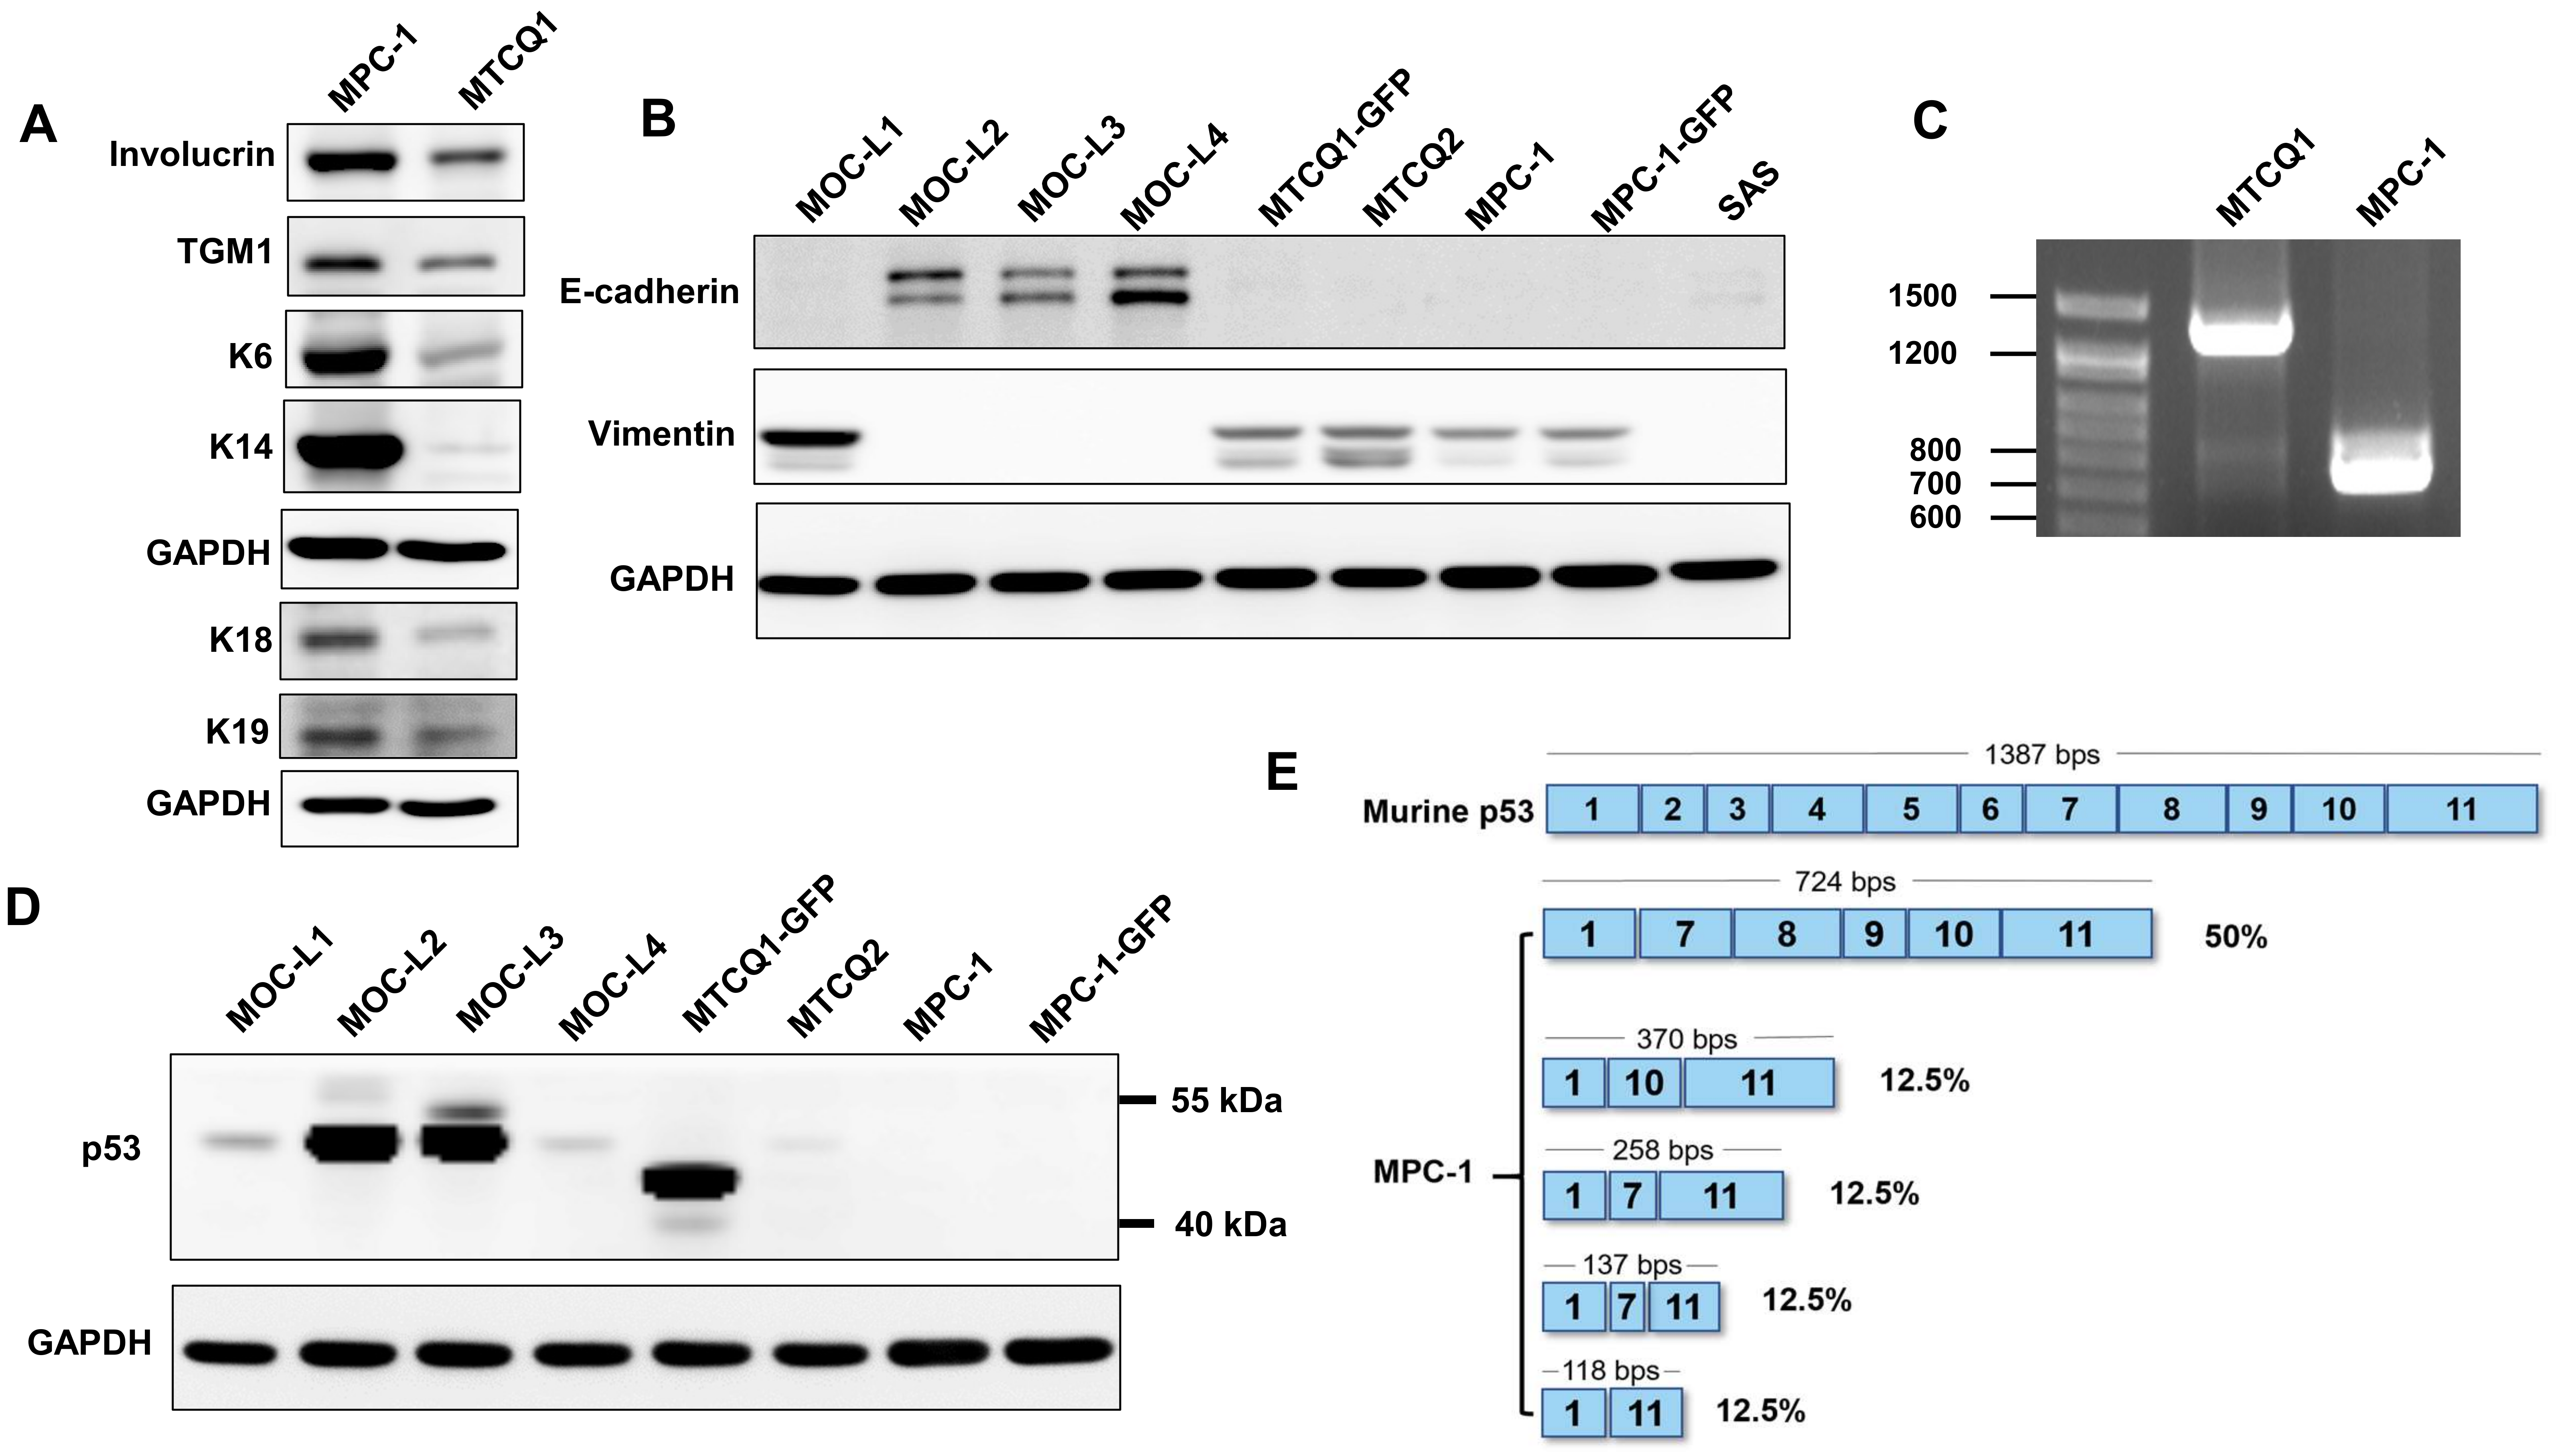
2.2. MPC-1 Cell Lacks p53 Protein Expression
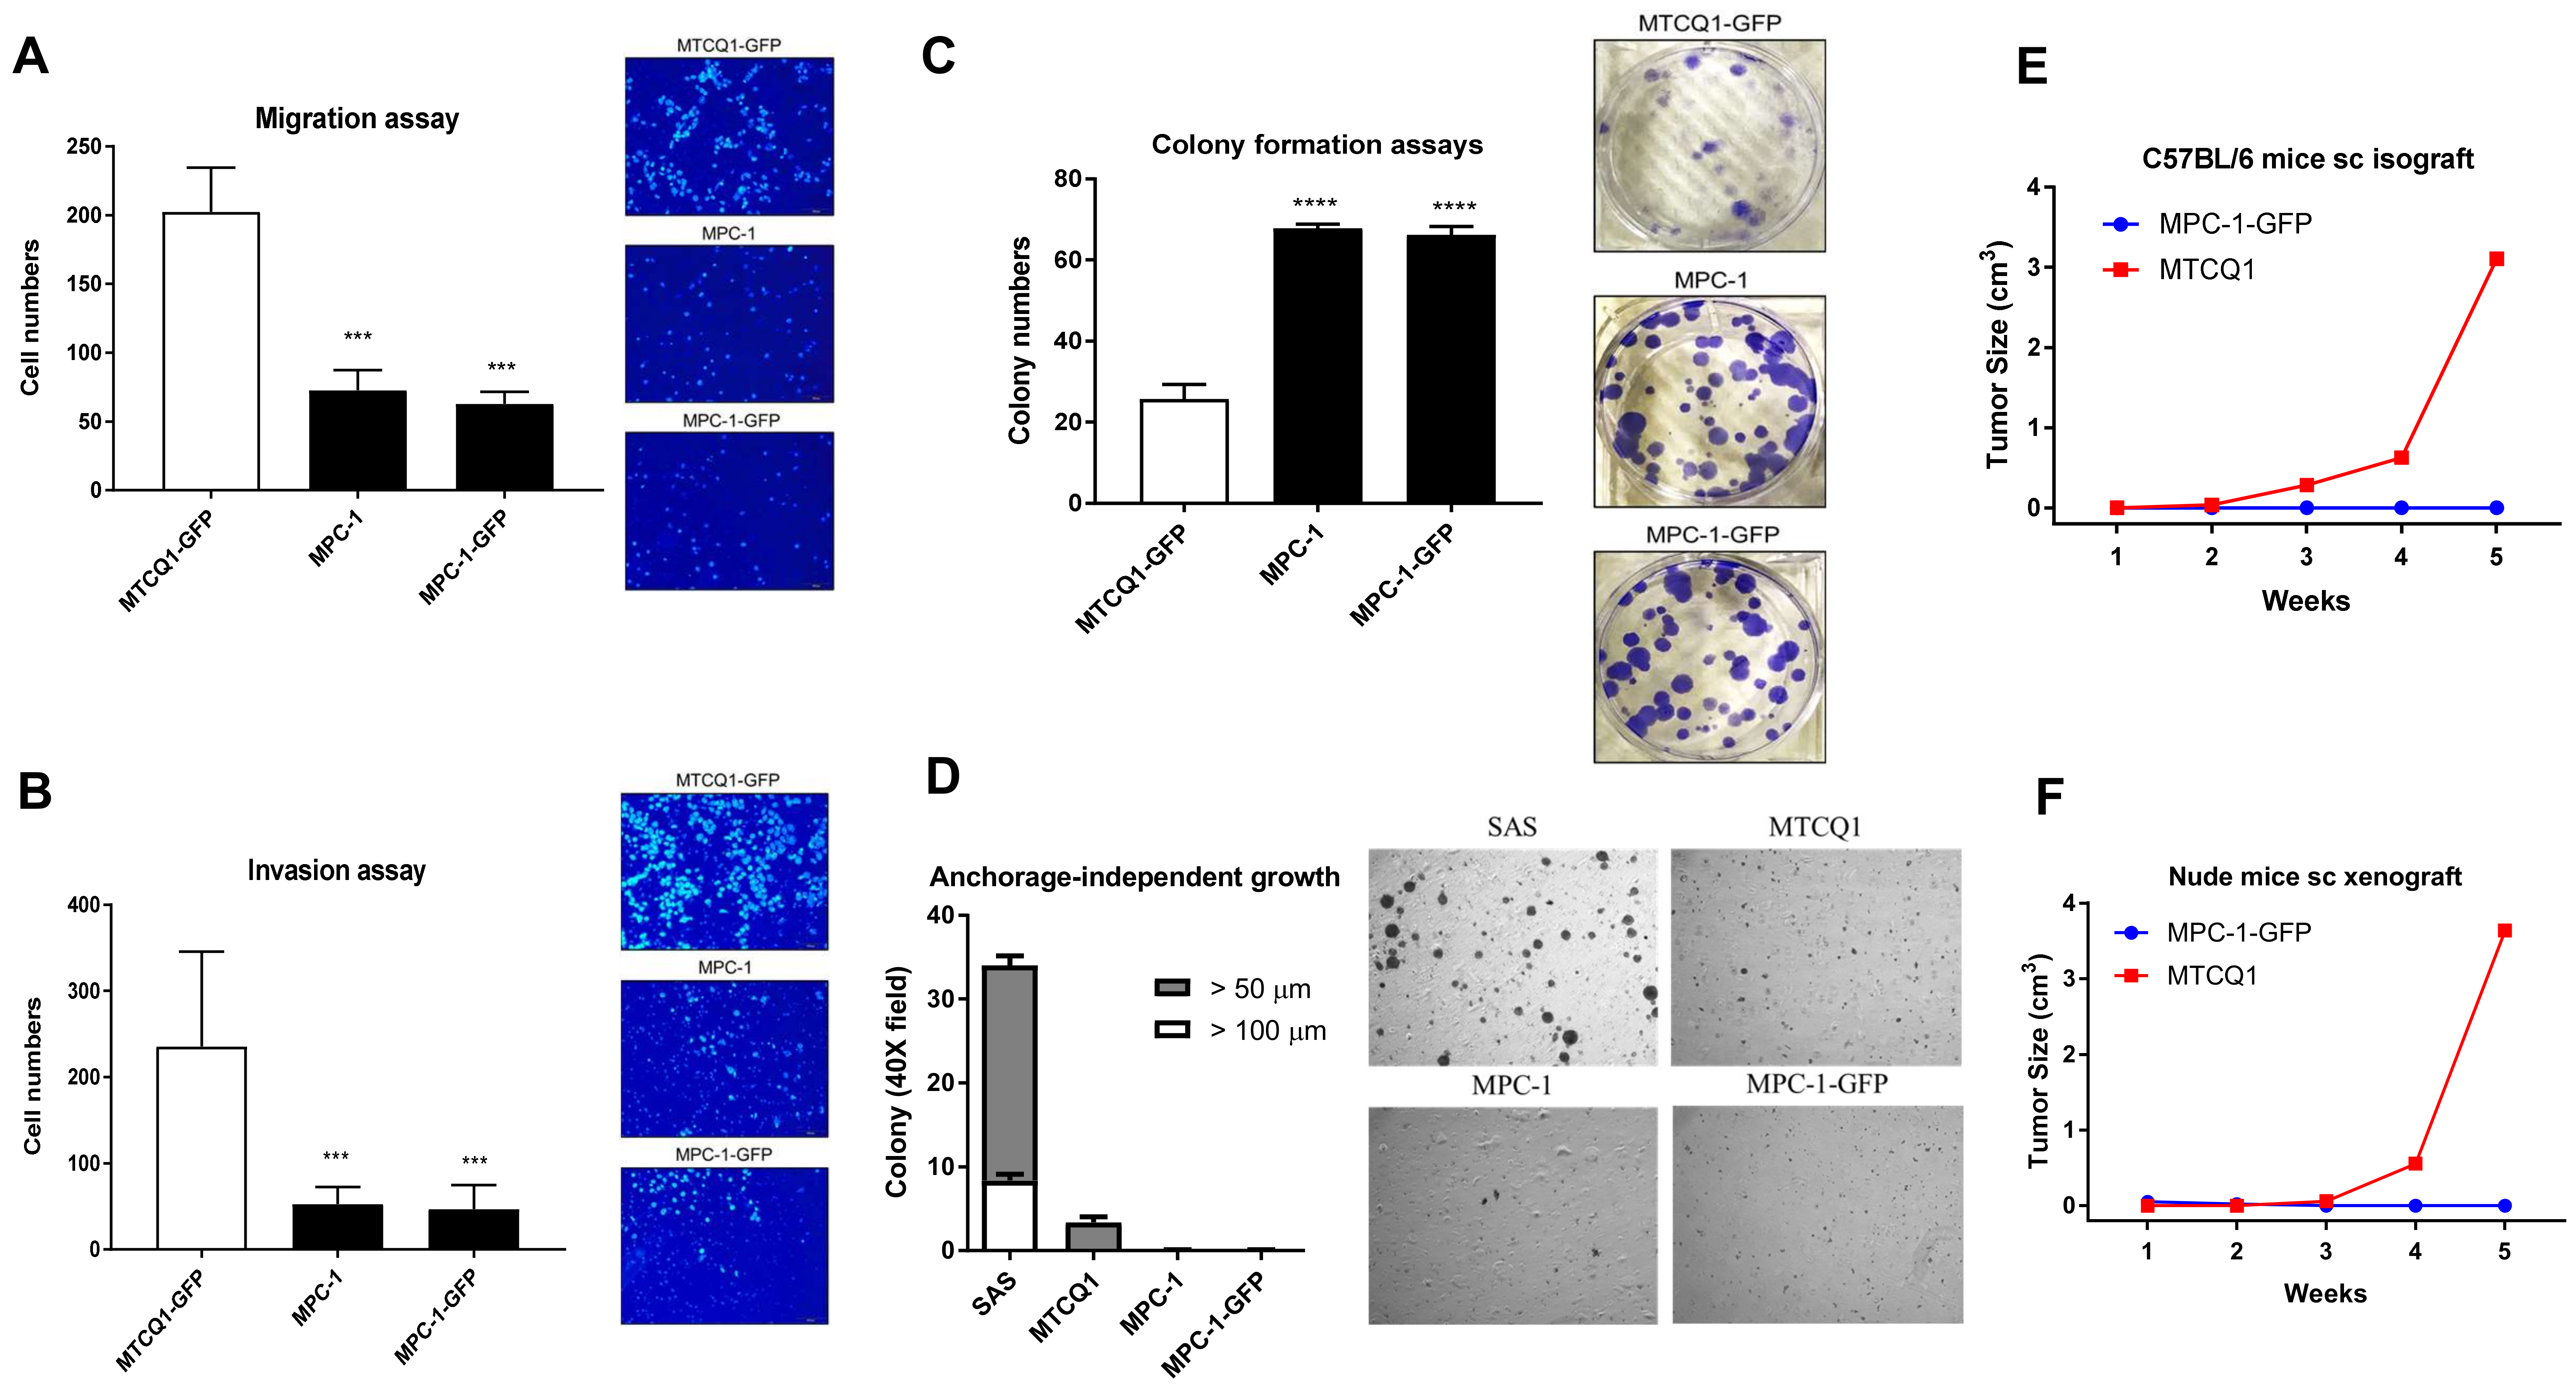
2.3. Phenotypic Analysis of MPC-1
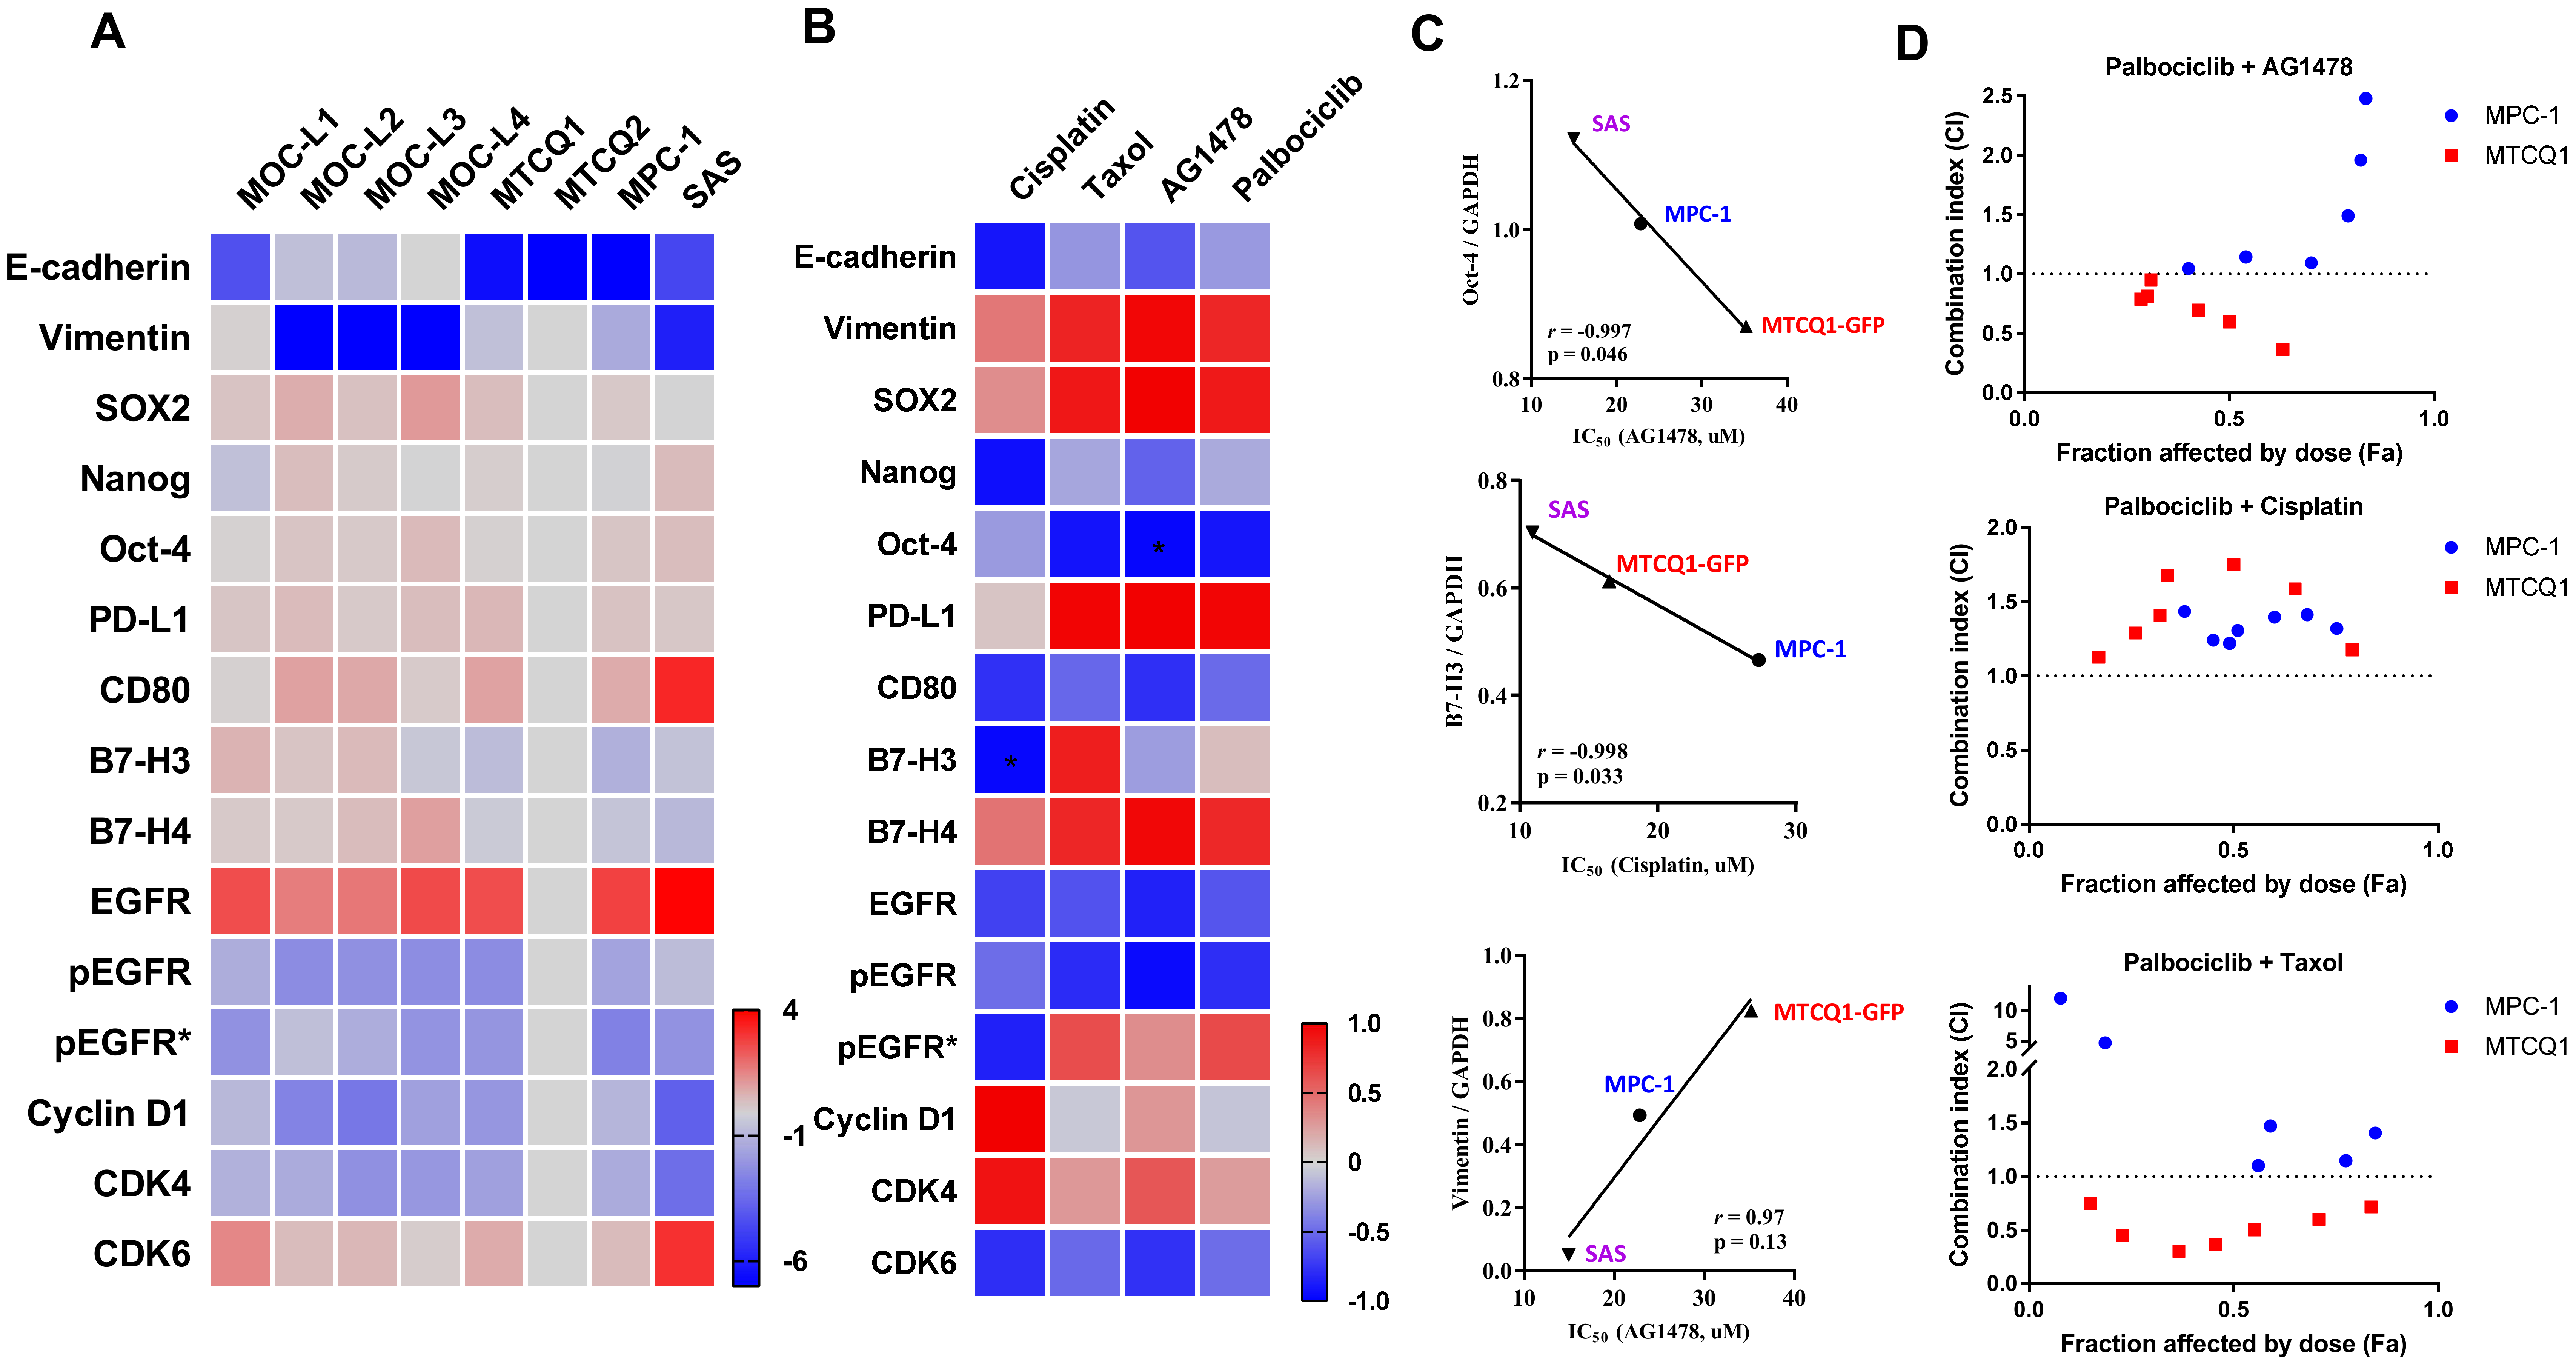
2.4. Expression of Stemness Markers, Immune Modulators, and Cell Cycle Regulators in Murine OSCC Cells
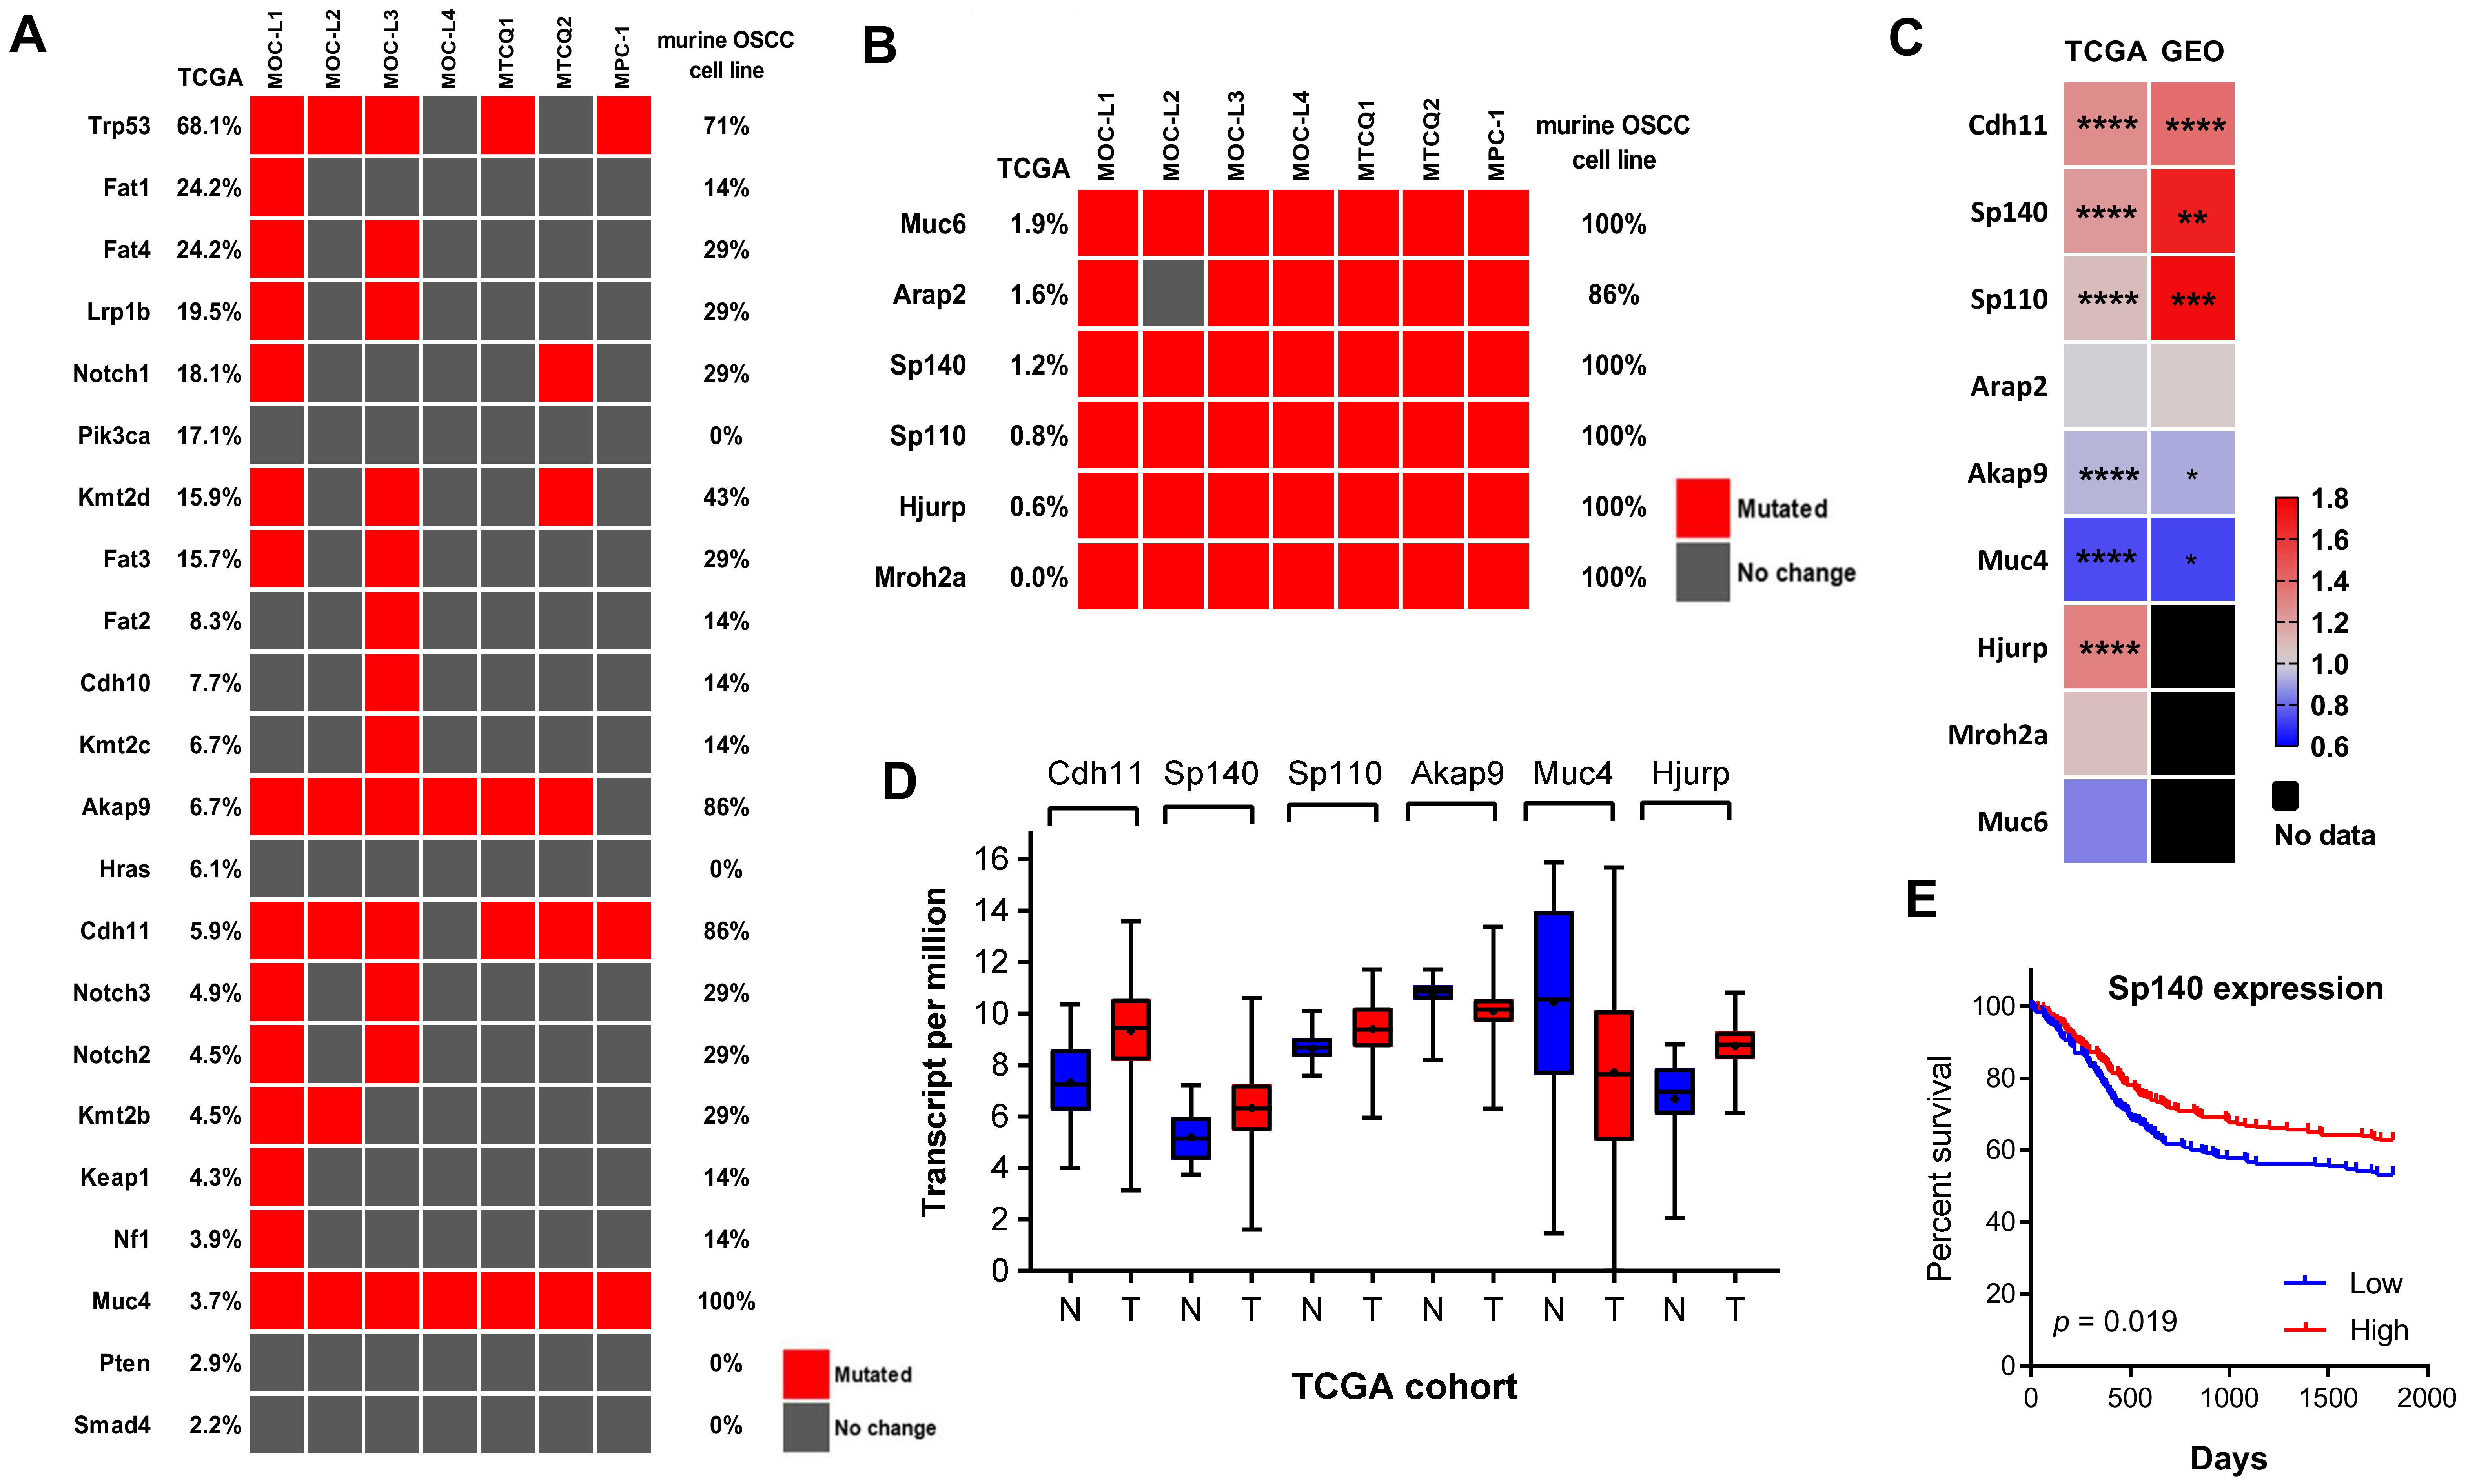
2.5. The Gene Mutations Present in Murine OSCC Cells
3. Discussion
4. Materials and Methods
4.1. Cell Culture
4.2. Reagents
4.3. PCR Analysis
4.4. Western Blot Analysis
4.5. Assays for Cell Viability and the Effects of Drugs
4.6. Assays for Migration, Invasion, Colony Formation, and Anchorage-Independent Growth
4.7. Tumor Cell Transplantation
4.8. Whole Exome Sequencing
4.9. Statistical Analyses
Supplementary Materials
Author Contributions
Funding
Conflicts of Interest
Abbreviations
| CI | Combination Index |
| GFP | Green fluorescence protein |
| HNSCC | Head and neck squamous cell carcinoma |
| MPC-1 | Mouse palatal carcinoma -1 |
| OSCC | Oral squamous cell carcinoma |
| 4NQO | 4-nitroquinoline 1-oxide |
References
- India Project Team of the International Cancer Genome Consortium; Maitra, A.; Biswas, N.K.; Amin, K.; Kowtal, P.; Kumar, S.; Das, S.; Sarin, R.; Majumder, P.P.; Bagchi, I.; et al. Mutational landscape of gingivo-buccal oral squamous cell carcinoma reveals new recurrently-mutated genes and molecular subgroups. Nat. Commun. 2013, 4, 2873. [Google Scholar] [CrossRef] [PubMed]
- Wang, Z.; Wu, V.H.; Allevato, M.M.; Gilardi, M.; He, Y.; Callejas-Valera, J.L.; Vitale-Cross, L.; Martin, D.; Amornphimoltham, P.; McDermott, J. Syngeneic animal models of tobacco-associated oral cancer reveal the activity of in situ anti-CTLA-4. Nat. Commun. 2019, 10, 1–13. [Google Scholar] [CrossRef] [PubMed] [Green Version]
- Song, J.M.; Woo, B.H.; Lee, J.H.; Yoon, S.; Cho, Y.; Kim, Y.D.; Park, H.R. Oral administration of porphyromonas gingivalis, a major pathogen of chronic periodontitis, promotes resistance to paclitaxel in mouse xenografts of oral squamous cell carcinoma. Int. J. Mol. Sci. 2019, 20, 2494. [Google Scholar] [CrossRef] [PubMed] [Green Version]
- Hirai, K.; Sasahira, T.; Ohmori, H.; Fujii, K.; Kuniyasu, H. Inhibition of heme oxygenase-1 by zinc protoporphyrin IX reduces tumor growth of LL/2 lung cancer in C57BL mice. Int. J. Cancer 2007, 120, 500–505. [Google Scholar] [CrossRef] [PubMed]
- Li, Q.; Dong, H.; Yang, G.; Song, Y.; Mou, Y.; Ni, Y. Mouse tumor-bearing models as preclinical study platforms for oral squamous cell carcinoma. Front. Oncol. 2020, 10, 212. [Google Scholar] [CrossRef]
- Méry, B.; Rancoule, C.; Guy, J.-B.; Espenel, S.; Wozny, A.-S.; Battiston-Montagne, P.; Ardail, D.; Beuve, M.; Alphonse, G.; Rodriguez-Lafrasse, C. Preclinical models in HNSCC: A comprehensive review. Oral Oncol. 2017, 65, 51–56. [Google Scholar] [CrossRef]
- Chen, Y.F.; Chang, K.W.; Yang, I.T.; Tu, H.F.; Lin, S.C. Establishment of syngeneic murine model for oral cancer therapy. Oral Oncol. 2019, 95, 194–201. [Google Scholar] [CrossRef]
- Chen, Y.F.; Liu, C.J.; Lin, L.H.; Chou, C.H.; Yeh, L.Y.; Lin, S.C.; Chang, K.W. Establishing of mouse oral carcinoma cell lines derived from transgenic mice and their use as syngeneic tumorigenesis models. BMC Cancer 2019, 19, 281. [Google Scholar] [CrossRef]
- Chen, Y.L.; Liu, K.J.; Jang, C.W.; Hsu, C.C.; Yen, Y.C.; Liu, Y.L.; Chuang, T.H.; Wang, S.H.; Fu, Y.K.; Kuo, C.C.; et al. ERK activation modulates cancer stemness and motility of a novel mouse oral squamous cell carcinoma cell line. Cancers 2019, 12, 61. [Google Scholar] [CrossRef] [Green Version]
- Kao, Y.Y.; Tu, H.F.; Kao, S.Y.; Chang, K.W.; Lin, S.C. The increase of oncogenic miRNA expression in tongue carcinogenesis of a mouse model. Oral Oncol. 2015, 51, 1103–1112. [Google Scholar] [CrossRef]
- Qin, X.; Yan, M.; Li, R.; Ye, D.; Zhang, J.; Xu, Q.; Feng, Y.; Sun, Q.; Jiang, C.; Chen, W. Identification and characterization of a highly metastatic epithelial cancer cell line from rat tongue cancer. Arch. Oral Biol. 2018, 95, 58–67. [Google Scholar] [CrossRef] [PubMed]
- Chen, Y.F.; Yang, C.C.; Kao, S.Y.; Liu, C.J.; Lin, S.C.; Chang, K.W. MicroRNA-211 enhances the oncogenicity of carcinogen-induced oral carcinoma by repressing TCF12 and increasing antioxidant activity. Cancer Res. 2016, 76, 4872–4886. [Google Scholar] [CrossRef] [PubMed] [Green Version]
- Attardi, L.D.; Jacks, T. The role of p53 in tumour suppression: Lessons from mouse models. Cell. Mol. Life Sci. 1999, 55, 48–63. [Google Scholar] [CrossRef] [PubMed]
- Chuang, H.C.; Yang, L.P.; Fitzgerald, A.L.; Osman, A.; Woo, S.H.; Myers, J.N.; Skinner, H.D. The p53-reactivating small molecule RITA induces senescence in head and neck cancer cells. PLoS ONE 2014, 9, e104821. [Google Scholar] [CrossRef] [PubMed] [Green Version]
- Deng, X.; Li, Y.; Gu, S.; Chen, Y.; Yu, B.; Su, J.; Sun, L.; Liu, Y. p53 affects PGC1alpha stability through AKT/GSK-3beta to enhance cisplatin sensitivity in non-small cell lung cancer. Front. Oncol. 2020, 10, 1252. [Google Scholar] [CrossRef] [PubMed]
- Kong, Y.W.; Dreaden, E.C.; Morandell, S.; Zhou, W.; Dhara, S.S.; Sriram, G.; Lam, F.C.; Patterson, J.C.; Quadir, M.; Dinh, A.; et al. Enhancing chemotherapy response through augmented synthetic lethality by co-targeting nucleotide excision repair and cell-cycle checkpoints. Nat. Commun. 2020, 11, 1–12. [Google Scholar] [CrossRef]
- Sharma, K.; Vu, T.T.; Cook, W.; Naseri, M.; Zhan, K.; Nakajima, W.; Harada, H. p53-independent Noxa induction by cisplatin is regulated by ATF3/ATF4 in head and neck squamous cell carcinoma cells. Mol. Oncol. 2018, 12, 788–798. [Google Scholar] [CrossRef]
- Loganathan, S.K.; Schleicher, K.; Malik, A.; Quevedo, R.; Langille, E.; Teng, K.; Oh, R.H.; Rathod, B.; Tsai, R.; Samavarchi-Tehrani, P.; et al. Rare driver mutations in head and neck squamous cell carcinomas converge on NOTCH signaling. Science 2020, 367, 1264–1269. [Google Scholar] [CrossRef]
- Shahoumi, L.A.; Yeudall, W.A. Targeted therapies for non-HPV-related head and neck cancer: Challenges and opportunities in the context of predictive, preventive, and personalized medicine. EPMA J. 2019, 10, 291–305. [Google Scholar] [CrossRef]
- Lin, L.H.; Chang, K.W.; Cheng, H.W.; Liu, C.J. SMAD4 somatic mutations in head and neck carcinoma are associated with tumor progression. Front. Oncol. 2019, 9, 1379. [Google Scholar] [CrossRef] [Green Version]
- Lin, S.C.; Lin, L.H.; Yu, S.Y.; Kao, S.Y.; Chang, K.W.; Cheng, H.W.; Liu, C.J. FAT1 somatic mutations in head and neck carcinoma are associated with tumor progression and survival. Carcinogenesis 2018, 39, 1320–1330. [Google Scholar] [CrossRef]
- Jo, Y.S.; Kim, M.S.; Yoo, N.J.; Lee, S.H. Frameshift mutations of AKAP9 gene in gastric and colorectal cancers with high microsatellite instability. Pathol. Oncol. Res. 2016, 22, 587–592. [Google Scholar] [CrossRef]
- Piao, S.; Inglehart, R.C.; Scanlon, C.S.; Russo, N.; Banerjee, R.; D’Silva, N.J. CDH11 inhibits proliferation and invasion in head and neck cancer. J. Oral Pathol. Med. 2017, 46, 89–97. [Google Scholar] [CrossRef] [PubMed]
- Macha, M.A.; Rachagani, S.; Pai, P.; Gupta, S.; Lydiatt, W.M.; Smith, R.B.; Johansson, S.L.; Lele, S.M.; Kakar, S.S.; Farghaly, H.; et al. MUC4 regulates cellular senescence in head and neck squamous cell carcinoma through p16/Rb pathway. Oncogene 2015, 34, 1698–1708. [Google Scholar] [CrossRef] [Green Version]
- Mehta, S.; Cronkite, D.A.; Basavappa, M.; Saunders, T.L.; Adiliaghdam, F.; Amatullah, H.; Morrison, S.A.; Pagan, J.D.; Anthony, R.M.; Tonnerre, P.; et al. Maintenance of macrophage transcriptional programs and intestinal homeostasis by epigenetic reader SP140. Sci. Immunol. 2017, 2, aag3160. [Google Scholar] [CrossRef] [PubMed] [Green Version]
- Song, Y.; Pan, Y.; Liu, J. The relevance between the immune response-related gene module and clinical traits in head and neck squamous cell carcinoma. Cancer Manag. Res. 2019, 11, 7455–7472. [Google Scholar] [CrossRef] [PubMed] [Green Version]
- Adkins, D.; Ley, J.; Neupane, P.; Worden, F.; Sacco, A.G.; Palka, K.; Grilley-Olson, J.E.; Maggiore, R.; Salama, N.N.; Trinkaus, K.; et al. Palbociclib and cetuximab in platinum-resistant and in cetuximab-resistant human papillomavirus-unrelated head and neck cancer: A multicentre, multigroup, phase 2 trial. Lancet Oncol. 2019, 20, 1295–1305. [Google Scholar] [CrossRef]
- Chou, T.C. Drug combination studies and their synergy quantification using the Chou-Talalay method. Cancer Res. 2010, 70, 440–446. [Google Scholar] [CrossRef] [Green Version]


Publisher’s Note: MDPI stays neutral with regard to jurisdictional claims in published maps and institutional affiliations. |
© 2020 by the authors. Licensee MDPI, Basel, Switzerland. This article is an open access article distributed under the terms and conditions of the Creative Commons Attribution (CC BY) license (http://creativecommons.org/licenses/by/4.0/).
Share and Cite
Chang, K.-W.; Lin, C.-E.; Tu, H.-F.; Chung, H.-Y.; Chen, Y.-F.; Lin, S.-C. Establishment of a p53 Null Murine Oral Carcinoma Cell Line and the Identification of Genetic Alterations Associated with This Carcinoma. Int. J. Mol. Sci. 2020, 21, 9354. https://doi.org/10.3390/ijms21249354
Chang K-W, Lin C-E, Tu H-F, Chung H-Y, Chen Y-F, Lin S-C. Establishment of a p53 Null Murine Oral Carcinoma Cell Line and the Identification of Genetic Alterations Associated with This Carcinoma. International Journal of Molecular Sciences. 2020; 21(24):9354. https://doi.org/10.3390/ijms21249354
Chicago/Turabian StyleChang, Kuo-Wei, Chia-En Lin, Hsi-Feng Tu, Hsin-Yao Chung, Yi-Fen Chen, and Shu-Chun Lin. 2020. "Establishment of a p53 Null Murine Oral Carcinoma Cell Line and the Identification of Genetic Alterations Associated with This Carcinoma" International Journal of Molecular Sciences 21, no. 24: 9354. https://doi.org/10.3390/ijms21249354