Article

Identification of Anthocyanins-Related Glutathione S-Transferase (GST) Genes in the Genome of Cultivated Strawberry (Fragaria × ananassa)

1
College of Horticulture, Sichuan Agricultural University, Chengdu 611130, China
2
Institute of Pomology and Olericulture, Sichuan Agricultural University, Chengdu 611130, China
*
Author to whom correspondence should be addressed.
These authors contributed equally to this work.
Current address: College of Horticulture, Sichuan Agricultural University, No. 211, Huimin Rd, Wenjiang, Chengdu 611130, China.
Int. J. Mol. Sci. 2020, 21(22), 8708; https://doi.org/10.3390/ijms21228708
Submission received: 19 September 2020 / Revised: 28 October 2020 / Accepted: 12 November 2020 / Published: 18 November 2020
(This article belongs to the Section Molecular Genetics and Genomics)

Abstract

:
Anthocyanins are responsible for the red color of strawberry, they are a subclass of flavonoids synthesized in cytosol and transferred to vacuole to form the visible color. Previous studies in model and ornamental plants indicated members of the glutathione S-transferase (GST) gene family were involved in vacuolar accumulation of anthocyanins. In the present study, a total of 130 FaGST genes were identified in the genome of cultivated strawberry (Fragaria × ananassa), which were unevenly distributed across the 28 chromosomes from the four subgenomes. Evolutionary analysis revealed the expansion of FaGST family was under stable selection and mainly drove by WGD/segmental duplication event. Classification and phylogenetic analysis indicated that all the FaGST genes were clarified into seven subclasses, among which FaGST1, FaGST37, and FaGST97 belonging to Phi class were closely related to FvRAP, an anthocyanin-related GST of wildwood strawberry, and this clade was clustered with other known anthocyanin-related GSTs. RNAseq-based expression analysis at different developmental stages of strawberry revealed that the expression of FaGST1, FaGST37, FaGST39, FaGST73, and FaGST97 was gradually increased during the fruit ripening, consistent with the anthocyanins accumulation. These expression patterns of those five FaGST genes were also significantly correlated with those of other anthocyanin biosynthetic genes such as FaCHI, FaCHS, and FaANS, as well as anthocyanin regulatory gene FaMYB10. These results indicated FaGST1, FaGST37, FaGST39, FaGST73, and FaGST97 may function in vacuolar anthocyanin accumulation in cultivated strawberry.

1. Introduction

Strawberry (Fragaria × ananassa) has been cultivated worldwide as one of the major fruit crops, it is highly regarded in the fresh fruit market mainly because of its attractive color, good flavor, and enrichment of nutrients. Particularly, the enriched anthocyanins, a class of water-soluble pigments, are not only responsible for the strawberry fruit coloration [1], but also one of the most important antioxidants and thereby contributing to the healthful attributes in strawberries [2,3].
Anthocyanins belonging to the flavonoid class of compounds are synthesized along with flavanols from phenylalanine and malonyl-CoA [4], proceeding in the cytosol. It has been suggested that any step of the enzymatic biosynthetic catabolites being upregulated or blocked could result in different colored plants. For instance, overexpression of MaF3′H from apple in Arabidopsis and tobacco resulted in red seedlings and flowers, respectively [5], while silencing of FaDFR [6] or FaF3H [7] in strawberry has resulted in complete loss of red color in fruits. Besides these enzymatic biosynthesis reactions, the transcriptional regulators of anthocyanin accumulation also have been well studied, especially the ‘MBW’ complex consisting of MYB, basic helix-loop-helix (bHLH), and WD40-repeat proteins (WD) [8,9]. A large number of studies have been conducted to identify the members of ‘MBW’ complex and reveal the molecular mechanism of anthocyanins accumulation regulation in plants [10,11,12]. However, to exhibit the visual color, anthocyanins must be transferred and stored into the vacuole with an acidic environment after synthesis [13]. Several types of proteins have been demonstrated as anthocyanins transporters in plants, such as multidrug resistance-associated protein (MRP) [14], multidrug and toxic extrusion (MATE) family [15,16,17], ATP-binding cassette (ABC) proteins [18], and probably the allergen Fra a 1 [19]. In recent years, evidence has shown that glutathione S-reductases (GSTs) are involved in anthocyanins transportation.
GSTs (EC 2.5.1.18) are encoded by a large gene family in plants, it comprises multifunction including detoxification of xenobiotics and stress responses [20,21]. According to the sequence identities, immunological characterizations, kinetic properties, and genomic structural organization, plant GSTs are classified into 10 subclasses including Phi, Tau, Lambda, Dehydroascorbate Reductase (DHAR), Tetrachloro hydroquinone (TCHQD), Elongation Factore-1 Gamma (EF1G), Zeta, Theta, Hemerythrin, and Iota [22]. Among which, the Phi class is plant-specific and recently suggested to be involved in anthocyanin transportation [23]. Subsequently, by using gene knockout and mutagenesis methods, GSTs have been demonstrated as the probable most important transporters of anthocyanins. For example, knockout of a single GST (Bronze-2, Bz2) gene in maize not only caused a large decrease of anthocyanins, but also loss the visible color of maize due to the loss of anthocyanins transport [14]. Similarly, several studies have suggested that the loss of GSTs function could result in the loss of visible pigment accumulation in plants, such as PhAN9 in petunia [24], VvGST4 in grape [25], CkmGST4 in cyclamen [26], LcGST4 in litchi [27], MdGST in apple [28], Riant in peach [29], and AtTT19 in Arabidopsis [23]. The AtTT19 has been further shown to act as a carrier protein for transportation of anthocyanins from cytosol into vacuole [23]. More recently, Luo et al. [30] have suggested that reduced anthocyanins in petioles (rap) encoded a GST transporter for anthocyanin that is essential for the woodland strawberry foliage and fruit coloration. However, the genome-wide identification of GSTs is limited in strawberry, a useful plant material for anthocyanins research. In the present study, the entire GSTs in the cultivated strawberry were identified genome-wide and analyzed. We further identified the potential anthocyanins-related GSTs based on our phylogenetic analysis, expression analysis, and correlation analysis. Our results here will provide candidate GST transporter genes for anthocyanins and thus will help the research for improving and manipulating anthocyanins accumulation in strawberry and other Roceace species in the future.

2. Results

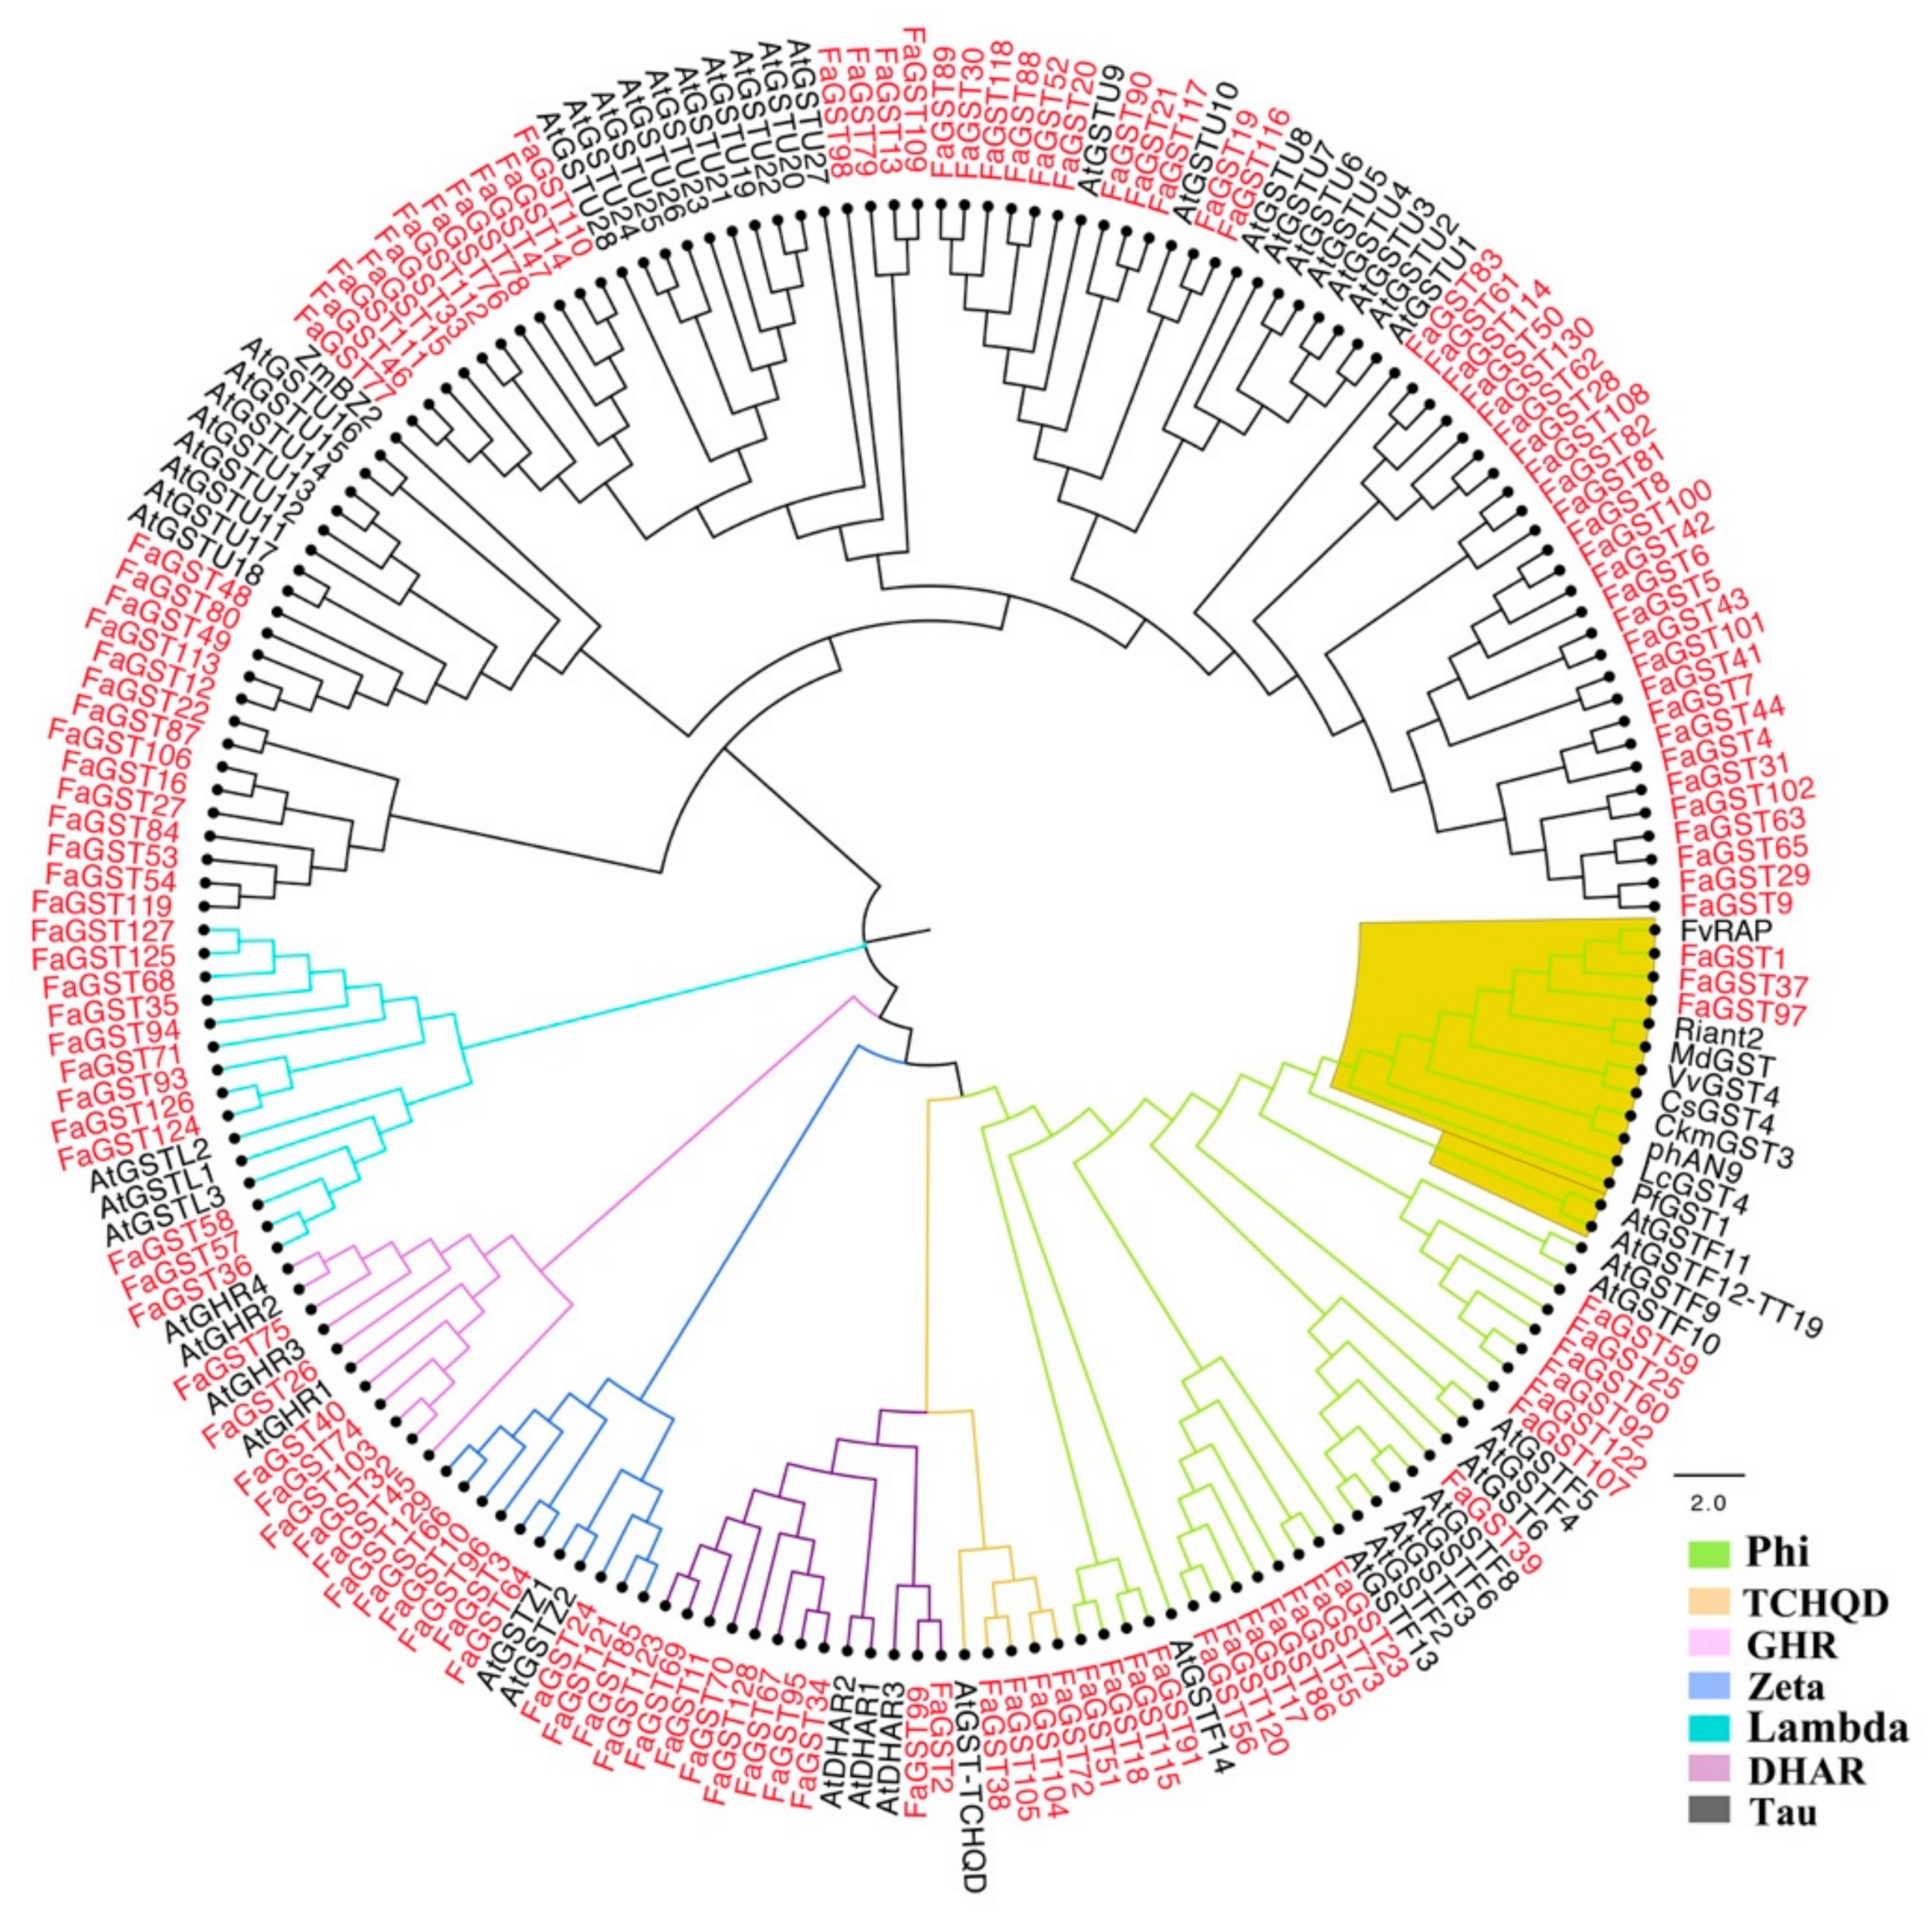
2.1. Identification, Characteristics, and Evolutionary Analysis of the Entire 130 FaGST Genes in Cultivated Strawberry

Based on the genome searching and domain confirmation, totally, 130 GST genes containing GST domains were identified as FaGST genes from the whole genome of cultivated strawberry. All the 130 FaGST genes were renamed based on the order of their chromosome location (supplementary Figure S1), the gene names and gene IDs are listed in supplementary Table S1. As the results showed (Figure S1), 130 FaGST genes were unevenly distributed across the 28 chromosomes from the four subgenomes of cultivated strawberry, ranging from 1 to 11 genes per chromosome. A maximum 11 GST genes were located on chromosome 7 from the second subgenome (Fvb7-2), followed by 10 genes on chromosome 7 from the first subgenome (Fvb7-1). While only one gene was located on chromosomes Fvb4-1, Fvb1-2, Fvb6-3, and Fvb6-4, no FaGST was located on chromosome Fvb1-3. The characteristics of the 130 FaGST proteins are also shown in Table S1. The lengths of the protein sequences varied from 111 to 1137 aa, and most of them were from 200 to 400 aa. The protein molecular weights (MW) were from 12.73 to 129.14 KDa, and the isoelectric points (pI) were concentrated from 4.33 to 9.99. There was only one FaGST gene (FaGST90) which had a signal peptide, which is essential for secreted proteins. Most of the FaGST genes were predicted to be located in the cytoplasm, also some FaGST genes were involved in mitochondria and nucleus.
To elucidate the origin of FaGST genes in cultivated strawberry, the origin of duplication events was detected by MCScanX package. The results (Table S1) showed that four types of duplication events drove the expansion of FaGST genes including WGD/segmental, dispersed, tandem, and proximal. There were four genes (FaGST6, FaGST7, FaGST36, and FaGST58) duplicated from proximal events, eight genes named FaGST73, FaGST68, FaGST80, FaGST97, FaGST94, FaGST104, FaGST101, and FaGST103 were involved in dispersed duplication. There were five couples of tandem duplication genes including FaGST20/FaGST21, FaGST48/FaGST49, FaGST79/FaGST80, FaGST89/FaGST90, and FaGST82/FaGST83.
The number of nonsynonymous substitutions per nonsynonymous sites (Ka), the number of synonymous substitutions per synonymous sites (Ks), and the Ka/Ks ratio for FaGST genes were calculated by Ka/Ks calculator (Table 1). The results showed, Ka ranged between 0.0017 to 0.919, Ks range was 0.01–0.989 for the identified paralogs (Table 1). Using the formula Ka/Ks, it was predicted that most FaGST paralogs might be under stabilizing selection, since the Ka/Ks was below 1. Except for the FaGST36/FaGST38, which had a Ka/Ks value above 1, indicating they were under positive selection.

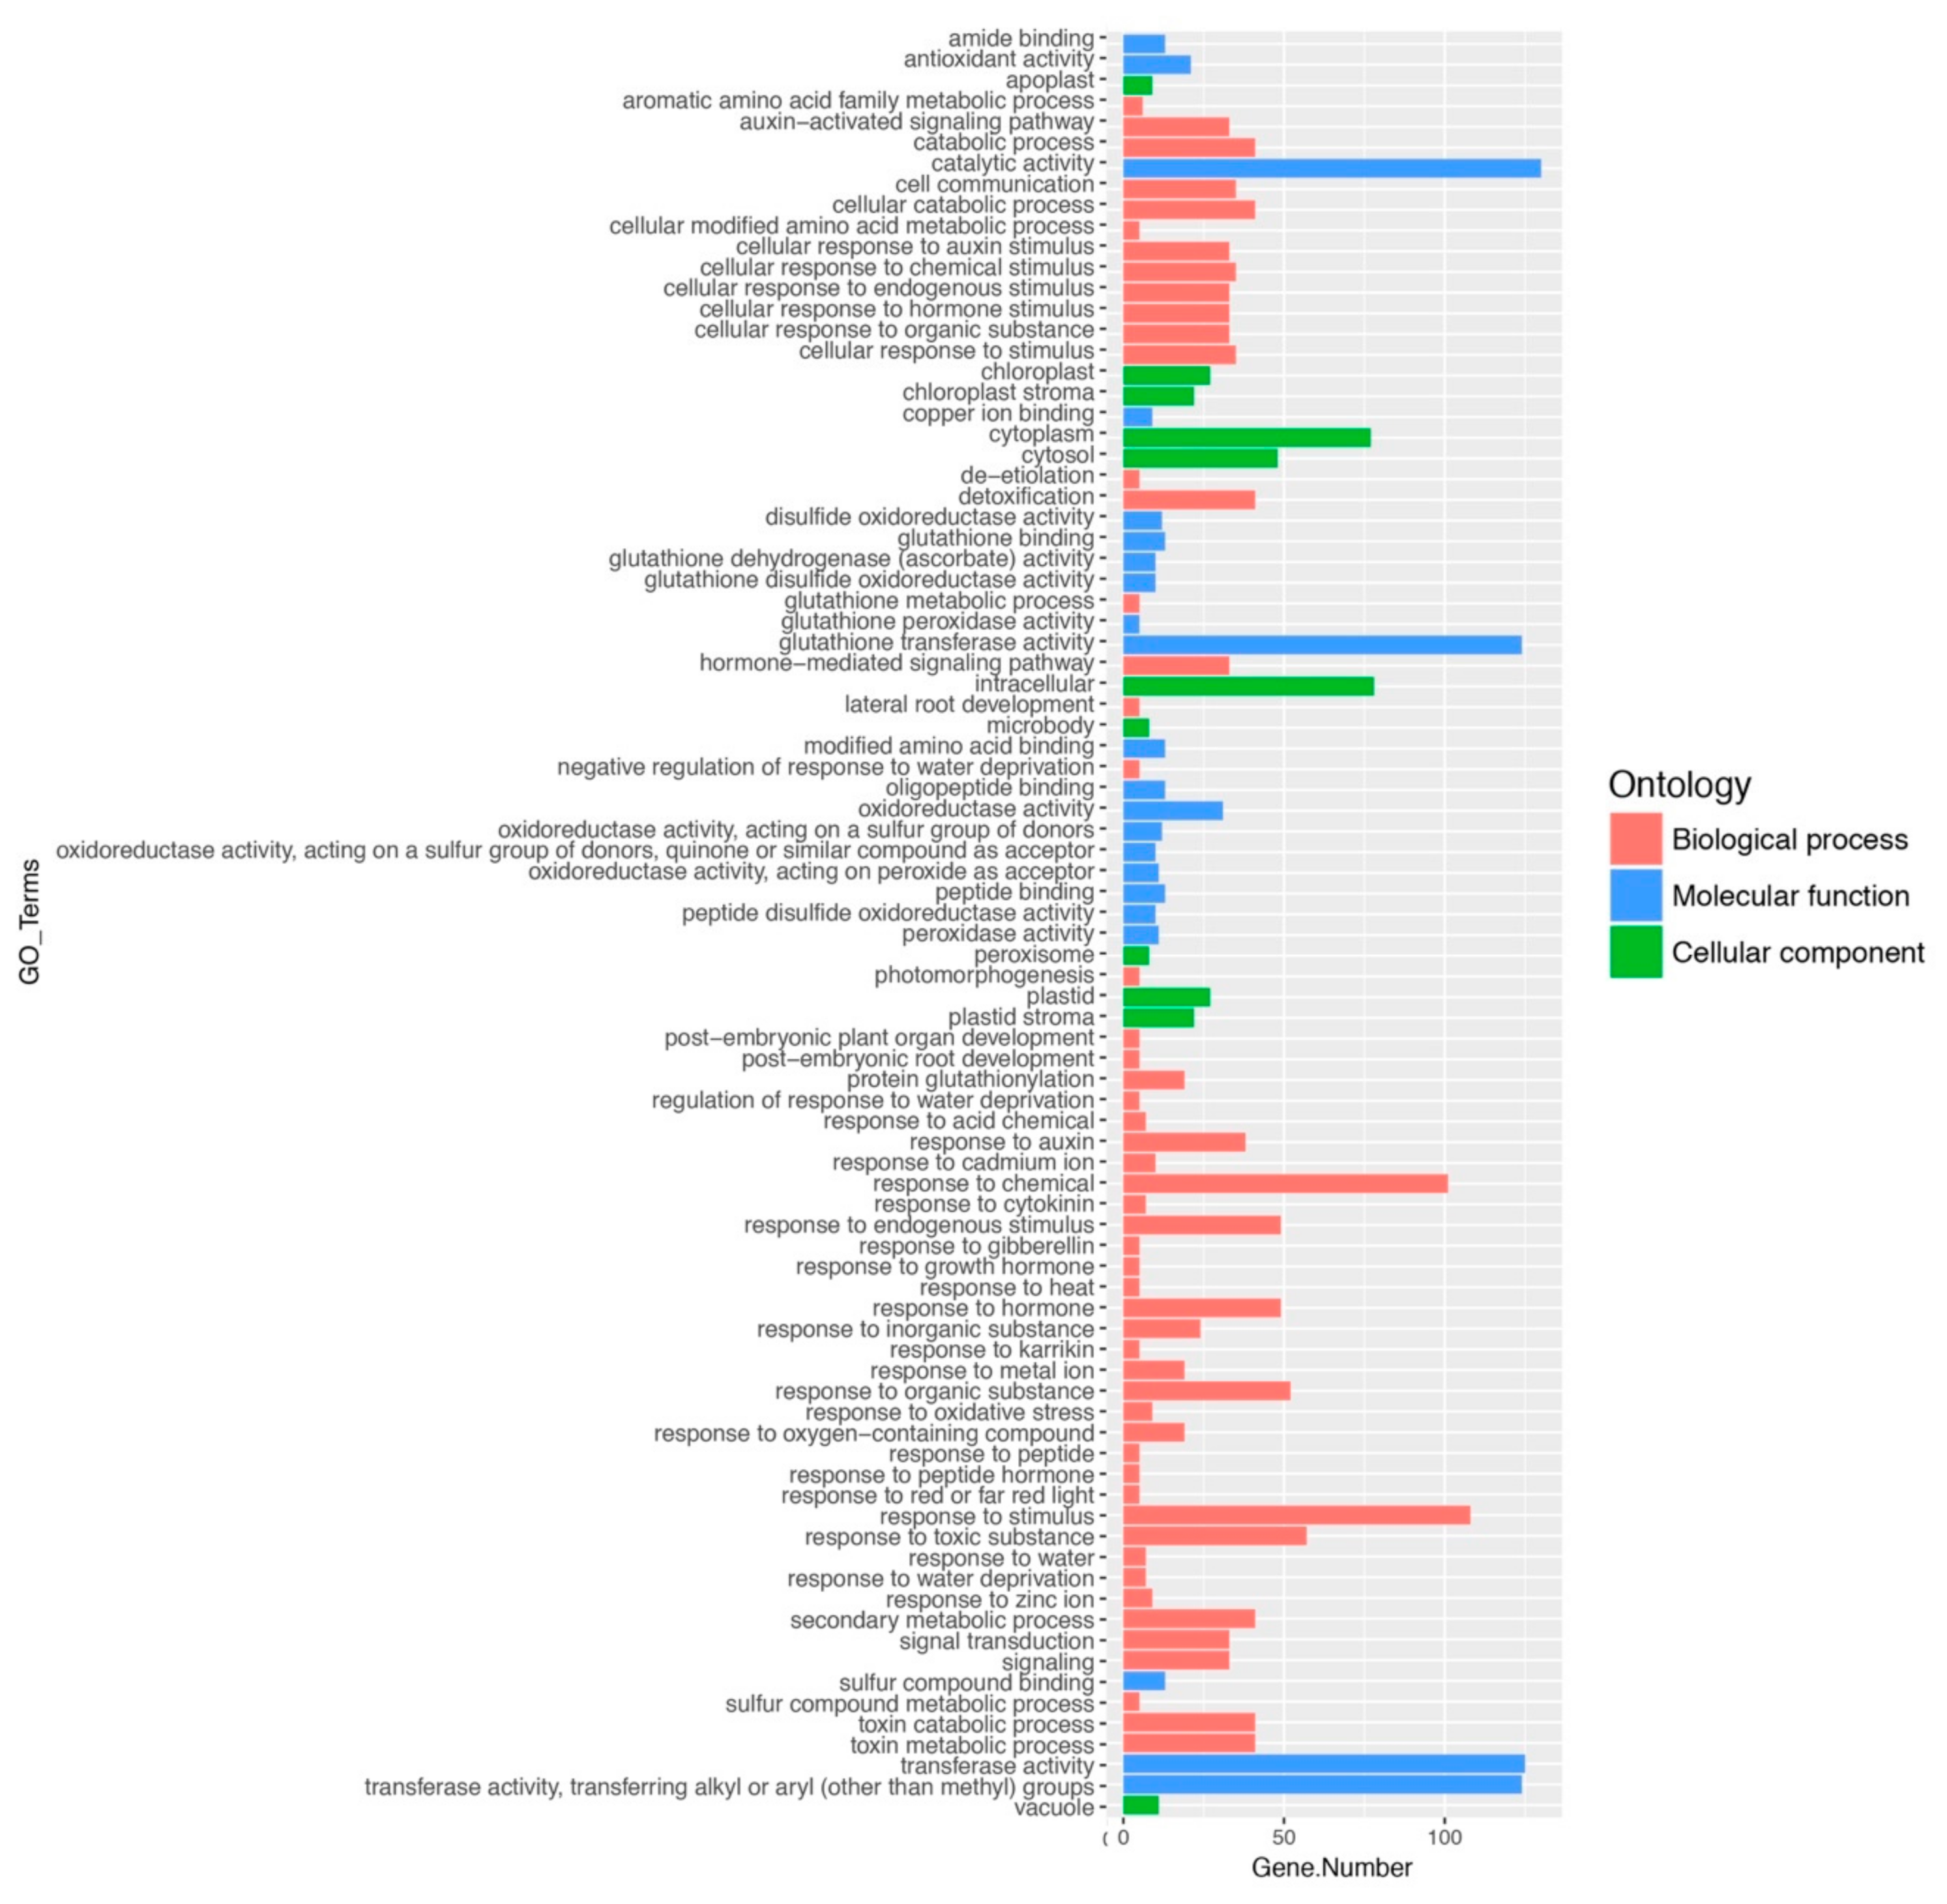
2.2. Gene Ontology and Classification of FaGST Genes

To explore the functions of FaGST genes, gene ontology was carried out using Fa genome as background. As results (Figure 1, Table S1), 130 FaGST genes were significantly enriched in 22 GO categories of molecular function (MF), 11 GO categories of cellular component (CC), and 53 GO categories of biological process (BP). Among the MF categories, catalytic activity (GO:0003824) was the major category with 130 genes enriched. Intracellular (GO:0005622) and response to stimulus (GO:0050896) was the major category of CC and BP, respectively. Among the BP categories, most FaGST genes were enriched in the response to plant hormones, Notably, 41 FaGST genes were enriched in secondary metabolic process (GO:0019748), indicating they might be involved in the secondary metabolic process.
To classify and identify the anthocyanin-related FaGST genes in strawberry, a phylogenetic tree (Figure 2) was constructed between 130 FaGST genes, 53 AtGST genes from Arabidopsis, and another nine published anthocyanin-related GST from other species based on the protein alignment. As results, these GST proteins were classed into seven classes including Phi, Tau, DHAR, TCHQD, GHR, lambda, and Zeta. The largest class of FaGST is Tau followed by Phi. All the previously suggested anthocyanin-related GST genes were closely clustered into Phi class, except BZ2 from maize. Notably, three FaGST genes named FaGST1, FaGST37, and FaGST98 showed a close relationship with the previous suggested anthocyanin-related GST genes, indicating that these three FaGST genes might be anthocyanin-related.

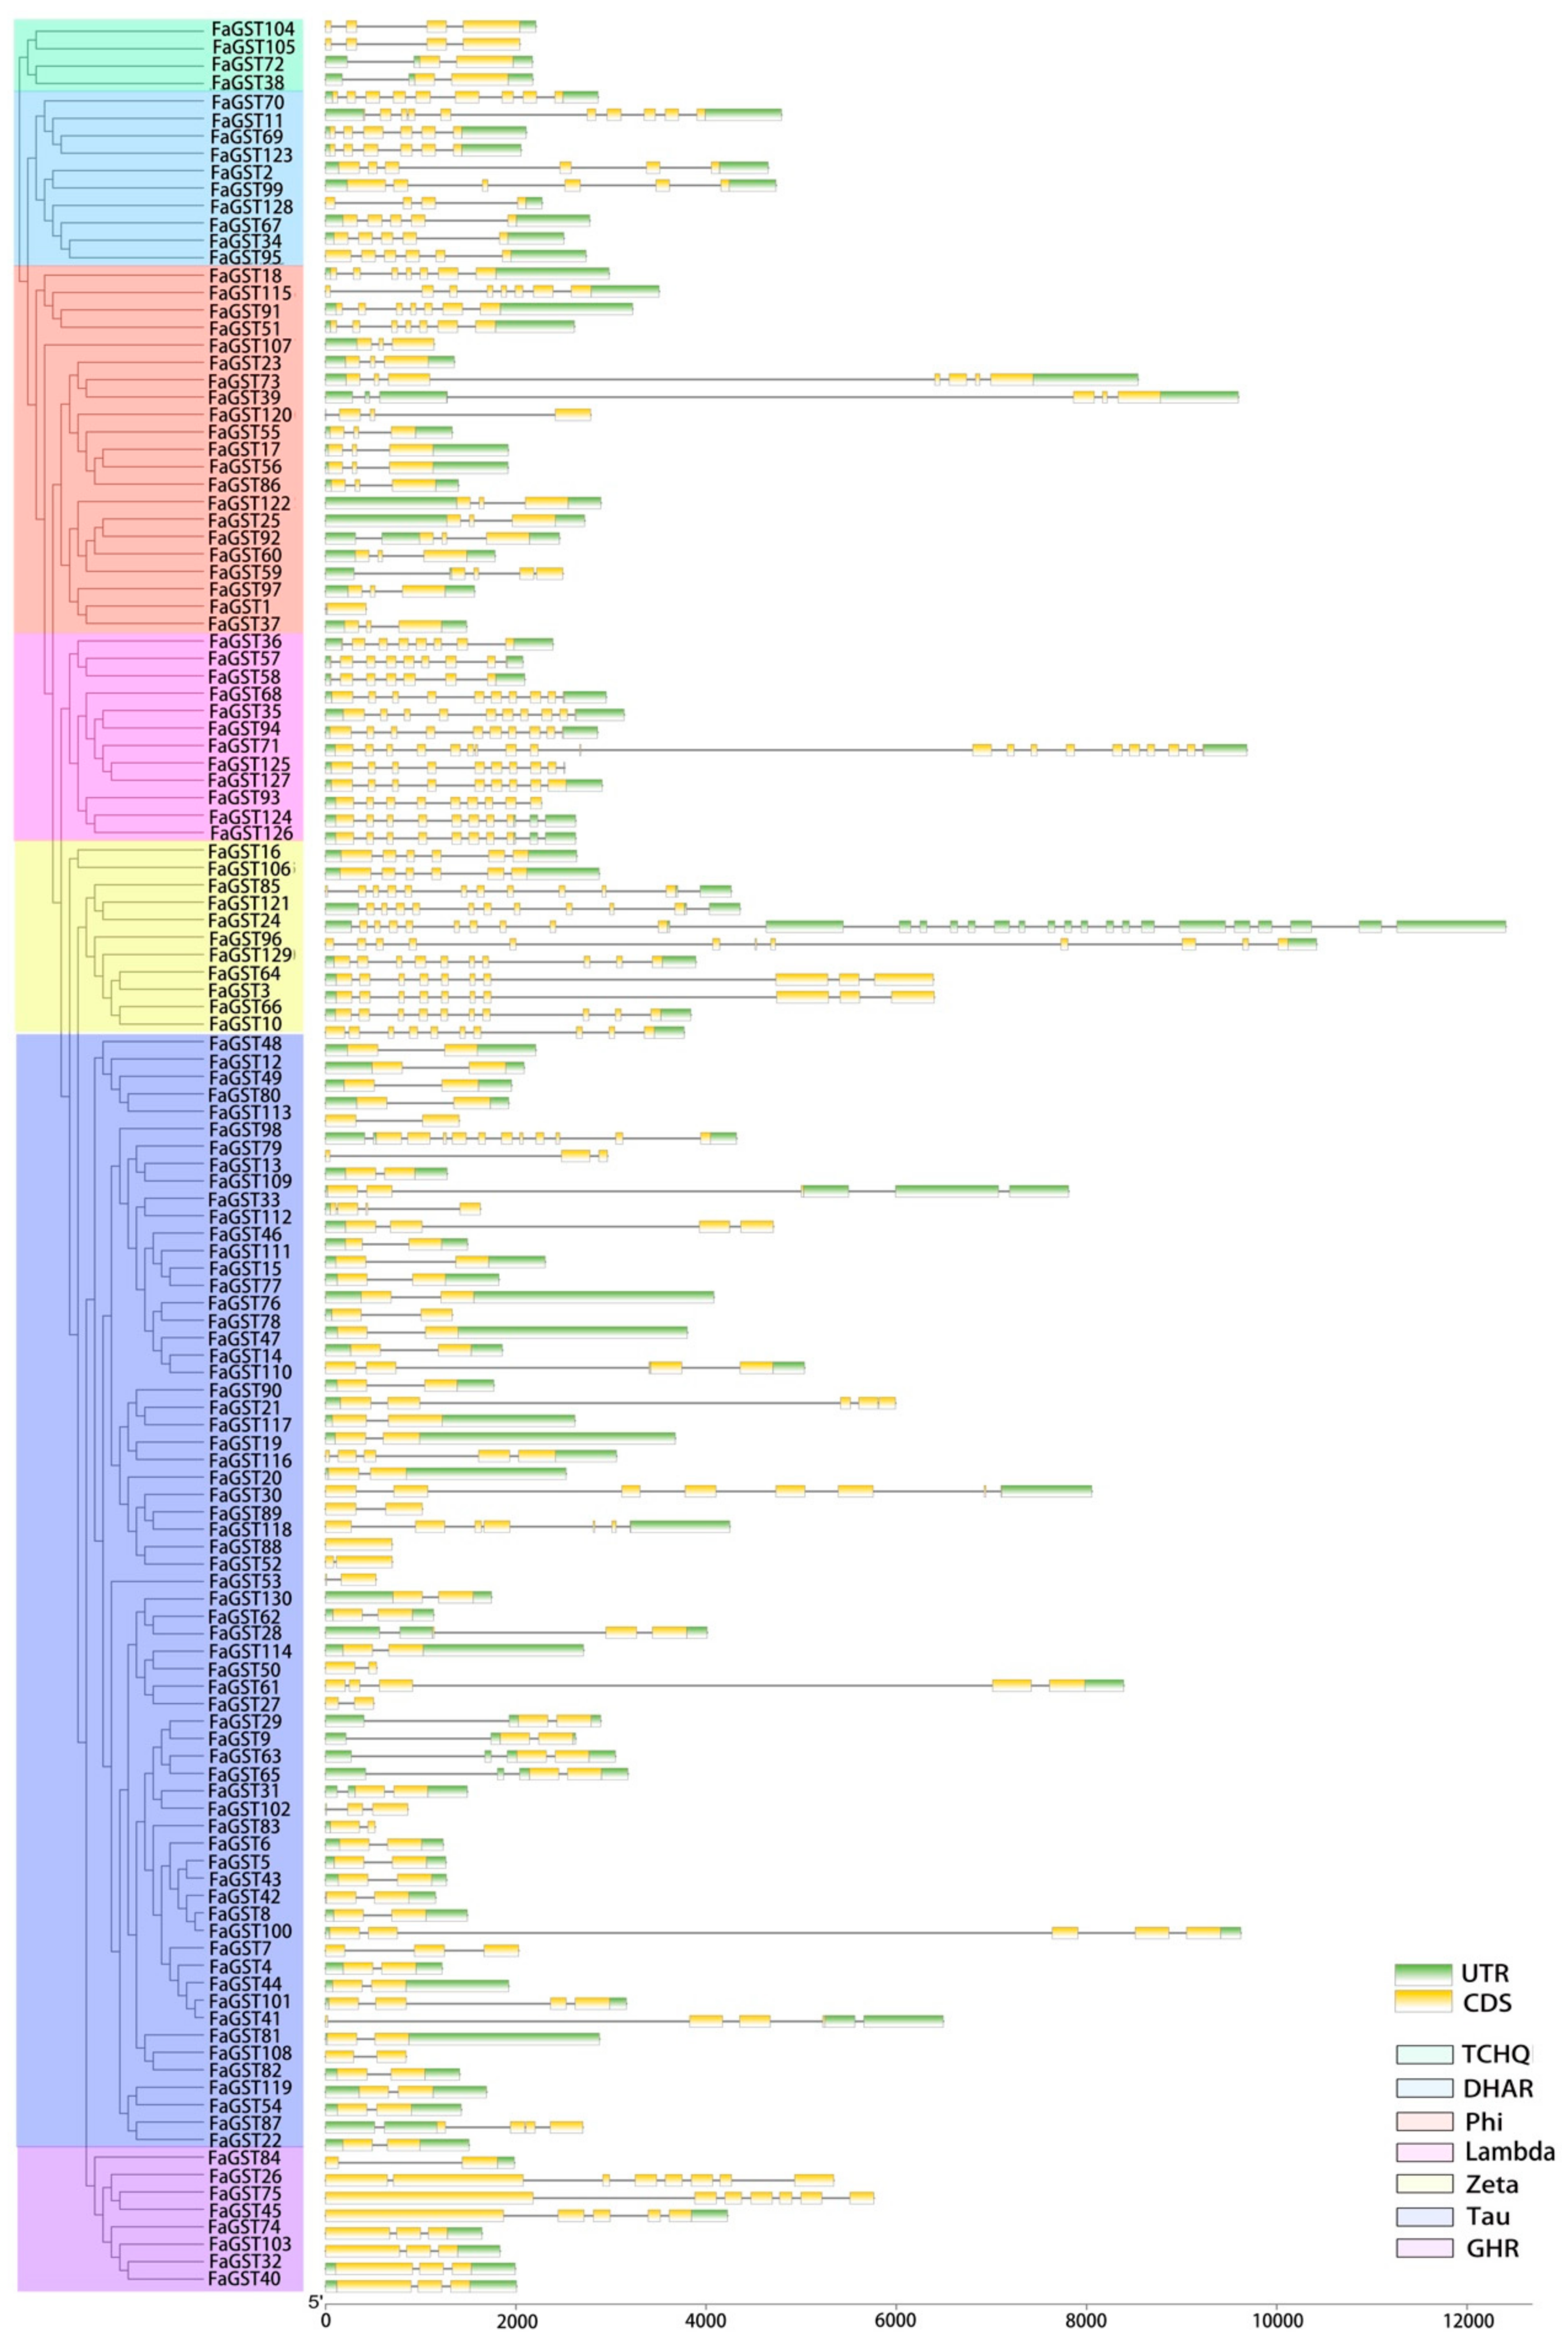
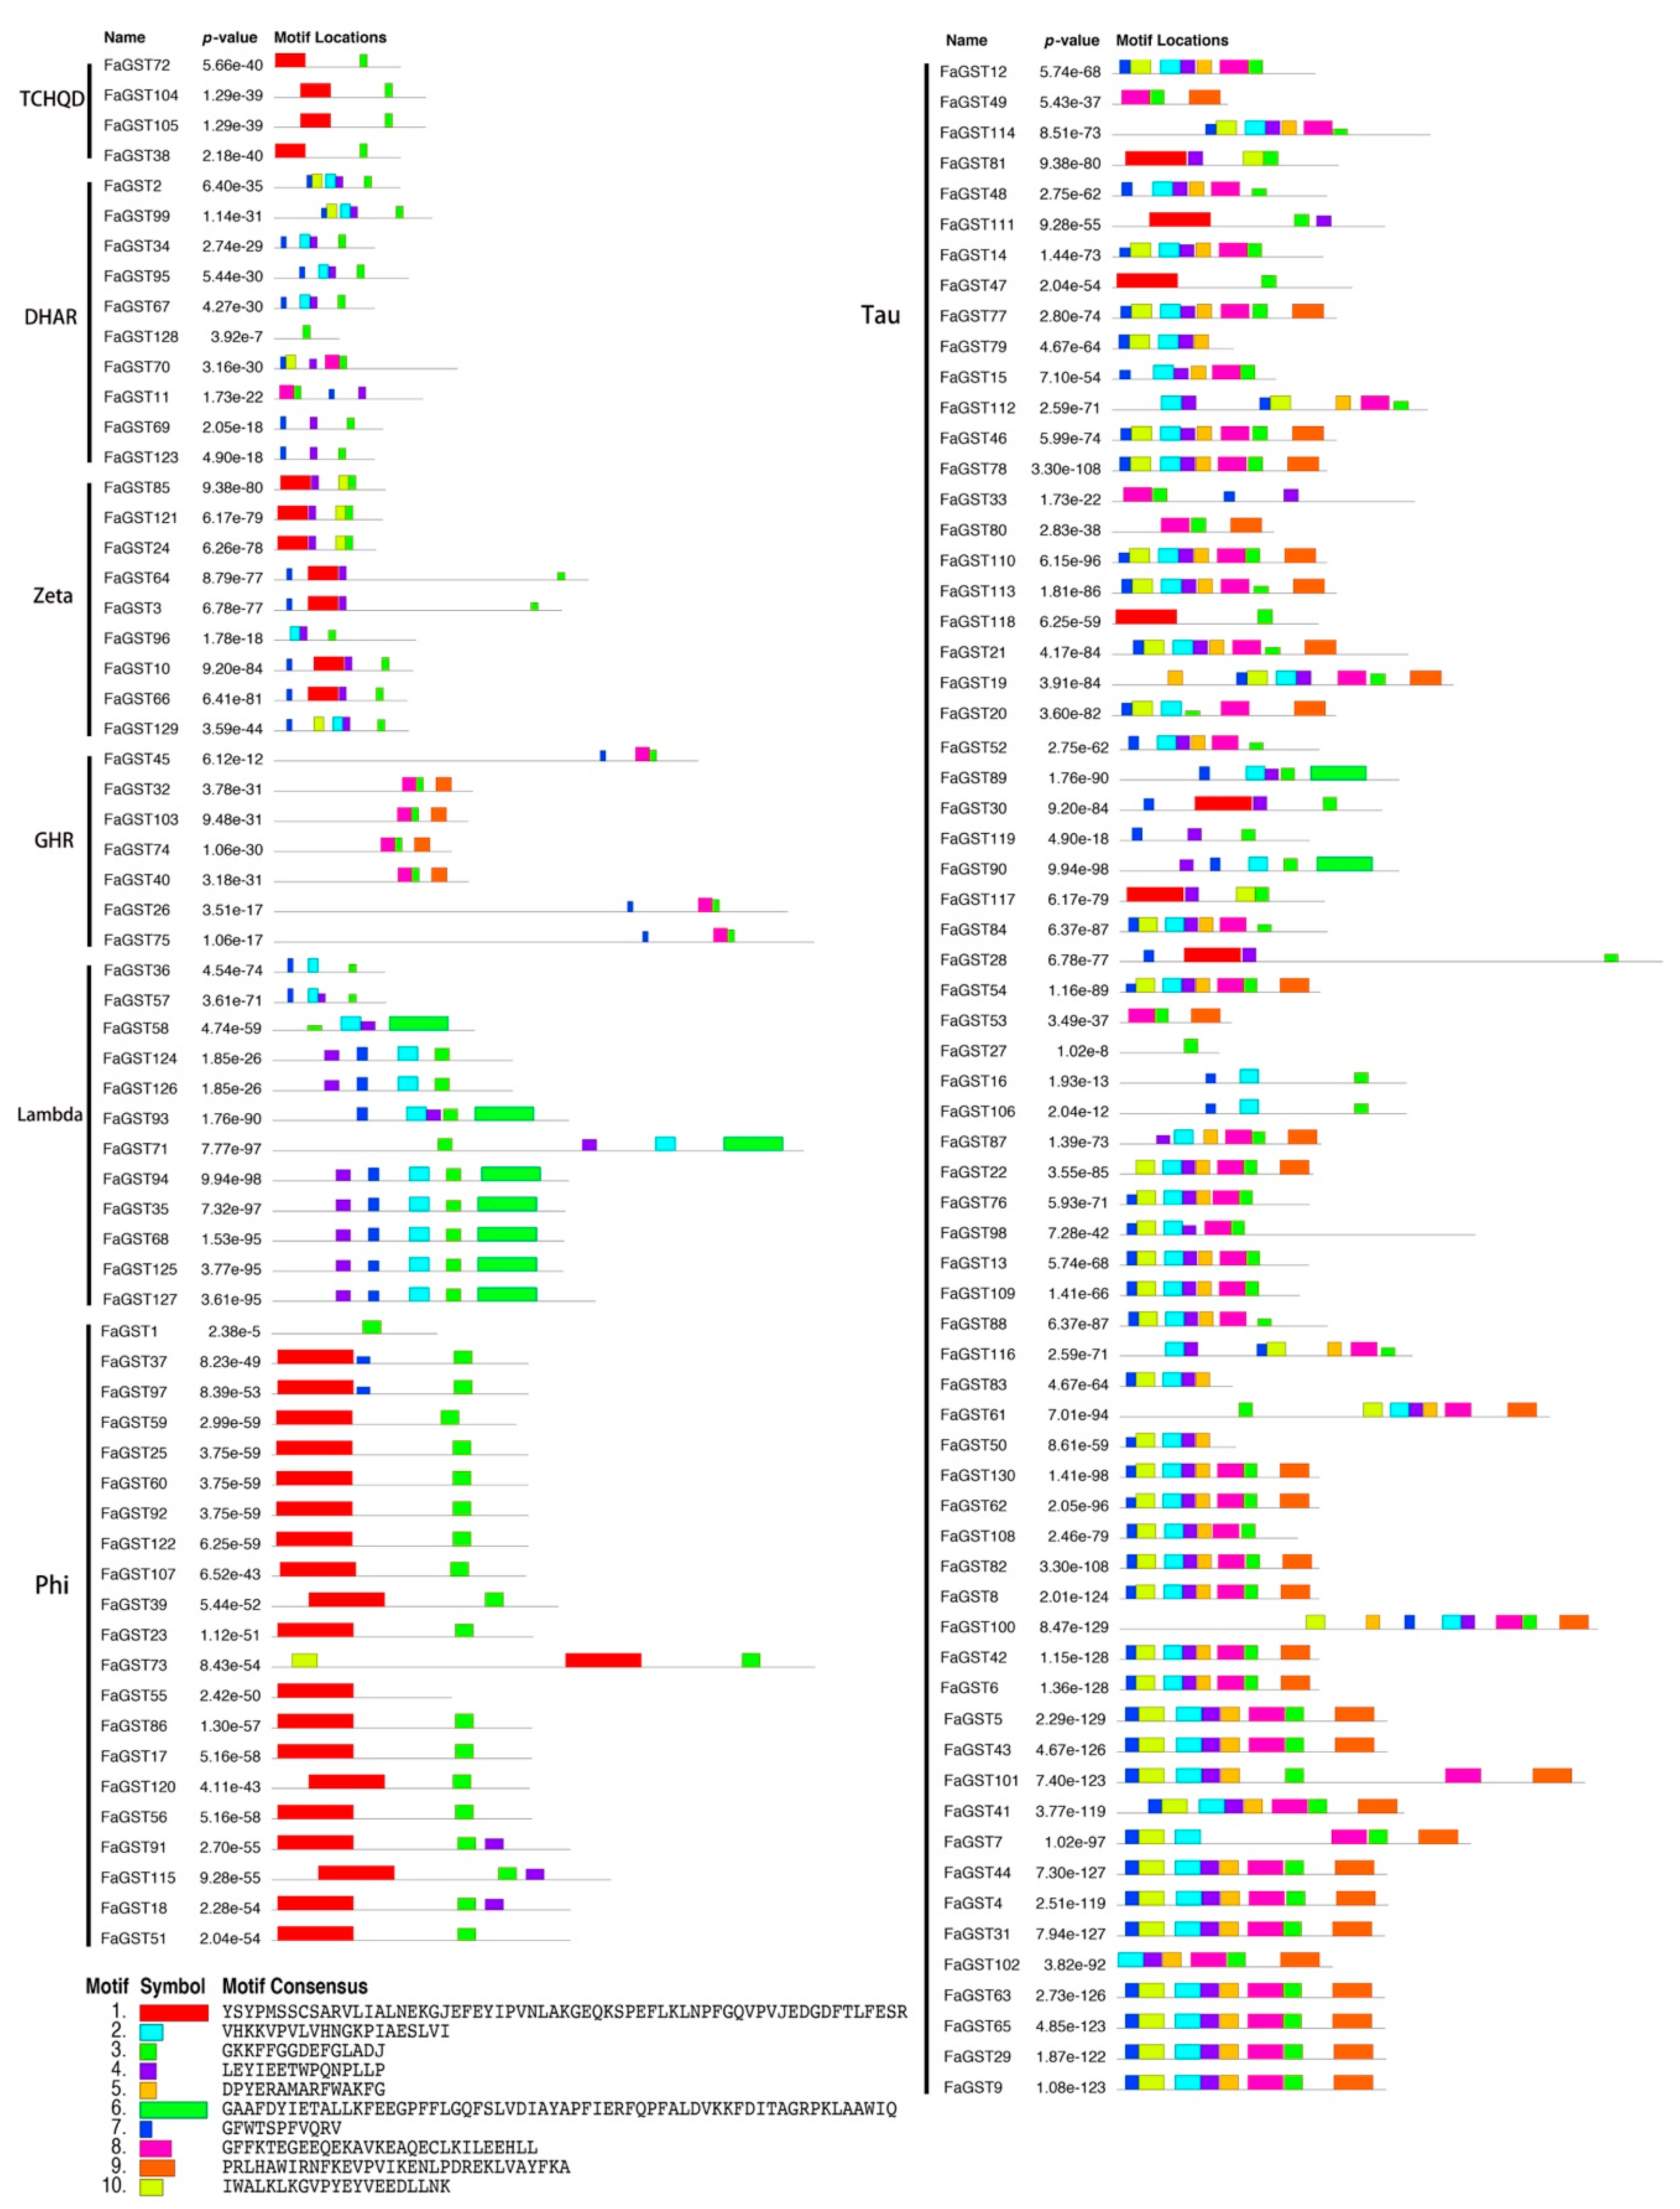
2.3. Gene Structure and Conserved Motifs Analysis

To further explore the structural features of strawberry GST genes, the gene structure was analyzed. As results (Figure 3), the Lambda and Zeta class contained the most but shortest exons comparing with other classes. Among the plant-specific Phi class, only FaGST1 had no intron, 11 of 21 had two introns and the others had more than two introns. For the largest Tau class, most genes had two exons and one intron, FaGST88 had no intron.
To get more understanding of the functional divergences of the FaGST proteins, a total of 10 motifs in the deduced FaGST amino acids were also searched on MEME website. The results (Figure 4) showed that each subclass of GST genes comprise the conserved motifs. For instance, almost all the GST genes in the Tau class comprised motifs 2, 5, 7, and 9, while motifs 3 and 8 were conserved in the GHR class. Specifically, in the anthocyanin-related class (Phi), motifs 1 and 3 were conserved. The putative motifs were annotated based on NCBI Conserved Domain Database (CDD), Pfam and PROSITE databases. Motifs 1 and 2 were annotated as GST_N domain, motifs 3 and 6 were annotated as GST_C domain.

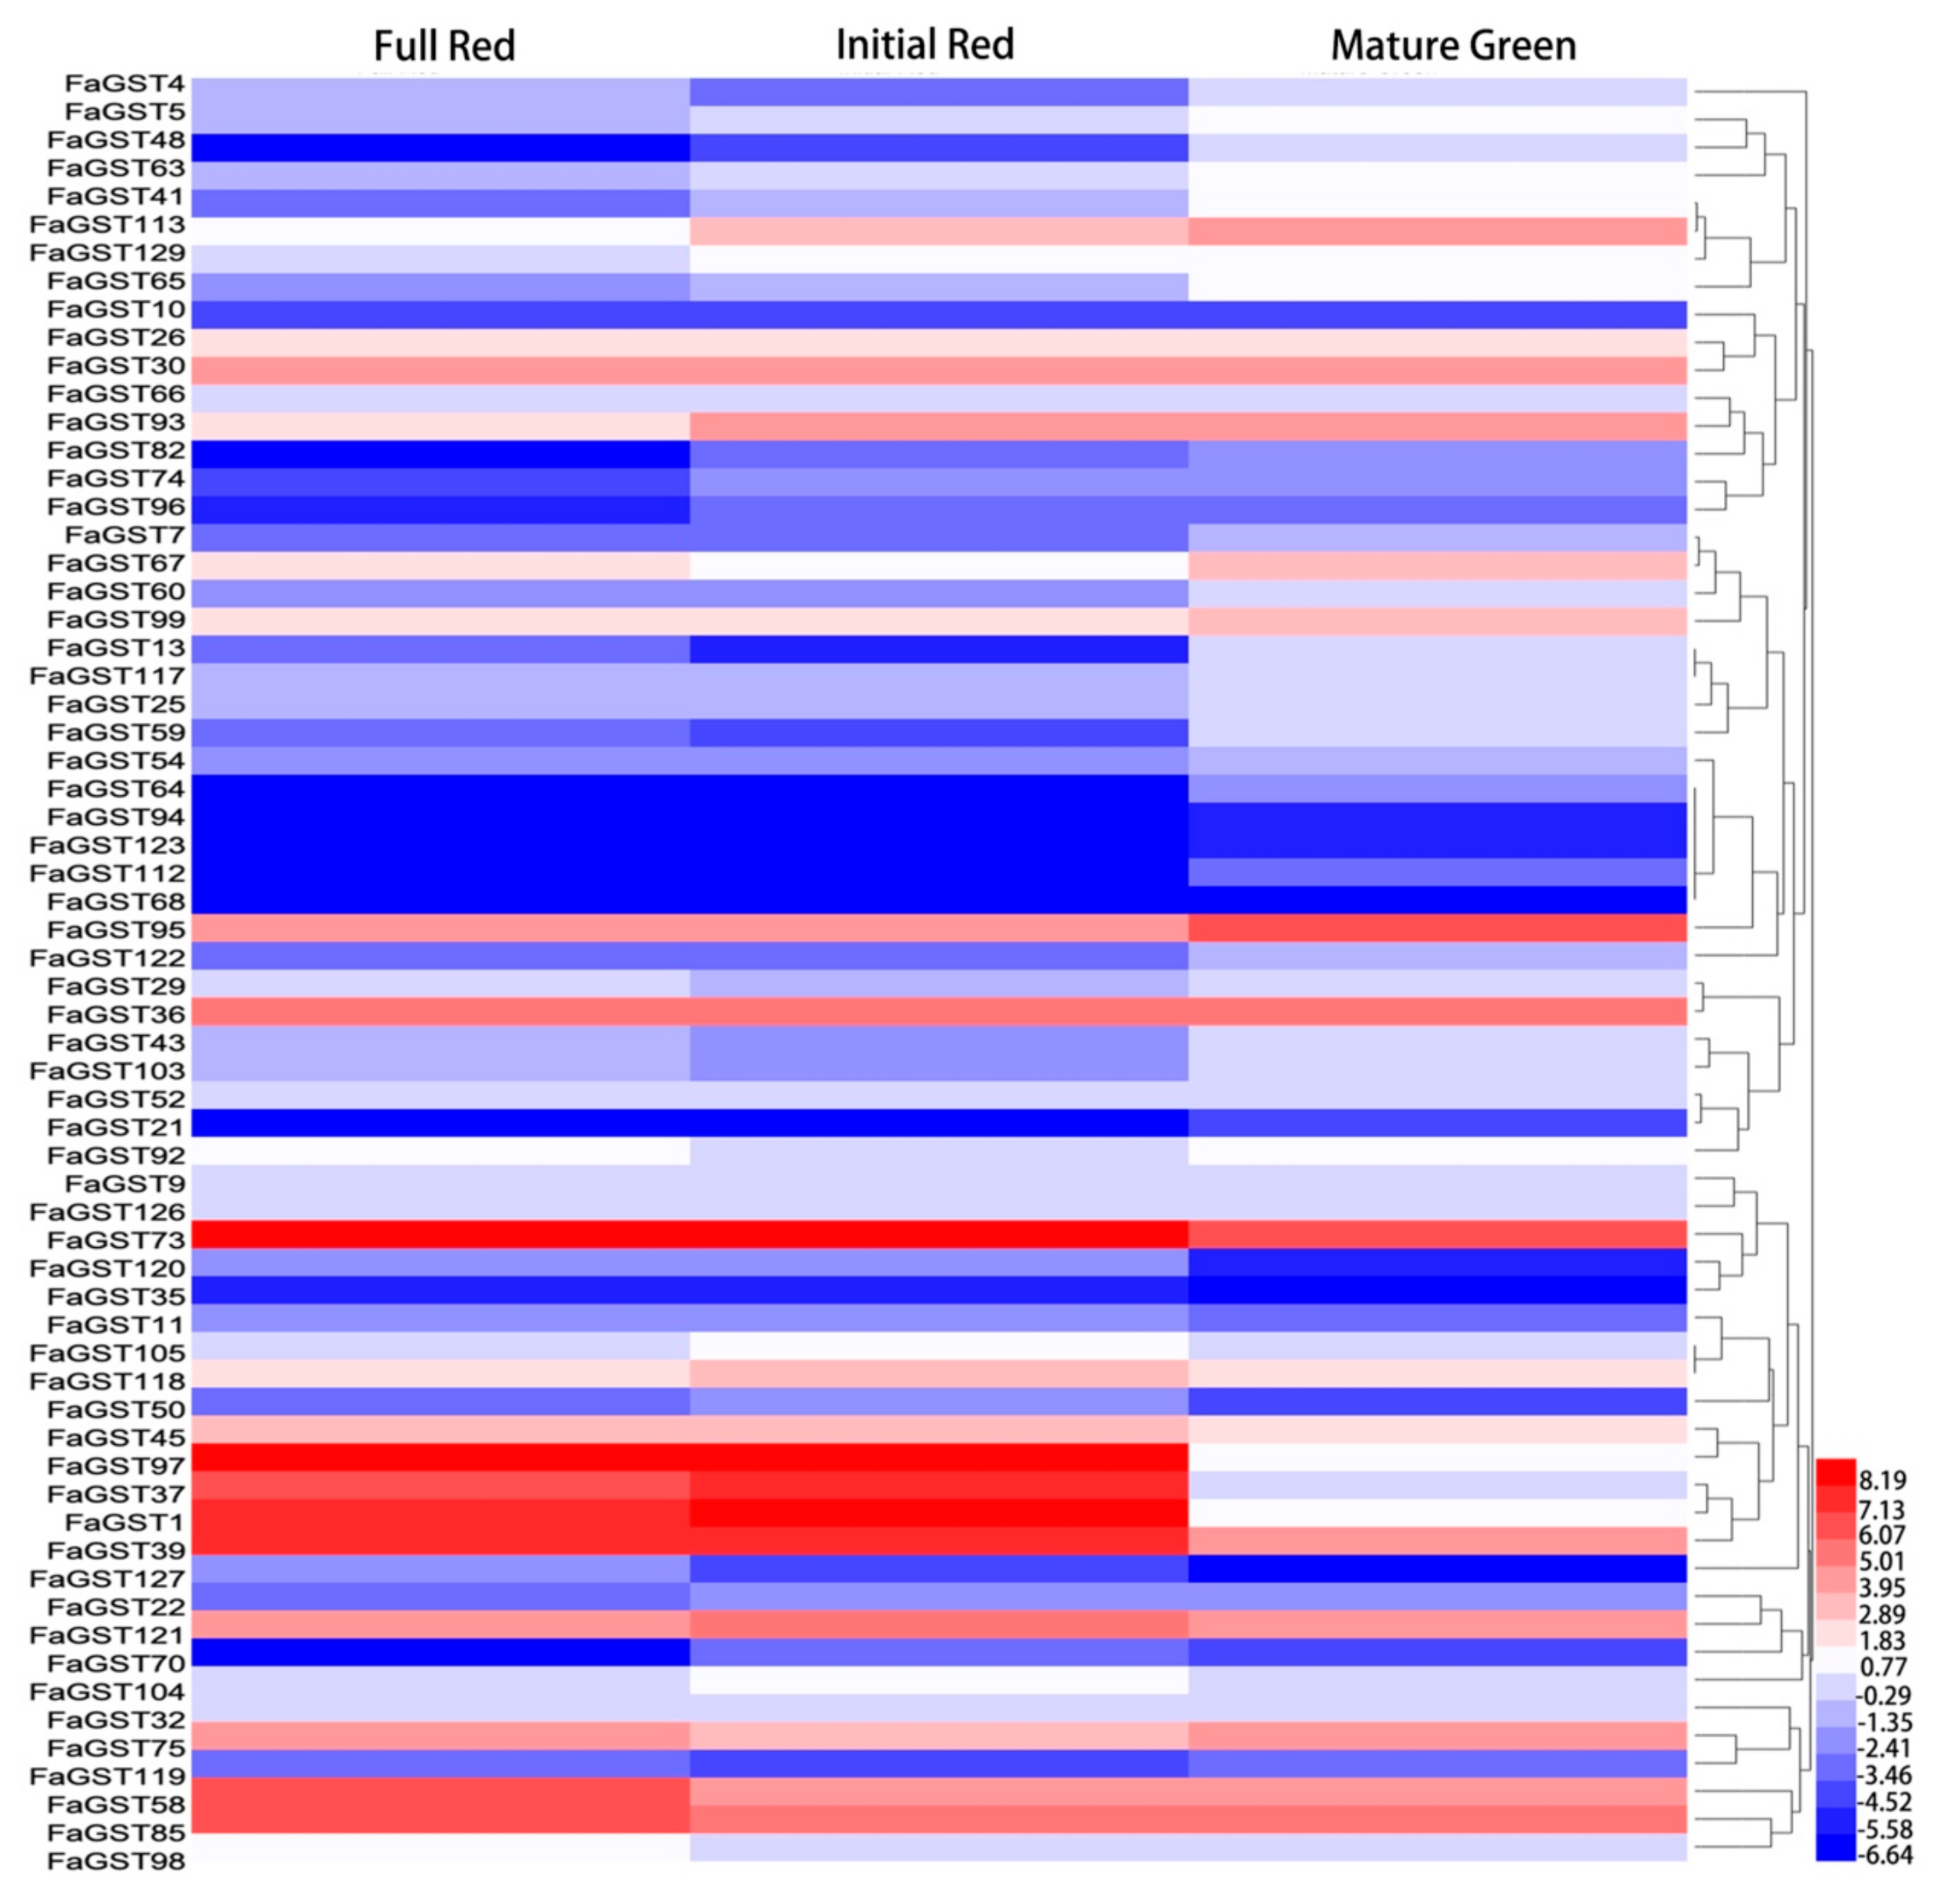
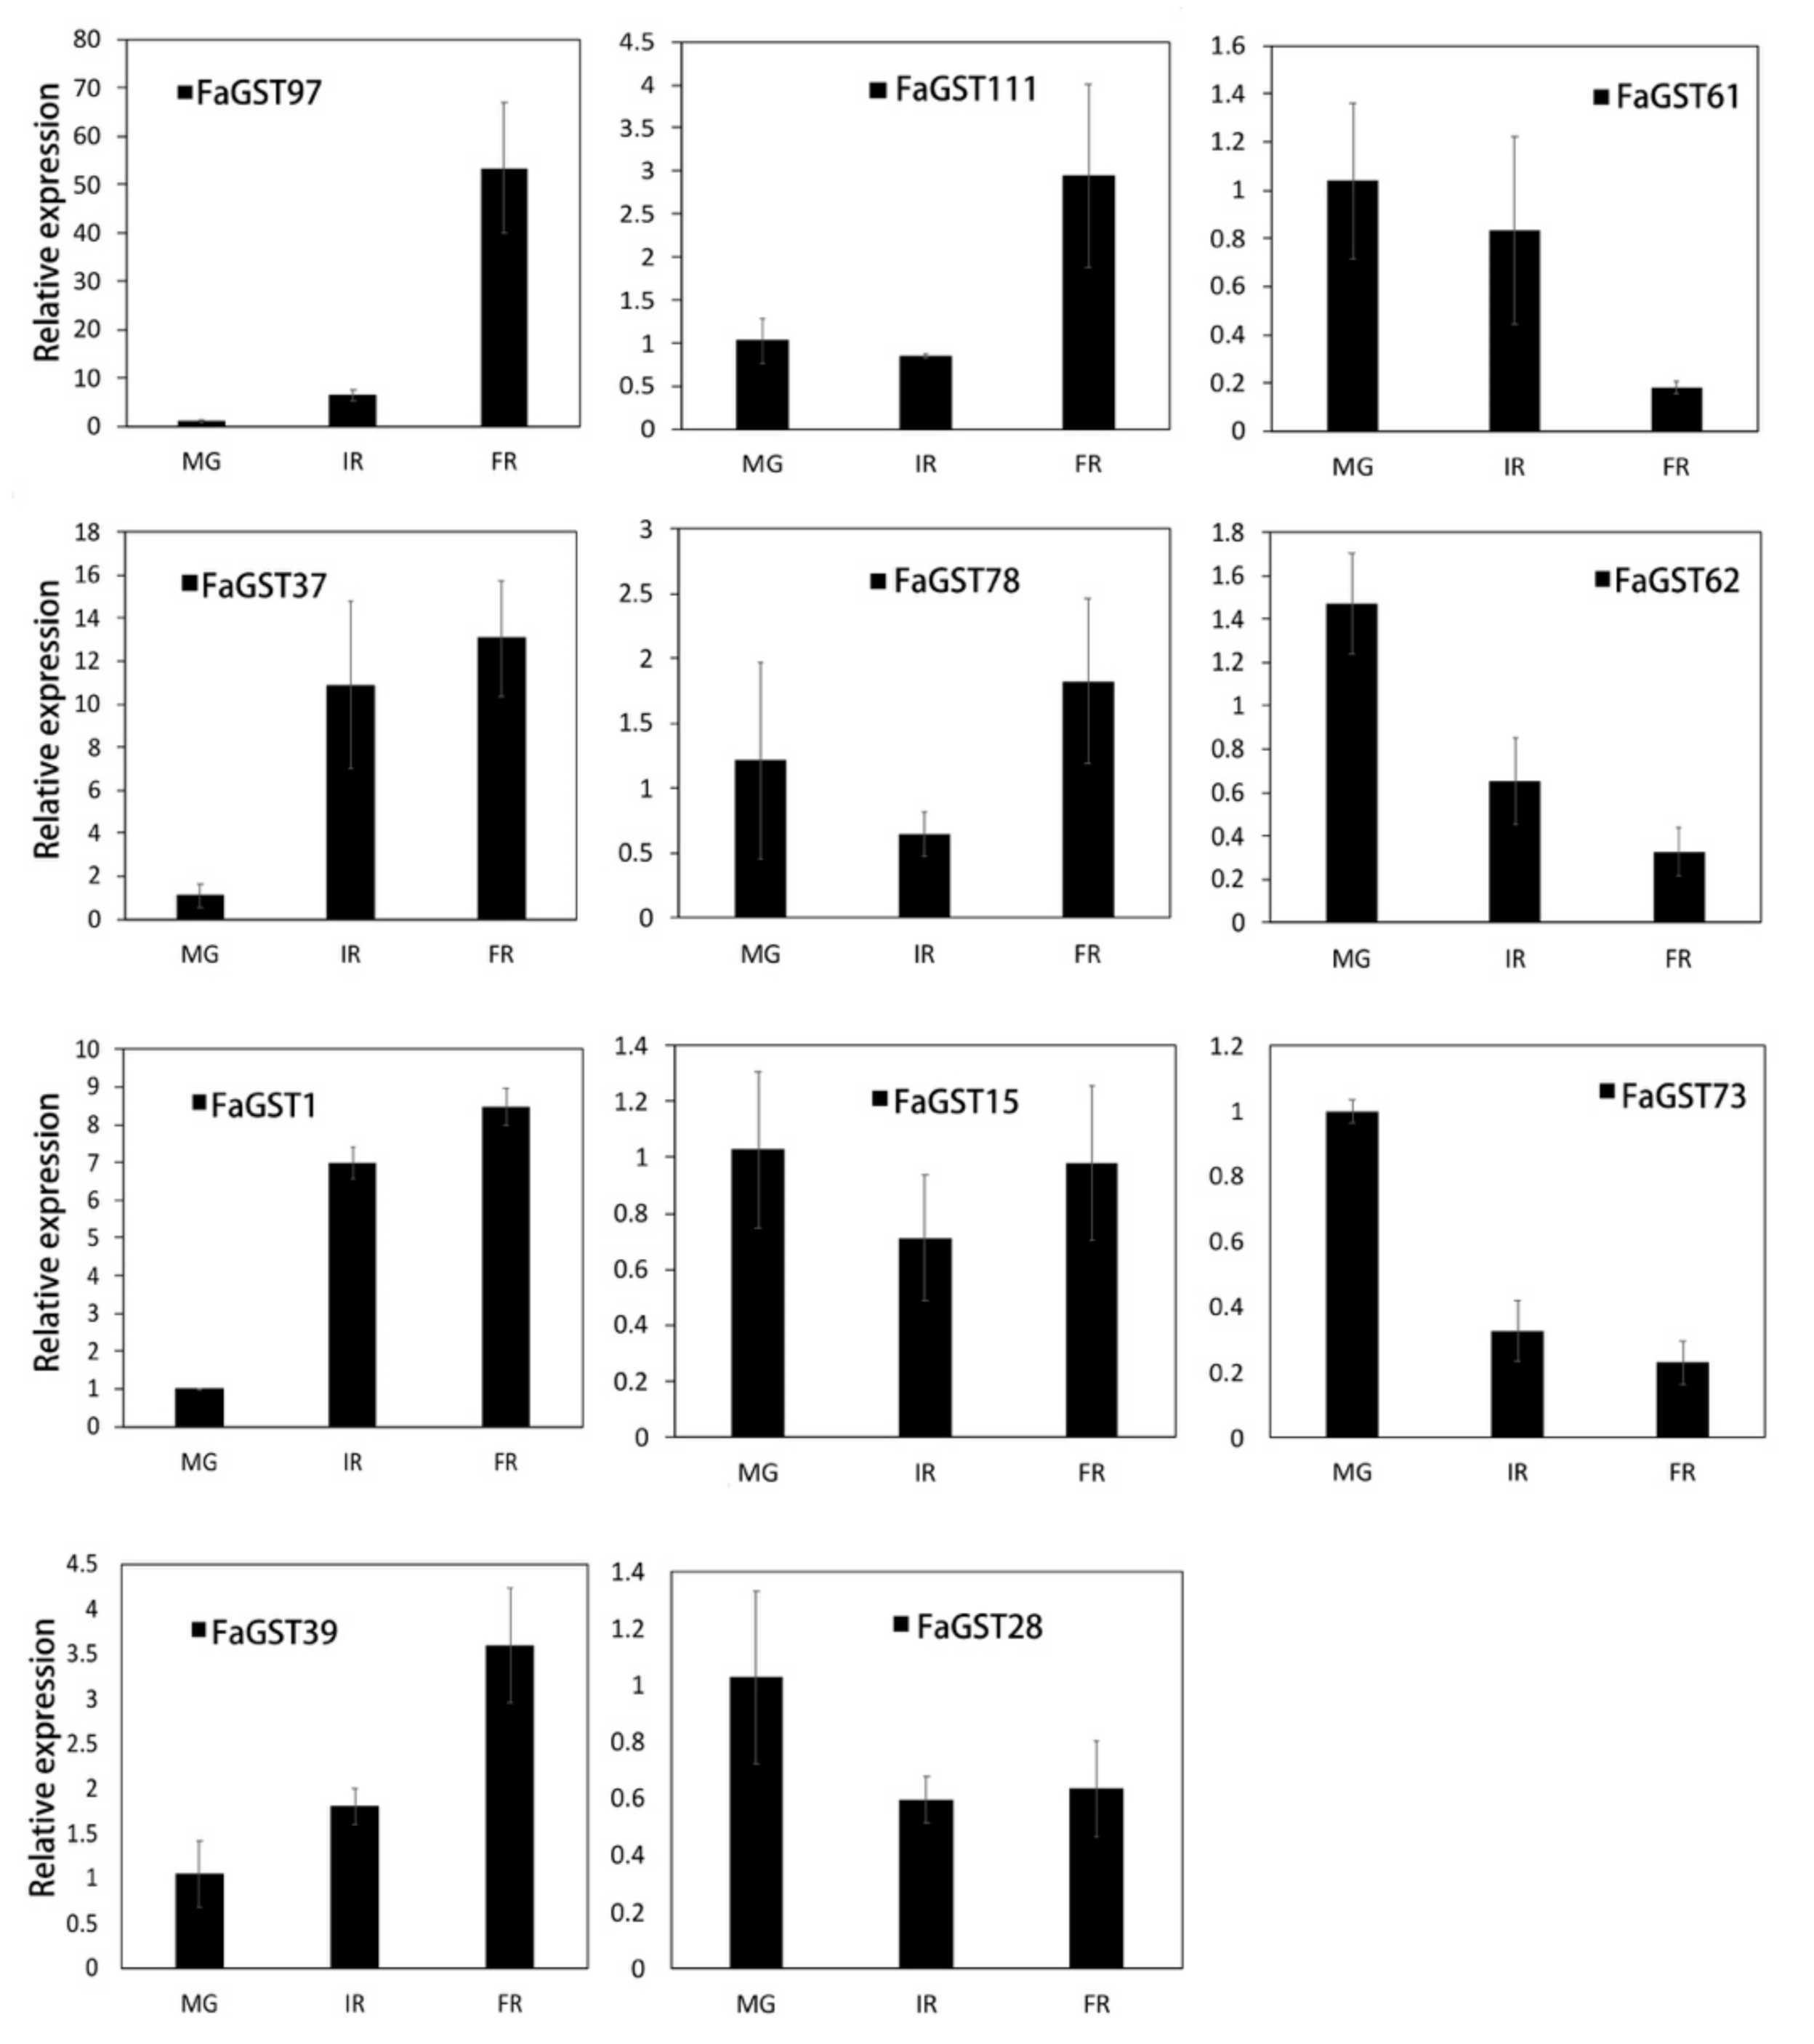
2.4. Expression Analysis of FaGST Genes in Different Developmental Stages

To further confirm the involvement of FaGST genes in anthocyanin transportation, their expression was analyzed at different developmental stages using transcriptome data. Among the total of 130 FaGST genes, expression data of 87 FaGST genes were available and retrieved for analysis. As the results (Figure 5), most of the genes were found to be low expressive, and the expression of FaGST97 at IR was found to be the maximum, followed by FaGST1 and FaGST73. All these genes could be divided into four groups based on their expression patterns during the developmental stages: (a) low expression level at the initial red (IR) stage while comparative higher expression at full red (FR) and mature green (MG), such as FaGST4, FaGST13, and FaGST119 etc. (b) Expression level gradually decreased from MG to FR, such as FaGST5, FaGST48, FaGST63, FaGST41, FaGST113, FaGST129, and FaGST65 etc. (c) Relatively higher expression at FR, lower expression level at IR, and MG, such as FaGST58, FaGST85, and FaGST98 etc. (d) Notably, the three genes (FaGST1, FaGST39, and FaGST97) which clustered to the anthocyanin-related clade had very low expression level at MG, while their expression significantly largely increased at IR and maintained a comparative high level at FR stage. In addition, there were another two genes (FaGST37 and FaGST73) belonging to the Phi class that had a similar expression pattern with these three genes, both of which had an increasing expression at IR stage, and a high expression level at FR stage. These results indicated that FaGST1, FaGST39 and FaGST97, FaGST37 and FaGST73 were putative anthocyanin-related.
To verify the gene expression data retrieved by RNAseq analysis, the five FaGST putative anthocyanin-related genes (FaGST1, FaGST37, FaGST39, FaGST97, and FaGST73) and another six FaGST genes whose expression levels were not available in the RNAseq data were randomly selected for qPCR analysis. The results are shown in Figure 6. It was showed that despite the quantitative differences in expression levels, the expression patterns of the five putative anthocyanin-related FaGST genes detected by qPCR experiments were consistent with the expression patterns investigated by RNAseq. In addition, we found another gene named FaGST111 also had a largely increasing in the FR stage. All the other five FaGST genes were detected with constitutive low expression during the whole fruit ripening process. Among them, FaGST6, FaGST28, and FaGST62 comprised a gradually decreasing in expression, while FaGST78 and FaGST15 showed no big change in expression in different developmental stages according to the qPCR results.

2.5. Anthocyanins Accumulation and Expression Analysis of Anthocyanin Biosynthetic Structural Genes

To estimate the relationship between the FaGST gene expression and anthocyanin accumulation, the expression of some anthocyanin biosynthesis structural genes and anthocyanin content was detected during the fruit ripening process. The pelargonidin 3-glucoside and cyanidin 3-glucoside have been recognized as two major anthocyanins in strawberry [31]. The content of pelargonidin 3-glucoside was suggested much higher than cyanidin 3-glucoside, it accounts for over 70% of total anthocyanins [32,33]. Here we only detected the pelargonidin 3-glucoside as presentative of total anthocyanins in strawberry. As results (Figure 7), anthocyanins started to accumulate at T stage, and increased gradually during the fruit ripening. Consistent with anthocyanins content, the expression of selected structural genes including FaCHI, FaCHS, and FaANS increased during the fruit ripening process. Similarly, the expression of FaMYB10 was also detected as increasing during fruit ripening.

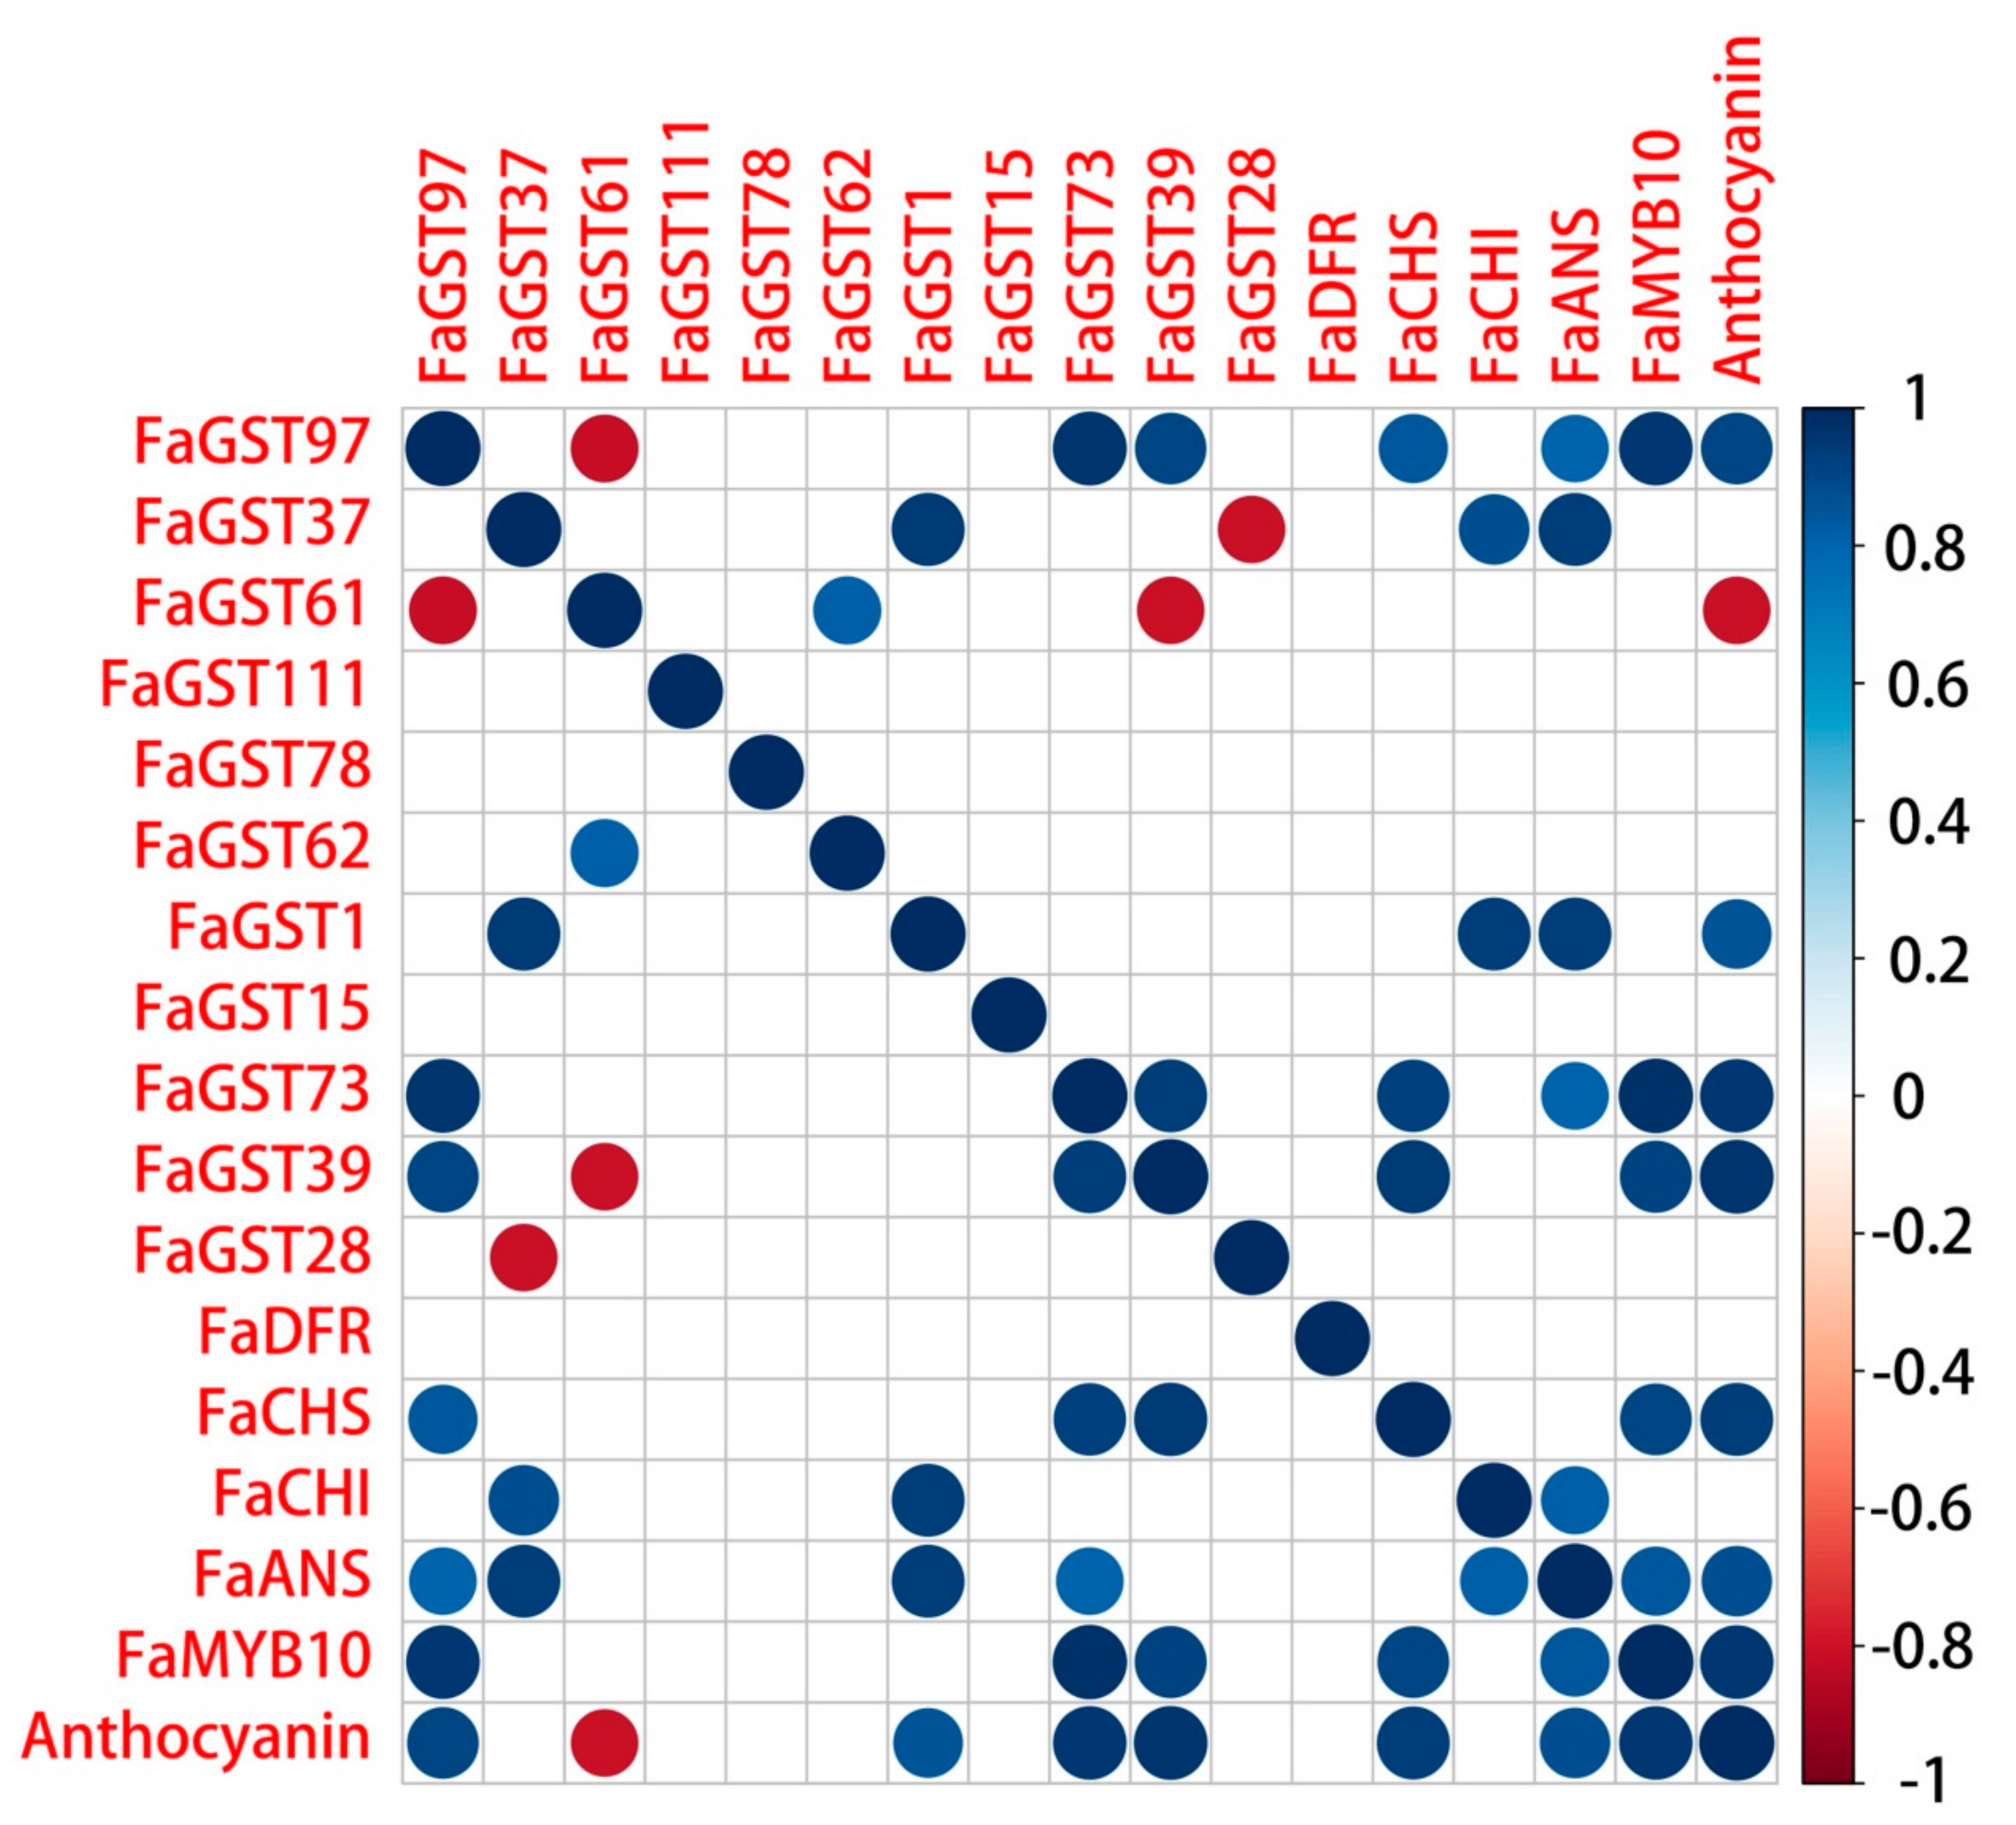
2.6. Correlation Analysis of Anthocyanin Biosynthetic Structural Genes and FaGST Genes

Furthermore, the Pearson correlation between the selected FaGST genes and anthocyanin content as well as anthocyanin-related structural genes was analyzed by R software. It was showed (Figure 8) that besides the anthocyanin-related structural genes, the expression of FaGST97, FaGST1, FaGST73, and FaGST39 was significantly (p value < 0.01) strongly positively correlated with anthocyanin content. Their expression was also correlated with the expression of anthocyanin biosynthesis genes during fruit ripening. While, the expression of FaGST73 has a strong correlation only with the anthocyanin biosynthesis genes FaCHI and FaANS, but not with anthocyanin content. Unexpectedly, there was a gene named FaGST61 expressed that was negatively correlated with anthocyanin content. The correlation coefficient value is shown in supplementary Table S2.

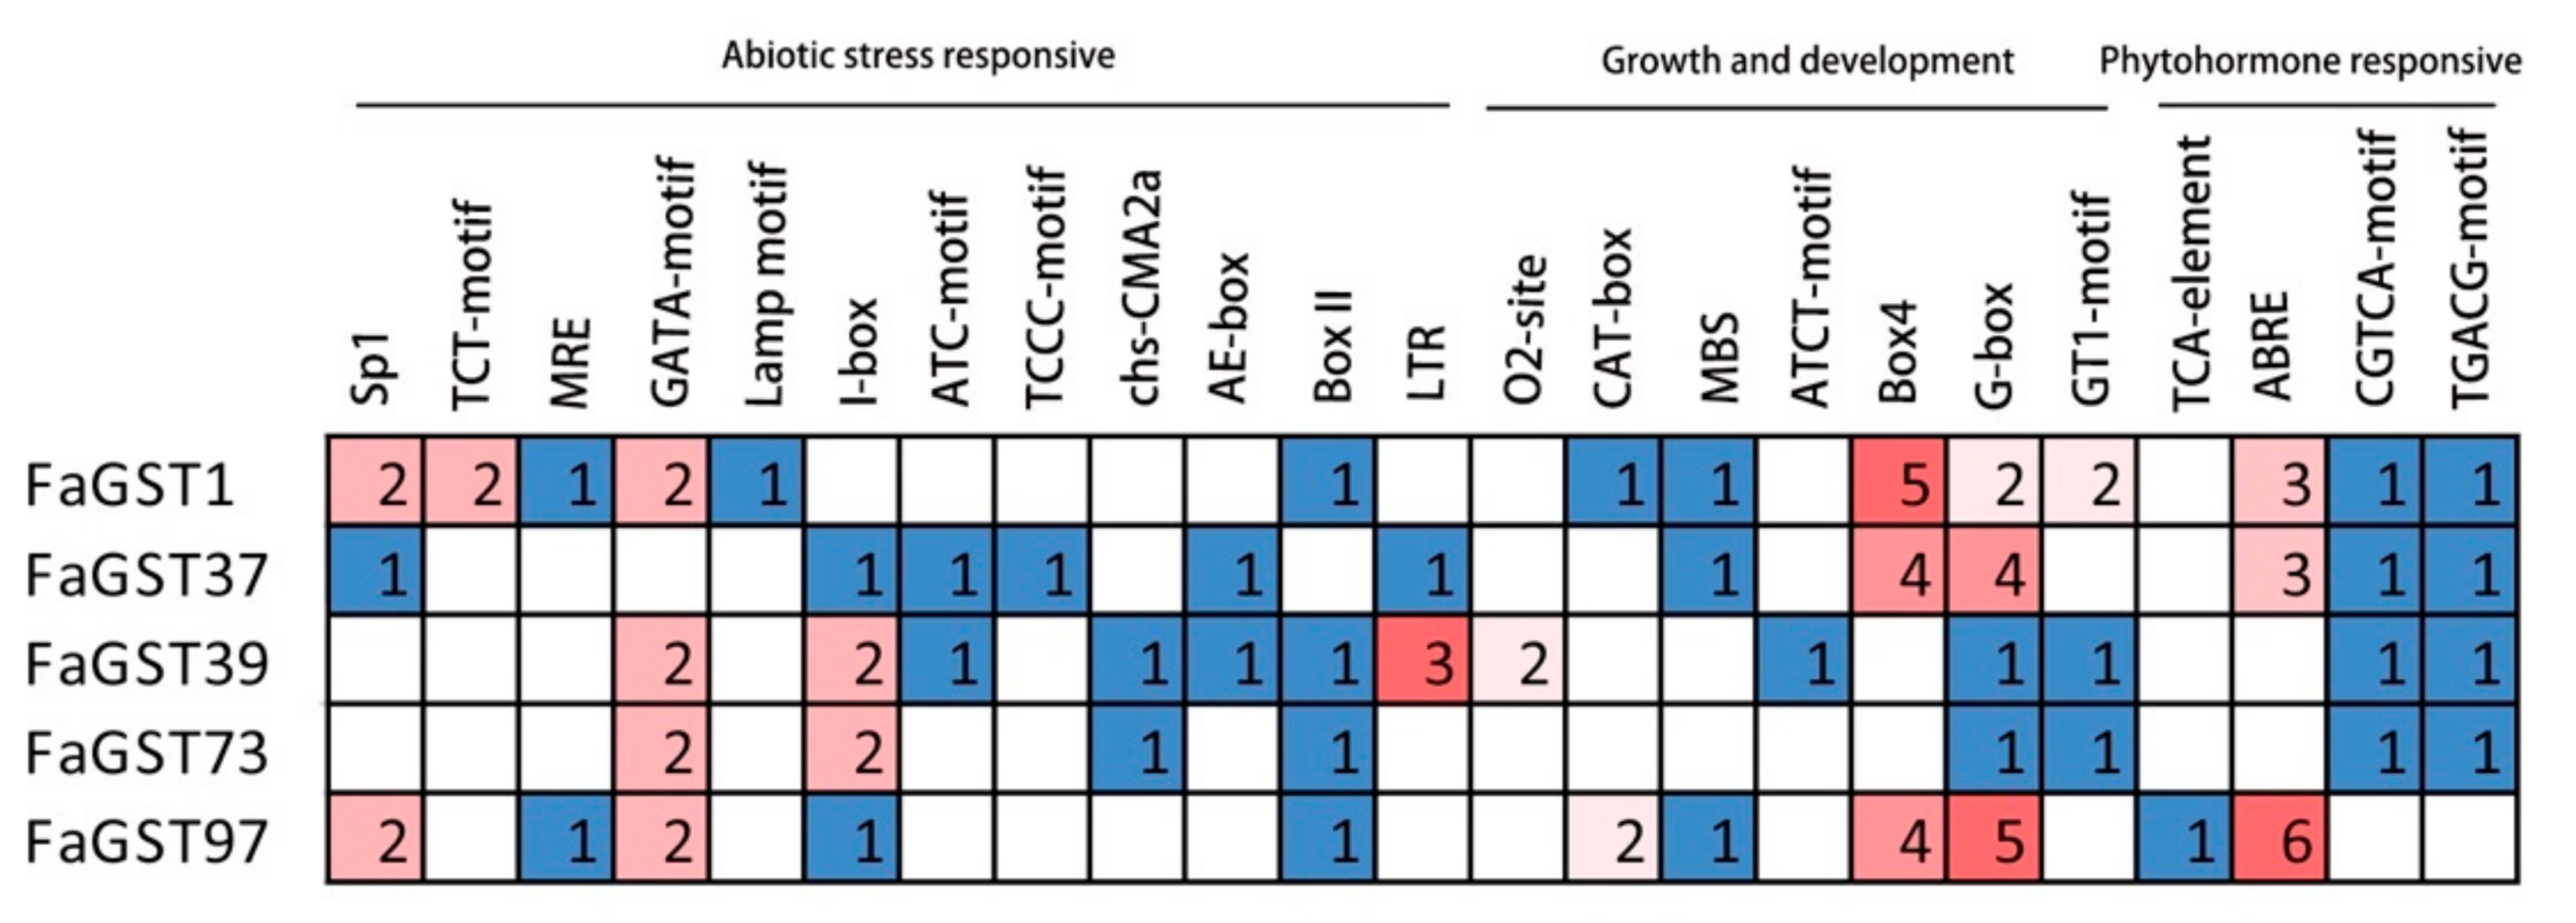
2.7. Identification of Cis-Regulatory Elements in the Promoters of Putative Anthocyanin-Related FaGST Genes

To investigate the potential regulatory mechanism of FaGST genes, the putative promoter regions (2 Kb upstream of the ATG codon) of FaGST genes were submitted to the PlantCARE database. As results (Figure 9, supplementary Table S3), a large number of cis-regulatory elements involved in light responsive were identified in the five FaGST genes. For example, a total of 17, 13, 10, 6, and 16 light responsive elements (such as Sp1, G-box, GATA-box etc.) were found in the promoter of FaSGT1, FaGST37, FaGST39, FaGST73, and FaGST97, respectively. Additionally, various regulatory elements involved in hormones responsive were identified. For instance, there were 3, 3, and 6 ABRE elements involved in the abscisic acid responsiveness in the promoter of FaGST1, FaGST37, and FaGST97 genes. Additionally, many cis-regulatory elements involved in abiotic stress responsiveness were also identified in the promoter of FaGST genes, including cis-regulatory element involved in low-temperature responsiveness and MYB binding site involved in drought-inducibility.

3. Discussion

3.1. Identification and Comprehensive Analysis of the Entire FaGST Genes

GST are encoded by a large superfamily in plants, while the amount of family members vary with species. Previously, 53, 61, and 49 GST genes were identified in Arabidopsis [34], Citrus [35], and melon [36], respectively, while only 32 GST genes were identified from pumpkin [37]. In the present study, 130 FaGST genes were found in the cultivated strawberry genome, indicating the GST family was expanded in strawberry. The expansion of gene families mainly occurred due to various types of gene duplication events such as segmental duplication, tandem duplication, transposition, and whole genome duplication [38]. Gene duplication is an important evolutionary mechanism providing a source of genetic material for the specialization [39,40]. Plant genome has an abundance of duplicate genes, the whole-genome duplication (WGD) also called polyploidization is an extreme mechanism of gene duplication that leads to an increase in both genome size and the entire gene set [41]. In this study, we found that the expansion of FaGST family was mainly driven by WGD/segmental duplication event, since 121 out of 130 FaGST were involved in WGD/segmental duplication. Our results also showed that the Ka/Ks of almost all the FaGST genes were below 1, indicating they were under stable selection. Subcellular localization studies provide potential information about the physiological context of protein function and significant role in the functional divergence of gene families [42]. Predictive subcellular localization analysis of strawberry GST proteins suggested that most of the FaGST proteins were cytoplasmic, few FaGST proteins were predicted to be localized in chloroplast, mitochondria, and nucleus. This is consistent with many other previous studies [38,43], suggesting the conservation of GST subcellular location and functions.
The presence of introns provides evolutionary protein diversity by increasing exon shuffling and alternative splicing [44]. It has been reported that a single intronic nucleotide mutation could provide changes in gene splicing patterns [45]. Our gene structure analysis indicated that each class of FaGST genes contained different numbers of introns, suggesting the divergence of alternative splicing of each class. Normally, the GST genes belonging to Tau and Phi class contained one-intron/two-exon, two-intron/three-exon structure in higher plants, respectively, while there was also some exceptions [43,46]. Similarly, here we found the most FaGST genes belonging to Tau class showed one-intron/two-exon structure pattern, while FaGST101, FaGST61, and FaGST46 presented four exons. In the Phi class, except FaGST18, FaGST115, FaGST51, FaGST91, FaGST73, and FaGST39 with more than three exons, the others were in two-intron/three-exon structure pattern. In addition, the catalytic function of GST family was shown to be controlled mainly by the residue in the N-terminal domain [47]. In the present study, the conserved motif analysis showed there were 20 FaGST genes that do not contain GST_N motif (motif 1 and 2), suggesting most FaGST genes were involved in catalytic function, which was validated in the subsequent gene ontology analysis. Interestingly, all the FaGST genes belonging to the GHR class contained no N-terminal GST domain, indicating they might have other functions than catalytic function.

3.2. Gene Ontology and Classification Revealed the Putative Anthocyanin-Related FaGST Genes

The GST genes are involved in multiple functions such as plant growth, stress responses, and detoxification of xenobiotics [48,49]. To investigate the potential functions of FaGST genes, gene ontology analysis was carried out in the present study. Consistent with the previous research, our results suggested that catalytic activity was the major MF category, indicating most FaGST genes were involved in various catalytic functions. Notably, secondary metabolic process was enriched in the BP, that gave us a clue that FaGST might participate in the secondary metabolic biological process. Recently, GST genes were also proven to be related to anthocyanin transportation [23], various anthocyanin-related GST genes have been clarified to date. They all belong to Phi subclass, except ZmBz2, a anthocyanin-related GST gene from maize, which was classified into Tau class [50,51]. Similar to other plant species, our phylogenetic analysis showed that 130 FaGST genes could be classified into seven subclasses in strawberry. In case of each class, Tau was the most numerous class with 66 members in strawberry, followed by Phi class. All the previous suggested anthocyanin-related GST genes were clustered into the same clade belonging to the Phi subclass, indicating the sequence conservation linked to specific functional requirements. Based on this theory, we noticed from our results that there were three FaGST genes included in this clade, making it possible that these genes were involved in vacular anthocyanin accumulation. We therefore included these three FaGST genes as putative anthocyanin-related FaGST genes in strawberry.

3.3. Expression and Correlation Analysis Confirmed the Involvement of FaGST in Strawberry Anthocyanins Accumulation

Anthocyanins belonging to the flavonoid class of compounds are synthesized in cytosol and then transferred to vacuole to exhibit the visible color. Several studies have already confirmed the involvement of GST genes in the transportation of anthocyanins. Moreover, it is known that anthocyanin-related GST genes and anthocyanin biosynthetic genes are coordinately expressed, consistent with anthocyanin accumulation. For instance, transcriptional profiling of VvGST4 in Vitis vinifera was similar to that of the anthocyanin pathway genes, CHS, DFR, and UFGT, indicative of coregulation [52]. In cyclamen, the expression pattern of CkmGST3 was also correlated with other anthocyanin biosynthetic genes such as CkmF3′5′H and CkmDFR2, consistent with the developmental stage of flavonoid accumulation tissues [26]. In Dracaena cambodiana, the expression of DcGST4, DcGSTU5, and DcGSTU9 were correlated to anthocyanin accumulation under inducer treatment, as well as the expression levels of eight anthocyanin biosynthetic structural genes and two regulatory genes [53]. In wildwood strawberry, RAP encoding a GST gene was developmentally regulated in expression during fruit coloration [30]. In this study, the expression of a number of FaGST genes were analyzed based on the reported RNAseq data. The results showed us that besides the three FaGST genes (FaGST1, FaGST39, and FaGST97) clustered into the anthocyanin-related clade, the expression of FaGST37 and FaGST73 largely increased at the IR stage, when the anthocyanin started accumulating (Figure 7), indicating the expression of these five genes might contribute to the strawberry coloring. This was validated by our subsequent correlation analysis, which showed that expression of these five FaGST genes was significantly correlated with anthocyanin accumulation during strawberry ripening except FaGST37. Furthermore, to validate the RNAseq expression data, these five FaGST genes, and randomly selected six other FaGST genes whose expression were unavailable in the RNAseq expression profiles for qPCR analysis were used. The results showed that all of the five putative anthocyanin-related FaGST genes showed the similar expression pattern with RNAse profiles, and the other six FaGST genes comprised continuous low expression levels at different developmental stages, except FaGST111, which showed a large increase at FR stage, indicating it might also be involved in strawberry anthocyanin accumulation. However, according to our correlation analysis, the expression of FaGST111 did not show any correlation neither with anthocyanin accumulation nor anthocyanin biosynthetic genes. In contrast, the expression of five FaGST genes (FaGST97, FaGST37, FaGST1, FaGST73, and FaGST39) were significantly correlated to those of structural genes (such as FaCHS, FaCHI, and FaANS), suggesting they are indeed involved in anthocyanin accumulation. Interestingly, among these five FaGST genes, only FaGST37 showed no significant correlation with anthocyanin accumulation, indicating it might also comprise other functions, which needs further research.

4. Materials and Methods

4.1. Plant Materials

Strawberry cultivar ‘Benihoppe’ were grown in a greenhouse located in Shuangliu, Sichuan province, China. The growth condition was controlled at 22 ± 2 °C, relative humidity 70–90%, 16/8-h light/dark regime. Fruits at three developmental stages were collected from at least 10–15 individual plants. The three developmental stages were defined as mature green (MG, ≈18 days post-anthesis, DPA), turning red (TR, ≈24 DPA), half red (HR, ≈28 DPA), and all red (AR, ≈31 DPA). A group of samples from each 3–5 individual plants were mixed as one biological replicate. All samples were grounded into powder in liquid nitrogen and stored at −80 °C until further use.

4.2. Identification and Comprehensive Analysis of FaGST Genes

The protein sequence of Arabidopsis GST (AT5G17220) downloaded from TAIR (https://www.arabidopsis.org/) was used as query to search against the genome database for strawberry [54] (GDR, https://www.rosaceae.org). The sequence with high score in the results was retrieved as potential GST paralogous in cultivated strawberry (FaGST). The number of amino acids, open reading frame (ORF) length, putative protein molecular weight (MW), and isoelectric point (pI) for each sequence were obtained using ExPASy ProtParam tool (http://web.expasy.org/protparam/). The conserved domains in the GST proteins were screened and annotated based on Pfam [55], NCBI CDD (http://www.ncbi.nlm.nih.gov/Structure/cdd/wrpsb.cgi) [56] and ProSITE databases. The exon–intron structure of the GSTs was analyzed using Gene Structure Display Server v.2.0 (http://gsds.cbi.pku.edu.cn/index.php) based on the alignment of their CDSs with corresponding genomic DNA sequences. To identify the conserved motifs of GST proteins, the MEME online program (http://meme-suite.org/tools/meme) was used with the following parameters: any number of repetition, maximum number of motifs was set as 10, and optimum motif length was set to 6–100 residues. The upstream 2 Kb sequences of each FaGST were retrieved from the corresponding genome as the putative promoter regions. The distribution of cis-element in the promoter regions were identified using PlantCARE online software (http://bioinformatics.psb.ugent.be/webtools/plantcare/html/). Gene ontology analysis was conducted by TBtools software.

4.3. Phylogenetic and Evolutionary Analysis of FaGST Genes in Strawberry

Phylogenetic tree of GST proteins was constructed using Clustal X v.2.0 and MEGA X software [57] with the neighbor-joining (NJ) method [58], 1000 bootstrap test replicates were chosen to evaluate the reliability of interior branches. The AtGST sequences used for alignment were downloaded from TAIR. The eight published anthocyanin-related GST were downloaded from NCBI with Genbank accession number AB362191 (PfGST), KT946768 (LcGST), AY971515 (VvGST4), AB682678 (CkmGST3), Y07721 (PhAN9), ABA42223 (CsGST4), AEN84869 (MdGST), and KT312848 (Raint2). Additionally FvRAP (gene10500) was downloaded from GDR database. The collinear gene pair was determined using MCScanX software (http://chibba.pgml.uga.edu/mcscan2/). Synonymous (Ks) and nonsynonymous (Ka) substitutions per site between duplicated FaGST genes pairs were subsequently calculated using KaKs Calculator v.1.2 software [59] based on the multiple alignment by MEGA X.

4.4. Expression Analysis of FaGST Genes in Strawberry

The RNAseq-based expression levels of FaGST genes in strawberry were retrieved from the online transcriptomic data (SRA accession: SRX6381727). qPCR-based expression analyses were carried out using SYBR Green Premix Ex TaqTM (Takara, Japan) on a CFX96 qPCR system (Bio-Rad, USA) in triplicate of each sample. Fluorescence was monitored at the end of the annealing step each cycle. Melting curve was inserted, ramping from 65 to 95 °C (increment 0.5 °C/5 s) after the final cycle. The relative expression was calculated using the 2−ΔΔCt method [60]. Fa26S rRNA (accession: X58118) was used as the reference gene to standardize the raw data. All primers used for qPCR in the present study are listed in Table S4 (supplementary Table S4).

4.5. Measurement of Anthocyanins Content

The anthocyanins content was determined using HPLC based on previously described method [33]. A C18 column was used for HPLC experiment, 95% formic acid and methanol was used as mobile phases. Compound separations were achieved by a 20 min linear gradient (95–0%) of formic acid in methanol. A total of 10 μL of each sample was injected for HPLC analysis, the column temperature was kept at 25 °C, the flow rate was 1 mL/min, and chromatograms were recorded at 510 nm. The anthocyanins were quantified by compared to external standards. Experiments were repeated three times with three independent samples referring to the three biological replicates.

4.6. Statistical Analyses

All data presented here are represented by mean ± standard error of three independent biological replicates. The statistical significance of the difference was evaluated by Data Processing System (DPS) using Duncan’s multiple range test at p < 0.05.

5. Conclusions

In the present study, we identified 130 FaGST genes in the genome of cultivated strawberry. The subsequent classification and evolutionary analysis of FaGST revealed the FaGST1, FaGST97, and FaGST37 were closely clustered with the previous anthocyanin-related GST genes, indicating they were anthocyanins-related but it could not exclude the involvement of other GST genes in anthocyanins accumulation. Furthermore, the RNAseq-based expression analysis indicated the expression patterns of FaGST1, FaGST97, FaGST37, FaGST39, and FaGST73 were similar to the anthocyanin accumulation during strawberry fruit ripening. Finally, the qPCR validation and correlation analysis confirmed that the expression of FaGST1, FaGST97, FaGST39, and FaGST73 were significantly correlated with those of anthocyanin biosynthetic structural genes and anthocyanin accumulation, indicating they are involved in anthocyanin accumulation in strawberry.

Supplementary Materials

The following are available online at https://www.mdpi.com/1422-0067/21/22/8708/s1. Table S1. The basic information of FaGST genes in cultivated strawberry. Table S2. The coefficient value and p-value of correlation analysis. Table S3. Cis-regulatory elements identified in the putative anthocyanins-related FaGST genes. Table S4. Lists of all primers used for qPCR analysis in this study. Figure S1. Chrome distribution of FaGST genes in the cultivated strawberry genome.

Author Contributions

Conceived and designed the experiments: H.T. and Y.L. (Yuanxiu Lin) Performed the experiments: L.Z., J.Z. Analyzed the data: Y.L. (Yuanxiu Lin) Wrote the paper: Y.L. (Yuanxiu Lin) Revised the paper: Y.L. (Ya Luo), Y.Z. (Yunting Zhang), Q.C., M.L., Y.W., Y.Z. (Yong Zhang). and X.W. All authors have read and agreed to the published version of the manuscript.

Funding

This work was supported by the National Innovation Training Program for College Students (202010626049). The funding body had no role in the design of the study, collection, analysis, and interpretation of data, and writing the manuscript.

Acknowledgments

We thank College of Horticulture for providing the HPLC test system for AsA measurement in this study; we thank Institute of Pomology and Olericulture in Sichuan Agriculture University for providing the server to analysis the transcriptome data.

Conflicts of Interest

The authors declare that they have no conflict of interest.

References

  1. Pillet, J.; Folta, K.M. Pigments in Strawberry. In Pigments in Fruits and Vegetables; Chen, C., Ed.; Springer Science & Business Media: NewYork, NY, USA, 2015; pp. 205–216. [Google Scholar]
  2. Peña-Sanhueza, D.; Inostroza-Blancheteau, C.; Ribera-Fonseca, A.; Reyes-Díaz, M. Anthocyanins in Berries and Their Potential Use in Human Health. In Superfood and Functional Food-The Development of Superfoods and Their Roles as Medicine; Shiomi, N., Waisundara, V., Eds.; InTechOpen: London, UK, 2017; pp. 155–172. [Google Scholar]
  3. He, J.; Giusti, M.M. Anthocyanins: Natural colorants with health-promoting properties. Annu. Rev. Food Sci. Technol. 2010, 1, 163–187. [Google Scholar] [CrossRef] [PubMed]
  4. Winkelshirley, B. Biosynthesis of flavonoids and effects of stress. Curr. Opin. Plant Biol. 2002, 5, 218–223. [Google Scholar] [CrossRef]
  5. Han, Y.; Vimolmangkang, S.; Soria-Guerra, R.E.; Rosales-Mendoza, S.; Zheng, D.; Lygin, A.V.; Korban, S.S. Ectopic expression of apple F3′H genes contributes to anthocyanin accumulation in the Arabidopsis tt7 mutant grown under nitrogen stress. Plant. Physiol 2010, 153, 806–820. [Google Scholar] [CrossRef] [PubMed] [Green Version]
  6. Lin, X.; Xiao, M.; Luo, Y.; Wang, J.; Wang, H. The effect of RNAi-induced silencing of FaDFR on anthocyanin metabolism in strawberry (Fragaria × ananassa) fruit. Sci. Hortic. 2013, 160, 123–128. [Google Scholar] [CrossRef]
  7. Jiang, F.; Wang, J.-Y.; Jia, H.-F.; Jia, W.-S.; Wang, H.-Q.; Xiao, M. RNAi-mediated silencing of the flavanone 3-hydroxylase gene and its effect on flavonoid biosynthesis in strawberry fruit. J. Plant. Growth Regul. 2013, 32, 182–190. [Google Scholar] [CrossRef]
  8. Baudry, A.; Heim, M.A.; Dubreucq, B.; Caboche, M.; Weisshaar, B.; Lepiniec, L. TT2, TT8, and TTG1 synergistically specify the expression of BANYULS and proanthocyanidin biosynthesis in Arabidopsis thaliana. Plant. J. 2004, 39, 366–380. [Google Scholar] [CrossRef]
  9. Xu, W.; Dubos, C.; Lepiniec, L. Transcriptional control of flavonoid biosynthesis by MYB-bHLH-WDR complexes. Trends Plant. Sci. 2015, 20, 176–185. [Google Scholar] [CrossRef]
  10. Lin-Wang, K.; McGhie, T.K.; Wang, M.; Liu, Y.; Warren, B.; Storey, R.; Espley, R.V.; Allan, A.C. Engineering the anthocyanin regulatory complex of strawberry (Fragaria vesca). Front. Plant. Sci. 2014, 5, 651. [Google Scholar] [CrossRef] [Green Version]
  11. Medina-Puche, L.; Cumplido-Laso, G.; Amil-Ruiz, F.; Hoffmann, T.; Ring, L.; Rodríguez-Franco, A.; Caballero, J.L.; Schwab, W.; Muñoz-Blanco, J.; Blanco-Portales, R. MYB10 plays a major role in the regulation of flavonoid/phenylpropanoid metabolism during ripening of Fragaria × ananassa fruits. J. Exp. Bot. 2013, 65, 401–417. [Google Scholar] [CrossRef] [Green Version]
  12. Schaart, J.G.; Dubos, C.; Romero De La Fuente, I.; Houwelingen, A.M.; Vos, R.C.; Jonker, H.H.; Xu, W.; Routaboul, J.M.; Lepiniec, L.; Bovy, A.G. Identification and characterization of MYB-bHLH-WD40 regulatory complexes controlling proanthocyanidin biosynthesis in strawberry (Fragaria × ananassa) fruits. New Phytol. 2013, 197, 454–467. [Google Scholar] [CrossRef]
  13. Zhao, J.; Dixon, R.A. The ‘ins’ and ‘outs’ of flavonoid transport. Trends Plant. Sci. 2010, 15, 72–80. [Google Scholar] [CrossRef] [PubMed] [Green Version]
  14. Goodman, C.D.; Casati, P.; Walbot, V. A multidrug resistance-associated protein involved in anthocyanin transport in Zea mays. Plant. Cell 2004, 16, 1812–1826. [Google Scholar] [CrossRef] [PubMed] [Green Version]
  15. Gomez, C.; Terrier, N.; Torregrosa, L.; Vialet, S.; Fournier-Level, A.; Verries, C.; Souquet, J.-M.; Mazauric, J.-P.; Klein, M.; Cheynier, V. Grapevine MATE-type proteins act as vacuolar H+-dependent acylated anthocyanin transporters. Plant. Physiol. 2009, 150, 402–415. [Google Scholar] [CrossRef] [PubMed] [Green Version]
  16. Zhao, J.; Huhman, D.; Shadle, G.; He, X.-Z.; Sumner, L.W.; Tang, Y.; Dixon, R.A. MATE2 mediates vacuolar sequestration of flavonoid glycosides and glycoside malonates in Medicago truncatula. Plant. Cell 2011, 23, 1536–1555. [Google Scholar] [CrossRef] [Green Version]
  17. Marinova, K.; Pourcel, L.; Weder, B.; Schwarz, M.; Barron, D.; Routaboul, J.-M.; Debeaujon, I.; Klein, M. The Arabidopsis MATE transporter TT12 acts as a vacuolar flavonoid/H+-antiporter active in proanthocyanidin-accumulating cells of the seed coat. Plant. Cell 2007, 19, 2023–2038. [Google Scholar] [CrossRef] [Green Version]
  18. Francisco, R.M.; Regalado, A.; Ageorges, A.; Burla, B.J.; Bassin, B.; Eisenach, C.; Zarrouk, O.; Vialet, S.; Marlin, T.; Chaves, M.M. ABCC1, an ATP binding cassette protein from grape berry, transports anthocyanidin 3-O-glucosides. Plant. Cell 2013, 25, 1840–1854. [Google Scholar] [CrossRef] [Green Version]
  19. Muñoz, C.; Hoffmann, T.; Escobar, N.M.; Ludemann, F.; Botella, M.A.; Valpuesta, V.; Schwab, W. The strawberry fruit Fra a allergen functions in flavonoid biosynthesis. Mol. Plant. 2010, 3, 113–124. [Google Scholar] [CrossRef]
  20. Loyall, L.; Uchida, K.; Braun, S.; Furuya, M.; Frohnmeyer, H. Glutathione and a UV light–induced glutathione S-transferase are involved in signaling to chalcone synthase in cell cultures. Plant. Cell 2000, 12, 1939–1950. [Google Scholar]
  21. Agrawal, G.K.; Jwa, N.-S.; Rakwal, R. A pathogen-induced novel rice (Oryza sativa L.) gene encodes a putative protein homologous to type II glutathione S-transferases. Plant. Sci. 2002, 163, 1153–1160. [Google Scholar] [CrossRef]
  22. Liu, Y.-J.; Han, X.-M.; Ren, L.-L.; Yang, H.-L.; Zeng, Q.-Y. Functional divergence of the glutathione S-transferase supergene family in Physcomitrella patens reveals complex patterns of large gene family evolution in land plants. Plant. Physiol. 2013, 161, 773–786. [Google Scholar] [CrossRef] [Green Version]
  23. Kitamura, S.; Shikazono, N.; Tanaka, A. TRANSPARENT TESTA 19 is involved in the accumulation of both anthocyanins and proanthocyanidins in Arabidopsis. Plant. J. 2004, 37, 104–114. [Google Scholar] [CrossRef] [PubMed]
  24. Mueller, L.A.; Goodman, C.D.; Silady, R.A.; Walbot, V. AN9, a petunia glutathione S-transferase required for anthocyanin sequestration, is a flavonoid-binding protein. Plant. Physiol. 2000, 123, 1561–1570. [Google Scholar] [CrossRef] [PubMed] [Green Version]
  25. Pérez-Díaz, R.; Madrid-Espinoza, J.; Salinas-Cornejo, J.; González-Villanueva, E.; Ruiz-Lara, S. Differential roles for VviGST1, VviGST3, and VviGST4 in proanthocyanidin and anthocyanin transport in Vitis vinifera. Front. Plant. Sci. 2016, 7, 1166. [Google Scholar] [CrossRef] [PubMed] [Green Version]
  26. Kitamura, S.; Akita, Y.; Ishizaka, H.; Narumi, I.; Tanaka, A. Molecular characterization of an anthocyanin-related glutathione S-transferase gene in cyclamen. J. Plant. Physiol. 2012, 169, 636–642. [Google Scholar] [CrossRef] [PubMed]
  27. Hu, B.; Zhao, J.; Lai, B.; Qin, Y.; Wang, H.; Hu, G. LcGST4 is an anthocyanin-related glutathioneS-transferase gene in Litchi chinensis Sonn. Plant. Cell Rep. 2016, 35, 831–843. [Google Scholar] [CrossRef]
  28. El-Sharkawy, I.; Liang, D.; Xu, K. Transcriptome analysis of an apple (Malus × domestica) yellow fruit somatic mutation identifies a gene network module highly associated with anthocyanin and epigenetic regulation. J. Exp. Bot. 2015, 66, 7359–7376. [Google Scholar] [CrossRef] [Green Version]
  29. Cheng, J.; Liao, L.; Zhou, H.; Gu, C.; Wang, L.; Han, Y. A small indel mutation in an anthocyanin transporter causes variegated colouration of peach flowers. J. Exp. Bot. 2015, 66, 7227–7239. [Google Scholar] [CrossRef] [Green Version]
  30. Luo, H.; Dai, C.; Li, Y.; Feng, J.; Liu, Z.; Kang, C. Reduced Anthocyanins in Petioles codes for a GST anthocyanin transporter that is essential for the foliage and fruit coloration in strawberry. J. Exp. Bot. 2018, 69, 2595–2608. [Google Scholar] [CrossRef] [Green Version]
  31. Sondheimer, E.; Karash, C.B. The Major Anthocyanin Pigments of the Wild Strawberry (Fragaria vesca). Nature 1956, 178, 648–649. [Google Scholar] [CrossRef]
  32. Wang, S.Y.; Zheng, W.; Galletta, G.J. Cultural system affects fruit quality and antioxidant capacity in strawberries. J. Agric. Food Chem. 2002, 50, 6534–6542. [Google Scholar] [CrossRef]
  33. Donno, D.; Cavanna, M.; Beccaro, G.; Mellano, M.; Torello-Marinoni, D.; Cerutti, A.; Bounous, G. Currants and strawberries as bioactive compound sources: Determination of antioxidant profiles with HPLC-DAD/MS. J. Appl. Bot. Food Qual. 2013, 86, 1–10. [Google Scholar]
  34. Sappl, P.G.; Carroll, A.J.; Clifton, R.; Lister, R.; Whelan, J.; Harvey Millar, A.; Singh, K.B. The Arabidopsisglutathione transferase gene family displays complex stress regulation and co-silencing multiple genes results in altered metabolic sensitivity to oxidative stress. Plant. J. 2009, 58, 53–68. [Google Scholar] [CrossRef] [PubMed]
  35. Licciardello, C.; D’Agostino, N.; Traini, A.; Recupero, G.R.; Frusciante, L.; Chiusano, M.L. Characterization of the glutathione S-transferase gene family through ESTs and expression analyses within common and pigmented cultivars of Citrus sinensis (L.) Osbeck. BMC Plant. Biol. 2014, 14, 39. [Google Scholar] [CrossRef] [PubMed] [Green Version]
  36. Wang, J.; Zhang, Z.; Wu, J.; Han, X.; Wang-Pruski, G.; Zhang, Z. Genome-wide identification, characterization, and expression analysis related to autotoxicity of the GST gene family in Cucumis melo L. Plant. Physiol. Biochem. 2020, 155, 59–69. [Google Scholar] [CrossRef] [PubMed]
  37. Kayum, A.; Nath, U.K.; Park, J.-I.; Biswas, M.K.; Choi, E.K.; Song, J.-Y.; Kim, H.-T.; Nou, I.-S. Genome-wide identification, characterization, and expression profiling of glutathione S-transferase (GST) family in pumpkin reveals likely role in cold-stress tolerance. Genes 2018, 9, 84. [Google Scholar] [CrossRef] [Green Version]
  38. Islam, M.S.; Choudhury, M.; Majlish, A.-N.K.; Islam, T.; Ghosh, A. Comprehensive genome-wide analysis of glutathione S-transferase gene family in potato (Solanum tuberosum L.) and their expression profiling in various anatomical tissues and perturbation conditions. Gene 2018, 639, 149–162. [Google Scholar] [CrossRef]
  39. Proulx, S.R. Multiple routes to subfunctionalization and gene duplicate specialization. Genetics 2012, 190, 737–751. [Google Scholar] [CrossRef] [Green Version]
  40. Magadum, S.; Murugan, P.; Gangapur, D.; Ravikesavan, R. Gene duplication as a major force in evolution. J. Genet. 2013, 92, 155–161. [Google Scholar] [CrossRef]
  41. Panchy, N.; Lehti-Shiu, M.; Shiu, S.H. Evolution of Gene Duplication in Plants. Plant. Physiol. 2016, 171, 2294–2316. [Google Scholar] [CrossRef] [Green Version]
  42. Marques, A.C.; Vinckenbosch, N.; Brawand, D.; Kaessmann, H. Functional diversification of duplicate genes through subcellular adaptation of encoded proteins. Genome Biol. 2008, 9, R54. [Google Scholar] [CrossRef] [Green Version]
  43. Vaish, S.; Awasthi, P.; Tiwari, S.; Tiwari, S.K.; Gupta, D.; Basantani, M.K. In silico genome-wide identification and characterization of the glutathione S-transferase gene family in Vigna radiata. Genome 2018, 61, 311–322. [Google Scholar] [CrossRef] [PubMed] [Green Version]
  44. Long, M.; Deutsch, M. Association of intron phases with conservation at splice site sequences and evolution of spliceosomal introns. Mol. Biol. Evol. 1999, 16, 1528–1534. [Google Scholar] [CrossRef] [PubMed] [Green Version]
  45. Hsiao, Y.-H.E.; Bahn, J.H.; Lin, X.; Chan, T.-M.; Wang, R.; Xiao, X. Alternative splicing modulated by genetic variants demonstrates accelerated evolution regulated by highly conserved proteins. Genome Res. 2016, 26, 440–450. [Google Scholar] [CrossRef] [PubMed] [Green Version]
  46. Labrou, N.E.; Papageorgiou, A.C.; Pavli, O.; Flemetakis, E. Plant GSTome: Structure and functional role in xenome network and plant stress response. Curr. Opin. Biotechnol. 2015, 32, 186–194. [Google Scholar] [CrossRef]
  47. Nishida, M.; Harada, S.; Noguchi, S.; Satow, Y.; Inoue, H.; Takahashi, K. Three-dimensional structure of Escherichia coli glutathione S-transferase complexed with glutathione sulfonate: Catalytic roles of Cys10 and His106. J. Mol. Biol 1998, 281, 135–147. [Google Scholar] [CrossRef]
  48. Oakley, A.J. Glutathione transferases: New functions. Curr. Opin. Struct. Biol. 2005, 15, 716–723. [Google Scholar] [CrossRef]
  49. Dixon, D.P.; Skipsey, M.; Edwards, R. Roles for glutathione transferases in plant secondary metabolism. Phytochemistry 2010, 71, 338–350. [Google Scholar] [CrossRef]
  50. Marrs, K.A.; Alfenito, M.R.; Lloyd, A.M.; Walbot, V. A glutathione S-transferase involved in vacuolar transfer encoded by the maize gene Bronze-2. Nature 1995, 375, 397–400. [Google Scholar] [CrossRef]
  51. Larsen, E.; Alfenito, M.; Briggs, W.; Walbot, V. A carnation anthocyanin mutant is complemented by the glutathione S-transferases encoded by maize Bz2 and petunia An9. Plant. Cell Rep. 2003, 21, 900–904. [Google Scholar] [CrossRef]
  52. Conn, S.; Curtin, C.; Bézier, A.; Franco, C.; Zhang, W. Purification, molecular cloning, and characterization of glutathione S-transferases (GSTs) from pigmented Vitis vinifera L. cell suspension cultures as putative anthocyanin transport proteins. J. Exp. Bot. 2008, 59, 3621–3634. [Google Scholar] [CrossRef] [Green Version]
  53. Zhu, J.-H.; Li, H.-L.; Guo, D.; Wang, Y.; Dai, H.-F.; Mei, W.-L.; Peng, S.-Q. Transcriptome-wide identification and expression analysis of glutathione S-transferase genes involved in flavonoids accumulation in Dracaena cambodiana. Plant. Physiol. Biochem. 2016, 104, 304–311. [Google Scholar] [CrossRef] [PubMed]
  54. Jung, S.; Lee, T.; Cheng, C.-H.; Buble, K.; Zheng, P.; Yu, J.; Humann, J.; Ficklin, S.P.; Gasic, K.; Scott, K.; et al. 15 years of GDR: New data and functionality in the Genome Database for Rosaceae. Nucleic Acids Res. 2019, 47, D1137–D1145. [Google Scholar] [CrossRef] [PubMed] [Green Version]
  55. Finn, R.D.; Coggill, P.; Eberhardt, R.Y.; Eddy, S.R.; Mistry, J.; Mitchell, A.L.; Potter, S.C.; Punta, M.; Qureshi, M.; Sangradorvegas, A. The Pfam protein families database: Towards a more sustainable future. Nucleic Acids Res. 2016, 44, D279–D285. [Google Scholar] [CrossRef] [PubMed]
  56. Aron, M.B.; Shennan, L.; Anderson, J.B.; Farideh, C.; Derbyshire, M.K.; Carol, D.W.S.; Fong, J.H.; Geer, L.Y.; Geer, R.C.; Gonzales, N.R. CDD: A Conserved Domain Database for the functional annotation of proteins. Nucleic Acids Res. 2011, 39, D225–D229. [Google Scholar]
  57. Kumar, S.; Stecher, G.; Tamura, K. MEGA7: Molecular Evolutionary Genetics Analysis Version 7.0 for Bigger Datasets. Mol. Biol. Evol. 2016, 33, 1870–1874. [Google Scholar] [CrossRef] [PubMed] [Green Version]
  58. Saitou, N.; Nei, M. The neighbor-joining method: A new method for reconstructing phylogenetic trees. Mol. Biol. Evol. 1987, 4, 406–425. [Google Scholar] [PubMed]
  59. Zhang, Z.; Li, J.; Zhao, X.Q.; Wang, J.; Wong, K.S.; Yu, J. KaKs_Calculator: Calculating Ka and Ks Through Model Selection and Model Averaging. Genom. Proteom. Bioinform. 2006, 4, 259–263. [Google Scholar] [CrossRef] [Green Version]
  60. Livak, K.J.; Schmittgen, T.D. Analysis of Relative Gene Expression Data Using Real-Time Quantitative PCR and the 2−ΔΔCT Method. Methods 2001, 25, 402–408. [Google Scholar] [CrossRef]
Figure 1. GO ontology of 130 FaGST genes. The vertical axis indicates the GO terms, the horizontal axis indicates the gene numbers in each term. The different colors of the bars indicate different GO categories.
Ijms 21 08708 g001
Figure 2. Phylogenetic tree constructed with 130 FaGST protein sequences with the GST from Arabidopsis. The tree was constructed using MEGA X with neighbor-join method. The red and black nodes indicated GST genes from strawberry and Arabidopsis. Different colored branches indicate different subclasses of GST genes, the highlighted branch indicates the anthocyanin-related GST genes as previously proved.
Ijms 21 08708 g002
Figure 3. Exon–intron structures of FaGST genes. The cladogram was constructed by MEGA X software using the full-length of FaGST proteins. The exons and introns were represented by yellow blocks and black lines, respectively, the green blocks indicated the 5′ and 3′ UTR of the FaGST genes. Different colors indicated the different GST classes.
Ijms 21 08708 g003
Figure 4. Distribution of the conserved and potential motifs of FaGST proteins. Each motif is represented by colored rectangular box. The core sequence and number of each motif is shown in the black box.
Ijms 21 08708 g004
Figure 5. Expression profiles of FaGST genes at different developmental stages. RNA-seq based expression profiles corresponding to 87 FaGST genes were retrieved from the published RNAseq data (Accession: SRX6381726). The heatmap represented the log2 FPKM value of FaGST genes.
Ijms 21 08708 g005
Figure 6. The qPCR-based expression levels of selected FaGST genes at different developmental stages. The horizontal axis indicated different developmental stages, MG, mature green; IR, initial red; FR, full red. The bars represented the relative expression of each gene, error bars indicated the standard deviation of three biological replicates. The expression of each gene was normalized against the value at MG stage.
Ijms 21 08708 g006
Figure 7. The qPCR-based expression levels of anthocyanin biosynthetic genes and anthocyanin content during fruit ripening. The expression of genes was normalized against the value at MG stage. Horizontal axis indicates the different developmental stages, vertical axis indicates the relative expression. MG, mature green; IR, initial red; HR, half red; FR, full red. Error bars indicate the standard deviation of three biological replicates.
Ijms 21 08708 g007
Figure 8. The correlation analysis of selected putative anthocyanin-related FaGST genes, anthocyanin biosynthetic/regulatory genes, and anthocyanin content. Dots indicate the significant correlation (Pearson test, p-value < 0.05), blank indicates the insignificant correlation. Color from red to blue indicates the correlation coefficient ranging from −1 to 1.
Ijms 21 08708 g008
Figure 9. Cis-regulatory elements found in the putative anthocyanin-related FaGST genes. All the elements were classified into three groups involved in abiotic stress, growth, and development, and phytohormone responsiveness based on the functional annotation.
Ijms 21 08708 g009
Table 1. Ka/Ks of glutathione S-transferase (GST) paralog genes from cultivated strawberry.
Gene1Gene2KaKsKa/Ksp-Value (Fisher)
FaGST25FaGST930.002003170.1137470.01761081.06 × 10−9
FaGST2FaGST1000.001652730.0483330.03419461.84 × 10−5
FaGST12FaGST1140.003755050.08321490.04512473.23 × 10−7
FaGST25FaGST1230.008045940.05848780.1375660.00106652
FaGST12FaGST810.003755050.02463550.1524240.0300419
FaGST6FaGST420.02446880.1430110.1710976.23 × 10−7
FaGST46FaGST780.004925590.028140.1750390.0651319
FaGST79FaGST1110.007876150.04397950.1790870.00889461
FaGST34FaGST960.01025660.05603550.1830370.00310094
FaGST26FaGST760.02025910.1098090.1844946.95 × 10−19
FaGST13FaGST470.1731260.8861790.1953624.53 × 10−17
FaGST13FaGST790.186480.931190.200265.53 × 10−17
FaGST32FaGST400.007603640.03699720.2055190.00105106
FaGST18FaGST920.01040220.04975160.2090830.00447566
FaGST58FaGST940.3132431.485720.2108369.04 × 10−19
FaGST32FaGST1040.01643550.07602170.2161955.48 × 10−6
FaGST33FaGST1130.02801730.1285950.2178730.000335365
FaGST4FaGST440.04714410.2161880.218072.45 × 10−7
FaGST22FaGST540.305991.314950.2327018.57 × 10−16
FaGST71FaGST1250.02549990.09739650.2618150.000205114
FaGST15FaGST1120.01167520.04443170.2627660.0242682
FaGST29FaGST90.003827760.01420170.2695290.340562
FaGST29FaGST650.03332780.1225670.2719160.000450127
FaGST18FaGST1160.01132060.04111170.2753610.0294135
FaGST10FaGST660.003086790.01039460.296960.355313
FaGST38FaGST1050.01276750.04259230.299760.0330291
FaGST36FaGST570.02443370.07961250.3069080.00426484
FaGST16FaGST1070.01369690.04144320.3304970.0194532
FaGST20FaGST1180.3326740.9892920.3362741.33 × 10−10
FaGST15FaGST460.009877680.02820570.3502010.234251
FaGST18FaGST510.01459160.04106090.3553650.0477493
FaGST34FaGST670.04259440.1171620.3635510.00353968
FaGST26FaGST450.08273130.2263230.3655464.19 × 10−14
FaGST1FaGST370.02216090.05551560.3991840.124764
FaGST23FaGST740.01503720.03753680.4005980.0659631
FaGST36FaGST580.03378350.07767490.4349350.0314613
FaGST38FaGST730.007949790.01799580.4417580.281114
FaGST24FaGST1220.8842151.826130.4842030.000255179
FaGST24FaGST860.9191841.725770.5326230.000805302
FaGST11FaGST1240.04312610.07701740.5599530.117755
FaGST34FaGST1290.1716670.2921620.5875760.0453954
FaGST10FaGST1300.03032260.04929180.6151640.251029
FaGST13FaGST1100.05055420.08070710.6263920.190343
FaGST17FaGST1210.08546660.1343150.6363140.127269
FaGST11FaGST700.08949350.1393690.6421330.065153
FaGST6FaGST1010.03149430.04810560.654690.319248
FaGST31FaGST1030.05581960.0841810.663090.366314
FaGST19FaGST910.2863780.4218560.6788520.0104161
FaGST35FaGST950.01285580.01858470.6917390.499311
FaGST22FaGST880.07681750.1063940.722010.279675
FaGST30FaGST890.1776490.2431990.7304690.117698
FaGST35FaGST1260.01732470.02336820.741380.562354
FaGST10FaGST970.0837060.1113660.7516270.358856
FaGST12FaGST480.08442990.1113370.7583260.31708
FaGST52FaGST1190.2490630.3273410.7608680.178488
FaGST30FaGST520.2201050.2880240.7641890.168512
FaGST35FaGST710.02157990.02792840.7726870.603323
FaGST32FaGST750.1674230.2165940.7729810.131165
FaGST17FaGST870.01607920.02053360.7830690.683377
FaGST35FaGST1280.02084530.02558130.8148640.591106
FaGST50FaGST1150.03022070.0356570.847540.701964
FaGST1FaGST980.02864630.03269030.8762910.710666
FaGST27FaGST610.178270.1983280.8988620.724287
FaGST35FaGST680.0172730.01387361.245030.989446
Publisher’s Note: MDPI stays neutral with regard to jurisdictional claims in published maps and institutional affiliations.

