Kinome Array Profiling of Patient-Derived Pancreatic Ductal Adenocarcinoma Identifies Differentially Active Protein Tyrosine Kinases

 ,
, 
 , ,
, ,
Abstract
:
1. Introduction
2. Results
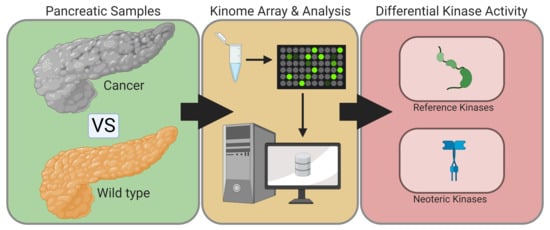
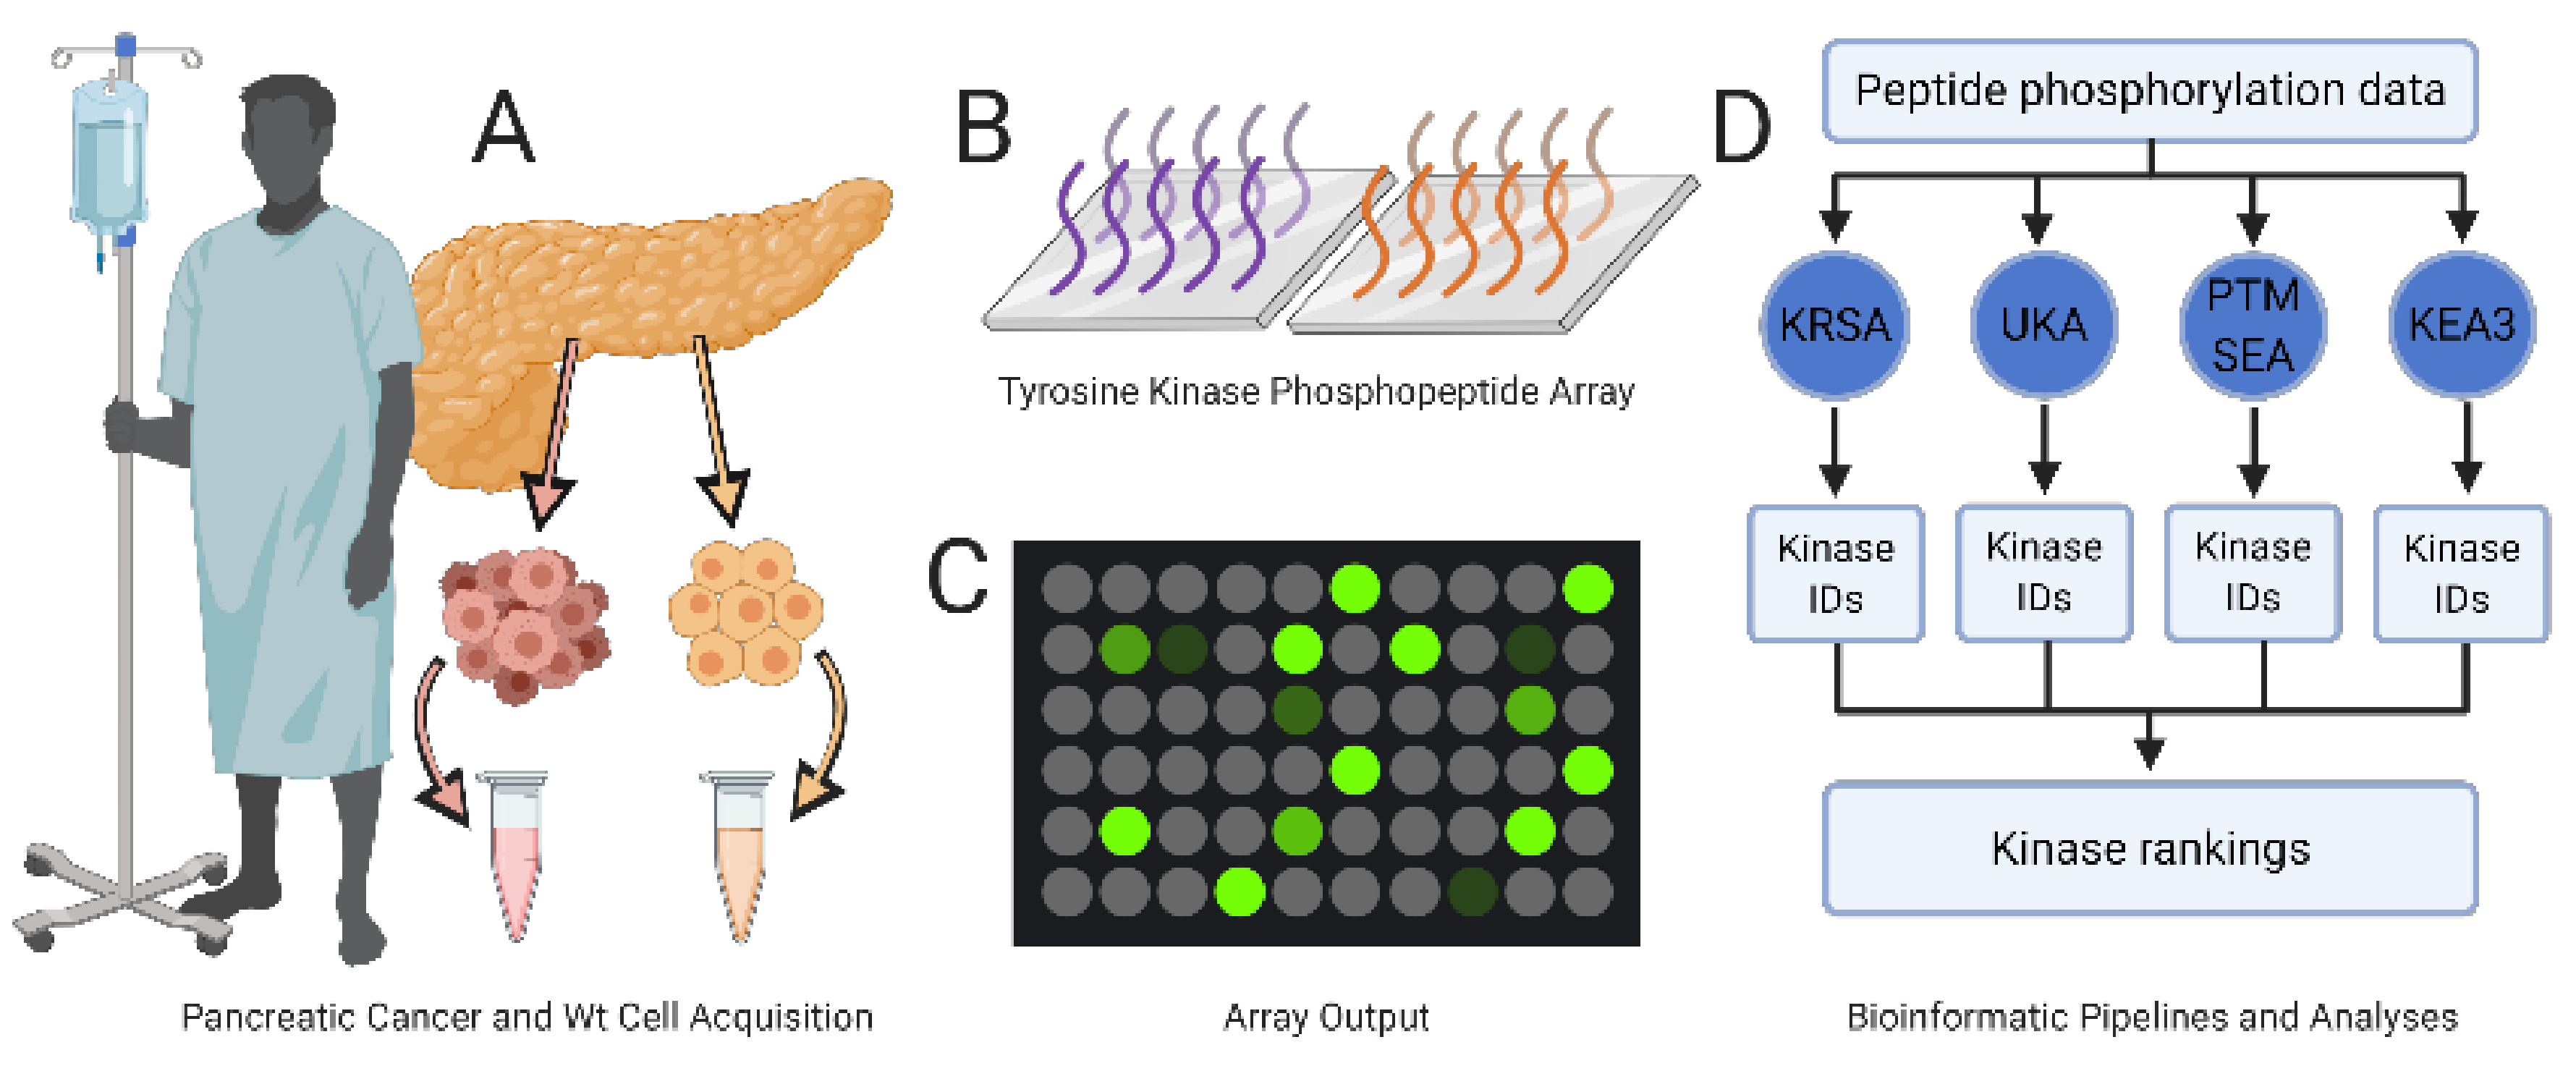
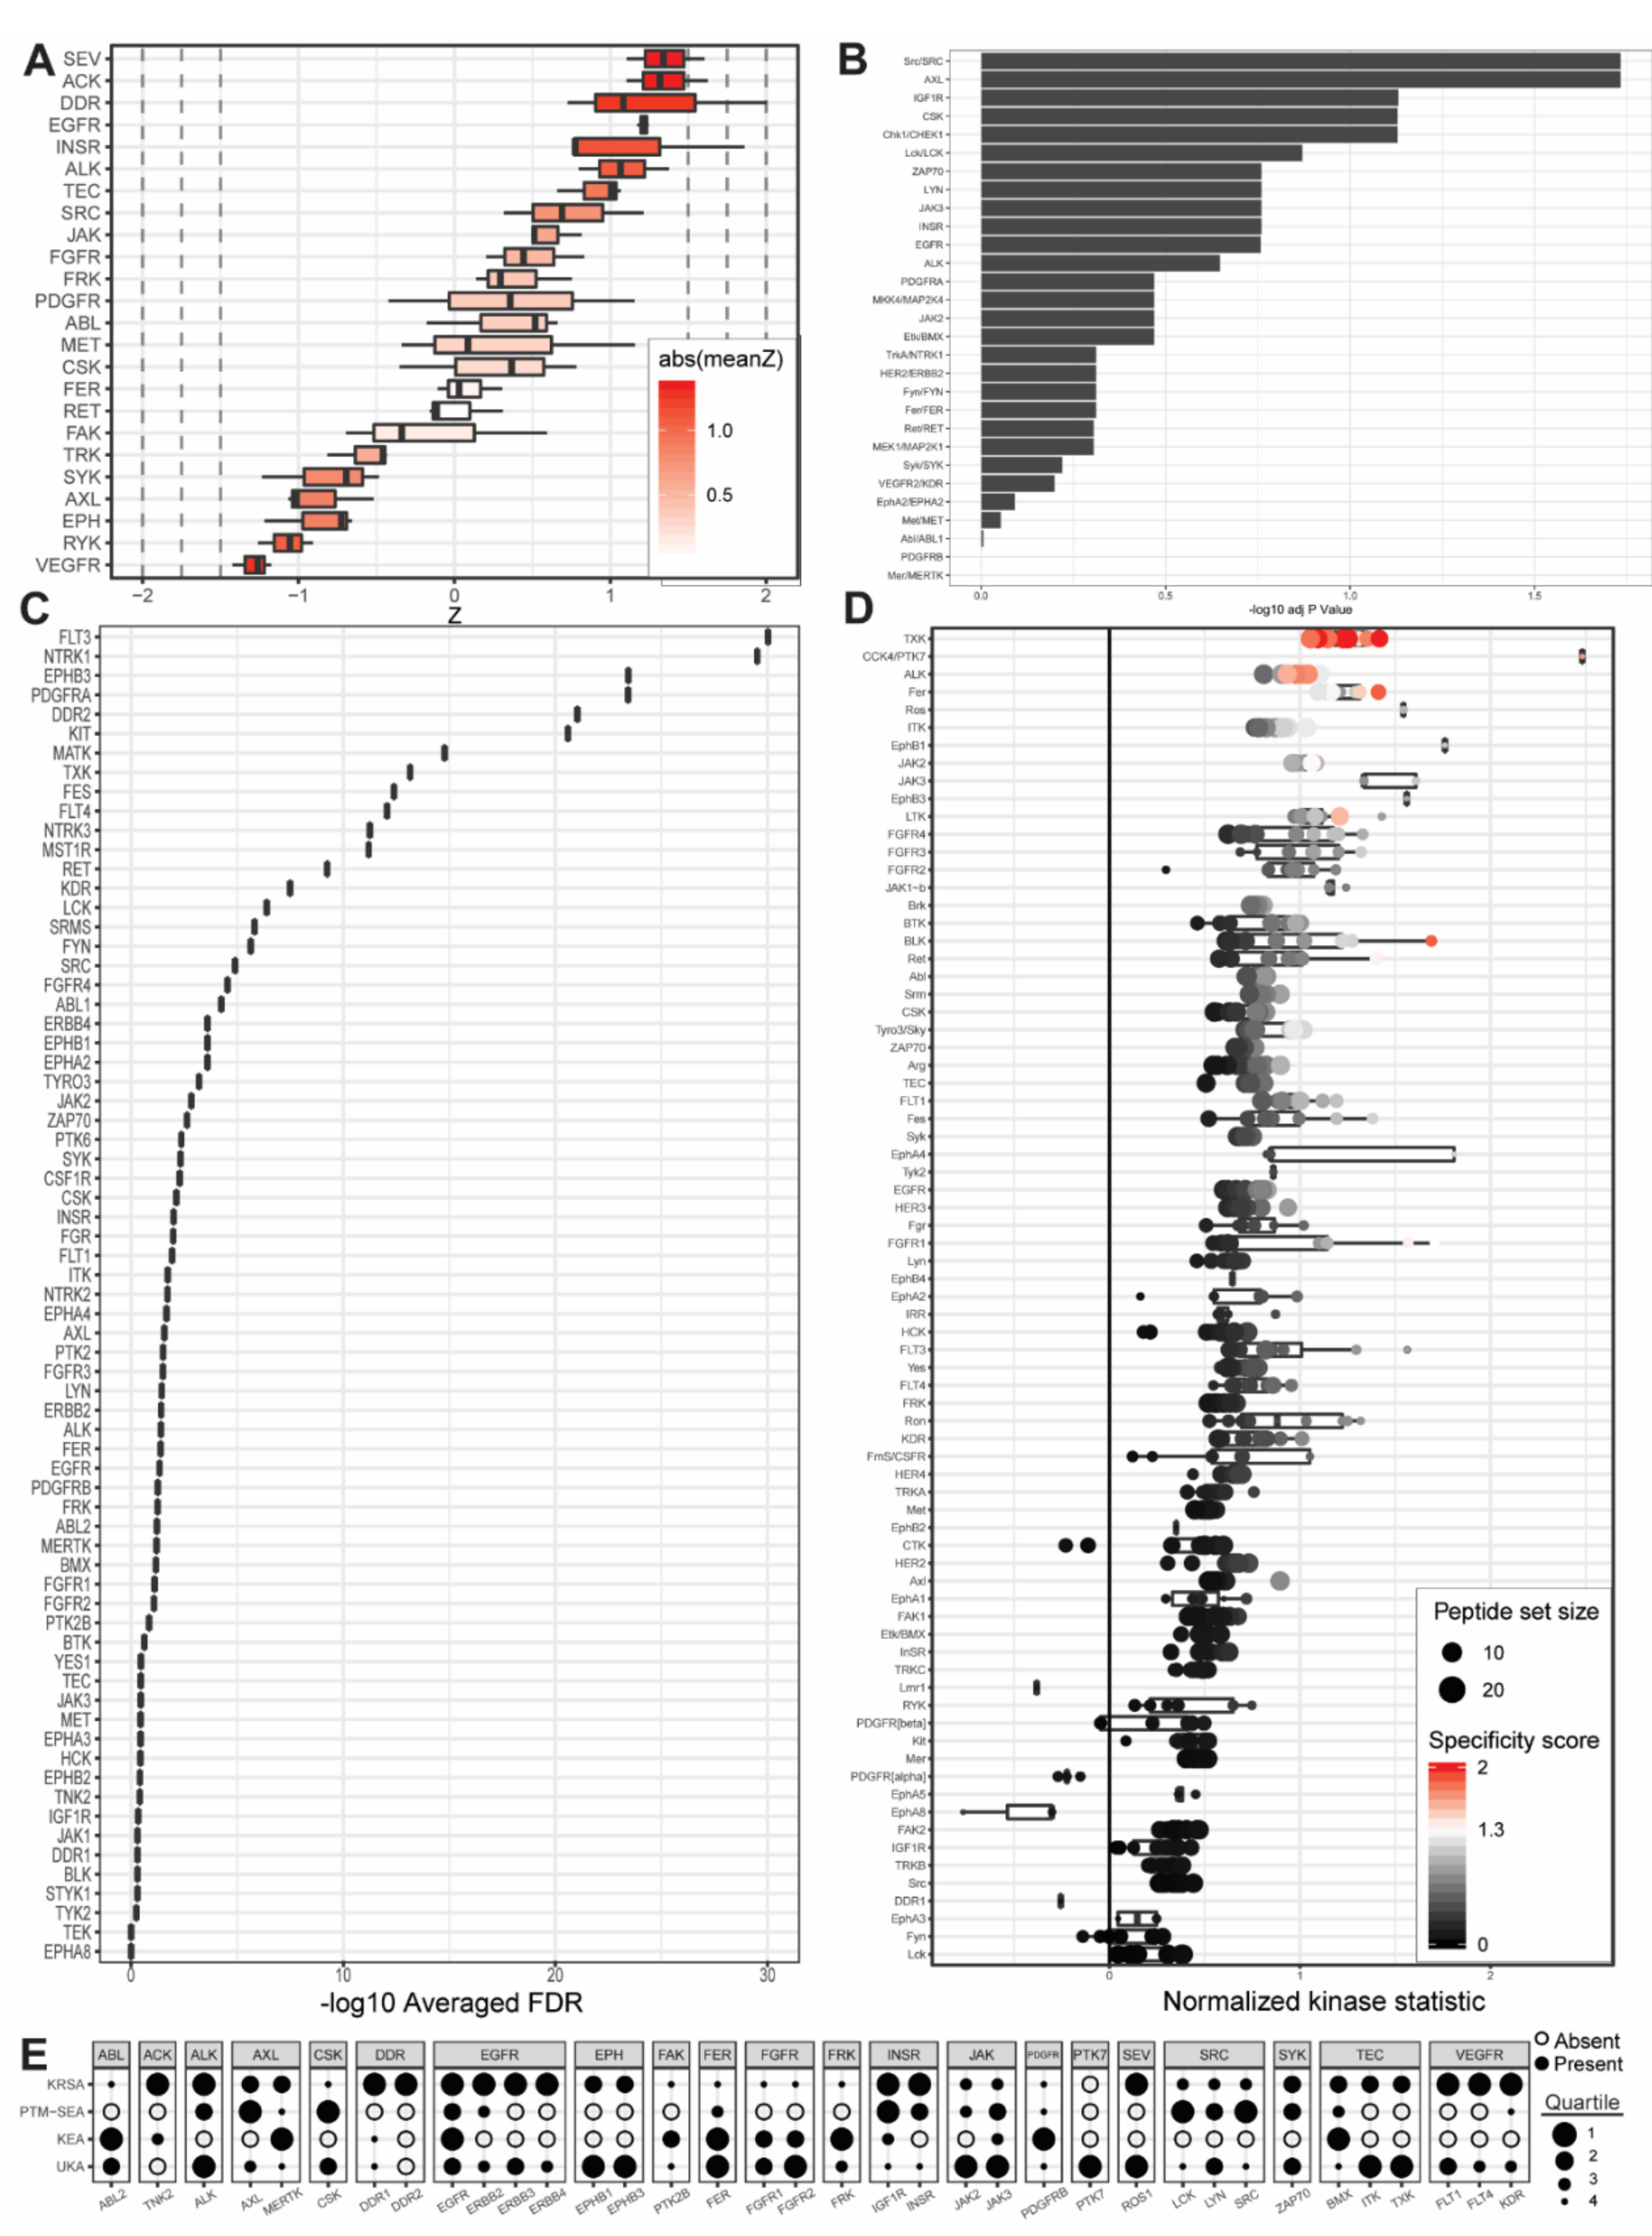
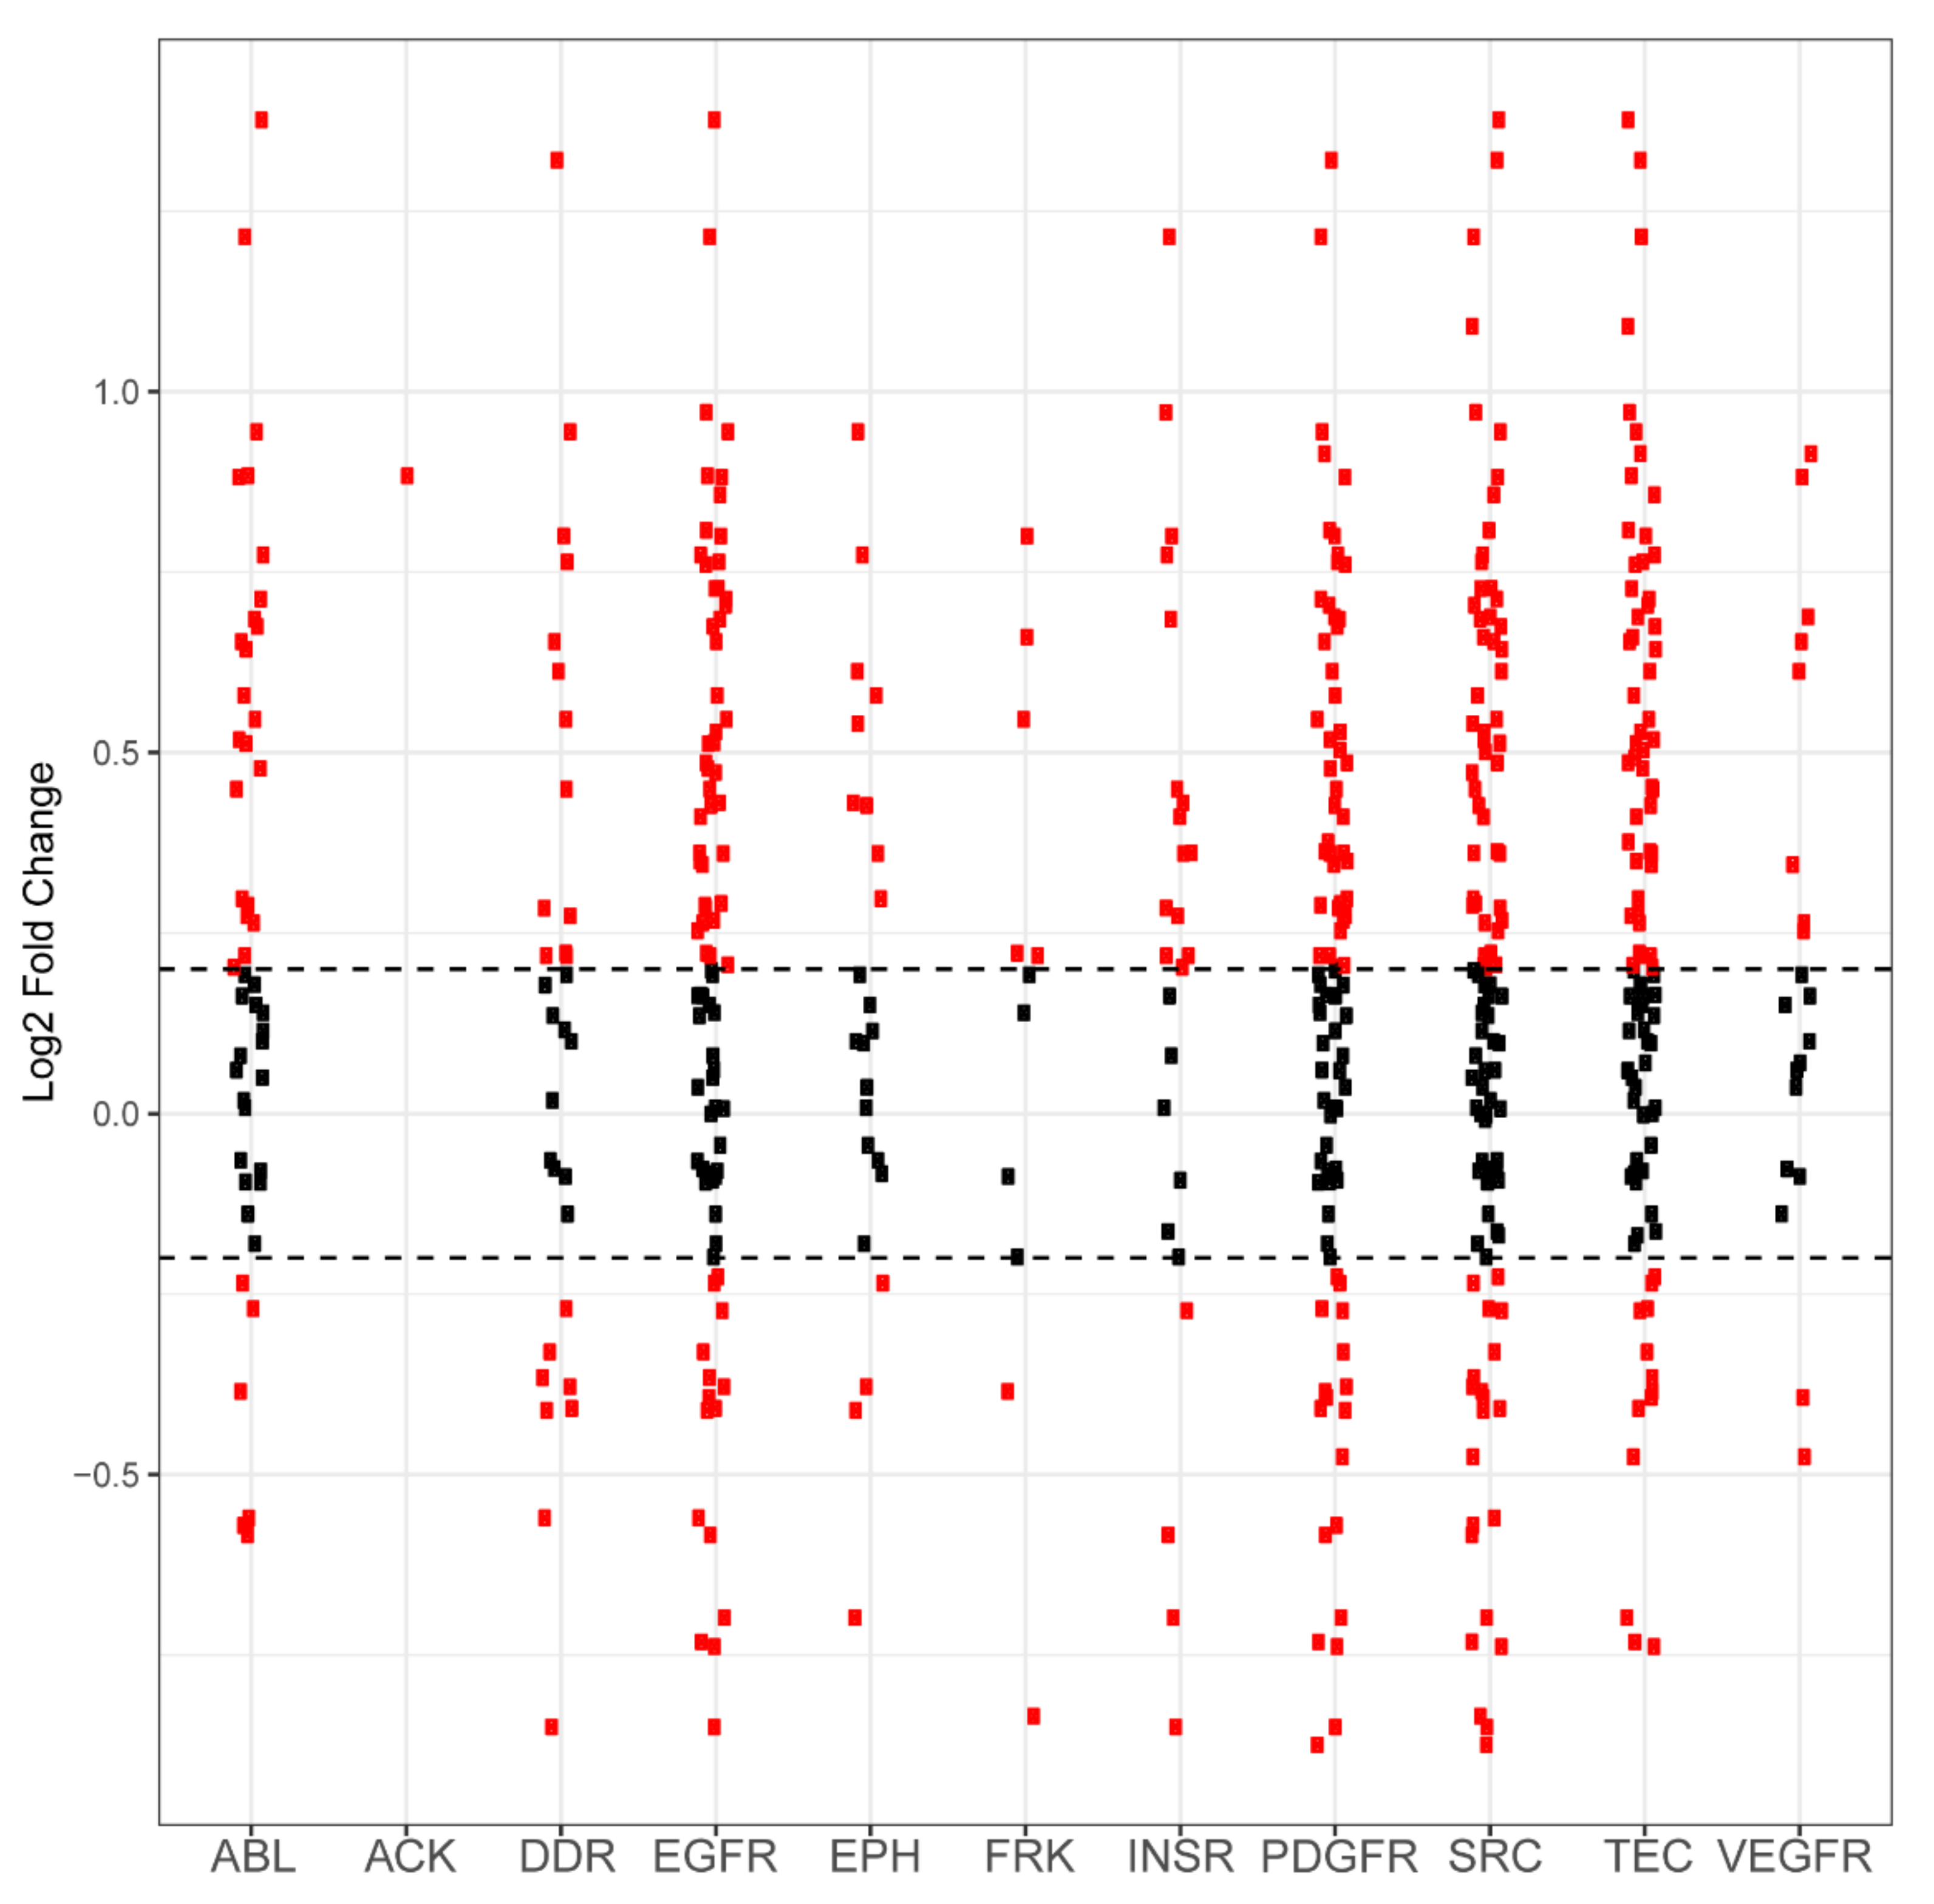
2.1. PamGene Kinome Activity Profiling Using Protein Tyrosine Kinase PamChip®
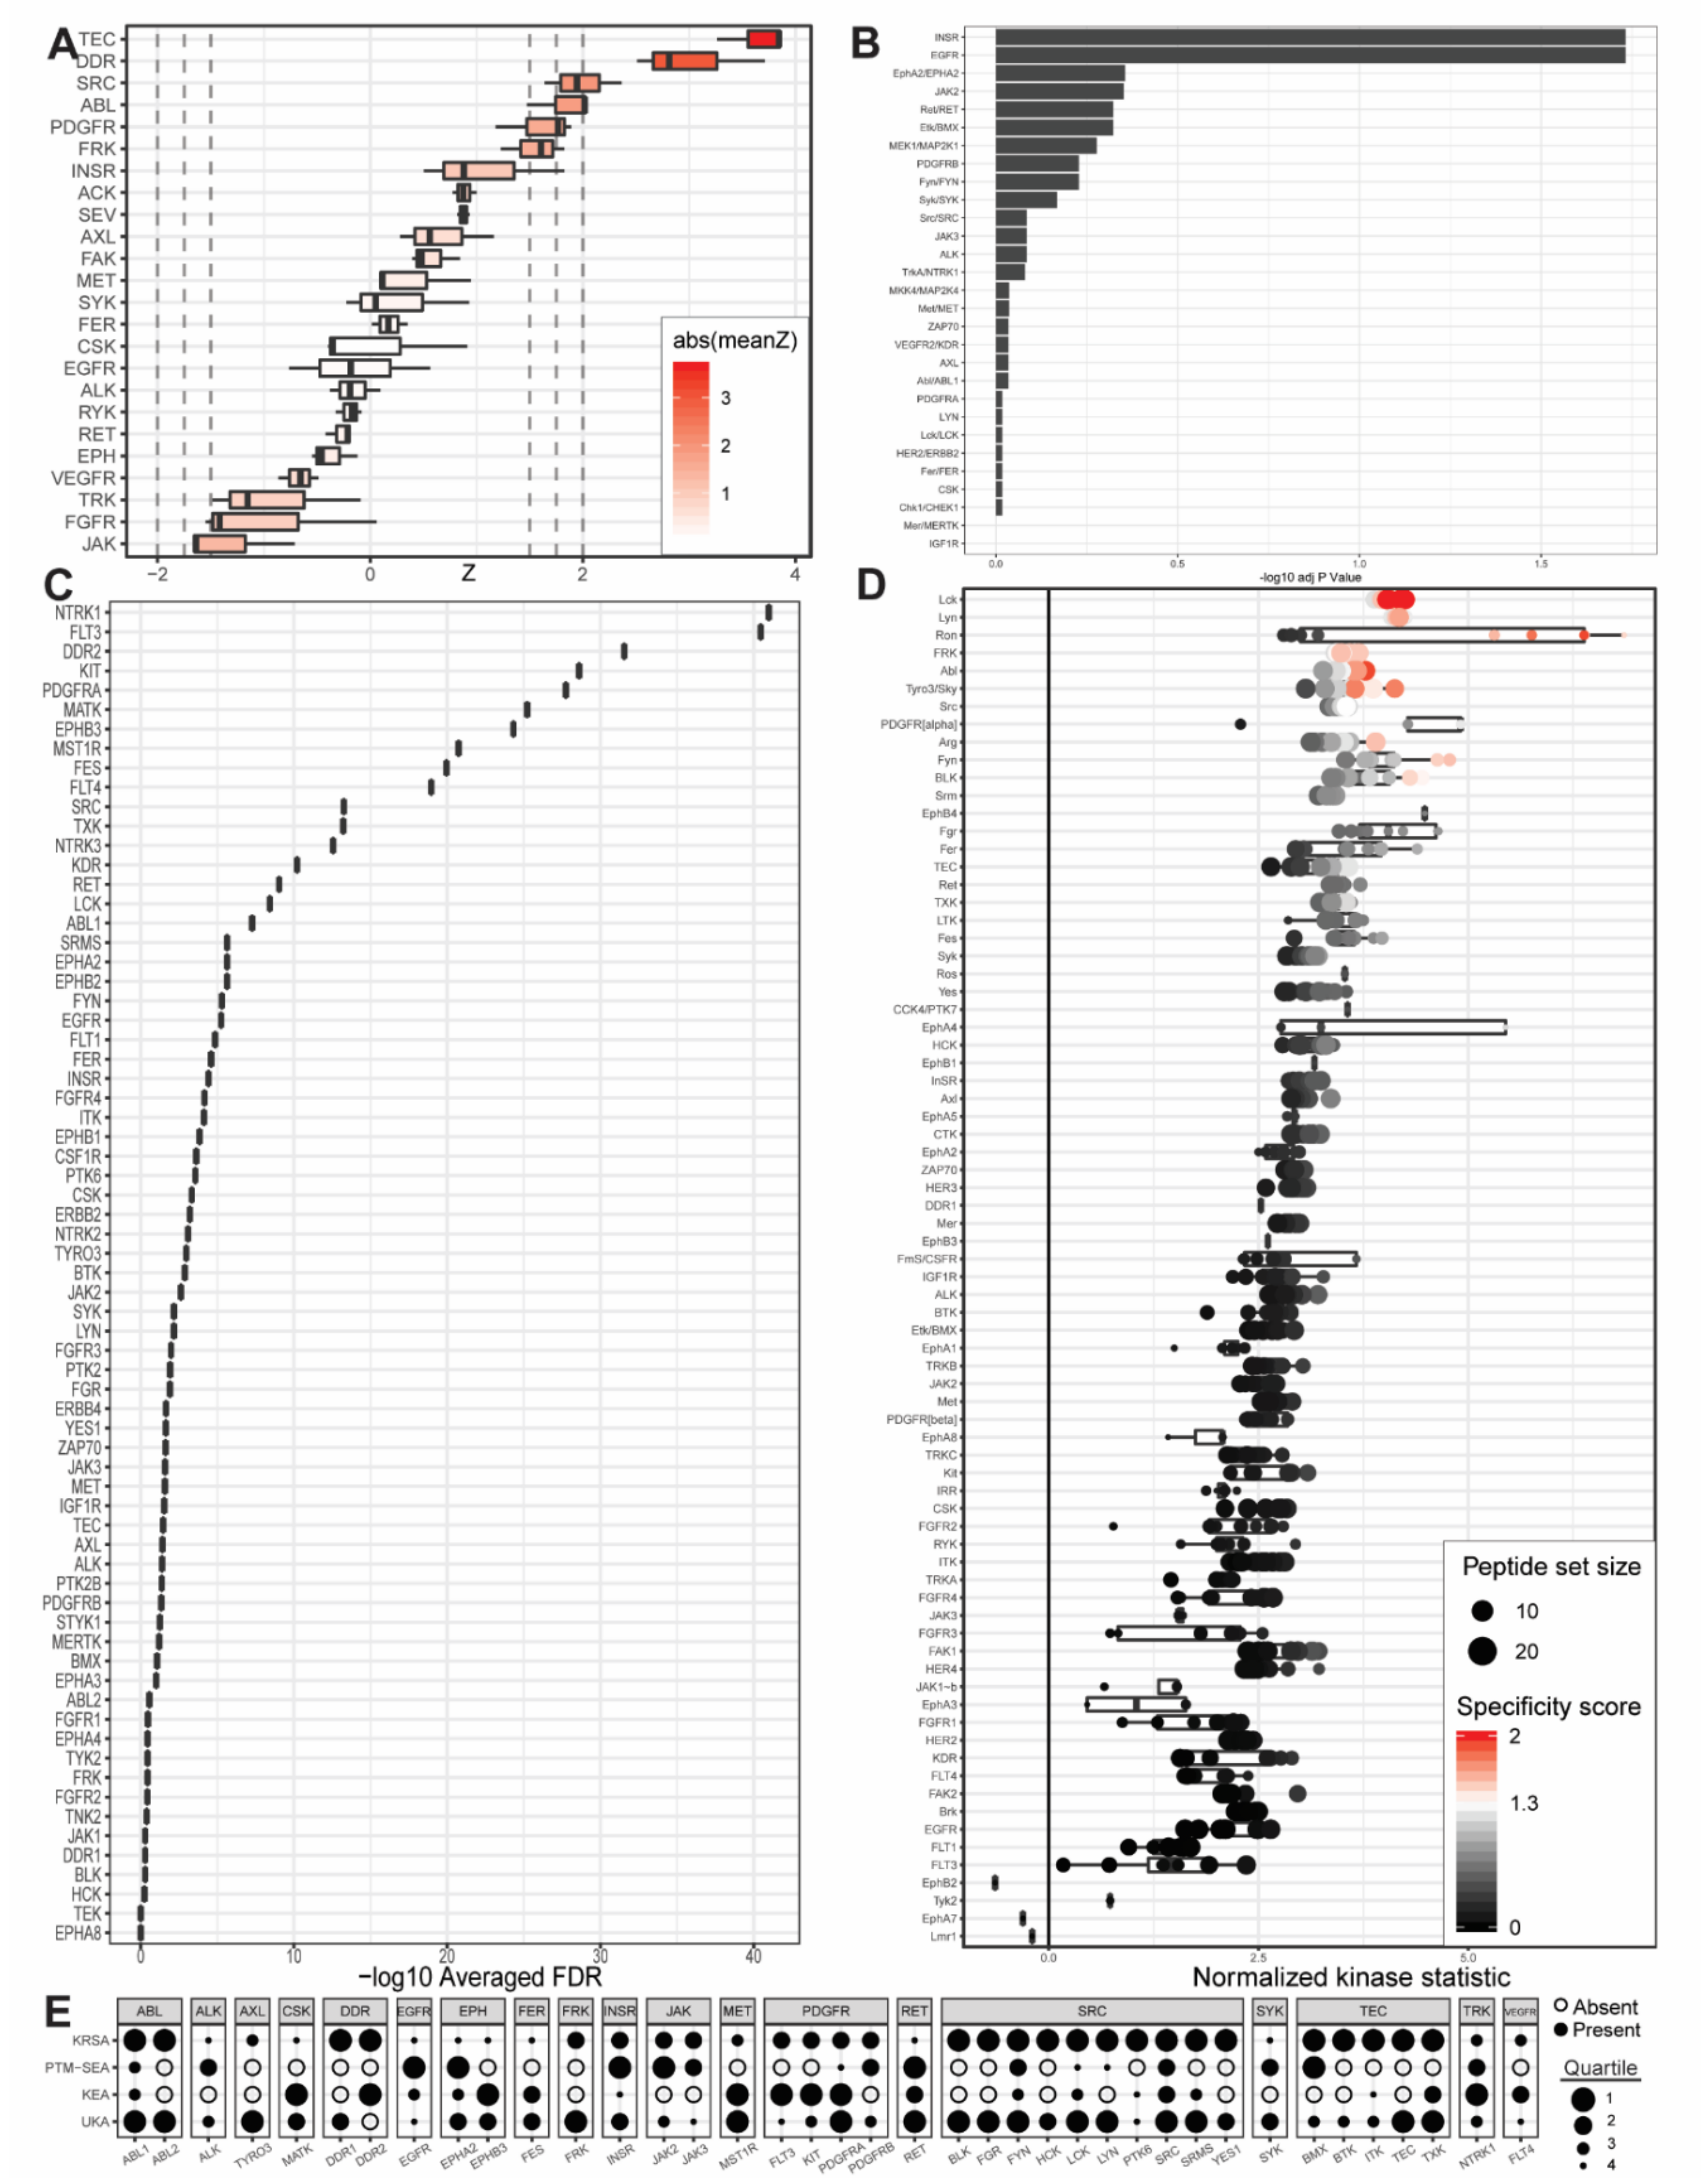
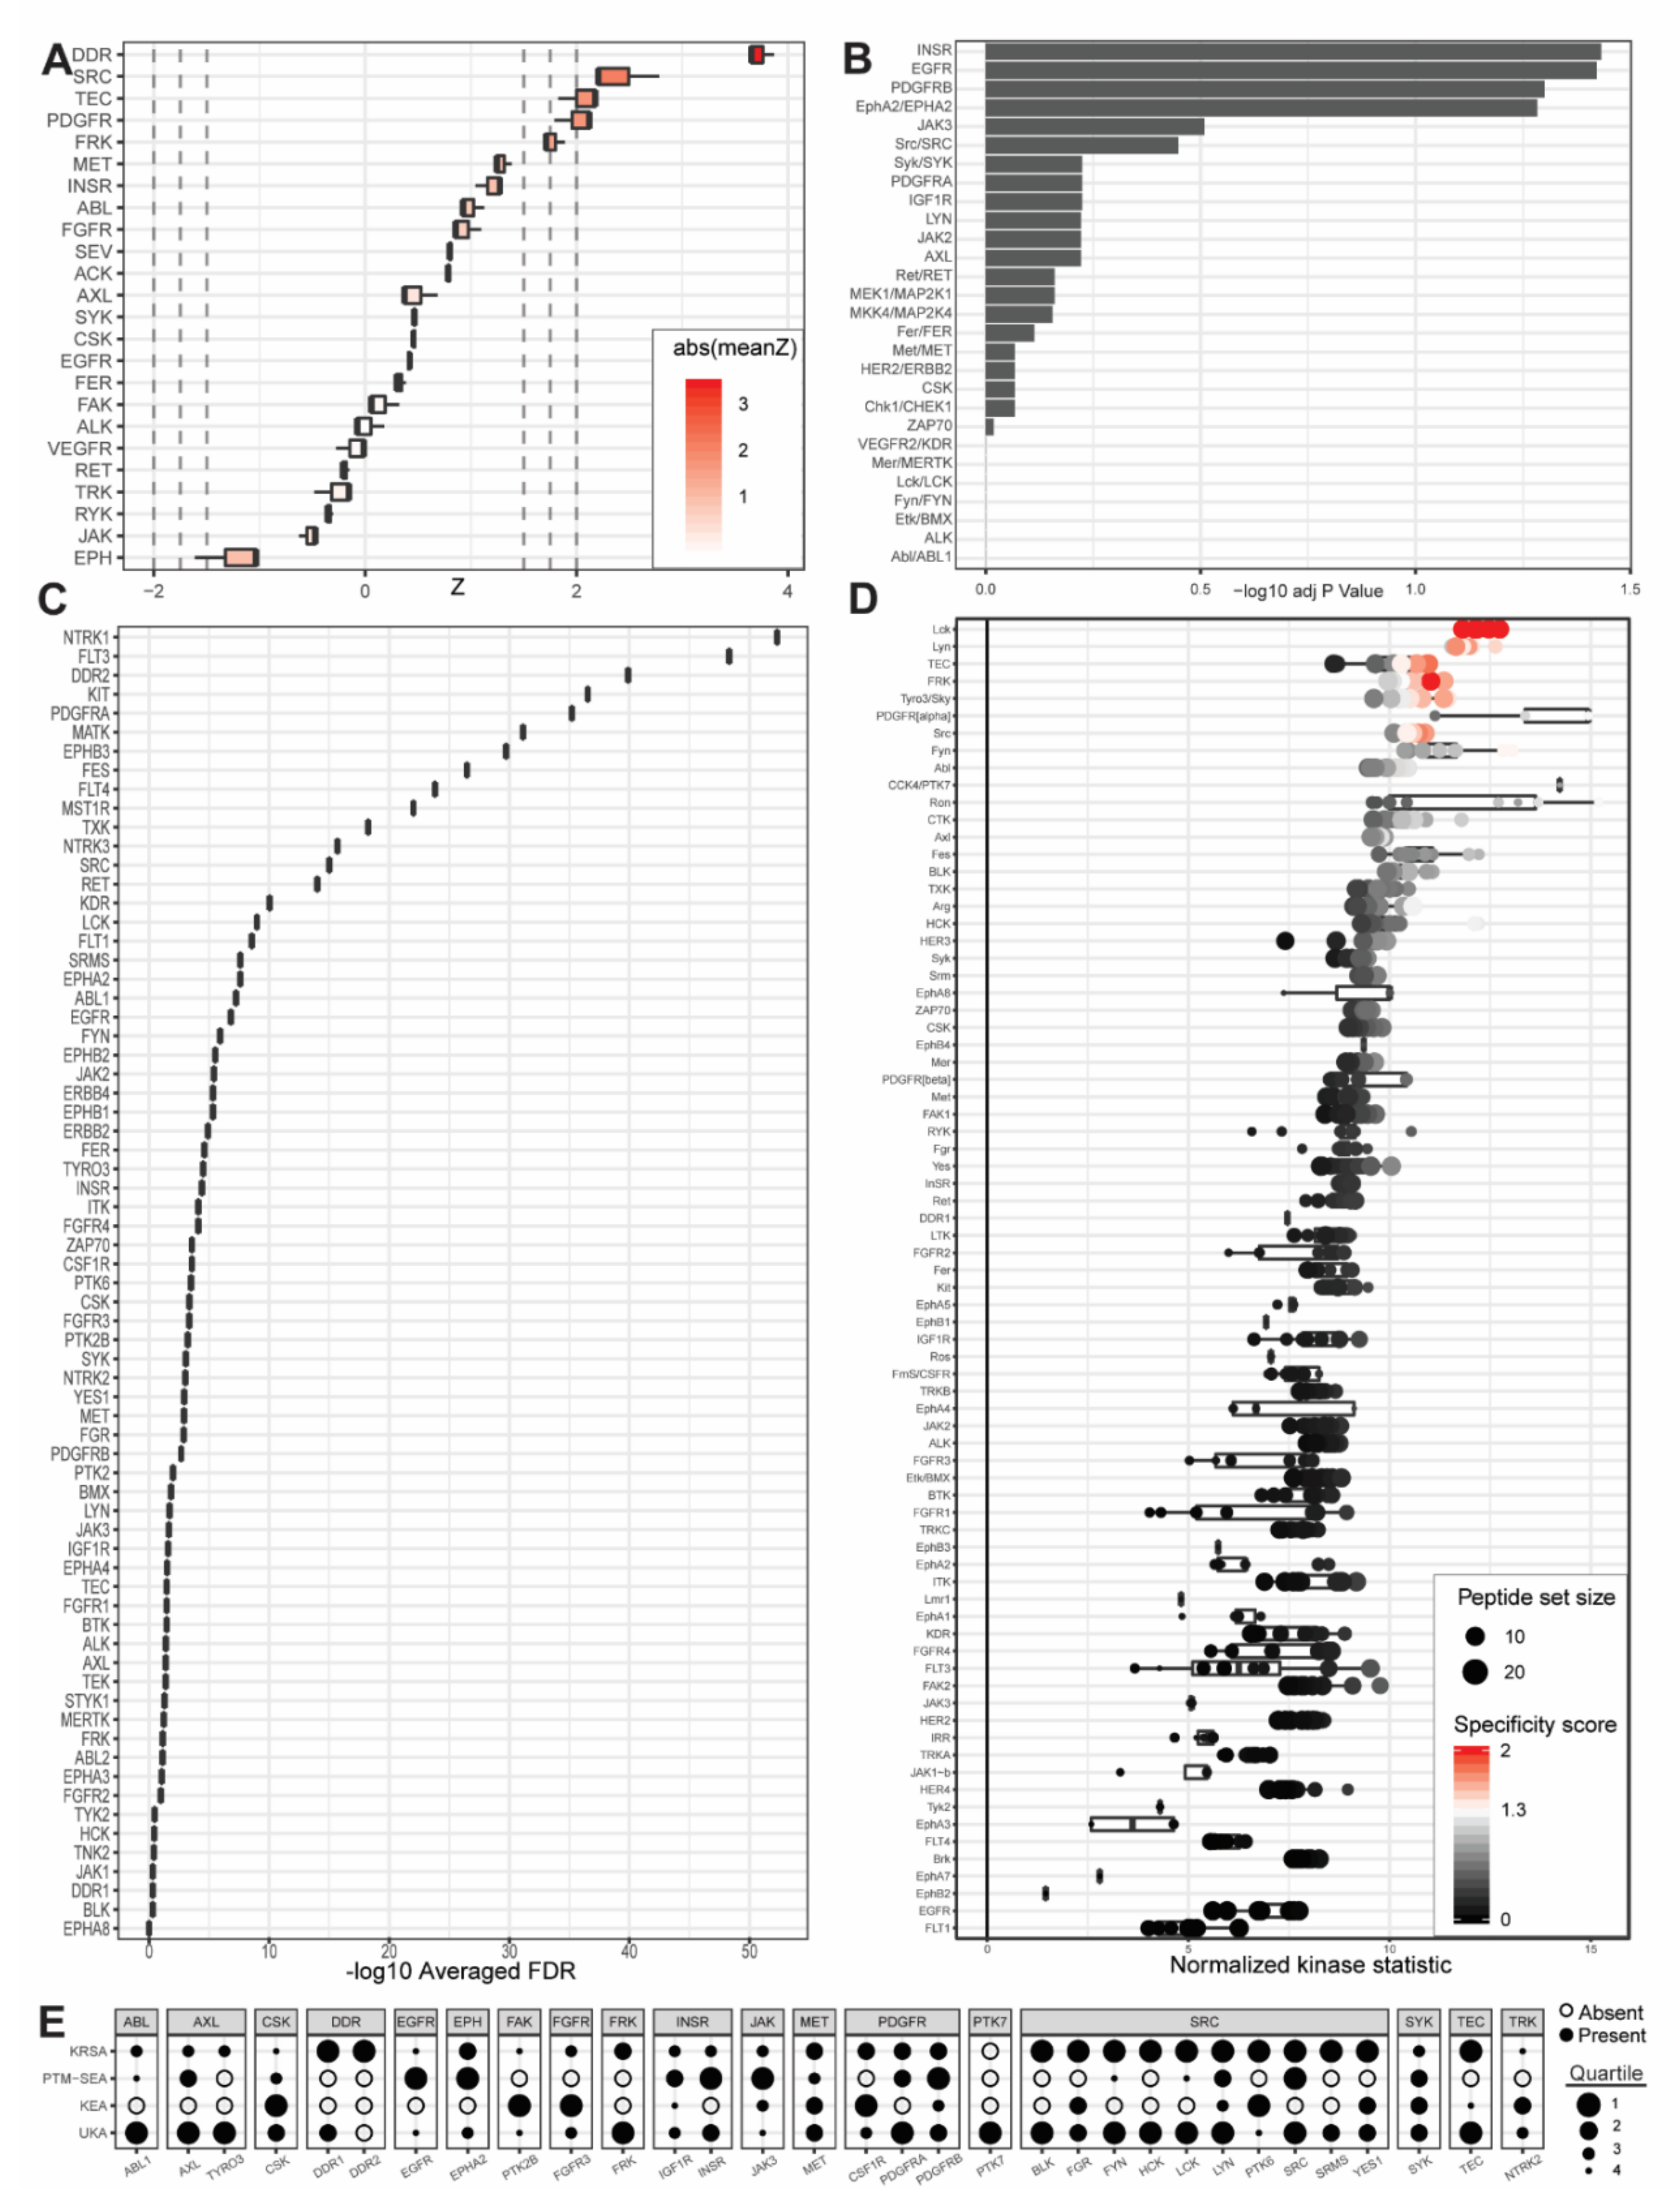
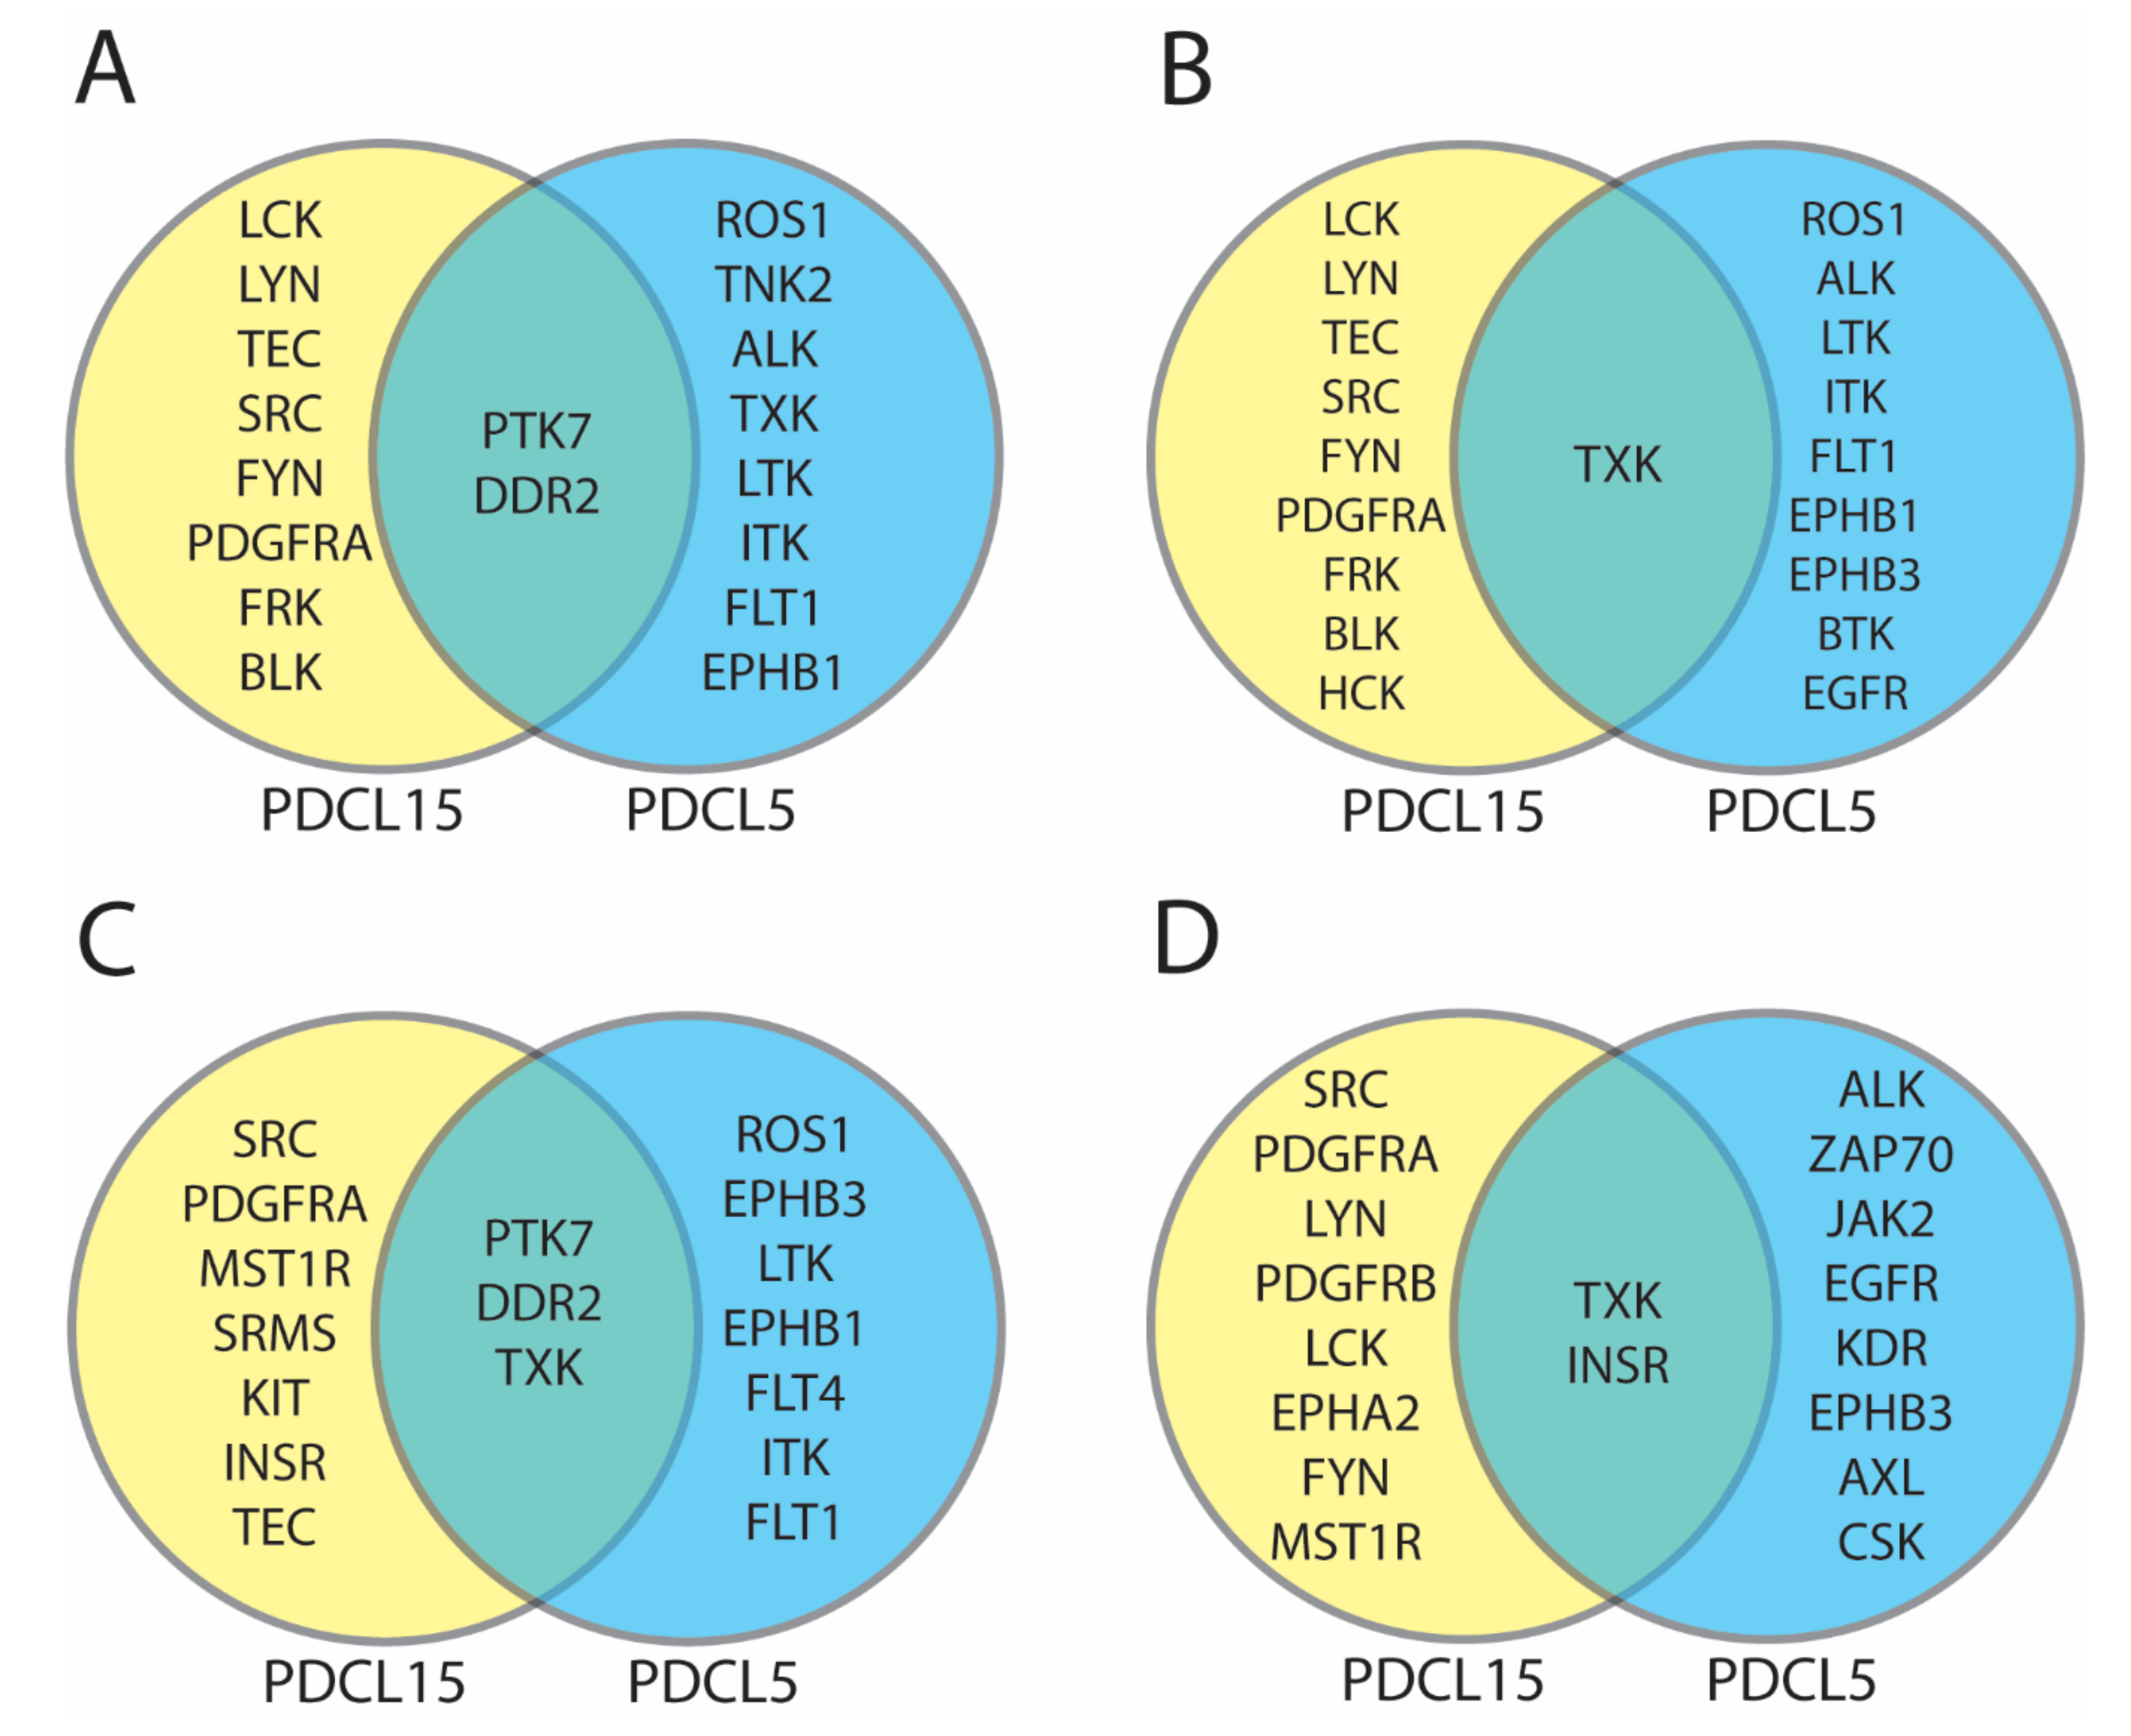
2.2. UKA and KRSA Combinatory Analysis
2.3. Expanded PTM-SEA and KEA3 Combinatory Analysis
3. Discussion
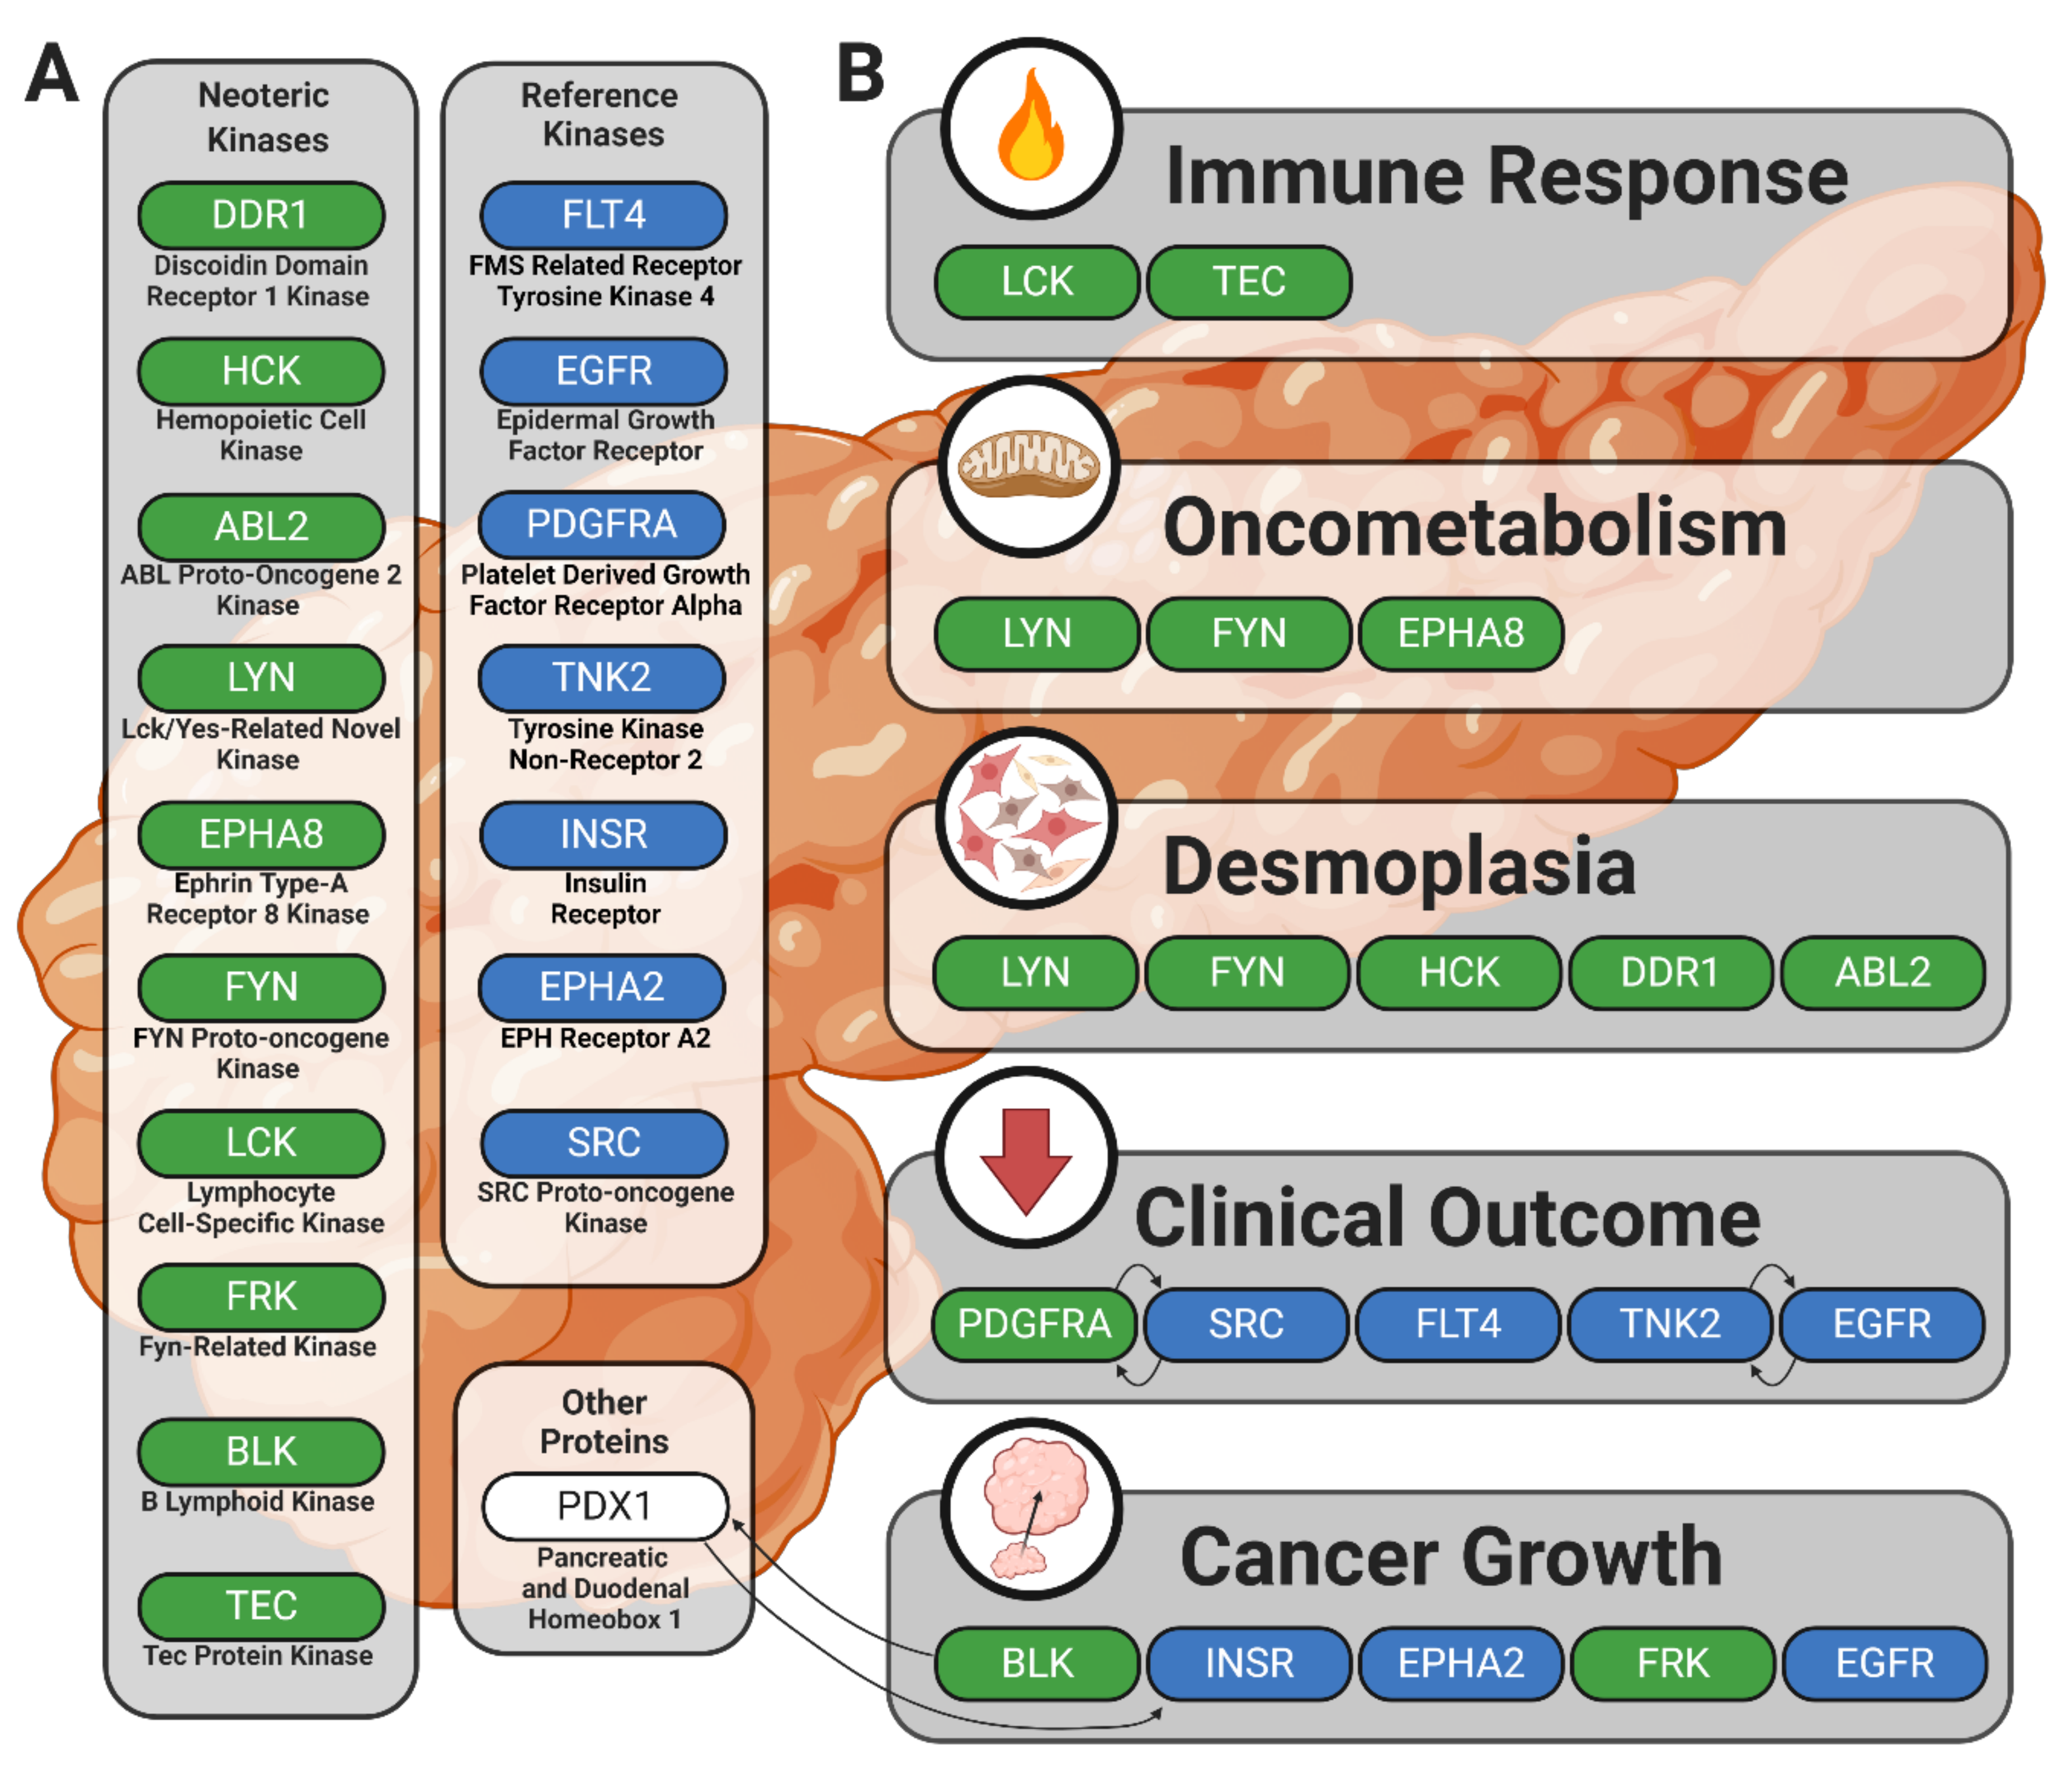
3.1. Identification of Lead Candidate Kinases
3.2. Reference Kinases
3.3. Neoteric Kinases
4. Materials and Methods
4.1. Experimental Design
4.2. Cell Lines and Patient-Derived Tissue
4.3. Tyrosine Kinase Array
4.4. Upstream Kinase Identification
4.4.1. Upstream Kinase Analysis (UKA) Pipeline
4.4.2. Post-Translational Modification Signature Enrichment Analysis (PTM-SEA) Pipeline
4.4.3. Kinase Enrichment Analysis Version 3 (KEA3) Pipeline
4.4.4. Kinome Random Sampling Analyzer (KRSA) Pipeline
4.5. Combinatory Analyses
4.6. Peptide Identities, Gene Synonyms, Family Designations, and Other Mapped Data
4.7. Figure Generation
5. Conclusions
Supplementary Materials
Author Contributions
Funding
Acknowledgments
Conflicts of Interest
Abbreviations
| PDAC | Pancreatic ductal adenocarcinoma |
| KRSA | Kinome Random Sampling Analyzer |
| UKA | Upstream Kinase Analysis |
| PTM-SEA | Post-Translational Modification Signature Enrichment Analysis |
| KEA3 | Kinase Enrichment Analysis Version 3 |
| Z | Standard score |
| FC | Fold change |
| LFC | Log fold change |
| R2 | R-squared statistical measure |
| HGNC | HUGO Gene Nomenclature Committee |
| ssGSEA | Single sample Gene Set Enrichment Analysis |
| PDCL5 | Patient-derived pancreatic ductal adenocarcinoma cell line 5 |
| PDCL15 | Patient-derived pancreatic ductal adenocarcinoma cell line 15 |
| SNP | Single nucleotide polymorphism |
| PDX1, IPF1 | Pancreatic and duodenal homeobox 1 transcription factor |
| BSA | Bovine serum albumin |
| LCK | LCK proto-oncogene, Src family tyrosine kinase |
| DDR2 | Discoidin domain receptor tyrosine kinase 2 |
| LYN | LYN proto-oncogene, Src family tyrosine kinase |
| SRC | SRC proto-oncogene, non-receptor tyrosine kinase |
| ABL1 | ABL proto-oncogene 1, non-receptor tyrosine kinase |
| TEC | Tec protein tyrosine kinase |
| FYN | FYN proto-oncogene, Src family tyrosine kinase |
| BLK | BLK proto-oncogene, Src family tyrosine kinase |
| TXK | TXK tyrosine kinase |
| SRMS | Src-related kinase lacking C-terminal regulatory tyrosine and N-terminal myristylation sites |
| PDGFRA | Platelet-derived growth factor receptor alpha |
| FRK | Fyn-related Src family tyrosine kinase |
| PTK7 | Protein tyrosine kinase 7 (inactive) |
| ROS1 | ROS proto-oncogene 1, receptor tyrosine kinase |
| TNK2 | Tyrosine kinase non receptor 2 |
| ALK | ALK receptor tyrosine kinase |
| LTK | Leukocyte receptor tyrosine kinase |
| ITK | IL2 inducible T cell kinase |
| FLT1 | Fms-related receptor tyrosine kinase 1 |
| EPHB1 | EPH receptor B1 |
| ABL2 | ABL proto-oncogene 2, non-receptor tyrosine kinase |
| HCK | HCK proto-oncogene, Src family tyrosine kinase |
| EPHB3 | EPH receptor B3 |
| BTK | Bruton tyrosine kinase |
| EGFR | Epidermal growth factor receptor |
| MST1R | Macrophage stimulating 1 receptor |
| INSR | Insulin receptor |
| FGR | FGR proto-oncogene, Src family tyrosine kinase |
| KIT | KIT proto-oncogene, receptor tyrosine kinase |
| FLT4 | Fms-related receptor tyrosine kinase 4 |
| FLT3 | Fms-related receptor tyrosine kinase 3 |
| RET | Ret proto-oncogene |
| EPHA2 | EPH receptor A2 |
| PDGFRB | Platelet-derived growth factor receptor beta |
| ZAP70 | Zeta chain of T cell receptor-associated protein kinase 70 |
| JAK2 | Janus kinase 2 |
| KDR | Kinase insert domain receptor |
| AXL | AXL receptor tyrosine kinase |
| CSK | C-terminal Src kinase |
| MET | MET proto-oncogene, receptor tyrosine kinase |
| SEV | Sevenless |
| SYK | Spleen-associated tyrosine kinase |
| VEGFR | Vascular endothelial growth factor receptor |
| TYRO3 | TYRO3 protein tyrosine kinase |
| EPHB4 | EPH receptor B4 |
| PTK6 | Protein tyrosine kinase 6 |
| YES1 | YES proto-oncogene 1, Src family tyrosine kinase |
| CSF1R | Colony stimulating factor 1 receptor |
| FES | FES proto-oncogene, tyrosine kinase |
| INSRR | Insulin receptor-related receptor |
| FGFR4 | Fibroblast growth factor receptor 4 |
| JAK3 | Janus kinase 3 |
| MATK | Megakaryocyte-associated tyrosine kinase |
| FGFR3 | Fibroblast growth factor receptor 3 |
| ERBB3 | Erb-b2 receptor tyrosine kinase 3 |
| BMX | BMX nonreceptor tyrosine kinase |
| IGF1R | Insulin-like growth factor 1 receptor |
| NTRK1 | Neurotrophic receptor tyrosine kinase 1 |
| EPHA4 | EPH receptor A4 |
| EPHB2 | EPH receptor B2 |
| NTRK3 | Neurotrophic receptor tyrosine kinase 3 |
| FER | FER tyrosine kinase |
| FGFR2 | Fibroblast growth factor receptor 2 |
| EPHA1 | EPH receptor A1 |
| ERBB4 | Erb-b2 receptor tyrosine kinase 4 |
| FGFR1 | Fibroblast growth factor receptor 1 |
| DDR1 | Discoidin domain receptor tyrosine kinase 1 |
| EPHA5 | EPH receptor A5 |
| JAK1 | Janus kinase 1 |
| EPHA7 | EPH receptor A7 |
| ERBB2 | Erb-b2 receptor tyrosine kinase 2 |
| NTRK2 | Neurotrophic receptor tyrosine kinase 2 |
| TYK2 | Tyrosine kinase 2 |
| PTK2 | Protein tyrosine kinase 2 |
| SLTM | SAFB-like transcription modulator |
| EPHA8 | EPH receptor A8 |
| EPHA3 | EPH receptor A3 |
| MERTK | MER proto-oncogene, tyrosine kinase |
| RYK | Receptor-like tyrosine kinase |
| PTK2B | Protein tyrosine kinase 2 beta |
| STYK1 | Serine/threonine/tyrosine kinase 1 |
| TEK | TEK receptor tyrosine kinase |
| AATK | Apoptosis-associated tyrosine kinase |
| MTTP | Microsomal triglyceride transfer protein |
| TPM3 | Tropomyosin 3 |
Appendix A


| Cell Line | Kinase | Mean Kinase Statistic | Direction |
|---|---|---|---|
| PDCL15 | BLK | 10.30884201 | Increased |
| PANC1 | BLK | 3.809077325 | Increased |
| PDCL5 | BLK | 0.963873271 | Increased |
| PDCL15 | EGFR | 6.92042103 | Increased |
| PANC1 | EGFR | 2.196020549 | Increased |
| PDCL5 | EGFR | 0.723998698 | Increased |
| PDCL15 | EphA2 | 6.538112723 | Increased |
| PANC1 | EphA2 | 2.767994333 | Increased |
| PDCL5 | EphA2 | 0.663688934 | Increased |
| PDCL15 | FLT4 | 5.969120078 | Increased |
| PANC1 | FLT4 | 1.888408842 | Increased |
| PDCL5 | FLT4 | 0.754741786 | Increased |
| PDCL15 | FRK | 10.54460498 | Increased |
| PANC1 | FRK | 3.517514717 | Increased |
| PDCL5 | FRK | 0.581814545 | Increased |
| PDCL15 | Fyn | 11.52215741 | Increased |
| PANC1 | Fyn | 4.046633984 | Increased |
| PDCL5 | Fyn | 0.080983021 | Increased |
| PDCL15 | InSR | 8.923873567 | Increased |
| PANC1 | InSR | 3.024794143 | Increased |
| PDCL5 | InSR | 0.508668865 | Increased |
| PDCL15 | Lck | 12.35321414 | Increased |
| PANC1 | Lck | 4.06073018 | Increased |
| PDCL5 | Lck | 0.177602219 | Increased |
| PDCL15 | Lyn | 11.88473844 | Increased |
| PANC1 | Lyn | 4.172287974 | Increased |
| PDCL5 | Lyn | 0.620188468 | Increased |
| PDCL15 | PDGFR[alpha] | 14.1657858 | Increased |
| PANC1 | PDGFR[alpha] | 4.47805184 | Increased |
| PDCL5 | PDGFR[alpha] | −0.21206998 | Decreased |
| PDCL15 | Src | 10.51520452 | Increased |
| PANC1 | Src | 3.487086518 | Increased |
| PDCL5 | Src | 0.34051653 | Increased |
| PDCL15 | TEC | 10.09732985 | Increased |
| PANC1 | TEC | 3.229557798 | Increased |
| PDCL5 | TEC | 0.732187188 | Increased |
| PDCL15 | HCK | 10.2005583 | Increased |
| PANC1 | HCK | 3.13041308 | Increased |
| PDCL5 | HCK | 0.537561913 | Increased |
| PDCL15 | Arg | 9.644954083 | Increased |
| PANC1 | Arg | 3.436290625 | Increased |
| PDCL5 | Arg | 0.713079917 | Increased |
| PDCL15 | DDR1 | 7.462484096 | Increased |
| PANC1 | DDR1 | 2.528789422 | Increased |
| PDCL5 | DDR1 | −0.255600871 | Decreased |
| PDCL15 | EphA8 | 9.12751897 | Increased |
| PANC1 | EphA8 | 1.855262187 | Increased |
| PDCL5 | EphA8 | −0.456838117 | Decreased |
| Cell Line | Category | Clinicopathological Data of the Patient of Origin | Standard of Care | Mutational Profile | Ref. |
|---|---|---|---|---|---|
| PANC1 | Commercial | Age: 56; Gender: Male; Ethnicity: Caucasian; Disease: Epithelioid Carcinoma of Ductal Cell Origin | Surgical resection with or without post-surgical adjuvant therapy | KRAS_G12D; TP53_R273H | [98] |
| PDCL15 | Patient Derived | Age: 66; Gender: Male; Ethnicity: Caucasian; Disease: Pancreatic Ductal Adenocarcinoma | Surgical resection with or without post-surgical adjuvant therapy | KRAS_G12D; TP53_WT; | [7,9,11,108] Data Repo |
| PDCL5 | Patient Derived | Age: 56; Gender: Male; Ethnicity: Caucasian; Disease: Pancreatic Ductal Adenocarcinoma | Surgical resection with or without post-surgical adjuvant therapy | KRAS_G12V; TP53_G245S | [7,9,11,108] Data Repo |
Appendix B
| Cell Line | Kinase | Mean Kinase Statistic | Direction |
|---|---|---|---|
| AATK | apoptosis associated tyrosine kinase | HGNC:21 | 17q25.3 |
| ABL1 | ABL proto-oncogene 1, non-receptor tyrosine kinase | HGNC:76 | 9q34.12 |
| ABL2 | ABL proto-oncogene 2, non-receptor tyrosine kinase | HGNC:77 | 1q25.2 |
| ALK | ALK receptor tyrosine kinase | HGNC:427 | 2p23.2-p23.1 |
| AXL | AXL receptor tyrosine kinase | HGNC:905 | 19q13.2 |
| BLK | BLK proto-oncogene, Src family tyrosine kinase | HGNC:1057 | 8p23.1 |
| BMX | BMX non-receptor tyrosine kinase | HGNC:1079 | Xp22.2 |
| BTK | Bruton tyrosine kinase | HGNC:1133 | Xq22.1 |
| CSF1R | colony stimulating factor 1 receptor | HGNC:2433 | 5q32 |
| CSK | C-terminal Src kinase | HGNC:2444 | 15q24.1 |
| DDR1 | discoidin domain receptor tyrosine kinase 1 | HGNC:2730 | 6p21.33 |
| DDR2 | discoidin domain receptor tyrosine kinase 2 | HGNC:2731 | 1q23.3 |
| EGFR | epidermal growth factor receptor | HGNC:3236 | 7p11.2 |
| EPHA1 | EPH receptor A1 | HGNC:3385 | 7q34-q35 |
| EPHA2 | EPH receptor A2 | HGNC:3386 | 1p36.13 |
| EPHA3 | EPH receptor A3 | HGNC:3387 | 3p11.1 |
| EPHA4 | EPH receptor A4 | HGNC:3388 | 2q36.1 |
| EPHA5 | EPH receptor A5 | HGNC:3389 | 4q13.1-q13.2 |
| EPHA7 | EPH receptor A7 | HGNC:3390 | 6q16.1 |
| EPHA8 | EPH receptor A8 | HGNC:3391 | 1p36.12 |
| EPHB1 | EPH receptor B1 | HGNC:3392 | 3q22.2 |
| EPHB2 | EPH receptor B2 | HGNC:3393 | 1p36.12 |
| EPHB3 | EPH receptor B3 | HGNC:3394 | 3q27.1 |
| EPHB4 | EPH receptor B4 | HGNC:3395 | 7q22.1 |
| ERBB2 | erb-b2 receptor tyrosine kinase 2 | HGNC:3430 | 17q12 |
| ERBB3 | erb-b2 receptor tyrosine kinase 3 | HGNC:3431 | 12q13.2 |
| ERBB4 | erb-b2 receptor tyrosine kinase 4 | HGNC:3432 | 2q34 |
| FER | FER tyrosine kinase | HGNC:3655 | 5q21.3 |
| FES | FES proto-oncogene, tyrosine kinase | HGNC:3657 | 15q26.1 |
| FGFR1 | fibroblast growth factor receptor 1 | HGNC:3688 | 8p11.23 |
| FGFR2 | fibroblast growth factor receptor 2 | HGNC:3689 | 10q26.13 |
| FGFR3 | fibroblast growth factor receptor 3 | HGNC:3690 | 4p16.3 |
| FGFR4 | fibroblast growth factor receptor 4 | HGNC:3691 | 5q35.2 |
| FGR | FGR proto-oncogene, Src family tyrosine kinase | HGNC:3697 | 1p35.3 |
| FLT1 | fms related receptor tyrosine kinase 1 | HGNC:3763 | 13q12.3 |
| FLT3 | fms related receptor tyrosine kinase 3 | HGNC:3765 | 13q12.2 |
| FLT4 | fms related receptor tyrosine kinase 4 | HGNC:3767 | 5q35.3 |
| FRK | fyn related Src family tyrosine kinase | HGNC:3955 | 6q22.1 |
| FYN | FYN proto-oncogene, Src family tyrosine kinase | HGNC:4037 | 6q21 |
| HCK | HCK proto-oncogene, Src family tyrosine kinase | HGNC:4840 | 20q11.21 |
| IGF1R | insulin like growth factor 1 receptor | HGNC:5465 | 15q26.3 |
| INSR | insulin receptor | HGNC:6091 | 19p13.2 |
| INSRR | insulin receptor related receptor | HGNC:6093 | 1q23.1 |
| ITK | IL2 inducible T cell kinase | HGNC:6171 | 5q33.3 |
| JAK1 | Janus kinase 1 | HGNC:6190 | 1p31.3 |
| JAK2 | Janus kinase 2 | HGNC:6192 | 9p24.1 |
| JAK3 | Janus kinase 3 | HGNC:6193 | 19p13.11 |
| KDR | kinase insert domain receptor | HGNC:6307 | 4q12 |
| KIT | KIT proto-oncogene, receptor tyrosine kinase | HGNC:6342 | 4q12 |
| LCK | LCK proto-oncogene, Src family tyrosine kinase | HGNC:6524 | 1p35.2 |
| LTK | leukocyte receptor tyrosine kinase | HGNC:6721 | 15q15.1 |
| LYN | LYN proto-oncogene, Src family tyrosine kinase | HGNC:6735 | 8q12.1 |
| MATK | megakaryocyte-associated tyrosine kinase | HGNC:6906 | 19p13.3 |
| MERTK | MER proto-oncogene, tyrosine kinase | HGNC:7027 | 2q13 |
| MET | MET proto-oncogene, receptor tyrosine kinase | HGNC:7029 | 7q31 |
| MST1R | macrophage stimulating 1 receptor | HGNC:7381 | 3p21.31 |
| NTRK1 | neurotrophic receptor tyrosine kinase 1 | HGNC:8031 | 1q23.1 |
| NTRK2 | neurotrophic receptor tyrosine kinase 2 | HGNC:8032 | 9q21.33 |
| NTRK3 | neurotrophic receptor tyrosine kinase 3 | HGNC:8033 | 15q25.3 |
| PDGFRA | platelet derived growth factor receptor alpha | HGNC:8803 | 4q12 |
| PDGFRB | platelet derived growth factor receptor beta | HGNC:8804 | 5q32 |
| PTK2 | protein tyrosine kinase 2 | HGNC:9611 | 8q24.3 |
| PTK2B | protein tyrosine kinase 2 beta | HGNC:9612 | 8p21.2 |
| PTK6 | protein tyrosine kinase 6 | HGNC:9617 | 20q13.33 |
| PTK7 | protein tyrosine kinase 7 (inactive) | HGNC:9618 | 6p21.1 |
| RET | ret proto-oncogene | HGNC:9967 | 10q11.21 |
| ROS1 | ROS proto-oncogene 1, receptor tyrosine kinase | HGNC:10261 | 6q22.1 |
| RYK | receptor like tyrosine kinase | HGNC:10481 | 3q22.2 |
| SLTM | SAFB like transcription modulator | HGNC:20709 | 15q22.1 |
| SRC | SRC proto-oncogene, non-receptor tyrosine kinase | HGNC:11283 | 20q11.23 |
| SRMS | src-related kinase lacking C-terminal regulatory tyrosine and N-terminal myristylation sites | HGNC:11298 | 20q13.33 |
| STYK1 | serine/threonine/tyrosine kinase 1 | HGNC:18889 | 12p13.2 |
| SYK | spleen associated tyrosine kinase | HGNC:11491 | 9q22.2 |
| TEC | tec protein tyrosine kinase | HGNC:11719 | 4p12-p11 |
| TEK | TEK receptor tyrosine kinase | HGNC:11724 | 9p21.2 |
| TNK2 | tyrosine kinase non receptor 2 | HGNC:19297 | 3q29 |
| TXK | TXK tyrosine kinase | HGNC:12434 | 4p12 |
| TYK2 | tyrosine kinase 2 | HGNC:12440 | 19p13.2 |
| TYRO3 | TYRO3 protein tyrosine kinase | HGNC:12446 | 15q15.1 |
| YES1 | YES proto-oncogene 1, Src family tyrosine kinase | HGNC:12841 | 18p11.32 |
| ZAP70 | zeta chain of T cell receptor associated protein kinase 70 | HGNC:12858 | 2q11.2 |
| Pipeline | Default | Standardized |
|---|---|---|
| KRSA | TEC | TEC |
| KRSA | DDR | DDR |
| KRSA | SRC | SRC |
| KRSA | ABL | ABL |
| KRSA | PDGFR | PDGFR |
| KRSA | FRK | FRK |
| KRSA | JAK | JAK |
| KRSA | INSR | INSR |
| KRSA | FGFR | FGFR |
| KRSA | TRK | TRK |
| KRSA | ACK | ACK |
| KRSA | SEV | SEV |
| KRSA | VEGFR | VEGFR |
| KRSA | AXL | AXL |
| KRSA | FAK | FAK |
| KRSA | MET | MET |
| KRSA | EPH | EPH |
| KRSA | RET | RET |
| KRSA | SYK | SYK |
| KRSA | RYK | RYK |
| KRSA | FER | FER |
| KRSA | ALK | ALK |
| KRSA | EGFR | EGFR |
| KRSA | CSK | CSK |
| UKA | Lck | Lck |
| UKA | Lyn | Lyn |
| UKA | TEC | TEC |
| UKA | FRK | FRK |
| UKA | Tyro3/Sky | TYRO3 |
| UKA | PDGFR[alpha] | PDGFRa |
| UKA | Src | Src |
| UKA | Fyn | Fyn |
| UKA | Abl | ABL1 |
| UKA | CCK4/PTK7 | PTK7 |
| UKA | Ron | MST1R |
| UKA | CTK | MATK |
| UKA | Axl | Axl |
| UKA | Fes | Fes |
| UKA | BLK | BLK |
| UKA | TXK | TXK |
| UKA | Arg | ABL2 |
| UKA | HCK | HCK |
| UKA | HER3 | ERBB3 |
| UKA | Syk | Syk |
| UKA | Srm | SRMS |
| UKA | EphA8 | EphA8 |
| UKA | ZAP70 | ZAP70 |
| UKA | CSK | CSK |
| UKA | EphB4 | EphB4 |
| UKA | Mer | MERTK |
| UKA | PDGFR[beta] | PDGFRb |
| UKA | Met | Met |
| UKA | FAK1 | PTK2 |
| UKA | RYK | RYK |
| UKA | Fgr | Fgr |
| UKA | Yes | YES1 |
| UKA | InSR | InSR |
| UKA | Ret | Ret |
| UKA | DDR1 | DDR1 |
| UKA | LTK | LTK |
| UKA | FGFR2 | FGFR2 |
| UKA | Fer | Fer |
| UKA | Kit | Kit |
| UKA | EphA5 | EphA5 |
| UKA | EphB1 | EphB1 |
| UKA | IGF1R | IGF1R |
| UKA | Ros | ROS1 |
| UKA | FmS/CSFR | CSF1R |
| UKA | TRKB | NTRK2 |
| UKA | EphA4 | EphA4 |
| UKA | JAK2 | JAK2 |
| UKA | ALK | ALK |
| UKA | FGFR3 | FGFR3 |
| UKA | Etk/BMX | BMX |
| UKA | BTK | BTK |
| UKA | FGFR1 | FGFR1 |
| UKA | TRKC | NTRK3 |
| UKA | EphB3 | EphB3 |
| UKA | EphA2 | EphA2 |
| UKA | ITK | ITK |
| UKA | Lmr1 | AATK |
| UKA | EphA1 | EphA1 |
| UKA | KDR | KDR |
| UKA | FGFR4 | FGFR4 |
| UKA | FLT3 | FLT3 |
| UKA | FAK2 | PTK2B |
| UKA | JAK3 | JAK3 |
| UKA | HER2 | ERBB2 |
| UKA | IRR | INSRR |
| UKA | TRKA | NTRK1 |
| UKA | JAK1~b | JAK1 |
| UKA | HER4 | ERBB4 |
| UKA | Tyk2 | Tyk2 |
| UKA | EphA3 | EphA3 |
| UKA | FLT4 | FLT4 |
| UKA | Brk | PTK6 |
| UKA | EphA7 | EphA7 |
| UKA | EphB2 | EphB2 |
| UKA | EGFR | EGFR |
| UKA | FLT1 | FLT1 |
| PTM-SEA | ZAP70 | ZAP70 |
| PTM-SEA | VEGFR2/KDR | KDR |
| PTM-SEA | TrkA/NTRK1 | NTRK1 |
| PTM-SEA | Syk/SYK | SYK |
| PTM-SEA | Src/SRC | SRC |
| PTM-SEA | Ret/RET | RET |
| PTM-SEA | PDGFRB | PDGFRB |
| PTM-SEA | PDGFRA | PDGFRA |
| PTM-SEA | MKK4/MAP2K4 | MAP2K4 |
| PTM-SEA | Met/MET | MET |
| PTM-SEA | Mer/MERTK | MERTK |
| PTM-SEA | MEK1/MAP2K1 | MAP2K1 |
| PTM-SEA | LYN | LYN |
| PTM-SEA | Lck/LCK | LCK |
| PTM-SEA | JAK3 | JAK3 |
| PTM-SEA | JAK2 | JAK2 |
| PTM-SEA | INSR | INSR |
| PTM-SEA | IGF1R | IGF1R |
| PTM-SEA | HER2/ERBB2 | ERBB2 |
| PTM-SEA | Fyn/FYN | FYN |
| PTM-SEA | Fer/FER | FER |
| PTM-SEA | Etk/BMX | BMX |
| PTM-SEA | EphA2/EPHA2 | EPHA2 |
| PTM-SEA | EGFR | EGFR |
| PTM-SEA | CSK | CSK |
| PTM-SEA | Chk1/CHEK1 | CHEK1 |
| PTM-SEA | AXL | AXL |
| PTM-SEA | ALK | ALK |
| PTM-SEA | Abl/ABL1 | ABL1 |
| KEA3 | NTRK1 | NTRK1 |
| KEA3 | FLT3 | FLT3 |
| KEA3 | DDR2 | DDR2 |
| KEA3 | KIT | KIT |
| KEA3 | PDGFRA | PDGFRA |
| KEA3 | MATK | MATK |
| KEA3 | EPHB3 | EPHB3 |
| KEA3 | MST1R | MST1R |
| KEA3 | FES | FES |
| KEA3 | FLT4 | FLT4 |
| KEA3 | SRC | SRC |
| KEA3 | TXK | TXK |
| KEA3 | NTRK3 | NTRK3 |
| KEA3 | KDR | KDR |
| KEA3 | RET | RET |
| KEA3 | LCK | LCK |
| KEA3 | ABL1 | ABL1 |
| KEA3 | EPHA2 | EPHA2 |
| KEA3 | SRMS | SRMS |
| KEA3 | EPHB2 | EPHB2 |
| KEA3 | FYN | FYN |
| KEA3 | EGFR | EGFR |
| KEA3 | FLT1 | FLT1 |
| KEA3 | FER | FER |
| KEA3 | INSR | INSR |
| KEA3 | FGFR4 | FGFR4 |
| KEA3 | ITK | ITK |
| KEA3 | EPHB1 | EPHB1 |
| KEA3 | CSF1R | CSF1R |
| KEA3 | PTK6 | PTK6 |
| KEA3 | CSK | CSK |
| KEA3 | ERBB2 | ERBB2 |
| KEA3 | NTRK2 | NTRK2 |
| KEA3 | TYRO3 | TYRO3 |
| KEA3 | BTK | BTK |
| KEA3 | JAK2 | JAK2 |
| KEA3 | SYK | SYK |
| KEA3 | LYN | LYN |
| KEA3 | FGFR3 | FGFR3 |
| KEA3 | PTK2 | PTK2 |
| KEA3 | FGR | FGR |
| KEA3 | ERBB4 | ERBB4 |
| KEA3 | YES1 | YES1 |
| KEA3 | ZAP70 | ZAP70 |
| KEA3 | JAK3 | JAK3 |
| KEA3 | MET | MET |
| KEA3 | IGF1R | IGF1R |
| KEA3 | TEC | TEC |
| KEA3 | AXL | AXL |
| KEA3 | ALK | ALK |
| KEA3 | PTK2B | PTK2B |
| KEA3 | PDGFRB | PDGFRB |
| KEA3 | STYK1 | STYK1 |
| KEA3 | MERTK | MERTK |
| KEA3 | BMX | BMX |
| KEA3 | EPHA3 | EPHA3 |
| KEA3 | ABL2 | ABL2 |
| KEA3 | FGFR1 | FGFR1 |
| KEA3 | EPHA4 | EPHA4 |
| KEA3 | TYK2 | TYK2 |
| KEA3 | FRK | FRK |
| KEA3 | FGFR2 | FGFR2 |
| KEA3 | TNK2 | TNK2 |
| KEA3 | JAK1 | JAK1 |
| KEA3 | DDR1 | DDR1 |
| KEA3 | BLK | BLK |
| KEA3 | HCK | HCK |
| KEA3 | EPHA8 | EPHA8 |
| KEA3 | TEK | TEK |
References
- Jagade, J.; Amrutkar, M.; Katariya, D.; Wankhade, A.; Kale, A.; Undale, V. Role of protein kinases in signal transduction and their inhibitors. Pharmacologyonline 2010. Available online: https://www.researchgate.net/profile/Manoj_Amrutkar/publication/230558661_Role_of_protein_kinases_in_signal_transduction_and_their_inhibitors/links/0912f5016fc0b4e975000000.pdf (accessed on 9 January 2020).
- Bhullar, K.S.; Lagaron, N.O.; McGowan, E.M.; Parmar, I.; Jha, A.; Hubbard, B.P.; Rupasinghe, H.P.V. Kinase-targeted cancer therapies: Progress, challenges and future directions. Mol. Cancer 2018, 17, 48. [Google Scholar] [CrossRef]
- Roskoski, R., Jr. Properties of FDA-approved small molecule protein kinase inhibitors: A 2020 update. Pharmacol. Res. 2020, 152, 104609. [Google Scholar] [CrossRef]
- Roskoski, R., Jr. Properties of FDA-approved small molecule protein kinase inhibitors. Pharmacol. Res. 2019, 144, 19–50. [Google Scholar] [CrossRef] [PubMed]
- Siegel, R.L.; Miller, K.D.; Jemal, A. Cancer statistics, 2020. CA Cancer J. Clin. 2020, 70, 7–30. [Google Scholar] [CrossRef] [PubMed]
- Anderson, C.W.; Bennett, J.J. Clinical Presentation and Diagnosis of Pancreatic Neuroendocrine Tumors. Surg. Oncol. Clin. 2016, 25, 363–374. [Google Scholar] [CrossRef]
- Bailey, P.; Chang, D.K.; Nones, K.; Johns, A.L.; Patch, A.M.; Gingras, M.C.; Miller, D.K.; Christ, A.N.; Bruxner, T.J.; Quinn, M.C.; et al. Genomic analyses identify molecular subtypes of pancreatic cancer. Nature 2016, 531, 47–52. [Google Scholar] [CrossRef] [PubMed]
- Collisson, E.A.; Sadanandam, A.; Olson, P.; Gibb, W.J.; Truitt, M.; Gu, S.; Cooc, J.; Weinkle, J.; Kim, G.E.; Jakkula, L.; et al. Subtypes of pancreatic ductal adenocarcinoma and their differing responses to therapy. Nat. Med. 2011, 17, 500–503. [Google Scholar] [CrossRef]
- Humphrey, E.S.; Su, S.P.; Nagrial, A.M.; Hochgrafe, F.; Pajic, M.; Lehrbach, G.M.; Parton, R.G.; Yap, A.S.; Horvath, L.G.; Chang, D.K.; et al. Resolution of Novel Pancreatic Ductal Adenocarcinoma Subtypes by Global Phosphotyrosine Profiling. Mol. Cell. Proteom. MCP 2016, 15, 2671–2685. [Google Scholar] [CrossRef] [Green Version]
- Moffitt, R.A.; Marayati, R.; Flate, E.L.; Volmar, K.E.; Loeza, S.G.; Hoadley, K.A.; Rashid, N.U.; Williams, L.A.; Eaton, S.C.; Chung, A.H.; et al. Virtual microdissection identifies distinct tumor- and stroma-specific subtypes of pancreatic ductal adenocarcinoma. Nat. Genet. 2015, 47, 1168–1178. [Google Scholar] [CrossRef]
- Waddell, N.; Pajic, M.; Patch, A.M.; Chang, D.K.; Kassahn, K.S.; Bailey, P.; Johns, A.L.; Miller, D.; Nones, K.; Quek, K.; et al. Whole genomes redefine the mutational landscape of pancreatic cancer. Nature 2015, 518, 495–501. [Google Scholar] [CrossRef] [PubMed] [Green Version]
- Bentea, E.; Depasquale, E.A.K.; O’Donovan, S.M.; Sullivan, C.R.; Simmons, M.; Meador-Woodruff, J.H.; Zhou, Y.; Xu, C.; Bai, B.; Peng, J.; et al. Kinase network dysregulation in a human induced pluripotent stem cell model of DISC1 schizophrenia. Mol. Omics 2019, 15, 173–188. [Google Scholar] [CrossRef] [PubMed] [Green Version]
- Bentea, E.; Villers, A.; Moore, C.; Funk, A.J.; O’Donovan, S.M.; Verbruggen, L.; Lara, O.; Janssen, P.; De Pauw, L.; Declerck, N.B.; et al. Corticostriatal dysfunction and social interaction deficits in mice lacking the cystine/glutamate antiporter. Mol. Psychiatry 2020. [Google Scholar] [CrossRef] [PubMed]
- DePasquale, E.A.K.; Alganem, K.; Bentea, E.; Nawreen, N.; McGuire, J.L.; Naji, F.; Hilhorst, R.; Meller, J.; McCullumsmith, R.E. KRSA: Network-based Prediction of Differential Kinase Activity from Kinome Array Data. bioRxiv 2020. [Google Scholar] [CrossRef]
- Flaherty, E.; Zhu, S.; Barretto, N.; Cheng, E.; Deans, P.J.M.; Fernando, M.B.; Schrode, N.; Francoeur, N.; Antoine, A.; Alganem, K.; et al. Neuronal impact of patient-specific aberrant NRXN1alpha splicing. Nat. Genet. 2019, 51, 1679–1690. [Google Scholar] [CrossRef]
- McGuire, J.L.; Depasquale, E.A.; Funk, A.J.; O’Donnovan, S.M.; Hasselfeld, K.; Marwaha, S.; Hammond, J.H.; Hartounian, V.; Meador-Woodruff, J.H.; Meller, J.; et al. Abnormalities of signal transduction networks in chronic schizophrenia. NPJ Schizophr. 2017, 3, 30. [Google Scholar] [CrossRef]
- Schrode, N.; Ho, S.M.; Yamamuro, K.; Dobbyn, A.; Huckins, L.; Matos, M.R.; Cheng, E.; Deans, P.J.M.; Flaherty, E.; Barretto, N.; et al. Synergistic effects of common schizophrenia risk variants. Nat. Genet. 2019, 51, 1475–1485. [Google Scholar] [CrossRef]
- Alganem, K.; Shukla, R.; Eby, H.; Abel, M.; Zhang, X.; McIntyre, W.B.; Lee, J.; Au-Yeung, C.; Asgariroozbehani, R.; Panda, R.; et al. Kaleidoscope: A New Bioinformatics Pipeline Web Application for In Silico Hypothesis Exploration of Omics Signatures. bioRxiv 2020. [Google Scholar] [CrossRef]
- McGuire, J.L.; Hammond, J.H.; Yates, S.D.; Chen, D.; Haroutunian, V.; Meador-Woodruff, J.H.; McCullumsmith, R.E. Altered serine/threonine kinase activity in schizophrenia. Brain Res. 2014, 1568, 42–54. [Google Scholar] [CrossRef] [Green Version]
- Alack, K.; Weiss, A.; Kruger, K.; Horet, M.; Schermuly, R.; Frech, T.; Eggert, M.; Mooren, F.C. Profiling of human lymphocytes reveals a specific network of protein kinases modulated by endurance training status. Sci. Rep. 2020, 10, 888. [Google Scholar] [CrossRef] [Green Version]
- Chirumamilla, C.S.; Fazil, M.; Perez-Novo, C.; Rangarajan, S.; de Wijn, R.; Ramireddy, P.; Verma, N.K.; Vanden Berghe, W. Profiling Activity of Cellular Kinases in Migrating T-Cells. Methods Mol. Biol. 2019, 1930, 99–113. [Google Scholar] [PubMed]
- Krug, K.; Mertins, P.; Zhang, B.; Hornbeck, P.; Raju, R.; Ahmad, R.; Szucs, M.; Mundt, F.; Forestier, D.; Jane-Valbuena, J.; et al. A Curated Resource for Phosphosite-specific Signature Analysis. Mol. Cell. Proteom. MCP 2019, 18, 576–593. [Google Scholar] [CrossRef] [PubMed] [Green Version]
- Lachmann, A.; Ma’ayan, A. KEA: Kinase enrichment analysis. Bioinformatics 2009, 25, 684–686. [Google Scholar] [CrossRef] [PubMed] [Green Version]
- Chen, H.M.; Tsai, C.H.; Hung, W.C. Foretinib inhibits angiogenesis, lymphangiogenesis and tumor growth of pancreatic cancer in vivo by decreasing VEGFR-2/3 and TIE-2 signaling. Oncotarget 2015, 6, 14940–14952. [Google Scholar] [CrossRef] [Green Version]
- Durkin, A.J.; Osborne, D.A.; Yeatman, T.J.; Rosemurgy, A.S.; Armstrong, C.; Zervos, E.E. EGF receptor antagonism improves survival in a murine model of pancreatic adenocarcinoma. J. Surg. Res. 2006, 135, 195–201. [Google Scholar] [CrossRef]
- Kuo, T.L.; Cheng, K.H.; Shan, Y.S.; Chen, L.T.; Hung, W.C. beta-catenin-activated autocrine PDGF/Src signaling is a therapeutic target in pancreatic cancer. Theranostics 2019, 9, 324–336. [Google Scholar] [CrossRef]
- Parkin, A.; Man, J.; Timpson, P.; Pajic, M. Targeting the complexity of Src signalling in the tumour microenvironment of pancreatic cancer: From mechanism to therapy. FEBS J. 2019, 286, 3510–3539. [Google Scholar] [CrossRef] [Green Version]
- Yamanaka, Y.; Friess, H.; Kobrin, M.S.; Buchler, M.; Beger, H.G.; Korc, M. Coexpression of epidermal growth factor receptor and ligands in human pancreatic cancer is associated with enhanced tumor aggressiveness. Anticancer Res. 1993, 13, 565–569. [Google Scholar]
- Du, J.; He, Y.; Wu, W.; Li, P.; Chen, Y.; Hu, Z.; Han, Y. Targeting EphA2 with miR-124 mediates Erlotinib resistance in K-RAS mutated pancreatic cancer. J. Pharm. Pharmacol. 2019, 71, 196–205. [Google Scholar] [CrossRef]
- Sugiyama, N. Mass Spectrometry-Based Discovery of in vitro Kinome Substrates. Mass Spectrom. 2020, 9, A0082. [Google Scholar] [CrossRef] [Green Version]
- Dong, M.; Nio, Y.; Guo, K.J.; Tamura, K.; Tian, Y.L.; Dong, Y.T. Epidermal growth factor and its receptor as prognostic indicators in Chinese patients with pancreatic cancer. Anticancer Res. 1998, 18, 4613–4619. [Google Scholar] [PubMed]
- Costache, M.I.; Ioana, M.; Iordache, S.; Ene, D.; Costache, C.A.; Saftoiu, A. VEGF Expression in Pancreatic Cancer and Other Malignancies: A Review of the Literature. Rom. J. Intern. Med. 2015, 53, 199–208. [Google Scholar] [CrossRef] [PubMed] [Green Version]
- Kurenova, E.; Liao, J.; He, D.H.; Hunt, D.; Yemma, M.; Bshara, W.; Seshadri, M.; Cance, W.G. The FAK scaffold inhibitor C4 disrupts FAK-VEGFR-3 signaling and inhibits pancreatic cancer growth. Oncotarget 2013, 4, 1632–1646. [Google Scholar] [CrossRef] [PubMed] [Green Version]
- Schneider, M.; Buchler, P.; Giese, N.; Giese, T.; Wilting, J.; Buchler, M.W.; Friess, H. Role of lymphangiogenesis and lymphangiogenic factors during pancreatic cancer progression and lymphatic spread. Int. J. Oncol. 2006, 28, 883–890. [Google Scholar] [CrossRef]
- Von Marschall, Z.; Scholz, A.; Stacker, S.A.; Achen, M.G.; Jackson, D.G.; Alves, F.; Schirner, M.; Haberey, M.; Thierauch, K.H.; Wiedenmann, B.; et al. Vascular endothelial growth factor-D induces lymphangiogenesis and lymphatic metastasis in models of ductal pancreatic cancer. Int. J. Oncol. 2005, 27, 669–679. [Google Scholar]
- Berardi, R.; Torniai, M.; Partelli, S.; Rubini, C.; Pagliaretta, S.; Savini, A.; Polenta, V.; Santoni, M.; Giampieri, R.; Onorati, S.; et al. Impact of vascular endothelial growth factor (VEGF) and vascular endothelial growth factor receptor (VEGFR) single nucleotide polymorphisms on outcome in gastroenteropancreatic neuroendocrine neoplasms. PLoS ONE 2018, 13, e0197035. [Google Scholar] [CrossRef]
- Payankaulam, S.; Raicu, A.M.; Arnosti, D.N. Transcriptional Regulation of INSR, the Insulin Receptor Gene. Genes 2019, 10, 984. [Google Scholar] [CrossRef] [Green Version]
- Ofer, P.; Heidegger, I.; Eder, I.E.; Schöpf, B.; Neuwirt, H.; Geley, S.; Klocker, H.; Massoner, P. Both IGF1R and INSR Knockdown Exert Antitumorigenic Effects in Prostate Cancer In Vitro and In Vivo. Mol. Endocrinol. 2015, 29, 1694–1707. [Google Scholar] [CrossRef] [Green Version]
- Quinn, B.A.; Wang, S.; Barile, E.; Das, S.K.; Emdad, L.; Sarkar, D.; De, S.K.; Morvaridi, S.K.; Stebbins, J.L.; Pandol, S.J.; et al. Therapy of pancreatic cancer via an EphA2 receptor-targeted delivery of gemcitabine. Oncotarget 2016, 7, 17103–17110. [Google Scholar] [CrossRef]
- Koshikawa, N.; Minegishi, T.; Kiyokawa, H.; Seiki, M. Specific detection of soluble EphA2 fragments in blood as a new biomarker for pancreatic cancer. Cell Death Dis. 2017, 8, e3134. [Google Scholar] [CrossRef]
- Fan, J.; Wei, Q.; Koay, E.J.; Liu, Y.; Ning, B.; Bernard, P.W.; Zhang, N.; Han, H.; Katz, M.H.; Zhao, Z.; et al. Chemoresistance Transmission via Exosome-Mediated EphA2 Transfer in Pancreatic Cancer. Theranostics 2018, 8, 5986–5994. [Google Scholar] [CrossRef] [PubMed]
- Markosyan, N.; Li, J.; Sun, Y.H.; Richman, L.P.; Lin, J.H.; Yan, F.; Quinones, L.; Sela, Y.; Yamazoe, T.; Gordon, N.; et al. Tumor cell-intrinsic EPHA2 suppresses anti-tumor immunity by regulating PTGS2 (COX-2). J. Clin. Investig. 2019, 129, 3594–3609. [Google Scholar] [CrossRef] [PubMed] [Green Version]
- Van den Broeck, A.; Vankelecom, H.; Van Eijsden, R.; Govaere, O.; Topal, B. Molecular markers associated with outcome and metastasis in human pancreatic cancer. J. Exp. Clin. Cancer Res. CR 2012, 31, 68. [Google Scholar] [CrossRef] [PubMed] [Green Version]
- Chee, C.E.; Krishnamurthi, S.; Nock, C.J.; Meropol, N.J.; Gibbons, J.; Fu, P.; Bokar, J.; Teston, L.; O’Brien, T.; Gudena, V.; et al. Phase II study of dasatinib (BMS-354825) in patients with metastatic adenocarcinoma of the pancreas. Oncologist 2013, 18, 1091–1092. [Google Scholar] [CrossRef] [PubMed] [Green Version]
- Huang, C.; Yuan, W.; Lai, C.; Zhong, S.; Yang, C.; Wang, R.; Mao, L.; Chen, Z.; Chen, Z. EphA2-to-YAP pathway drives gastric cancer growth and therapy resistance. Int. J. Cancer 2020, 146, 1937–1949. [Google Scholar] [CrossRef] [PubMed]
- Hamaoka, Y.; Negishi, M.; Katoh, H. Tyrosine kinase activity of EphA2 promotes its S897 phosphorylation and glioblastoma cell proliferation. Biochem. Biophys. Res. Commun. 2018, 499, 920–926. [Google Scholar] [CrossRef] [PubMed] [Green Version]
- Pettazzoni, P.; Viale, A.; Shah, P.; Carugo, A.; Ying, H.; Wang, H.; Genovese, G.; Seth, S.; Minelli, R.; Green, T.; et al. Genetic events that limit the efficacy of MEK and RTK inhibitor therapies in a mouse model of KRAS-driven pancreatic cancer. Cancer Res. 2015, 75, 1091–1101. [Google Scholar] [CrossRef] [Green Version]
- Xie, L.; Kassner, M.; Munoz, R.M.; Que, Q.Q.; Kiefer, J.; Zhao, Y.; Mousses, S.; Yin, H.H.; Von Hoff, D.D.; Han, H. Kinome-wide siRNA screening identifies molecular targets mediating the sensitivity of pancreatic cancer cells to Aurora kinase inhibitors. Biochem. Pharmacol. 2012, 83, 452–461. [Google Scholar] [CrossRef] [Green Version]
- Jouenne, F.; Chauvot de Beauchene, I.; Bollaert, E.; Avril, M.F.; Caron, O.; Ingster, O.; Lecesne, A.; Benusiglio, P.; Terrier, P.; Caumette, V.; et al. Germline CDKN2A/P16INK4A mutations contribute to genetic determinism of sarcoma. J. Med. Genet. 2017, 54, 607–612. [Google Scholar] [CrossRef] [Green Version]
- Knosel, T.; Chen, Y.; Altendorf-Hofmann, A.; Danielczok, C.; Freesmeyer, M.; Settmacher, U.; Wurst, C.; Schulz, S.; Yang, L.L.; Petersen, I. High KIT and PDGFRA are associated with shorter patients survival in gastroenteropancreatic neuroendocrine tumors, but mutations are a rare event. J. Cancer Res. Clin. Oncol. 2012, 138, 397–403. [Google Scholar] [CrossRef]
- Wei, T.; Zhang, L.N.; Lv, Y.; Ma, X.Y.; Zhi, L.; Liu, C.; Ma, F.; Zhang, X.F. Overexpression of platelet-derived growth factor receptor alpha promotes tumor progression and indicates poor prognosis in hepatocellular carcinoma. Oncotarget 2014, 5, 10307–10317. [Google Scholar] [CrossRef] [PubMed]
- Ahn, K.; Ji, Y.G.; Cho, H.J.; Lee, D.H. Synergistic Anti-Cancer Effects of AKT and SRC Inhibition in Human Pancreatic Cancer Cells. Yonsei Med. J. 2018, 59, 727–735. [Google Scholar] [CrossRef] [PubMed]
- Li, J.; Hu, B.; Wang, T.; Huang, W.; Ma, C.; Zhao, Q.; Zhuo, L.; Zhang, T.; Jiang, Y. C-Src confers resistance to mitotic stress through inhibition DMAP1/Bub3 complex formation in pancreatic cancer. Mol. Cancer 2018, 17, 174. [Google Scholar] [CrossRef] [PubMed]
- Liu, S.T.; Pham, H.; Pandol, S.J.; Ptasznik, A. Src as the link between inflammation and cancer. Front. Physiol. 2013, 4, 416. [Google Scholar] [CrossRef] [PubMed] [Green Version]
- Ma, L.; Wei, J.; Su, G.H.; Lin, J. Dasatinib can enhance paclitaxel and gemcitabine inhibitory activity in human pancreatic cancer cells. Cancer Biol. Ther. 2019, 20, 855–865. [Google Scholar] [CrossRef]
- Ogawa, K.; Lin, Q.; Li, L.; Bai, X.; Chen, X.; Chen, H.; Kong, R.; Wang, Y.; Zhu, H.; He, F.; et al. Aspartate beta-hydroxylase promotes pancreatic ductal adenocarcinoma metastasis through activation of SRC signaling pathway. J. Hematol. Oncol. 2019, 12, 144. [Google Scholar] [CrossRef] [Green Version]
- Aligayer, H.; Boyd, D.D.; Heiss, M.M.; Abdalla, E.K.; Curley, S.A.; Gallick, G.E. Activation of Src kinase in primary colorectal carcinoma: An indicator of poor clinical prognosis. Cancer 2002, 94, 344–351. [Google Scholar] [CrossRef] [Green Version]
- Mahajan, K.; Mahajan, N.P. ACK1/TNK2 tyrosine kinase: Molecular signaling and evolving role in cancers. Oncogene 2015, 34, 4162–4167. [Google Scholar] [CrossRef] [Green Version]
- Mahajan, K.; Malla, P.; Lawrence, H.R.; Chen, Z.; Kumar-Sinha, C.; Malik, R.; Shukla, S.; Kim, J.; Coppola, D.; Lawrence, N.J.; et al. ACK1/TNK2 Regulates Histone H4 Tyr88-phosphorylation and AR Gene Expression in Castration-Resistant Prostate Cancer. Cancer Cell 2017, 31, 790–803.e8. [Google Scholar] [CrossRef] [Green Version]
- Mahajan, N.P.; Coppola, D.; Kim, J.; Lawrence, H.R.; Lawrence, N.J.; Mahajan, K. Blockade of ACK1/TNK2 To Squelch the Survival of Prostate Cancer Stem-like Cells. Sci. Rep. 2018, 8, 1954. [Google Scholar] [CrossRef] [Green Version]
- Qi, L.; Ding, Y. TNK2 as a key drug target for the treatment of metastatic colorectal cancer. Int. J. Biol. Macromol. 2018, 119, 48–52. [Google Scholar] [CrossRef] [PubMed]
- Shinmura, K.; Kiyose, S.; Nagura, K.; Igarashi, H.; Inoue, Y.; Nakamura, S.; Maeda, M.; Baba, M.; Konno, H.; Sugimura, H. TNK2 gene amplification is a novel predictor of a poor prognosis in patients with gastric cancer. J. Surg. Oncol. 2014, 109, 189–197. [Google Scholar] [CrossRef] [PubMed]
- Wang, Y.; Han, D.; Pan, L.; Sun, J. The positive feedback between lncRNA TNK2-AS1 and STAT3 enhances angiogenesis in non-small cell lung cancer. Biochem. Biophys. Res. Commun. 2018, 507, 185–192. [Google Scholar] [CrossRef] [PubMed]
- Wu, X.; Zahari, M.S.; Renuse, S.; Kelkar, D.S.; Barbhuiya, M.A.; Rojas, P.L.; Stearns, V.; Gabrielson, E.; Malla, P.; Sukumar, S.; et al. The non-receptor tyrosine kinase TNK2/ACK1 is a novel therapeutic target in triple negative breast cancer. Oncotarget 2017, 8, 2971–2983. [Google Scholar] [CrossRef] [PubMed] [Green Version]
- Howlin, J.; Rosenkvist, J.; Andersson, T. TNK2 preserves epidermal growth factor receptor expression on the cell surface and enhances migration and invasion of human breast cancer cells. Breast Cancer Res. BCR 2008, 10, R36. [Google Scholar] [CrossRef] [Green Version]
- Galisteo, M.L.; Yang, Y.; Urena, J.; Schlessinger, J. Activation of the nonreceptor protein tyrosine kinase Ack by multiple extracellular stimuli. Proc. Natl. Acad. Sci. USA 2006, 103, 9796–9801. [Google Scholar] [CrossRef] [Green Version]
- Lin, Q.; Wang, J.; Childress, C.; Yang, W. The activation mechanism of ACK1 (activated Cdc42-associated tyrosine kinase 1). Biochem. J. 2012, 445, 255–264. [Google Scholar] [CrossRef]
- Britton, D.; Zen, Y.; Quaglia, A.; Selzer, S.; Mitra, V.; Lobetaner, C.; Jung, S.; Bohm, G.; Schmid, P.; Prefot, P.; et al. Quantification of pancreatic cancer proteome and phosphorylome: Indicates molecular events likely contributing to cancer and activity of drug targets. PLoS ONE 2014, 9, e90948. [Google Scholar] [CrossRef] [Green Version]
- Cannon, A.; Thompson, C.; Hall, B.R.; Jain, M.; Kumar, S.; Batra, S.K. Desmoplasia in pancreatic ductal adenocarcinoma: Insight into pathological function and therapeutic potential. Genes Cancer 2018, 9, 78–86. [Google Scholar] [CrossRef]
- Pandol, S.; Edderkaoui, M.; Gukovsky, I.; Lugea, A.; Gukovskaya, A. Desmoplasia of pancreatic ductal adenocarcinoma. Clin. Gastroenterol. Hepatol. 2009, 7 (Suppl. 11), S44–S47. [Google Scholar] [CrossRef] [Green Version]
- Wei, C.; Li, L.; Menon, M.C.; Zhang, W.; Fu, J.; Kidd, B.; Keung, K.L.; Woytovich, C.; Greene, I.; Xiao, W.; et al. Genomic Analysis of Kidney Allograft Injury Identifies Hematopoietic Cell Kinase as a Key Driver of Renal Fibrosis. J. Am. Soc. Nephrol. JASN 2017, 28, 1385–1393. [Google Scholar] [CrossRef] [PubMed]
- Torsello, B.; De Marco, S.; Bombelli, S.; Chisci, E.; Cassina, V.; Corti, R.; Bernasconi, D.; Giovannoni, R.; Bianchi, C.; Perego, R.A. The 1ALCTL and 1BLCTL isoforms of Arg/Abl2 induce fibroblast activation and extra cellular matrix remodelling differently. Biol. Open 2019, 8, bio038554. [Google Scholar] [CrossRef] [PubMed] [Green Version]
- Wang, Z.; Bian, H.; Bartual, S.G.; Du, W.; Luo, J.; Zhao, H.; Zhang, S.; Mo, C.; Zhou, Y.; Xu, Y.; et al. Structure-Based Design of Tetrahydroisoquinoline-7-carboxamides as Selective Discoidin Domain Receptor 1 (DDR1) Inhibitors. J. Med. Chem. 2016, 59, 5911–5916. [Google Scholar] [CrossRef] [PubMed] [Green Version]
- Richter, H.; Satz, A.L.; Bedoucha, M.; Buettelmann, B.; Petersen, A.C.; Harmeier, A.; Hermosilla, R.; Hochstrasser, R.; Burger, D.; Gsell, B.; et al. DNA-Encoded Library-Derived DDR1 Inhibitor Prevents Fibrosis and Renal Function Loss in a Genetic Mouse Model of Alport Syndrome. ACS Chem. Biol. 2018, 14, 37–49. [Google Scholar] [CrossRef] [PubMed]
- Wang, Z.; Zhang, Y.; Bartual, S.G.; Luo, J.; Xu, T.; Du, W.; Xun, Q.; Tu, Z.; Brekken, R.A.; Ren, X.; et al. Tetrahydroisoquinoline-7-carboxamide Derivatives as New Selective Discoidin Domain Receptor 1 (DDR1) Inhibitors. ACS Med. Chem. Lett. 2017, 8, 327–332. [Google Scholar] [CrossRef]
- Tao, J.; Zhang, M.; Wen, Z.; Wang, B.; Zhang, L.; Ou, Y.; Tang, X.; Yu, X.; Jiang, Q. Inhibition of EP300 and DDR1 synergistically alleviates pulmonary fibrosis in vitro and in vivo. Biomed Pharm. 2018, 106, 1727–1733. [Google Scholar] [CrossRef]
- Lin, L.; Shi, C.; Sun, Z.; Le, N.-T.; Abe, J.-I.; Hu, K. The Ser/Thr kinase p90RSK promotes kidney fibrosis by modulating fibroblast–epithelial crosstalk. J. Biol. Chem. 2019, 294, 9901–9910. [Google Scholar] [CrossRef]
- Abe, J.; Berk, B. Fyn-dependent activation of p90 ribosomal S6 kinase (RSK) by H2O2: New redox sensitive pathway. In Circulation; Lippincott Williams & Wilkins: Philadelphia, PA, USA, 1998; p. 220. [Google Scholar]
- Dolivo, D.M.; Larson, S.A.; Dominko, T. Tryptophan metabolites kynurenine and serotonin regulate fibroblast activation and fibrosis. Cell. Mol. Life Sci. 2018, 75, 3663–3681. [Google Scholar] [CrossRef]
- Jiang, S.-H.; Li, J.; Dong, F.-Y.; Yang, J.-Y.; Liu, D.-J.; Yang, X.-M.; Wang, Y.-H.; Yang, M.-W.; Fu, X.-L.; Zhang, X.-X.; et al. Increased Serotonin Signaling Contributes to the Warburg Effect in Pancreatic Tumor Cells Under Metabolic Stress and Promotes Growth of Pancreatic Tumors in Mice. Gastroenterology 2017, 153, 277–291.e19. [Google Scholar] [CrossRef]
- Martinez-Bosch, N.; Vinaixa, J.; Navarro, P. Immune Evasion in Pancreatic Cancer: From Mechanisms to Therapy. Cancers 2018, 10, 6. [Google Scholar] [CrossRef] [Green Version]
- Philipsen, L.; Reddycherla, A.V.; Hartig, R.; Gumz, J.; Kästle, M.; Kritikos, A.; Poltorak, M.P.; Prokazov, Y.; Turbin, E.; Weber, A.; et al. De novo phosphorylation and conformational opening of the tyrosine kinase Lck act in concert to initiate T cell receptor signaling. Sci. Signal. 2017, 10. [Google Scholar] [CrossRef] [PubMed]
- Meng, Y.; Sha, S.; Yang, J.; Ren, H. Effects of Tec Tyrosine Kinase Inhibition on the Inflammatory Response of Severe Acute Pancreatitis-Associated Acute Lung Injury in Mice. Dig. Dis. Sci. 2019, 64, 2167–2176. [Google Scholar] [CrossRef] [PubMed]
- Borowiec, M.; Liew, C.W.; Thompson, R.; Boonyasrisawat, W.; Hu, J.; Mlynarski, W.M.; El Khattabi, I.; Kim, S.H.; Marselli, L.; Rich, S.S.; et al. Mutations at the BLK locus linked to maturity onset diabetes of the young and -cell dysfunction. Proc. Natl. Acad. Sci. USA 2009, 106, 14460–14465. [Google Scholar] [CrossRef] [PubMed] [Green Version]
- Feanny, M.A.; Fagan, S.P.; Ballian, N.; Liu, S.H.; Li, Z.; Wang, X.; Fisher, W.; Brunicardi, F.C.; Belaguli, N.S. PDX-1 expression is associated with islet proliferation in vitro and in vivo. J. Surg. Res. 2008, 144, 8–16. [Google Scholar] [CrossRef]
- Liu, S.; Ballian, N.; Belaguli, N.S.; Patel, S.; Li, M.; Templeton, N.S.; Gingras, M.C.; Gibbs, R.; Fisher, W.; Brunicardi, F.C. PDX-1 acts as a potential molecular target for treatment of human pancreatic cancer. Pancreas 2008, 37, 210–220. [Google Scholar] [CrossRef]
- Liu, S.; Wang, X.P.; Brunicardi, F.C. Enhanced cytotoxicity of RIPTK gene therapy of pancreatic cancer via PDX-1 co-delivery. J. Surg. Res. 2007, 137, 1–9. [Google Scholar] [CrossRef]
- Liu, S.H.; Rao, D.D.; Nemunaitis, J.; Senzer, N.; Zhou, G.; Dawson, D.; Gingras, M.C.; Wang, Z.; Gibbs, R.; Norman, M.; et al. PDX-1 is a therapeutic target for pancreatic cancer, insulinoma and islet neoplasia using a novel RNA interference platform. PLoS ONE 2012, 7, e40452. [Google Scholar] [CrossRef] [Green Version]
- Liu, S.H.; Yu, J.; Sanchez, R.; Liu, X.; Heidt, D.; Willey, J.; Nemunaitis, J.; Brunicardi, F.C. A novel synthetic human insulin super promoter for targeting PDX-1-expressing pancreatic cancer. Cancer Lett. 2018, 418, 75–83. [Google Scholar] [CrossRef]
- Liu, S.H.; Hong, Y.; Markowiak, S.; Sanchez, R.; Creeden, J.; Nemunaitis, J.; Kalinoski, A.; Willey, J.; Erhardt, P.; Lee, J.; et al. BIRC5 is a target for molecular imaging and detection of human pancreatic cancer. Cancer Lett. 2019, 457, 10–19. [Google Scholar] [CrossRef]
- Liu, S.H.; Yu, J.; Creeden, J.F.; Sutton, J.M.; Markowiak, S.; Sanchez, R.; Nemunaitis, J.; Kalinoski, A.; Zhang, J.T.; Damoiseaux, R.; et al. Repurposing metformin, simvastatin and digoxin as a combination for targeted therapy for pancreatic ductal adenocarcinoma. Cancer Lett. 2020, 491, 97–107. [Google Scholar] [CrossRef]
- Kondratyeva, L.G.; Safina, D.R.; Chernov, I.P.; Kopantzev, E.P.; Kostrov, S.V.; Sverdlov, E.D. PDX1, a key factor in pancreatic embryogenesis, can exhibit antimetastatic activity in pancreatic ductal adenocarcinoma. Cancer Manag. Res. 2019, 11, 7077–7087. [Google Scholar] [CrossRef] [PubMed] [Green Version]
- Roy, N.; Takeuchi, K.K.; Ruggeri, J.M.; Bailey, P.; Chang, D.; Li, J.; Leonhardt, L.; Puri, S.; Hoffman, M.T.; Gao, S.; et al. PDX1 dynamically regulates pancreatic ductal adenocarcinoma initiation and maintenance. Genes Dev. 2016, 30, 2669–2683. [Google Scholar] [CrossRef] [PubMed] [Green Version]
- Vinogradova, T.V.; Sverdlov, E.D. PDX1: A Unique Pancreatic Master Regulator Constantly Changes Its Functions during Embryonic Development and Progression of Pancreatic Cancer. Biochemistry 2017, 82, 887–893. [Google Scholar] [CrossRef] [PubMed]
- Jones, S.; Zhang, X.; Parsons, D.W.; Lin, J.C.; Leary, R.J.; Angenendt, P.; Mankoo, P.; Carter, H.; Kamiyama, H.; Jimeno, A.; et al. Core signaling pathways in human pancreatic cancers revealed by global genomic analyses. Science 2008, 321, 1801–1806. [Google Scholar] [CrossRef] [PubMed] [Green Version]
- Raphael, B.J.; Hruban, R.H.; Aguirre, A.J.; Moffitt, R.A.; Yeh, J.J.; Stewart, C.; Robertson, A.G.; Cherniack, A.D.; Gupta, M.; Getz, G.; et al. Integrated Genomic Characterization of Pancreatic Ductal Adenocarcinoma. Cancer Cell 2017, 32, 185–203.e13. [Google Scholar] [CrossRef]
- Torres, C.; Grippo, P.J. Pancreatic cancer subtypes: A roadmap for precision medicine. Ann. Med. 2018, 50, 277–287. [Google Scholar] [CrossRef]
- Lieber, M.; Mazzetta, J.; Nelson-Rees, W.; Kaplan, M.; Todaro, G. Establishment of a continuous tumor-cell line (panc-1) from a human carcinoma of the exocrine pancreas. Int. J. Cancer 1975, 15, 741–747. [Google Scholar] [CrossRef]
- Hilhorst, R.; Houkes, L.; Mommersteeg, M.; Musch, J.; van den Berg, A.; Ruijtenbeek, R. Peptide microarrays for profiling of serine/threonine kinase activity of recombinant kinases and lysates of cells and tissue samples. Methods Mol. Biol. 2013, 977, 259–271. [Google Scholar]
- Appuhamy, J.A.; Nayananjalie, W.A.; England, E.M.; Gerrard, D.E.; Akers, R.M.; Hanigan, M.D. Effects of AMP-activated protein kinase (AMPK) signaling and essential amino acids on mammalian target of rapamycin (mTOR) signaling and protein synthesis rates in mammary cells. J. Dairy Sci. 2014, 97, 419–429. [Google Scholar] [CrossRef]
- Dorsett, C.R.; McGuire, J.L.; Niedzielko, T.L.; DePasquale, E.A.; Meller, J.; Floyd, C.L.; McCullumsmith, R.E. Traumatic Brain Injury Induces Alterations in Cortical Glutamate Uptake without a Reduction in Glutamate Transporter-1 Protein Expression. J. Neurotrauma 2017, 34, 220–234. [Google Scholar] [CrossRef] [Green Version]
- Hunter, T. Signaling—2000 and beyond. Cell 2000, 100, 113–127. [Google Scholar] [CrossRef] [Green Version]
- Manning, G.; Whyte, D.B.; Martinez, R.; Hunter, T.; Sudarsanam, S. The protein kinase complement of the human genome. Science 2002, 298, 1912–1934. [Google Scholar] [CrossRef] [PubMed] [Green Version]
- Miranda-Saavedra, D.; Barton, G.J. Classification and functional annotation of eukaryotic protein kinases. Proteins 2007, 68, 893–914. [Google Scholar] [CrossRef] [PubMed]
- Wang, C.; Xu, H.; Lin, S.; Deng, W.; Zhou, J.; Zhang, Y.; Shi, Y.; Peng, D.; Xue, Y. GPS 5.0: An Update on the Prediction of Kinase-specific Phosphorylation Sites in Proteins. Genom. Proteom. Bioinform. 2020, 18, 72–80. [Google Scholar] [CrossRef] [PubMed]
- Xue, Y.; Liu, Z.; Cao, J.; Ma, Q.; Gao, X.; Wang, Q.; Jin, C.; Zhou, Y.; Wen, L.; Ren, J. GPS 2.1: Enhanced prediction of kinase-specific phosphorylation sites with an algorithm of motif length selection. Protein Eng. Des. Sel. 2011, 24, 255–260. [Google Scholar] [CrossRef] [PubMed] [Green Version]
- Creeden, J.F.; Alganem, K.; Imami, A.S.; Henkel, N.D.; Brunicardi, F.C.; Liu, S.-H.; Shukla, R.; Tomar, T.; Naji, F.; McCullumsmith, R.E. Emerging Kinase Therapeutic Targets in Pancreatic Ductal Adenocarcinoma and Pancreatic Cancer Desmoplasia. Int. J. Mol. Sci. 2020. In review. [Google Scholar]
- Chou, A.; Froio, D.; Nagrial, A.M.; Parkin, A.; Murphy, K.J.; Chin, V.T.; Wohl, D.; Steinmann, A.; Stark, R.; Drury, A.; et al. Tailored first-line and second-line CDK4-targeting treatment combinations in mouse models of pancreatic cancer. Gut 2018, 67, 2142–2155. [Google Scholar] [CrossRef] [Green Version]


| Cell Line | Rank | Kinase | Family | Average | KRSA | UKA |
|---|---|---|---|---|---|---|
| PANC1 | #1 | LCK | SRC | 96% | 91% | 100% |
| PANC1 | #2 | DDR2 | DDR | 96% | 96% | |
| PANC1 | #3 | LYN | SRC | 95% | 91% | 99% |
| PANC1 | #4 | SRC | SRC | 92% | 91% | 92% |
| PANC1 | #5 | ABL1 | ABL | 91% | 87% | 95% |
| PANC1 | #6 | TEC | TEC | 90% | 100% | 80% |
| PANC1 | #7 | FYN | SRC | 90% | 91% | 88% |
| PANC1 | #8 | BLK | SRC | 89% | 91% | 87% |
| PANC1 | #9 | TXK | TEC | 89% | 100% | 77% |
| PANC1 | #10 | SRMS | SRC | 88% | 91% | 85% |
| PDCL15 | #1 | DDR2 | DDR | 100% | 100% | - |
| PDCL15 | #2 | LCK | SRC | 98% | 96% | 100% |
| PDCL15 | #3 | LYN | SRC | 97% | 96% | 99% |
| PDCL15 | #4 | TEC | TEC | 94% | 91% | 97% |
| PDCL15 | #5 | SRC | SRC | 94% | 96% | 92% |
| PDCL15 | #6 | FYN | SRC | 93% | 96% | 91% |
| PDCL15 | #7 | PDGFRA | PDGFR | 90% | 87% | 93% |
| PDCL15 | #8 | FRK | FRK | 89% | 83% | 96% |
| PDCL15 | #9 | BLK | SRC | 88% | 96% | 81% |
| PDCL15 | #10 | PTK7 | PTK7 | 88% | - | 88% |
| PDCL5 | #1 | PTK7 | PTK7 | 99% | - | 99% |
| PDCL5 | #2 | ROS1 | SEV | 97% | 100% | 95% |
| PDCL5 | #3 | TNK2 | ACK | 96% | 96% | - |
| PDCL5 | #4 | DDR2 | DDR | 87% | 87% | - |
| PDCL5 | #5 | ALK | ALK | 86% | 74% | 97% |
| PDCL5 | #6 | TXK | TEC | 83% | 65% | 100% |
| PDCL5 | #7 | LTK | ALK | 80% | 74% | 86% |
| PDCL5 | #8 | ITK | TEC | 79% | 65% | 93% |
| PDCL5 | #9 | FLT1 | VEGFR | 78% | 91% | 65% |
| PDCL5 | #10 | EPHB1 | EPH | 76% | 61% | 92% |
| Patient-Derived | #1 | PTK7 | PTK7 | 100% | - | 100% |
| Patient-Derived | #2 | DDR2 | DDR | 100% | 100% | - |
| Patient-Derived | #3 | LYN | SRC | 96% | 96% | 96% |
| Patient-Derived | #4 | TXK | TEC | 95% | 91% | 99% |
| Patient-Derived | #5 | TEC | TEC | 94% | 91% | 97% |
| Patient-Derived | #6 | LCK | SRC | 92% | 96% | 88% |
| Patient-Derived | #7 | BLK | SRC | 91% | 96% | 87% |
| Patient-Derived | #8 | SRMS | SRC | 87% | 96% | 79% |
| Patient-Derived | #9 | ITK | TEC | 86% | 91% | 80% |
| Patient-Derived | #10 | FRK | FRK | 84% | 78% | 91% |
| All | #1 | DDR2 | DDR | 100% | 100% | - |
| All | #2 | TXK | TEC | 96% | 96% | 97% |
| All | #3 | PTK7 | PTK7 | 96% | - | 96% |
| All | #4 | LYN | SRC | 96% | 91% | 100% |
| All | #5 | LCK | SRC | 95% | 91% | 99% |
| All | #6 | TEC | TEC | 93% | 96% | 91% |
| All | #7 | BLK | SRC | 90% | 91% | 88% |
| All | #8 | SRMS | SRC | 88% | 91% | 84% |
| All | #9 | FRK | FRK | 87% | 83% | 92% |
| All | #10 | PDGFRA | PDGFR | 84% | 87% | 81% |
| Cell Line | Rank | Kinase | Family | Weighted Average | KRSA | UKA |
|---|---|---|---|---|---|---|
| PANC1 | #1 | LCK | SRC | 96% | 91% | 100% |
| PANC1 | #2 | LYN | SRC | 95% | 91% | 99% |
| PANC1 | #3 | SRC | SRC | 92% | 91% | 92% |
| PANC1 | #4 | ABL1 | ABL | 91% | 87% | 95% |
| PANC1 | #5 | TEC | TEC | 90% | 100% | 80% |
| PANC1 | #6 | FYN | SRC | 90% | 91% | 88% |
| PANC1 | #7 | BLK | SRC | 89% | 91% | 87% |
| PANC1 | #8 | TXK | TEC | 89% | 100% | 77% |
| PANC1 | #9 | SRMS | SRC | 88% | 91% | 85% |
| PANC1 | #10 | ABL2 | ABL | 88% | 87% | 89% |
| PDCL15 | #1 | LCK | SRC | 98% | 96% | 100% |
| PDCL15 | #2 | LYN | SRC | 97% | 96% | 99% |
| PDCL15 | #3 | TEC | TEC | 94% | 91% | 97% |
| PDCL15 | #4 | SRC | SRC | 94% | 96% | 92% |
| PDCL15 | #5 | FYN | SRC | 93% | 96% | 91% |
| PDCL15 | #6 | PDGFRA | PDGFR | 90% | 87% | 93% |
| PDCL15 | #7 | FRK | FRK | 89% | 83% | 96% |
| PDCL15 | #8 | BLK | SRC | 88% | 96% | 81% |
| PDCL15 | #9 | HCK | SRC | 86% | 96% | 77% |
| PDCL15 | #10 | TXK | TEC | 86% | 91% | 80% |
| PDCL5 | #1 | ROS1 | SEV | 97% | 100% | 95% |
| PDCL5 | #2 | ALK | ALK | 86% | 74% | 97% |
| PDCL5 | #3 | TXK | TEC | 83% | 65% | 100% |
| PDCL5 | #4 | LTK | ALK | 80% | 74% | 86% |
| PDCL5 | #5 | ITK | TEC | 79% | 65% | 93% |
| PDCL5 | #6 | FLT1 | VEGFR | 78% | 91% | 65% |
| PDCL5 | #7 | EPHB1 | EPH | 76% | 61% | 92% |
| PDCL5 | #8 | EPHB3 | EPH | 74% | 61% | 88% |
| PDCL5 | #9 | BTK | TEC | 72% | 65% | 78% |
| PDCL5 | #10 | EGFR | EGFR | 70% | 83% | 58% |
| Patient-Derived | #1 | LYN | SRC | 96% | 96% | 96% |
| Patient-Derived | #2 | TXK | TEC | 95% | 91% | 99% |
| Patient-Derived | #3 | TEC | TEC | 94% | 91% | 97% |
| Patient-Derived | #4 | LCK | SRC | 92% | 96% | 88% |
| Patient-Derived | #5 | BLK | SRC | 91% | 96% | 87% |
| Patient-Derived | #6 | SRMS | SRC | 87% | 96% | 79% |
| Patient-Derived | #7 | ITK | TEC | 86% | 91% | 80% |
| Patient-Derived | #8 | FRK | FRK | 84% | 78% | 91% |
| Patient-Derived | #9 | ROS1 | SEV | 80% | 74% | 85% |
| Patient-Derived | #10 | HCK | SRC | 78% | 96% | 60% |
| All | #1 | TXK | TEC | 96% | 96% | 97% |
| All | #2 | LYN | SRC | 96% | 91% | 100% |
| All | #3 | LCK | SRC | 95% | 91% | 99% |
| All | #4 | TEC | TEC | 93% | 96% | 91% |
| All | #5 | BLK | SRC | 90% | 91% | 88% |
| All | #6 | SRMS | SRC | 88% | 91% | 84% |
| All | #7 | FRK | FRK | 87% | 83% | 92% |
| All | #8 | PDGFRA | PDGFR | 84% | 87% | 81% |
| All | #9 | SRC | SRC | 84% | 91% | 76% |
| All | #10 | ABL1 | ABL | 84% | 74% | 93% |
| Cell Line | Rank | Kinase | Family | Average | KRSA | UKA | PTM-SEA | KEA3 |
|---|---|---|---|---|---|---|---|---|
| PANC1 | #1 | DDR2 | DDR | 97% | 96% | - | - | 98% |
| PANC1 | #2 | TXK | TEC | 89% | 100% | 77% | - | 90% |
| PANC1 | #3 | SRMS | SRC | 86% | 91% | 85% | - | 81% |
| PANC1 | #4 | SRC | SRC | 82% | 91% | 92% | 55% | 91% |
| PANC1 | #5 | FYN | SRC | 81% | 91% | 88% | 68% | 78% |
| PANC1 | #6 | MST1R | MET | 76% | 35% | 97% | - | 95% |
| PANC1 | #7 | INSR | INSR | 75% | 70% | 64% | 95% | 72% |
| PANC1 | #8 | ABL1 | ABL | 75% | 87% | 95% | 36% | 82% |
| PANC1 | #9 | FGR | SRC | 73% | 91% | 83% | - | 45% |
| PANC1 | #10 | KIT | PDGFR | 72% | 83% | 35% | - | 97% |
| PDCL15 | #1 | DDR2 | DDR | 99% | 100% | - | 98% | |
| PDCL15 | #2 | SRC | SRC | 90% | 96% | 92% | 82% | 90% |
| PDCL15 | #3 | PTK7 | PTK7 | 88% | - | 88% | - | |
| PDCL15 | #4 | TXK | TEC | 88% | 91% | 80% | - | 92% |
| PDCL15 | #5 | PDGFRA | PDGFR | 86% | 87% | 93% | 68% | 97% |
| PDCL15 | #6 | MST1R | MET | 86% | 78% | 87% | - | 93% |
| PDCL15 | #7 | SRMS | SRC | 84% | 96% | 73% | - | 82% |
| PDCL15 | #8 | KIT | PDGFR | 78% | 87% | 49% | - | 97% |
| PDCL15 | #9 | INSR | INSR | 73% | 70% | 57% | 100% | 65% |
| PDCL15 | #10 | TEC | TEC | 72% | 91% | 97% | - | 28% |
| PDCL5 | #1 | PTK7 | PTK7 | 99% | - | 99% | - | - |
| PDCL5 | #2 | ROS1 | SEV | 97% | 100% | 95% | - | - |
| PDCL5 | #3 | DDR2 | DDR | 92% | 87% | - | - | 97% |
| PDCL5 | #4 | TXK | TEC | 87% | 65% | 100% | - | 95% |
| PDCL5 | #5 | EPHB3 | EPH | 82% | 61% | 88% | - | 98% |
| PDCL5 | #6 | LTK | ALK | 80% | 74% | 86% | - | - |
| PDCL5 | #7 | EPHB1 | EPH | 76% | 61% | 92% | - | 76% |
| PDCL5 | #8 | FLT4 | VEGFR | 76% | 91% | 43% | - | 93% |
| PDCL5 | #9 | ITK | TEC | 72% | 65% | 93% | - | 57% |
| PDCL5 | #10 | FLT1 | VEGFR | 72% | 91% | 65% | - | 59% |
| Patient-Derived | #1 | PTK7 | PTK7 | 100% | - | 100% | - | - |
| Patient-Derived | #2 | DDR2 | DDR | 99% | 100% | - | - | 97% |
| Patient-Derived | #3 | TXK | TEC | 92% | 91% | 99% | - | 85% |
| Patient-Derived | #4 | SRMS | SRC | 84% | 96% | 79% | - | 76% |
| Patient-Derived | #5 | LCK | SRC | 80% | 96% | 88% | 60% | 78% |
| Patient-Derived | #6 | ROS1 | SEV | 80% | 74% | 85% | - | - |
| Patient-Derived | #7 | SRC | SRC | 79% | 96% | 45% | 96% | 81% |
| Patient-Derived | #8 | EPHB3 | EPH | 77% | 65% | 75% | - | 93% |
| Patient-Derived | #9 | FLT3 | PDGFR | 74% | 87% | 36% | - | 99% |
| Patient-Derived | #10 | ITK | TEC | 74% | 91% | 80% | - | 50% |
| All | #1 | DDR2 | DDR | 99% | 100% | - | - | 97% |
| All | #2 | PTK7 | PTK7 | 96% | - | 96% | - | - |
| All | #3 | TXK | TEC | 93% | 96% | 97% | - | 85% |
| All | #4 | SRC | SRC | 85% | 91% | 76% | 91% | 82% |
| All | #5 | SRMS | SRC | 84% | 91% | 84% | - | 76% |
| All | #6 | LCK | SRC | 81% | 91% | 99% | 55% | 78% |
| All | #7 | PDGFRA | PDGFR | 75% | 87% | 81% | 36% | 96% |
| All | #8 | ROS1 | SEV | 74% | 70% | 79% | - | - |
| All | #9 | FLT3 | PDGFR | 73% | 87% | 33% | - | 99% |
| All | #10 | ITK | TEC | 72% | 96% | 65% | - | 56% |
| Cell Line | Rank | Kinase | Family | Weighted Average | KRSA | UKA | PTM-SEA | KEA3 |
|---|---|---|---|---|---|---|---|---|
| PANC1 | #1 | SRC | SRC | 82% | 91% | 92% | 55% | 91% |
| PANC1 | #2 | FYN | SRC | 81% | 91% | 88% | 68% | 78% |
| PANC1 | #3 | INSR | INSR | 75% | 70% | 64% | 95% | 72% |
| PANC1 | #4 | ABL1 | ABL | 75% | 87% | 95% | 36% | 82% |
| PANC1 | #5 | LCK | SRC | 71% | 91% | 100% | 9% | 85% |
| PANC1 | #6 | PDGFRA | PDGFR | 70% | 83% | 91% | 9% | 97% |
| PANC1 | #7 | TXK | TEC | 67% | 100% | 77% | - | 90% |
| PANC1 | #8 | RET | RET | 67% | 26% | 77% | 77% | 87% |
| PANC1 | #9 | EPHA2 | EPH | 65% | 30% | 59% | 91% | 81% |
| PANC1 | #10 | SRMS | SRC | 64% | 91% | 85% | - | 81% |
| PDCL15 | #1 | SRC | SRC | 90% | 96% | 92% | 82% | 90% |
| PDCL15 | #2 | PDGFRA | PDGFR | 86% | 87% | 93% | 68% | 97% |
| PDCL15 | #3 | INSR | INSR | 73% | 70% | 57% | 100% | 65% |
| PDCL15 | #4 | LYN | SRC | 72% | 96% | 99% | 59% | 34% |
| PDCL15 | #5 | PDGFRB | PDGFR | 71% | 87% | 65% | 91% | 41% |
| PDCL15 | #6 | LCK | SRC | 70% | 96% | 100% | 0% | 85% |
| PDCL15 | #7 | EPHA2 | EPH | 69% | 74% | 28% | 91% | 82% |
| PDCL15 | #8 | TXK | TEC | 66% | 91% | 80% | - | 92% |
| PDCL15 | #9 | FYN | SRC | 66% | 96% | 91% | 0% | 76% |
| PDCL15 | #10 | MST1R | MET | 64% | 78% | 87% | - | 93% |
| PDCL5 | #1 | ALK | ALK | 70% | 74% | 97% | 63% | 45% |
| PDCL5 | #2 | ZAP70 | SYK | 65% | 52% | 69% | 70% | 70% |
| PDCL5 | #3 | TXK | TEC | 65% | 65% | 100% | - | 95% |
| PDCL5 | #4 | JAK2 | JAK | 65% | 43% | 91% | 53% | 73% |
| PDCL5 | #5 | EGFR | EGFR | 62% | 83% | 58% | 67% | 42% |
| PDCL5 | #6 | KDR | VEGFR | 62% | 91% | 39% | 30% | 89% |
| PDCL5 | #7 | EPHB3 | EPH | 62% | 61% | 88% | - | 98% |
| PDCL5 | #8 | AXL | AXL | 59% | 57% | 28% | 97% | 54% |
| PDCL5 | #9 | CSK | CSK | 59% | 13% | 72% | 87% | 63% |
| PDCL5 | #10 | INSR | INSR | 58% | 78% | 23% | 70% | 61% |
| Patient-Derived | #1 | LCK | SRC | 80% | 96% | 88% | 60% | 78% |
| Patient-Derived | #2 | SRC | SRC | 79% | 96% | 45% | 96% | 81% |
| Patient-Derived | #3 | LYN | SRC | 72% | 96% | 96% | 64% | 32% |
| Patient-Derived | #4 | PDGFRA | PDGFR | 72% | 87% | 53% | 52% | 96% |
| Patient-Derived | #5 | TXK | TEC | 69% | 91% | 99% | - | 85% |
| Patient-Derived | #6 | INSR | INSR | 66% | 83% | 21% | 100% | 60% |
| Patient-Derived | #7 | EGFR | EGFR | 64% | 61% | 41% | 92% | 63% |
| Patient-Derived | #8 | EPHA2 | EPH | 64% | 65% | 39% | 80% | 72% |
| Patient-Derived | #9 | SRMS | SRC | 63% | 96% | 79% | - | 76% |
| Patient-Derived | #10 | EPHB3 | EPH | 58% | 65% | 75% | - | 93% |
| All | #1 | SRC | SRC | 85% | 91% | 76% | 91% | 82% |
| All | #2 | LCK | SRC | 81% | 91% | 99% | 55% | 78% |
| All | #3 | PDGFRA | PDGFR | 75% | 87% | 81% | 36% | 96% |
| All | #4 | LYN | SRC | 72% | 91% | 100% | 59% | 38% |
| All | #5 | TXK | TEC | 70% | 96% | 97% | - | 85% |
| All | #6 | INSR | INSR | 68% | 78% | 32% | 100% | 62% |
| All | #7 | EPHA2 | EPH | 64% | 57% | 43% | 86% | 72% |
| All | #8 | JAK2 | JAK | 64% | 61% | 68% | 64% | 63% |
| All | #9 | SRMS | SRC | 63% | 91% | 84% | - | 76% |
| All | #10 | FYN | SRC | 62% | 91% | 59% | 23% | 74% |
Publisher’s Note: MDPI stays neutral with regard to jurisdictional claims in published maps and institutional affiliations. |
© 2020 by the authors. Licensee MDPI, Basel, Switzerland. This article is an open access article distributed under the terms and conditions of the Creative Commons Attribution (CC BY) license (http://creativecommons.org/licenses/by/4.0/).
Share and Cite
Creeden, J.F.; Alganem, K.; Imami, A.S.; Brunicardi, F.C.; Liu, S.-H.; Shukla, R.; Tomar, T.; Naji, F.; McCullumsmith, R.E. Kinome Array Profiling of Patient-Derived Pancreatic Ductal Adenocarcinoma Identifies Differentially Active Protein Tyrosine Kinases. Int. J. Mol. Sci. 2020, 21, 8679. https://doi.org/10.3390/ijms21228679
Creeden JF, Alganem K, Imami AS, Brunicardi FC, Liu S-H, Shukla R, Tomar T, Naji F, McCullumsmith RE. Kinome Array Profiling of Patient-Derived Pancreatic Ductal Adenocarcinoma Identifies Differentially Active Protein Tyrosine Kinases. International Journal of Molecular Sciences. 2020; 21(22):8679. https://doi.org/10.3390/ijms21228679
Chicago/Turabian StyleCreeden, Justin F., Khaled Alganem, Ali S. Imami, F. Charles Brunicardi, Shi-He Liu, Rammohan Shukla, Tushar Tomar, Faris Naji, and Robert E. McCullumsmith. 2020. "Kinome Array Profiling of Patient-Derived Pancreatic Ductal Adenocarcinoma Identifies Differentially Active Protein Tyrosine Kinases" International Journal of Molecular Sciences 21, no. 22: 8679. https://doi.org/10.3390/ijms21228679