Non-Muscle-Invasive Bladder Carcinoma with Respect to Basal Versus Luminal Keratin Expression


1
Department of Pathology, Seoul National University College of Medicine, Seoul 03080, Korea
2
Biomedical Research Institute, Seoul National University Hospital, Seoul 03080, Korea
3
Transdisciplinary Department of Medicine & Advanced Technology, Seoul National University Hospital, Seoul 03080, Korea
4
Kidney Research Institute, Medical Research Center, Seoul National University College of Medicine, Seoul 03080, Korea
*
Author to whom correspondence should be addressed.
Int. J. Mol. Sci. 2020, 21(20), 7726; https://doi.org/10.3390/ijms21207726
Submission received: 22 September 2020
/
Revised: 8 October 2020
/
Accepted: 13 October 2020
/
Published: 19 October 2020
(This article belongs to the Special Issue Molecular Research Efforts in Urothelial Carcinoma 2.0)
Abstract
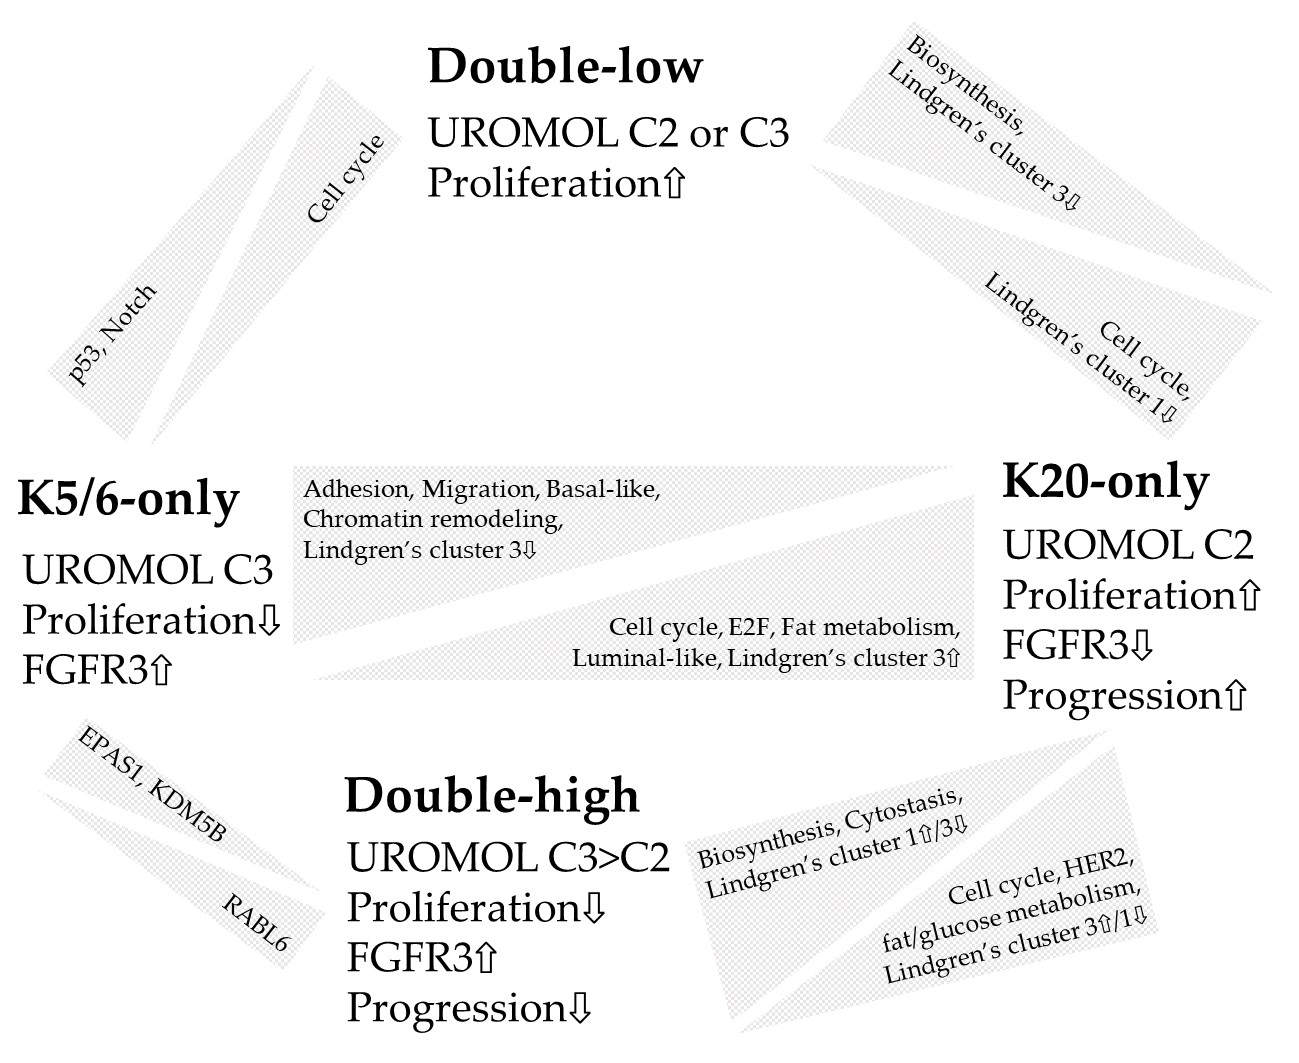
:Non-muscle-invasive bladder cancer (NMIBC) consists of transcriptional subtypes that are distinguishable from those of muscle-invasive cancer. We aimed to identify genetic signatures of NMIBC related to basal (K5/6) and luminal (K20) keratin expression. Based on immunohistochemical staining, papillary high-grade NMIBC was classified into K5/6-only (K5/6High-K20Low), K20-only (K5/6Low-K20High), double-high (K5/6High-K20High), and double-low (K5/6Low-K20Low) groups (n = 4 per group). Differentially expressed genes identified between each group using RNA sequencing were subjected to functional enrichment analyses. A public dataset was used for validation. Machine learning algorithms were implemented to predict our samples against UROMOL subtypes. Transcriptional investigation demonstrated that the K20-only group was enriched in the cell cycle, proliferation, and progression gene sets, and this result was also observed in the public dataset. The K5/6-only group was closely regulated by basal-type gene sets and showed activated invasive or adhesive functions. The double-high group was enriched in cell cycle arrest, macromolecule biosynthesis, and FGFR3 signaling. The double-low group moderately expressed genes related to cell cycle and macromolecule biosynthesis. All K20-only group tumors were classified as UROMOL “class 2” by the machine learning algorithms. K5/6 and K20 expression levels indicate the transcriptional subtypes of NMIBC. The K5/6Low-K20High expression is a marker of high-risk NMIBC.

1. Introduction
Bladder cancer represents the 9th most common malignancy, with approximately 430,000 new cases and 165,000 new cancer-related deaths worldwide in 2012 [1]. Influenced by tobacco usage, Europe and North America are among the regions with the highest incidence and mortality rates [1]. Approximately 75% of these cases present with non-muscle-invasive bladder cancer (NMIBC) or mucosa-confined or submucosa-invasive disease [2]. Despite its overall favorable survival, NMIBC recurs frequently and can eventually progress to muscle-invasive bladder cancer (MIBC), which necessitates repeated cystoscopic resection or even radial cystectomy [2,3]. Identification of genetic characteristics of NMIBC could be the first step to accurately predicting patient prognoses and to providing personalized treatment.
Accumulating transcriptional data suggest that NMIBC consists of intrinsic subtypes that are more than just underdeveloped counterparts of those of MIBC [4]. Although some transcriptional subtypes of bladder cancer are identified over pathological stages, the proportion of molecular subtypes varies by stage, and subtypes also can change along with stage progression [4,5]. Moreover, the clinical behavior of molecular subtypes differs between NMIBC and MIBC. For example, one of the intrinsic subtypes of NMIBC that has a poor prognosis showed molecular skewness to luminal cells rather than basal cells of the urothelium, and displayed high levels of K20/uroplakins but low levels of K5/K15, which was transcriptionally akin to but clinically different from the luminal type of MIBC [6]. The aggressiveness of luminal-like NMIBC is known to stem from the enrichment of the cell cycle, changes in junctional complexes, or high copy number alteration [6,7,8]. K5/6 and K20 have been widely used as surrogate markers of intrinsic subtypes of NMIBC, and their expression is significantly associated with the clinical outcomes of NMIBC [9,10,11]. In addition, it was demonstrated that immunohistochemical (IHC) expression of K5/6 and K20 was associated with the molecular biology of non-muscle-invasive upper tract urothelial carcinoma (NMIUTUC), including proliferation, cell adhesion, and the mitogen-activated protein kinase (MAPK) pathway [12,13]. The application of IHC staining for basal and luminal proteins to the management of patients with MIBC has been discussed [14,15,16]; furthermore, molecular characterization of intrinsic subtypes of NMIBC can aid in predicting tumor progression to muscle-invasive diseases [4]. The genetic implications of the basal-like phenotype (K5/6High-K20Low) and luminal-like phenotype (K5/6Low-K20High) were reported in previous studies, which included both NMIBC and MIBC [5,17,18]. However, the association between NMIBC gene expression profiles and K5/6 and K20 expression, especially double high or double low for K5/6 and K20 expression is still unclear. Moreover, immunophenotype ambiguity of basal and luminal proteins, which is often observed in papillary NMIBC as opposed to MIBC, remains a challenge, further underlining the importance of genetic characterization of NMIBC with different K5/6 and K20 expression profiles [12,19].
In this study, we aimed to uncover the gene expression profiles of NMIBC stratified by basal keratin (K5/6) and luminal keratin (K20) expression. Differentially expressed genes (DEGs) and functional enrichment were assessed between tumor groups defined by IHC staining for K5/6 and K20 using RNA sequencing.
2. Results
2.1. Patient Characteristics
In total, 4 groups consisting of 16 papillary high-grade NMIBC specimens (n = 4 each) were assessed using IHC staining for K5/6 and K20: a K5/6-only group (K5/6High-K20Low), a K20-only group (K5/6Low-K20High), a double-high group (K5/6High-K20High), and a double-low group (K5/6Low-K20Low) were assembled (Figure S1). The demographic, clinicopathological, and IHC details are presented in Table S1. The median age was 70 years (range, 58–83) and the male-to-female ratio was 4.3:1. Submucosal invasion was observed in 75% (12/16) of patients. One of the K20-only group specimens and one of the double-low group specimens showed concurrent urothelial carcinoma in situ. Except for K5/6 (p = 0.003) and K20 (p = 0.004) expression, the groups had even distributions of clinicopathological parameters and other IHC results. The overexpression pattern of p53 was observed in 0%, 75%, 50%, and 25% of K5/6-only, K20-only, double-high, and double-low group tumors, respectively. During the follow-up period, 1 K5/6-only, 3 K20-only, and 3 double-low group NMIBC patients experienced local recurrence (Figure S2).
2.2. Differentially Expressed Genes
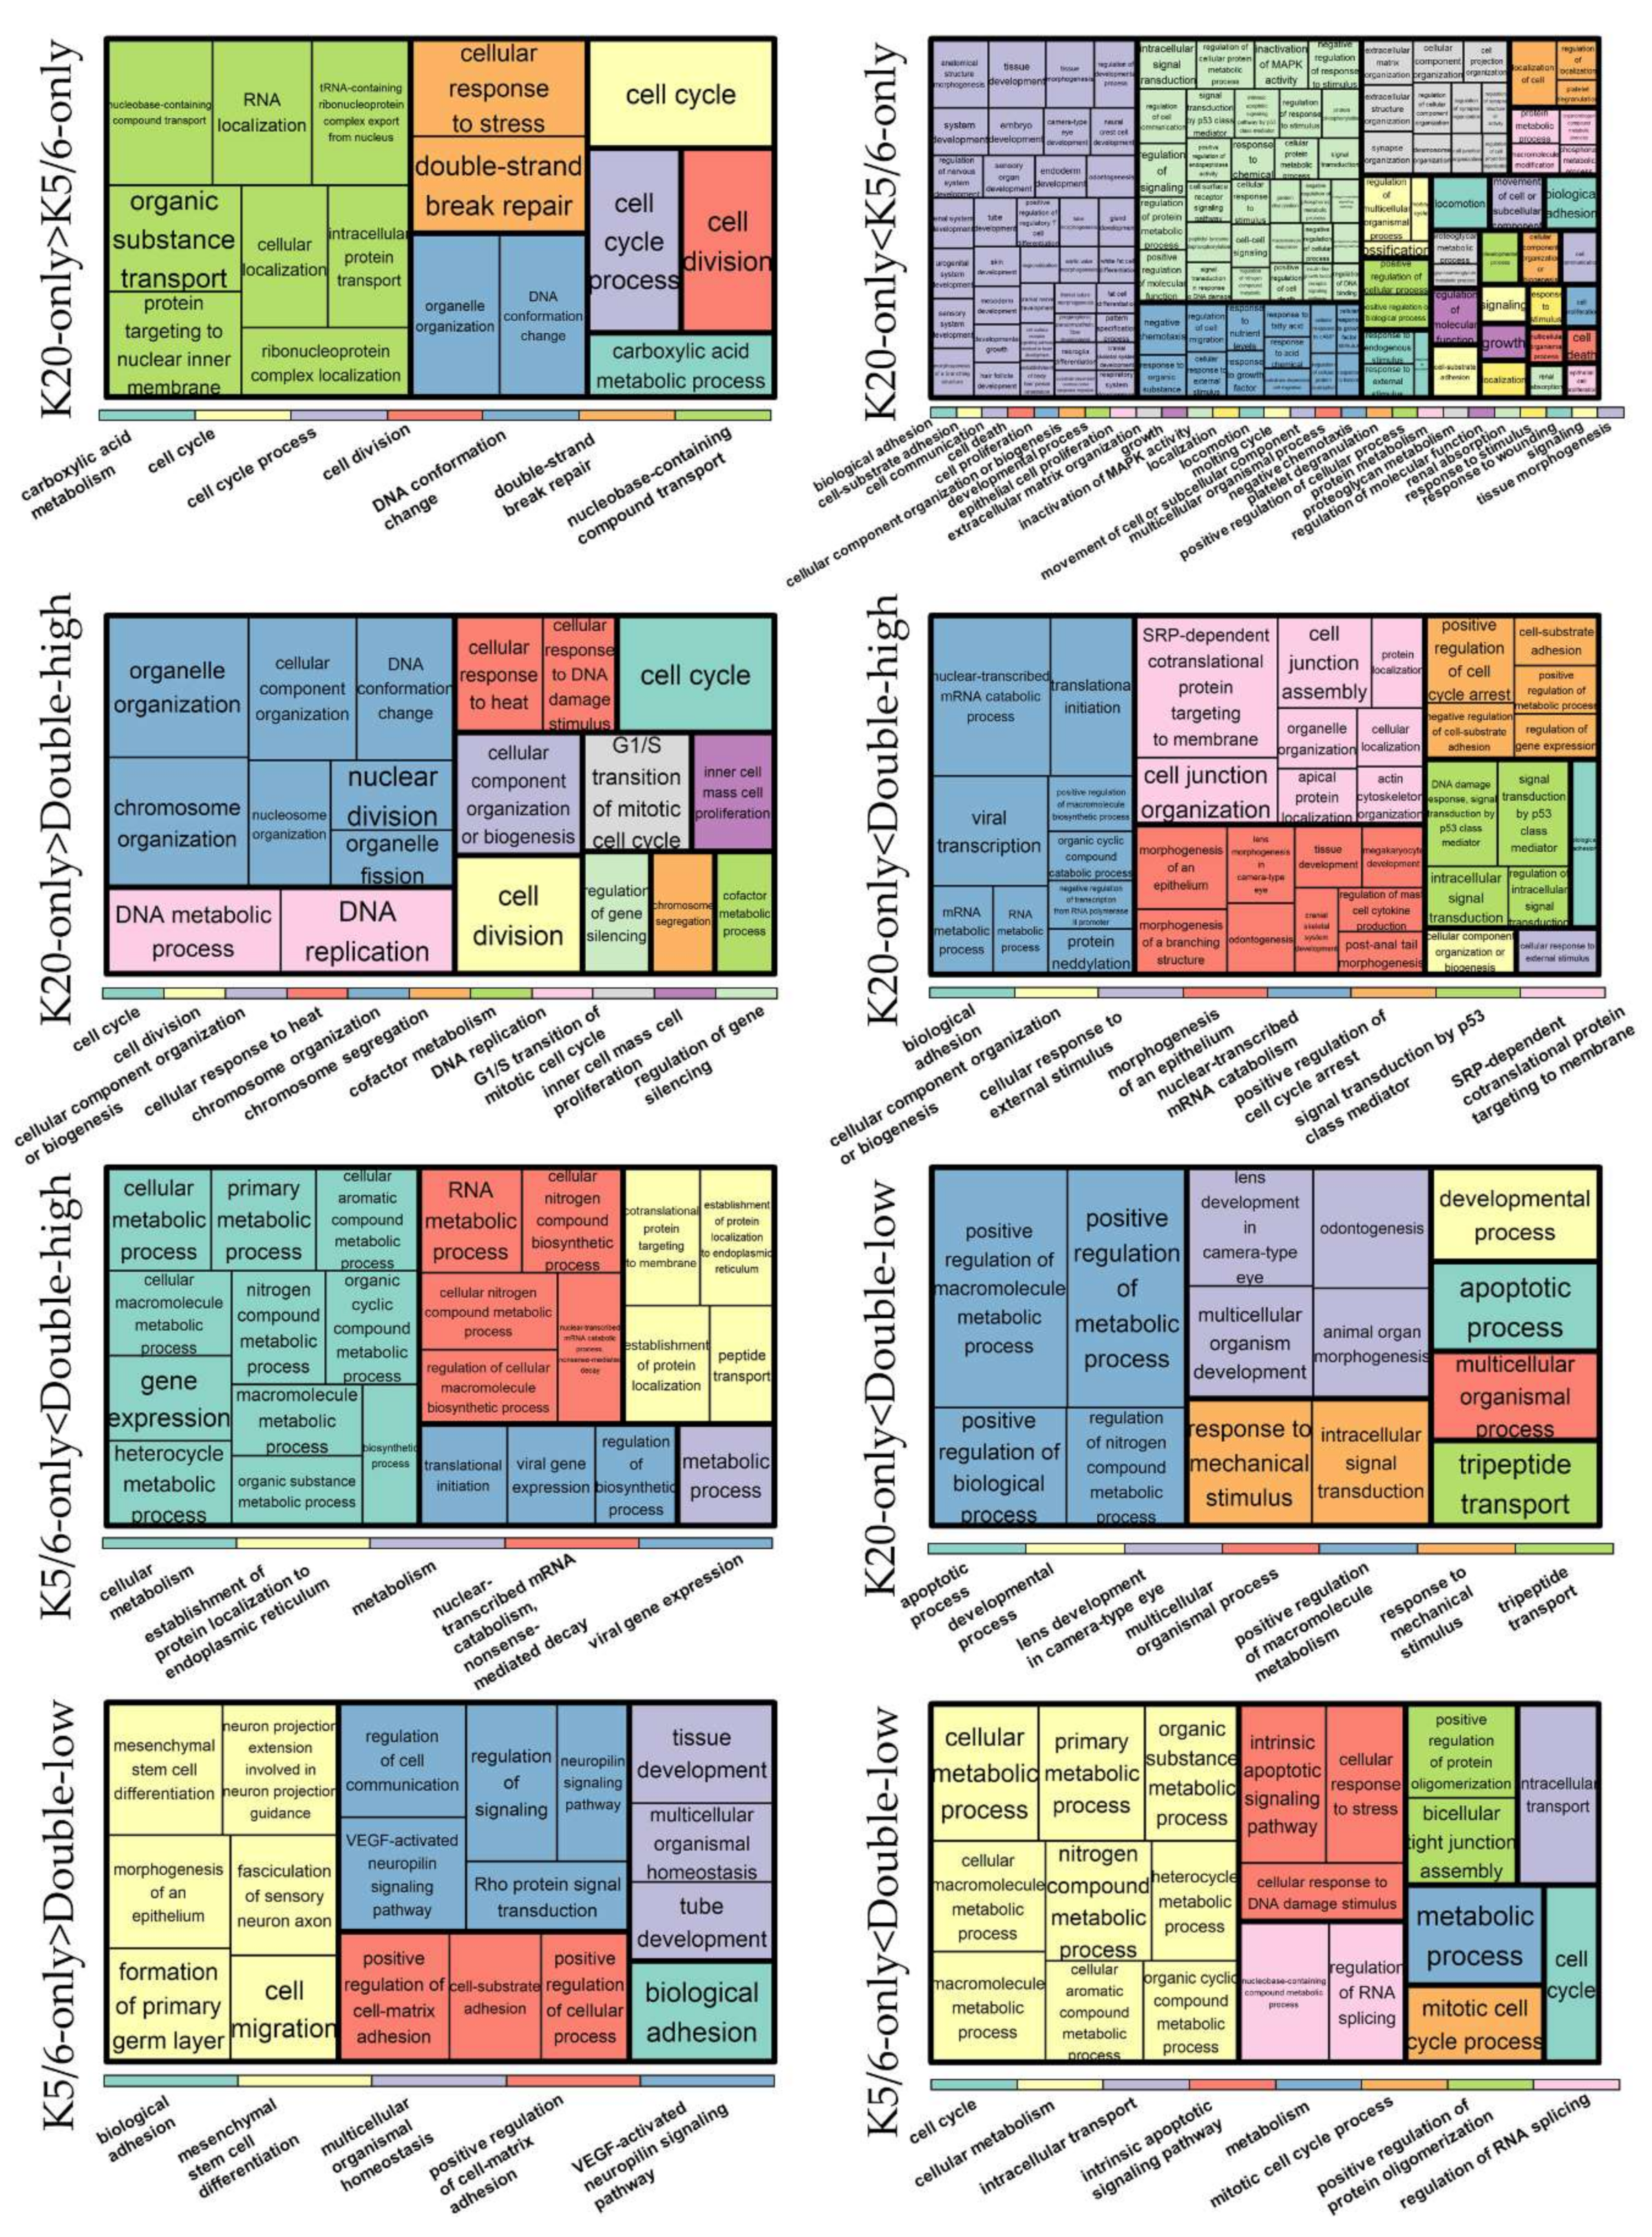
We identified 1462 DEGs across the NMIBC groups (K20-only vs. K5/6-only, K20-only vs. double-high, K5/6-only vs. double-high, K20-only vs. double-low, and K5/6-only vs. double-low), as illustrated in Figure S3. Upregulated and downregulated genes were separately subjected to Gene ontology (GO) and Kyoto Encyclopedia of Genes and Genomes (KEGG) databases (Figure 1; Table S2).
As a result, cell cycle progression and DNA repair were enriched in genes that were highly expressed in the K20-only group compared to the K5/6-only or double-high groups (e.g., GO “cell cycle” and “double-strand break repair via homologous recombination”; KEGG “cell cycle” and “DNA replication”) and in those highly expressed in the double-low group compared to the K5/6-only group (e.g., GO “cyclin B1-CDK1 complex” and “G2/M transition of mitotic cell cycle”; KEGG “cell cycle” and “DNA replication”). Conversely, relative to the K20-only group, cell cycle arrest and/or cell death were enriched in DEGs upregulated in the K5/6-only group (e.g., GO “intrinsic apoptotic signaling pathway by p53 class mediator” and “positive regulation of cell death”; KEGG “apoptosis”) and in the double-high group (e.g., GO “positive regulation of cell cycle arrest” and “DNA damage response signal transduction by p53 class mediator”). Second, genes significantly overexpressed in the double-high group (vs. K20-only or K5/6-only) and the double-low group (vs. K20-only) were skewed toward functions related to protein synthesis/metabolism (e.g., GO “protein targeting to ER”, “cellular nitrogen compound biosynthetic process”, and “positive regulation of nitrogen compound metabolic process”; KEGG “ribosome’). In addition, DEGs found to be highly expressed in the K5/6-only or double-high groups compared to the K20-only or double-low groups were overrepresented by tissue morphogenesis and cell/substrate binding functions (e.g., GO “tissue morphogenesis” and “cell-substrate adhesion”; KEGG “focal adhesion” and “tight junction”). Signaling pathways, such as the PI3K-Akt, MAPK, and HIF pathways, were related to the upregulated genes of the K5/6-only group and, to a lesser extent, to those of the double-high group compared to the K20-only or double-low groups. Additionally, the K5/6-only group overexpressed genes in the membership of cell migration (e.g., GO “regulation of cell migration”; KEGG “regulation of actin cytoskeleton”) compared to the K20-only group.
2.3. Ingenuity Pathway Analysis and Gene Set Enrichment Analysis
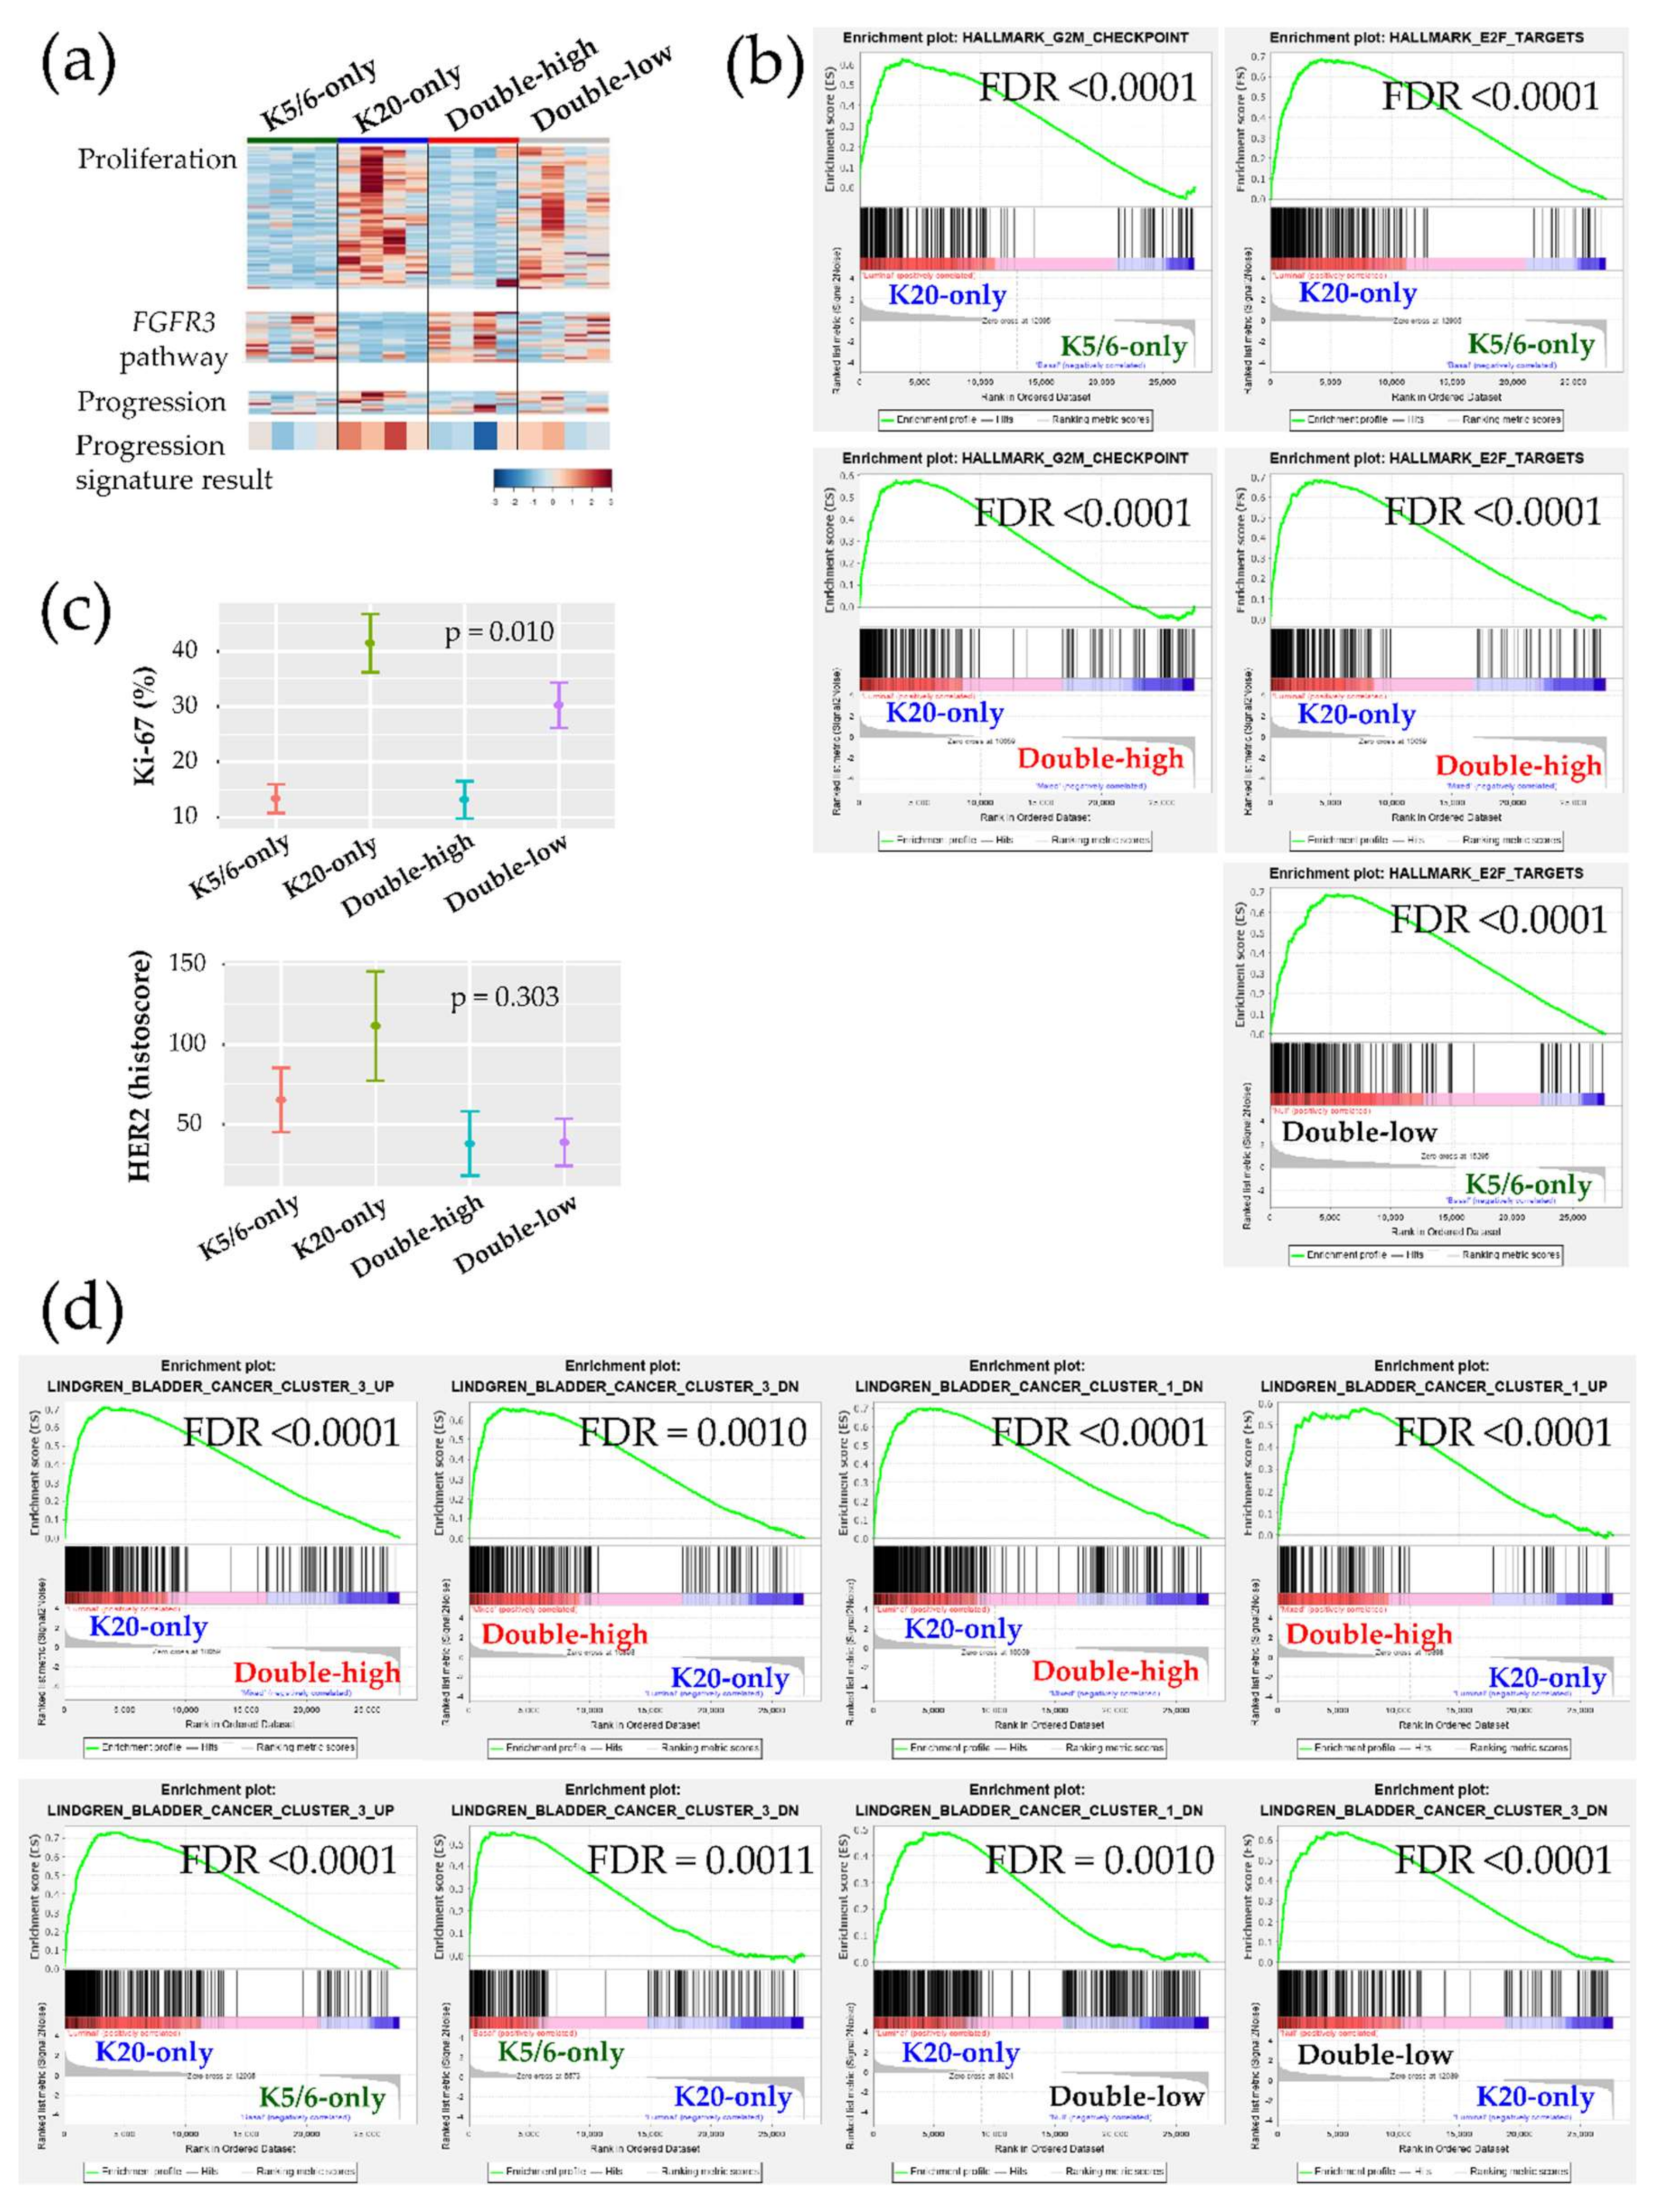
Ingenuity Pathway Analysis (IPA) was conducted using each DEG set (Table 1). Transcription factors promoting the cell cycle were activated in the K20-only group (e.g., RABL6, ID2, ID3, MYC, and E2F3 of the E2F family) vs. the K5/6-only, double-high, or double-low groups; while, those participating in cell cycle checkpoints and cell death were activated in the K5/6-only and double-high groups (e.g., TP53, TP63, CDKN2A, CDKN1A, RB1, and NURP1) vs. the K20-only or double-low groups. These enhanced cell cycle and cell survival themes indicate that many cancer-progressive functions converge in the K20-only group compared to the double-high or double-low groups; in contrast, the double-high group was especially enriched for various cytostatic terms. Likewise, Gene Set Enrichment Analysis (GSEA) demonstrated enrichment of cell proliferation and related machinery in the K20-only group and also in the double-low group relative to the K5/6-only or double-high groups (Figure 2a,b, Figure S4). In addition, ERBB2 and ERBB3 were suggested to positively regulate the K20-only group (Table 1). Consistent with these transcriptional findings, the Ki-67 proliferative index was high in the K20-only group (p = 0.010) and HER2 expression was relatively high in the K20-only group as well as the K5/6-only group (p = 0.303) in IHC staining (Kruskal-Wallis; Figure 2c). Furthermore, lipid and glucose metabolism was enriched in the K20-only group vs. the double-high or K5/6-only groups according to IPA (e.g., PPARGC1A and SREBF2) and GSEA Figure S5. On the other hand, the K5/6-only group was conjectured to more strongly harbor invasive or adhesive properties than the K20-only group, which was accompanied by activated MAPK pathway components (e.g., EGF, IGF1, RAF1, and ERK1/ERK2) and TGF-β/CTNNB1 (Table 1). Finally, compared to the K20-only group, the K5/6-only group was enriched with activated genes involved in chromatin modification, including KDM5B and SMARCA4 (Table 1).
Next, we further evaluated our cohort against the previously established genetic signatures. The signature of the FGFR3 signaling pathway was relatively decreased in the K20-only group Figure 2a. Conversely, a panel of 12 genes implicated in NMIBC progression indicated that K20-only group tumors were more prone to advance to MIBC and/or to a life-threatening state (Figure 2a). Interestingly, an investigation of GSEA “curated gene sets” revealed that NMIBC “cluster 1” and “cluster 3” defined by Lindgren et al. substantially overlapped with our NMIBC groups [8]: The K20-only group was biased toward Lindgren’s cluster 3 but away from Lindgren’s cluster 1; however, the double-high group showed the opposite trend (Figure 2d). In comparison to the K20-only group, the K5/6-only group and the double-low group overexpressed the genetic signatures downregulated in Lindgren’s cluster 3 (Figure 2d). Furthermore, the upregulated signals of breast basal cells vs. luminal cells were significantly downregulated in the K20-only group (Figure S6). Finally, machine learning prediction tools were used to classify the present specimens to the UROMOL NMIBC classes (“class 1”,”class 2”, or “class 3”) Table S3 [6]. All K20-only group tumors were classified as UROMOL class 2, the double-low group was classified as either the UROMOL class 2 or UROMOL class 3, and the K5/6-only and double-high groups were mostly annotated as UROMOL class 3 with high accuracy.
2.4. Validation Using the Public Gene-Expression Dataset
Upon the premise of the IHC-guided DEG analyses, 23 patients of the Lund NMIBC cohort met the clinicopathological and IHC criteria (Table S4) [5,17]. The median age was 75 (range, 52–87) years and the male-to-female sex ratio was 3.6:1. Seven (30.4%) and 4 (17.4%) tumors were stage T1 and grade 3, respectively.
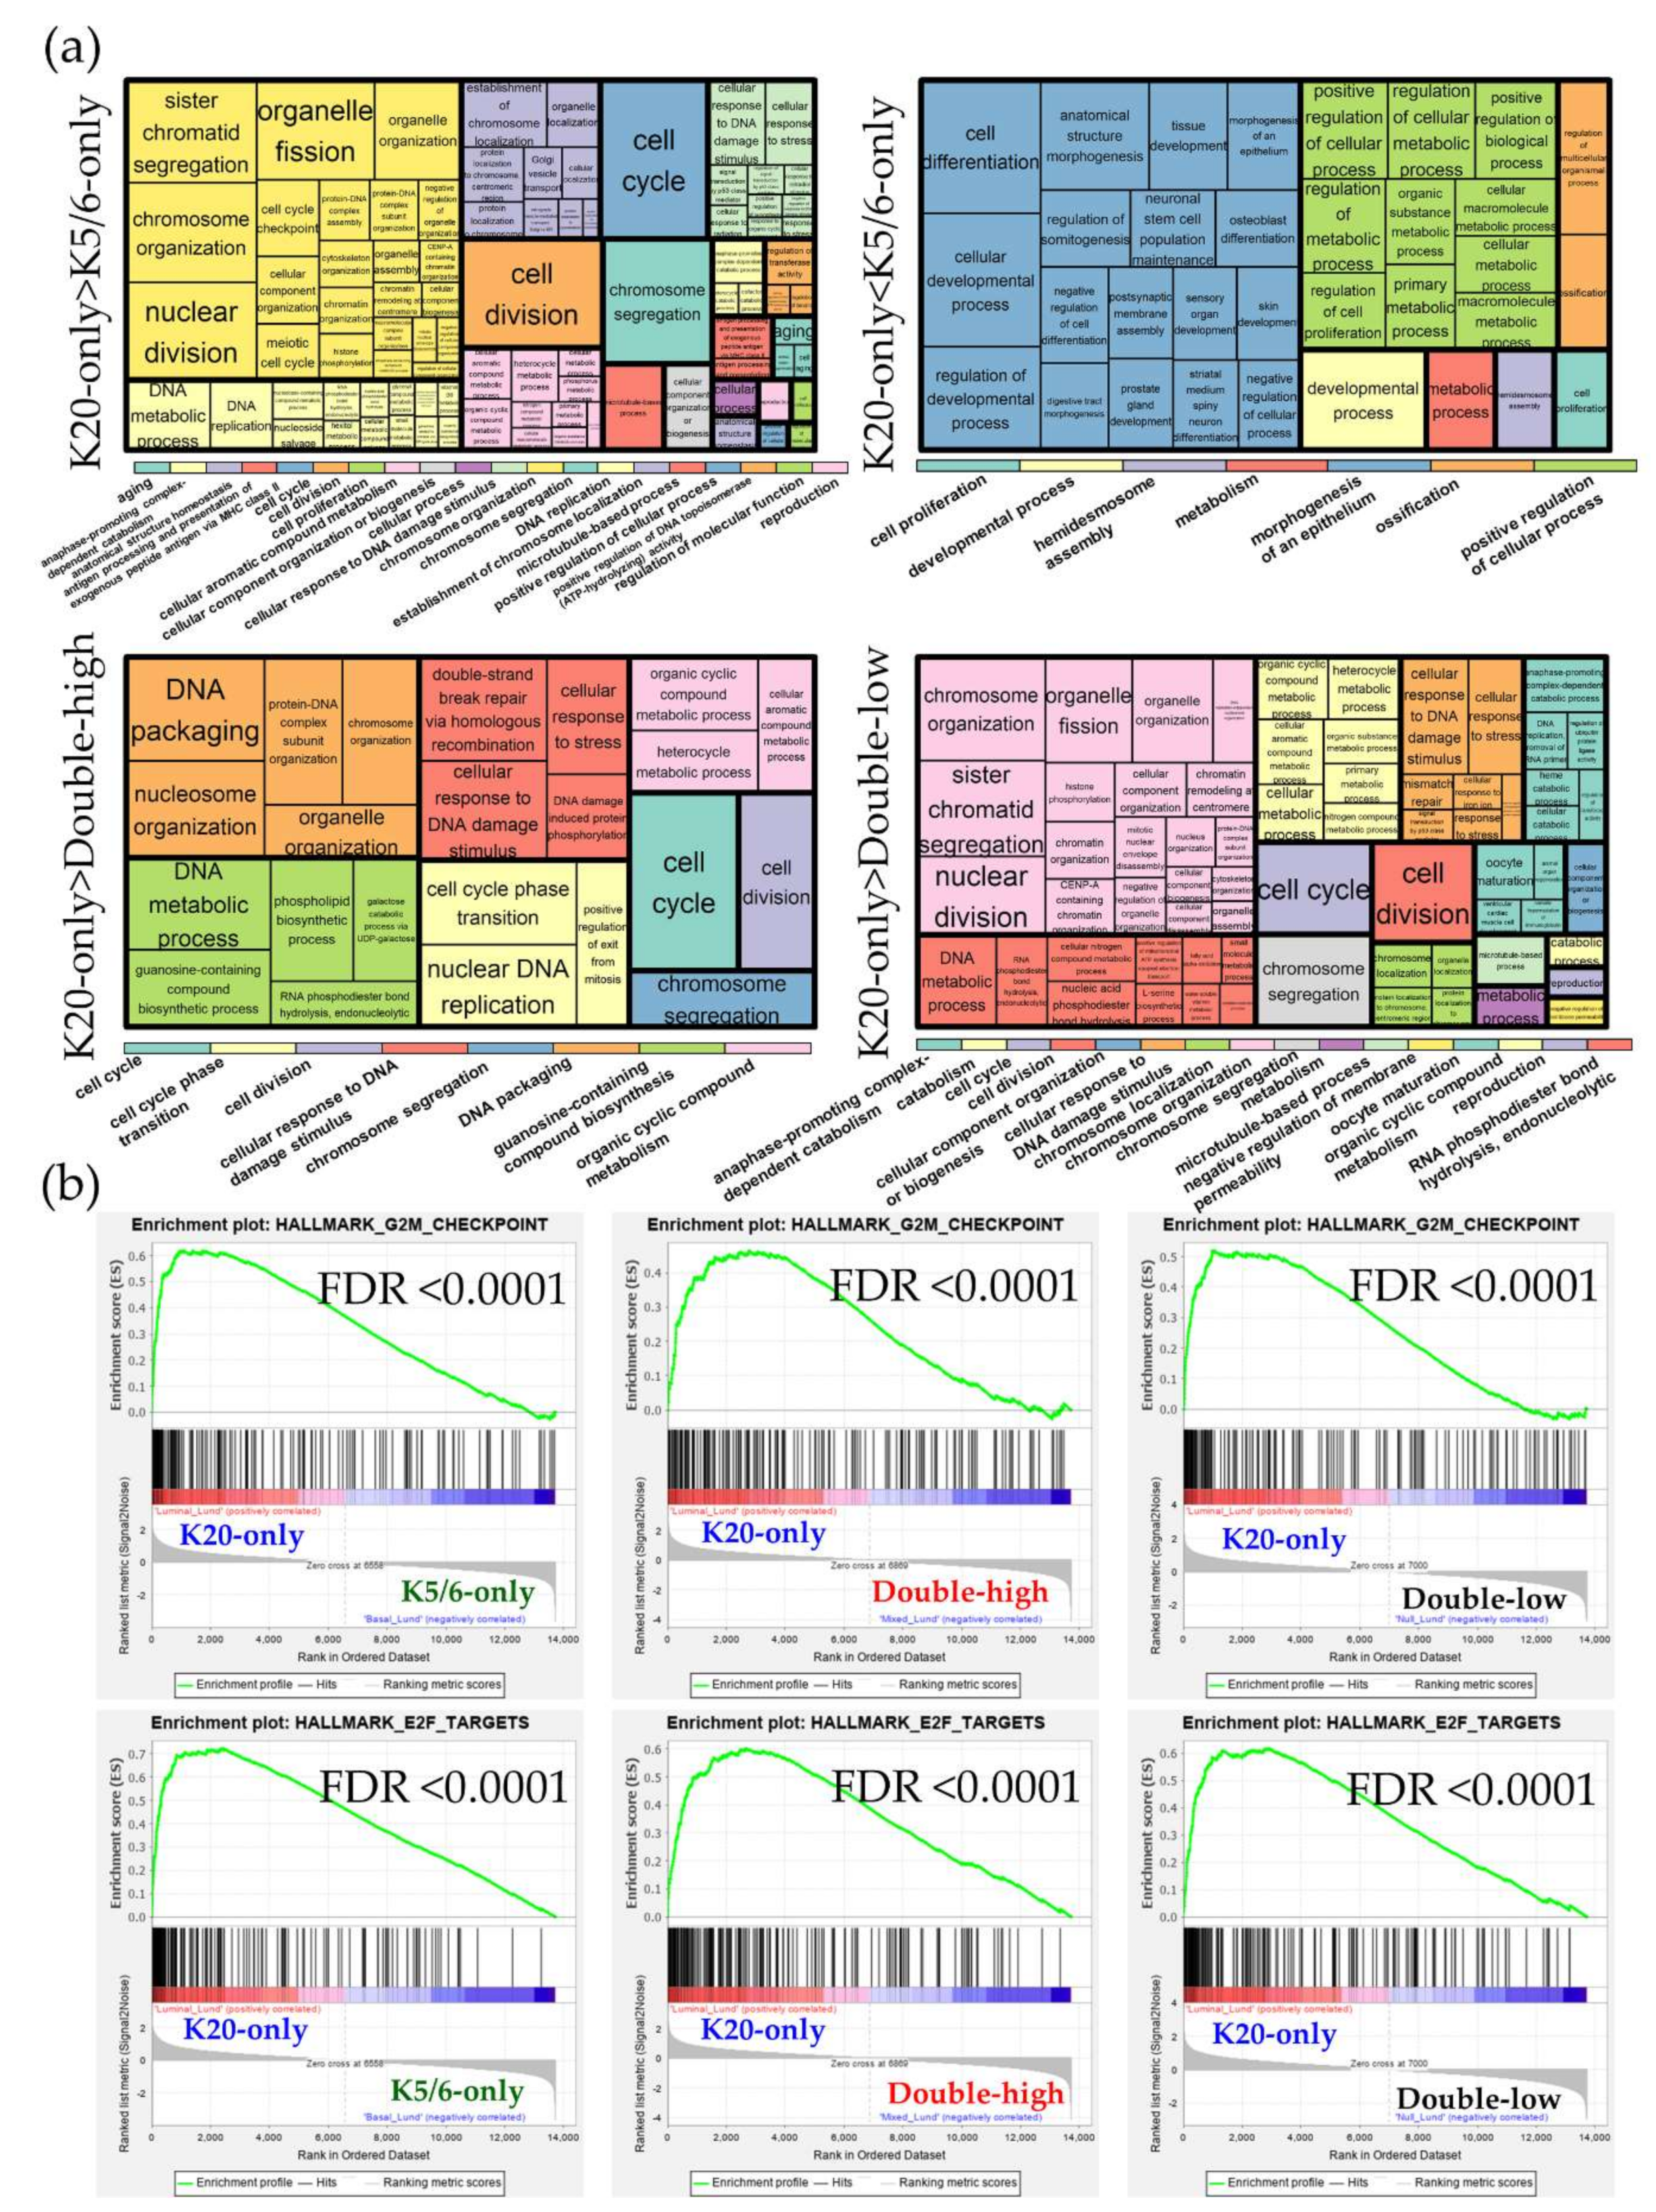
DEG sets identified across the Lund cohort groups were analyzed using the GO and KEGG databases Figure S7. Similar to the results of our NMIBC cohorts, the K20-only_Lund group was overrepresented by cell cycle and E2F functions compared to the other groups; however, compared to the K20-only_Lund group, the K5/6-only_Lund group had increased levels of genes involved in epithelium morphogenesis and cellular biologic processes (Figure 3; Table S5). According to the IPA study (Table 2), enrichment of cell cycle progression and cell proliferation were predicted in the K20-only_Lund group compared to the other groups, as indicated by altered upstream regulators (e.g., RABL6, FOXM1, MITF, and E2F3) and pathological terms (e.g., “M phase”, “segregation of chromosomes”, and “cell survival”). In addition, consistent with the foregoing findings for the K5/6-only group, activation of KDM5B was predicted in the K5/6-only_Lund group compared to the K20-only_Lund or double-high_Lund groups (Table 2).
3. Discussion
It has become clear that NMIBC has discrete transcriptional subtypes that are distinguishable from those of MIBC [6,8]. We performed IHC staining for K5/6 and K20 as subtype-defining markers in papillary high-grade NMIBC and investigated the functional implications through RNA sequencing. In addition to their correlation to molecular profiles of bladder cancer [9,17,20], immunostains for K5/6 and K20 have an advantage in that they are widely used in real-world practice. As a result, the highest signals related to cell proliferation, survival, and advanced malignancy and brisk Ki-67 proliferative index were found in the K20-only group, which was successfully validated in the independent K20-only_Lund group. Enrichment of DNA repair functions, one of the characteristics of high-risk aggressive members of NMIBC, was also observed in the K20-only group and K20-only_Lund group [7]. On the other hand, the transcriptional characteristics of the double-high group included cell cycle arrest, apoptosis, tissue morphogenesis, and protein synthesis/metabolism. The K5/6-only group was characterized by enrichment of basal MIBC markers (e.g., TP63, IKBKB, HIF1A, EGF, STAT3, and PI3K-Akt, MAPK, and HIF pathways), while the K20-only group had similar molecular profiles with luminal subtype MIBC (e.g., PPARGC1A, SREBF2, ERBB2, ERBB3, and ESR1) [20]. Notably, other IHC expression related to MIBC subtypes in this study, including GATA3 and FOXA1, did not differ among our groups [14]. In NMIBC, therefore, IHC staining for K5/6 and K20 has demonstrated its value in reflecting the conventional luminal/basal subtypes of MIBC.
Several biologic characteristics shared in both the K20-only group and the K20-only_Lund group underscore the high-risk characteristics of NMIBC with a luminal phenotype, concurring other studies where aggressive subtypes of NMIBC have high K20 and low K5/6 expression [5,6,11,17]. High levels of genes related to cell proliferation and DNA repair have been commonly found in high-risk subtypes of early urothelial carcinoma [6,7,13,21]. Various machine learning classifiers stably annotated the K20-only group as UROMOL class 2, a luminal-like subtype of NMIBC that showed high proliferation signatures, aggressive clinical features, and poor survival outcomes [6]. Moreover, it is worth noting that the present groups considerably reproduced the NMIBC clusters defined by Lindgren et al. [8]: GSEA clearly connected our K20-only and double-high groups to Lindgren’s cluster 3 and cluster 1, respectively. It was reported that Lindgren’s cluster 3, consisting of high-grade NMIBC accompanied by concurrent carcinoma in situ, highly expressed genes coding for cell cycle GO processes, but Lindgren’s cluster 1, which showed low grade and long recurrence-free survival, had low expression of cell cycle-related genes and high expression of protein synthesis/ribosome-related genes [8]. Through the 12-gene signature, we also showed that the K20-only group and the double-high group were associated with high and low risks of disease progression, respectively [22]. Thus, IHC staining for K5/6 and K20 manifests both molecular and clinical relevance, and it is feasible to maintain the usefulness of these proteins as markers of the NMIBC subtypes and prognostic factors of patients with NMIBC. Based on the IPA and GSEA findings, we hypothesize that active E2F3, which is coordinated with deactivated Rb, is the main contributor to K20-only group progression [23]. E2Fs are a group of transcription factors orchestrating the cell cycle, apoptosis, DNA synthesis, and repair; these proteins have been known to be responsible for carcinogenesis, invasion, and progression of urothelial carcinoma [23,24,25]. In mice, activation of E2F3 driven by deregulated Rb-induced high-grade papillary bladder cancer [23,24]. E2F3, as a contributor to early cell cycle progression, may regulate early cell cycle genes in the K20-only group (e.g., ID2 and ID3). On the contrary, early cell cycle genes were mostly enriched in low-risk transcriptional subtypes of NMIBC in previous studies [6,7]. Considering that there are architectural and grade disparities between our study (papillary high-grade) and previous studies (various growth patterns and grades) and that basal/luminal proteins might be expressed discretely by tumor grade [6,7,11], we speculate that regulation of the tumor cell cycle might be affected by different pathological traits. In addition, enrichment of the ERBB2 signature and relative overexpression of IHC staining for HER2 in the K20-only group coincides with the “HER2-like” subtype, another major high-risk subset of NMIBC, which suggests that HER2 blockade could be explored as a treatment option for K20-only group tumors [21]. The enrichment of mTORC1 and cholesterol/fatty acid/glucose metabolism, which was previously shown to be related to high tumor grade and short overall survival in NMIBC, further supports the high-risk phenotypes of the K20-only group [7].
FGFR3 alteration is one of the molecular hallmarks of early carcinogenesis of the urothelium and is associated with increased survival in NMIBC [25]. We demonstrated that both the FGFR3 gene (|fold change| = 4.7, p = 0.04, double-high vs. K20-only) and its associated signatures were downregulated in the K20-only group but enriched in the double-high group. Notably, Lindgren’s cluster 1 is more closely related to FGFR3 alteration, such as a higher mutation rate and expression level, than Lindgren’s cluster 3 [8]. Mutation-driven hyperactivation of FGFR3 is one of the major triggers of low-risk NMIBC that frequently co-occurs with PIK3CA mutation [25]. Consistent with this, we found that the double-high group was enriched in PI3K-Akt signaling. A pan-FGFR inhibitor, erdafitinib, displayed a meaningful tumor response rate in patients with urothelial carcinoma, indicating that it could be especially beneficial to those with FGFR3-activated tumors, suggesting a promising targetable axis of the double-high group [21,26]. In addition, previous studies showed that K5/6 and K20 dual positivity marked well-differentiated tumors that maintained tissue architectural hierarchy, which was demonstrated to be a favorable prognostic factor for early urothelial carcinoma [11,12,13]. We also found that upregulated genes in the double-high group, consistent with Lindgren’s cluster 1, were involved in numerous themes of protein synthesis and metabolism [8]. Similarly, cytoskeletal, junctional, and cell interaction pathways supporting architecture integrity and metabolic pathways supporting homeostasis were found to be subtype-specific functions of an indolent NMIBC subtype discovered by proteome recently [27]. Thus, it is reasonable to speculate that the differentiation and tissue organization of the double-high group is maintained by active intercellular interactions that are enriched for epithelium morphogenesis, and cell-cell and cell-substrate binding functions.
Despite the high expression of cell cycle regulatory molecules and low expression of the cell cycle progression signature, the K5/6-only group was predicted to have activated functions of tumor cell adhesion, migration, and invasion and enhanced TGF-β cascades [20,28]. High levels of K14 in the K5/6-only group indicate its connection to the basal-like state and migratory function, in accordance with previous reports that K14 was mainly expressed in tumors with high K5/6 and low K20 expression and K14 expression identified stemness and basal/squamous-like characteristics, including activated cellular movement, in urothelial carcinoma [13,28]. Parallel to this, we also found a trend of tumors showing p53-wildtype staining clustered in the K5/6-only group compared to the K20-only group, which frequently displayed p53 overexpression. Aberrant expression of p53 differs among NMIBC subtypes and can indicate impending stage progression of the “genomically unstable” or “urothelial-like C” subtypes that are genetically similar to our K20-only group [4]. Instead, the lack of p53 overexpression in the K5/6-only group, consistent with the “urothelial-like B” or “basal/squamous-like” subtypes, implies a distinct regulatory pathway of tumor progression in the K5/6-only group, which warrants further investigation [4]. In addition, chromatin-modifying genes, such as KDM5B and SMARCA4, were activated in both the K5/6-only and K5/6-only_Lund groups more than would be expected randomly. Together with recent mutational data [29], findings regarding these molecules reveal an opportunity for targeted therapy in K5/6High-K20Low NMIBC.
The double-low phenotype, or negative expression of basal and luminal markers, was reported only in a handful of urinary bladder carcinomas. The double-low phenotype was once characterized by low expression of claudin and high expression of genes targeted by TP53 in a previous study [30]. However, we failed to find such trends in the double-low group among claudin-related genes (e.g., CLDN, CDH1, VIM, and SNAI2) and TP53-related signatures. Instead, we revealed that the double-low group had a moderate expression of cell cycle progression-relate genes, in between that of the K20-only group and that of the K5/6-only group, and had a higher level of a protein synthetic/metabolic signature genes than the K20-only group. IHC staining for K5/6 was reactive in some of the basal cells in the double-low group tumors. This staining is reminiscent of the loss of the normal expression pattern of basal-type proteins, such as K5/6 and CD44, which was significantly associated with poor outcomes of NMIBC and NMIUTUC [12,19]. In view of these findings, we hypothesize that the double-low group may indicate an advanced state of the K5/6-only group that is not yet as progressed as the K20-only group. At present, the features of the double-low group remain to be elucidated.
There are some limitations to the present study. The shortage of specimens subjected to RNA sequencing may have hindered robust statistical analysis and identification of a small but important difference in gene expression. In addition, although we attempted to apply subgroup-defining methodology similar to that in our cohort to the validation cohort, there were differences in detailed IHC staining conditions, cutoffs, and gene-expression test platforms. These differences may have induced discrepancies in the enrichment results of the Lund group, so the validation results must be evaluated carefully. Finally, the overall strategy of this study without the use of a data-driven classification framework was not adequate for discovering new intrinsic subtypes of NMIBC. Nevertheless, the molecular insights gained from this study could provide an efficient way to apply the vast genetic information of NMIBC to the real-world practice using the most common IHC markers, K5/6 and K20 immunostains.
4. Materials and Methods
4.1. Specimen Selection for RNA Sequencing Using Immunohistochemical Staining for K5/6 and K20
Transurethral resection formalin-fixed paraffin-embedded specimens of papillary high-grade NMIBC that were archived in the pathology department of Seoul National University Hospital were screened using IHC staining for K5/6 (1:100; D5/16 B4; RRID:AB_2281083; Dako, Glostrup, Denmark) and K20 (1:50; Ks 20.8; RRID:AB_2133718; Dako) based on the extent of moderate-to-strong staining in tumor cells as follows: score 0 = 0%, score 1 = 0–1%, score 2 = 1–10%, score 3 = 10–25%, score 4 = 25–50%, score 5 = 50–75% and score 6 = 75–100%. Specimens that met all of the following criteria were included (n = 16): (i) high expression ≥ IHC score 4, (ii) low expression < IHC score 4, and (iii) when one protein was predominantly expressed, the score difference was ≥ 2. In addition, the expression levels of K14 (1:300; LL002; RRID:AB_1159418; Cell Marque, Rocklin, CA, USA), GATA3 (1:500; L50-823; Cell Marque), and FOXA1 (1:500; PA5-27157; RRID:AB_2544633; Thermo Fisher, Waltham, MA) were evaluated in the same manner. Aberrant expression of p53 (1:1000, DO-7, Dako) was defined as homogenous overexpression, complete absence, or cytoplasmic staining following a previous study [4]. Quantitative measurement of nuclear Ki-67 (1:100; MIB-1; RRID:AB_2631211; Agilent, Santa Clara, CA, USA) fraction (%) and membranous HER2 (ready-to-use, 4B5, Ventana, AZ, USA) histoscore [(weak staining proportion (%) multiplied by 1) + (moderate staining proportion (%) multiplied by 2) + (strong staining proportion (%) multiplied by 3)] was carried out on virtually scanned slides (Aperio AT2, Leica Biosystem, Wetzlar, Germany) using QuPath (version 0.1.2) [31]. IHC staining was conducted using the Benchmark autostainer (Ventana, Tucson, AZ, USA). The study has been approved by the institutional research ethics committee of the Seoul National University Hospital (IRB No. H-1810-148-983, 7 November 2018) and has been performed in accordance with the ethical standards as laid down in the 1964 Declaration of Helsinki and its later amendments or comparable ethical standards. A waiver of informed consent was approved by the review board because this research contains no more than minimal risk.
4.2. RNA Sequencing
cDNA libraries of formalin-fixed paraffin-embedded blocks cut in 10-μm-thick sections were prepared with the SureSelectXT RNA Direct Reagent Kit (Agilent) [32]. Briefly, total RNA was isolated from each sample. After DNA contamination was removed using DNase, mRNA with poly-A tail was selectively enriched using an mRNA purification kit and was followed by random fragmentation. cDNA was synthetized from mRNA through reverse transcription [33]. DV200, defined as the percentage of RNA fragments > 200 nucleotides [32], was > 50% in most and > 30% in all samples, with no significant difference among the groups (Table S1). Paired-end mRNA was sequenced on the NovaSeq 6000 Sequencing System (RRID:SCR_016387; Illumina, San Diego, CA, USA) using the NovaSeq 6000 S4 Reagent Kit (Illumina). The sequencing data were preprocessed using the Trimmomatic tool [34] and mapped to the human genome (UCSC hg19) using HISAT2 [35]. The transcriptome was assembled using the StringTie tool [36]. As a result, 63,714 transcripts, corresponding to 27,680 genes, were identified across all specimens. The expression levels of KRT5, KRT6A, KRT6B, KRT6C, and KRT20 matched the IHC profiles well (Figure S8). After the exclusion of the genes that were not expressed in any sample, a total of 9015 unique genes were used for subsequent functional studies.
In addition, the publicly available Lund NMIBC cohort (GSE32894) was investigated in a similar fashion [5,17]. To that end, MIBC and grade 1 or non-urothelial-like NMIBC were excluded. Afterward, those with upper 25% (high) and lower 25% (low) K5/6 and K20 tumor expression scores were grouped as follows: a K5/6-only_Lund group (K5/6High-K20Low), a K20-only_Lund group (K5/6Low-K20High), a double-high_Lund group (K5/6High-K20High), and a double-low_Lund group (K5/6Low-K20Low).
4.3. Differentially Expressed Genes and Functional Analyses
DEGs were identified between each group with p-value < 0.05 and absolute fold change > 2 as cutoffs. Enrichment of gene signatures was investigated using the formal “hallmark gene sets” and “curated gene sets” of GSEA [37]. GO and KEGG enrichment analyses were performed using DEGs. Significant GO terms and corresponding false discovery rate (FDR) values were submitted to ReViGO and visualized using treemaps [38]. Moreover, data were analyzed through the use of IPA [39]. The IPA functions, “upstream regulators” and “diseases and functions”, predicted regulatory molecules and pathological alteration related to the DEG sets based on the knowledge database. FDR < 0.05 was considered significant in the functional enrichment studies. Gene signatures related to cell proliferation, the FGFR3 signaling pathway, and NMIBC progression were obtained from previous reports [5,21,22]. The progression signature was compiled by using the expression levels of genes related to NMIBC progression; the levels of low-expression genes were subtracted from those of the high-expression genes to obtain a final score of the progression signature [22].
4.4. Statistical Analysis
Clinicopathological and follow-up details were obtained from medical records. All tumors were treatment-naïve primary cases, except for one in the K5/6-only group that the patient received BCG treatment 3 years ago due to bladder cancer. Tumor grading followed the latest definition [2]. All patients were followed-up regularly with the cystoscopic examination. The median follow-up duration was 59 months (range, 9–90). Recurrence-free survival was calculated using the date of same-site recurrence or the last urologic follow-up visit. Clinicopathological comparison was conducted using nonparametric tests in R version 3.2.1 with a two-tailed p-value < 0.05 considered as significant.
To accurately assign our samples to the intrinsic subtypes of NMIBC published by Hedegaard and coworkers (UROMOL study), we decided to build a distance-based gene-expression classifier of UROMOL subtypes and employ machine learning techniques [6]. Several computational models were tested through repeated cross-validation (×10) using 110 commonly expressed genes (Figure S9). The algorithms showing high mean accuracy (>0.94) were selected to assign our samples to the UROMOL intrinsic subtypes: sparse partial least squares [40], regularized logistic regression [41], and GLMnet [42].
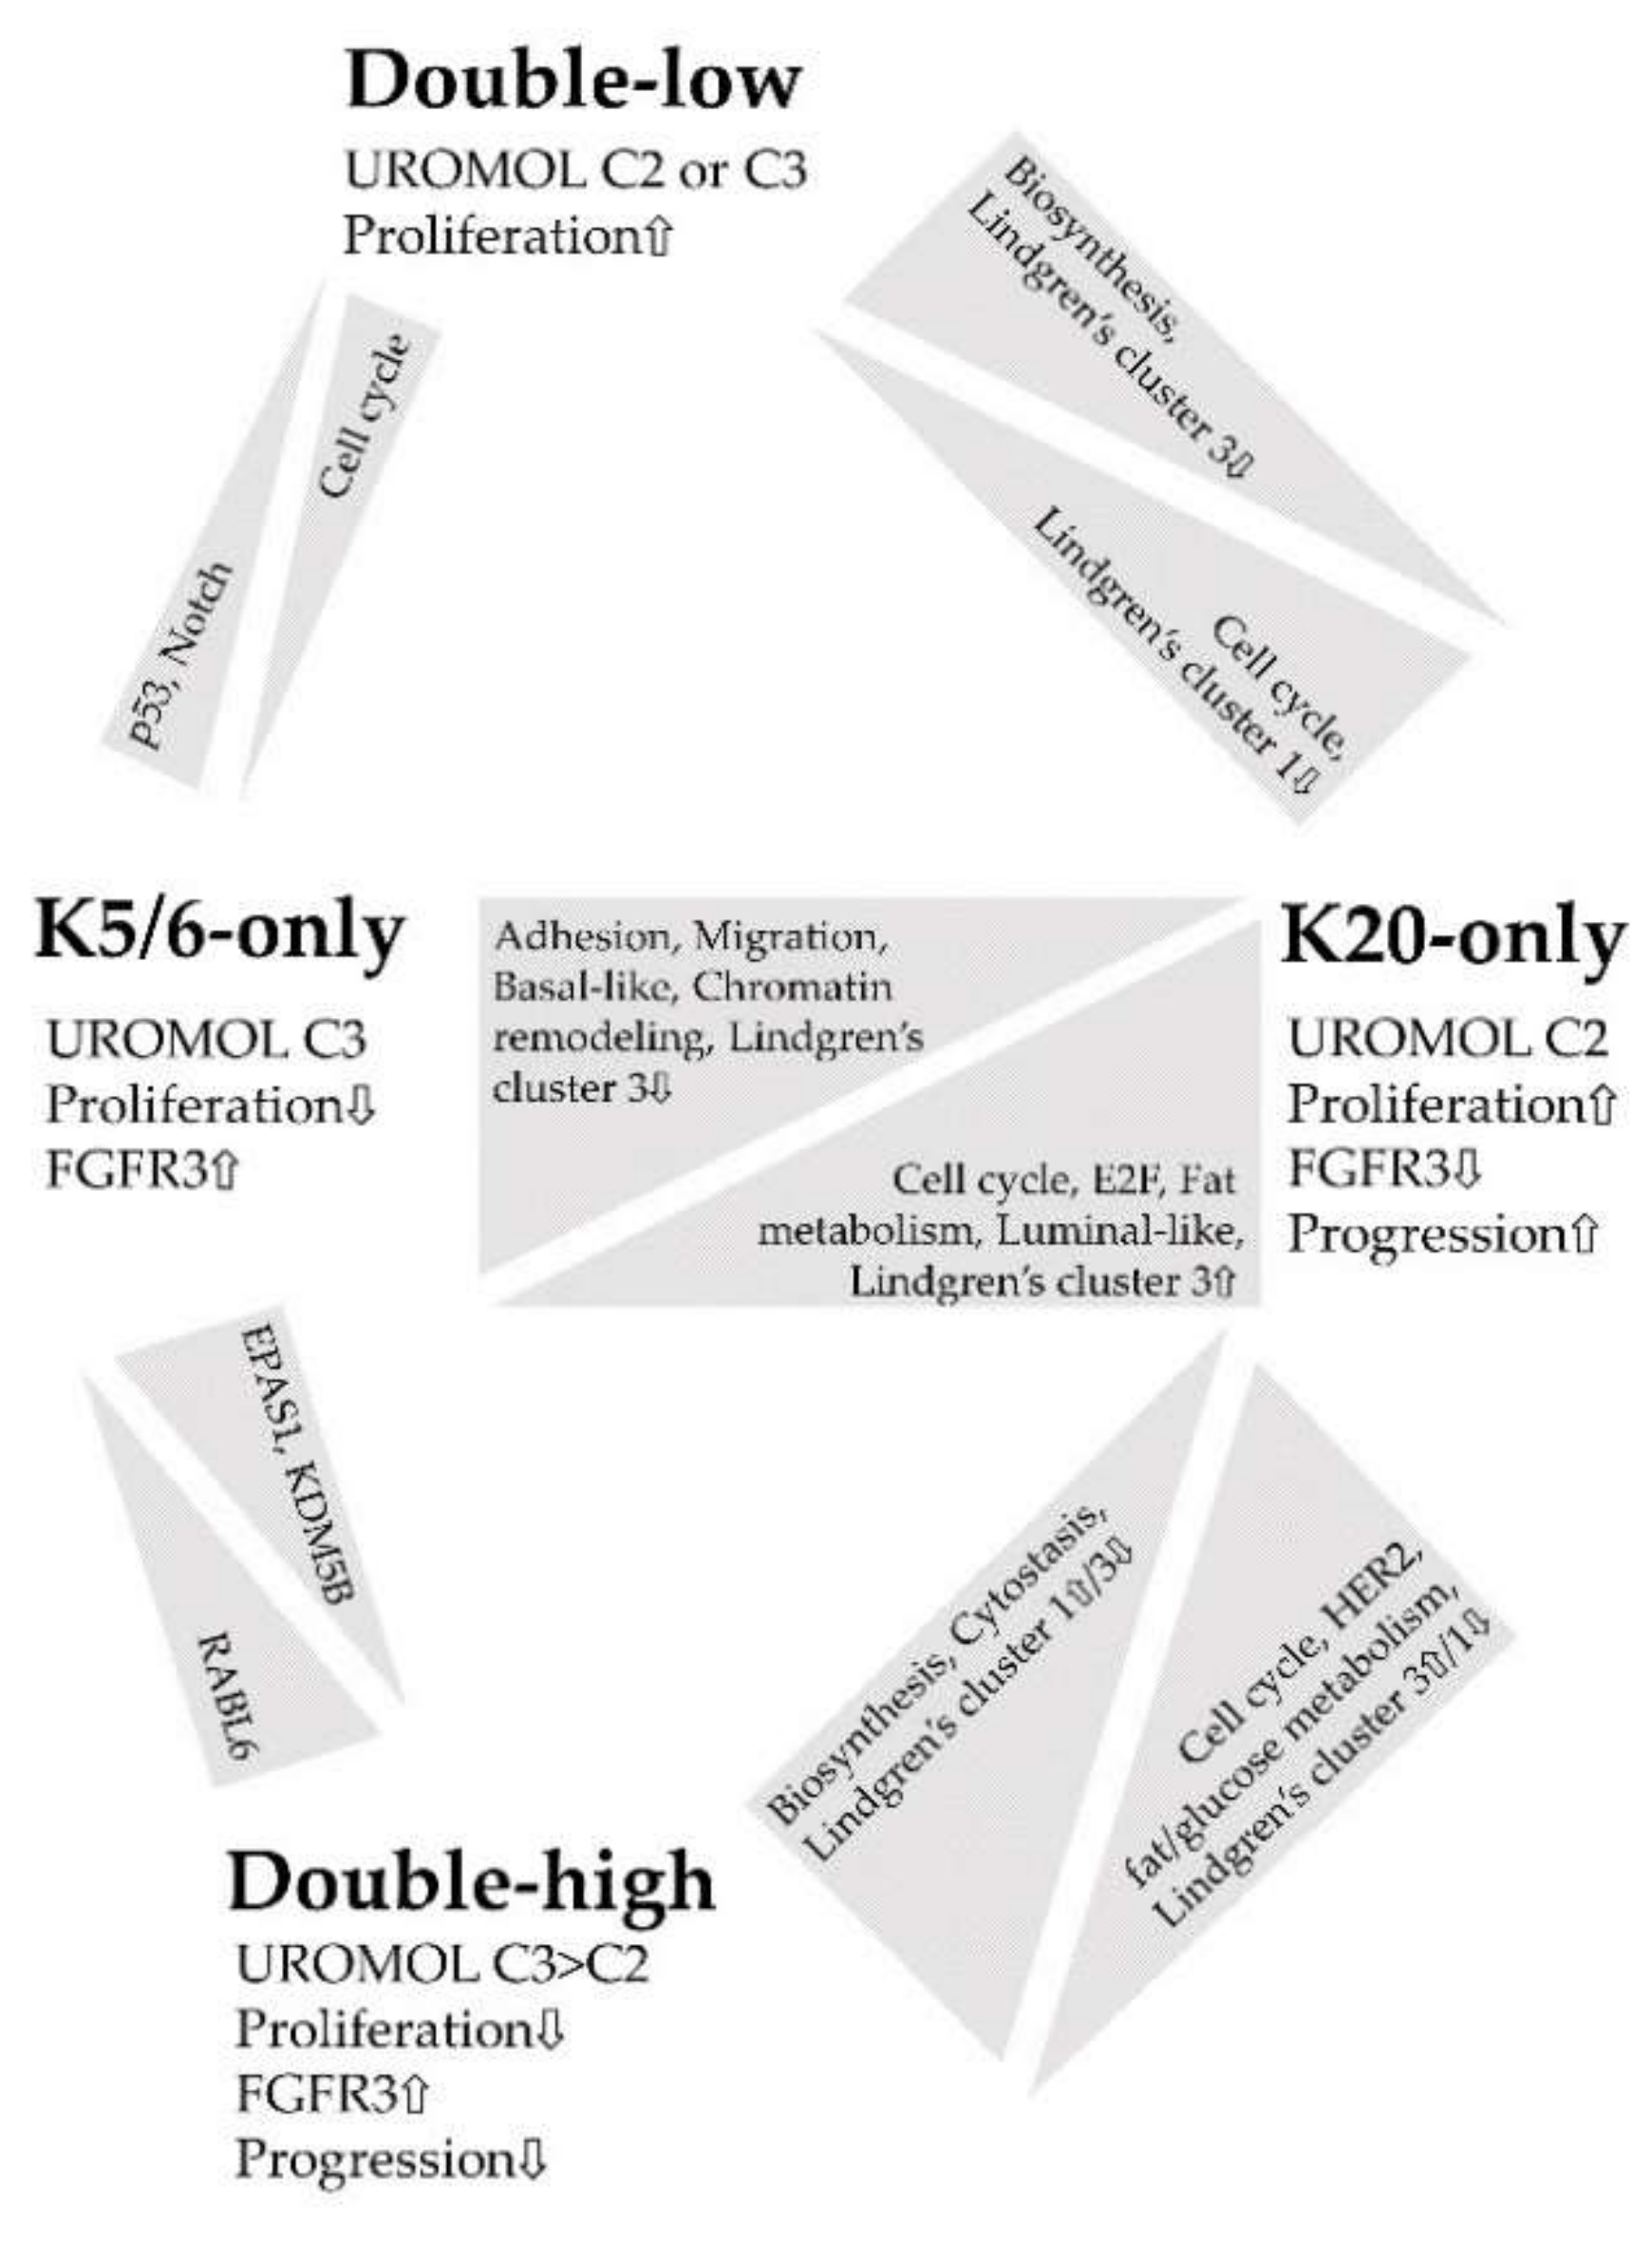
5. Conclusions
Figure 4 summarizes the major findings of this study. IHC staining for K5/6 and K20 is an indicator of molecular traits profoundly affected in NMIBC and closely associated with NMIBC subtypes [6,8]; thus, we propose K5/6 and K20 as promising biomarkers in the management of patients with NMIBC [16,28,43]. In particular, the K20-only group was significantly enriched in genes related to cell cycle, proliferation, and progression, which indicates a need for close observation of patients with NMIBC with luminal-like expression.
Supplementary Materials
Supplementary Materials can be found at https://www.mdpi.com/1422-0067/21/20/7726/s1. Figure S1: Representative microscopic images of IHC staining for K5/6 and K20; Figure S2: Kaplan-Meier and log-rank tests of relapse-free survival of the groups; Figure S3: Identification of DEGs between the groups; Figure S4: Cell proliferation functions significantly enriched in the groups identified by the GSEA; Figure S5: Metabolism functions significantly enriched in the groups identified by the GSEA; Figure S6: Gene expression characteristics of basal vs. luminal cells of the breast significantly enriched in the groups identified by the GSEA; Figure S7: Identification of DEGs between the Lund cohort groups; Figure S8: KRT gene expression levels of each group; Figure S9: Accuracy of prediction models validated using gene-expression classifier of UROMOL NMIBC subtypes; Table S1: Clinicopathological details of the groups; Table S2: GO and KEGG analyses of the groups; Table S3: Class annotation to the UROMOL intrinsic subtypes by machine learning; Table S4: Clinicopathological details of the Lund cohort groups; Table S5: GO and KEGG analyses of the Lund cohort.
Author Contributions
Conceptualization: M.J., K.C.M.; formal analysis: I.J., K.K.; funding acquisition: K.C.M.; project administration: K.C.M.; resources: K.K., K.C.M.; supervision: K.C.M.; writing—original draft: M.J.; writing—review and editing: M.J., K.C.M.; All authors have read and agreed to the published version of the manuscript.
Funding
This research was funded by the Basic Science Research Program through the National Research Foundation of Korea (NRF) funded by the Ministry of Education (grant number 2018R1D1A1B07045763).
Conflicts of Interest
The authors declare no conflict of interest.
Abbreviations
| NMIBC | Non-muscle-invasive bladder cancer |
| MIBC | Muscle-invasive bladder cancer |
| IHC | Immunohistochemical |
| NMIUTUC | Non-muscle-invasive upper tract urothelial carcinoma |
| MAPK | Mitogen-activated protein kinase |
| DEG | Differentially expressed gene |
| GO | Gene ontology |
| KEGG | Kyoto Encyclopedia of Genes and Genomes |
| IPA | Ingenuity Pathway Analysis |
| GSEA | Gene Set Enrichment Analysis |
| FDR | False discovery rate |
References
- Antoni, S.; Ferlay, J.; Soerjomataram, I.; Znaor, A.; Jemal, A.; Bray, F. Bladder cancer incidence and mortality: A global overview and recent trends. Eur. Urol. 2017, 71, 96–108. [Google Scholar] [CrossRef] [PubMed]
- Babjuk, M.; Burger, M.; Comperat, E.M.; Gontero, P.; Mostafid, A.H.; Palou, J.; Van Rhijn, B.W.G.; Roupret, M.; Shariat, S.F.; Sylvester, R.; et al. European Association of Urology guidelines on non-muscle-invasive bladder cancer (TaT1 and carcinoma in situ)—2019 update. Eur. Urol. 2019, 76, 639–657. [Google Scholar] [CrossRef] [PubMed]
- Chang, S.S.; Boorjian, S.A.; Chou, R.; Clark, P.E.; Daneshmand, S.; Konety, B.R.; Pruthi, R.; Quale, D.Z.; Ritch, C.R.; Seigne, J.D.; et al. Diagnosis and treatment of non-muscle invasive bladder cancer: AUA/SUO guideline. J. Urol. 2016, 196, 1021–1029. [Google Scholar] [CrossRef] [PubMed]
- Sjodahl, G.; Eriksson, P.; Patschan, O.; Marzouka, N.A.; Jakobsson, L.; Bernardo, C.; Lovgren, K.; Chebil, G.; Zwarthoff, E.; Liedberg, F.; et al. Molecular changes during progression from nonmuscle invasive to advanced urothelial carcinoma. Int. J. Cancer 2020, 146, 2636–2647. [Google Scholar] [CrossRef] [PubMed] [Green Version]
- Sjodahl, G.; Lauss, M.; Lovgren, K.; Chebil, G.; Gudjonsson, S.; Veerla, S.; Patschan, O.; Aine, M.; Ferno, M.; Ringner, M.; et al. A molecular taxonomy for urothelial carcinoma. Clin. Cancer Res. 2012, 18, 3377–3386. [Google Scholar] [CrossRef] [Green Version]
- Hedegaard, J.; Lamy, P.; Nordentoft, I.; Algaba, F.; Hoyer, S.; Ulhoi, B.P.; Vang, S.; Reinert, T.; Hermann, G.G.; Mogensen, K.; et al. Comprehensive transcriptional analysis of early-stage urothelial carcinoma. Cancer Cell 2016, 30, 27–42. [Google Scholar] [CrossRef]
- Hurst, C.D.; Alder, O.; Platt, F.M.; Droop, A.; Stead, L.F.; Burns, J.E.; Burghel, G.J.; Jain, S.; Klimczak, L.J.; Lindsay, H.; et al. Genomic subtypes of non-invasive bladder cancer with distinct metabolic profile and female gender bias in KDM6A mutation frequency. Cancer Cell 2017, 32, 701–715.e7. [Google Scholar] [CrossRef]
- Lindgren, D.; Liedberg, F.; Andersson, A.; Chebil, G.; Gudjonsson, S.; Borg, A.; Mansson, W.; Fioretos, T.; Hoglund, M. Molecular characterization of early-stage bladder carcinomas by expression profiles, FGFR3 mutation status, and loss of 9q. Oncogene 2006, 25, 2685–2696. [Google Scholar] [CrossRef] [Green Version]
- Patschan, O.; Sjodahl, G.; Chebil, G.; Lovgren, K.; Lauss, M.; Gudjonsson, S.; Kollberg, P.; Eriksson, P.; Aine, M.; Mansson, W.; et al. A molecular pathologic framework for risk stratification of stage T1 urothelial carcinoma. Eur. Urol. 2015, 68, 824–832. [Google Scholar] [CrossRef]
- Breyer, J.; Wirtz, R.M.; Otto, W.; Erben, P.; Kriegmair, M.C.; Stoehr, R.; Eckstein, M.; Eidt, S.; Denzinger, S.; Burger, M.; et al. In stage pT1 non-muscle-invasive bladder cancer (NMIBC), high KRT20 and low KRT5 mRNA expression identify the luminal subtype and predict recurrence and survival. Virchows Arch. 2017, 470, 267–274. [Google Scholar] [CrossRef]
- Rebola, J.; Aguiar, P.; Blanca, A.; Montironi, R.; Cimadamore, A.; Cheng, L.; Henriques, V.; Lobato-Faria, P.; Lopez-Beltran, A. Predicting outcomes in non-muscle invasive (Ta/T1) bladder cancer: The role of molecular grade based on luminal/basal phenotype. Virchows Arch. 2019, 475, 445–455. [Google Scholar] [CrossRef] [PubMed]
- Jung, M.; Kim, B.; Moon, K.C. Immunohistochemistry of cytokeratin (CK) 5/6, CD44 and CK20 as prognostic biomarkers of non-muscle-invasive papillary upper tract urothelial carcinoma. Histopathology 2019, 74, 483–493. [Google Scholar] [CrossRef] [PubMed]
- Jung, M.; Lee, J.H.; Kim, B.; Park, J.H.; Moon, K.C. Transcriptional analysis of immunohistochemically defined subgroups of non-muscle-invasive papillary high-grade upper tract urothelial carcinoma. Int. J. Mol. Sci. 2019, 20, 570. [Google Scholar] [CrossRef] [PubMed] [Green Version]
- Lerner, S.P.; McConkey, D.J.; Hoadley, K.A.; Chan, K.S.; Kim, W.Y.; Radvanyi, F.; Hoglund, M.; Real, F.X. Bladder cancer molecular taxonomy: Summary from a consensus meeting. Bladder Cancer 2016, 2, 37–47. [Google Scholar] [CrossRef] [PubMed] [Green Version]
- Rosenberg, J.E.; Hoffman-Censits, J.; Powles, T.; Van der Heijden, M.S.; Balar, A.V.; Necchi, A.; Dawson, N.; O’Donnell, P.H.; Balmanoukian, A.; Loriot, Y.; et al. Atezolizumab in patients with locally advanced and metastatic urothelial carcinoma who have progressed following treatment with platinum-based chemotherapy: A single-arm, multicentre, phase 2 trial. Lancet 2016, 387, 1909–1920. [Google Scholar] [CrossRef] [Green Version]
- Seiler, R.; Ashab, H.A.D.; Erho, N.; Van Rhijn, B.W.G.; Winters, B.; Douglas, J.; Van Kessel, K.E.; Fransen van de Putte, E.E.; Sommerlad, M.; Wang, N.Q.; et al. Impact of molecular subtypes in muscle-invasive bladder cancer on predicting response and survival after neoadjuvant chemotherapy. Eur. Urol. 2017, 72, 544–554. [Google Scholar] [CrossRef]
- Sjodahl, G.; Lovgren, K.; Lauss, M.; Patschan, O.; Gudjonsson, S.; Chebil, G.; Aine, M.; Eriksson, P.; Mansson, W.; Lindgren, D.; et al. Toward a molecular pathologic classification of urothelial carcinoma. Am. J. Pathol. 2013, 183, 681–691. [Google Scholar] [CrossRef] [Green Version]
- Sjodahl, G.; Eriksson, P.; Liedberg, F.; Hoglund, M. Molecular classification of urothelial carcinoma: Global mRNA classification versus tumour-cell phenotype classification. J. Pathol. 2017, 242, 113–125. [Google Scholar] [CrossRef]
- Desai, S.; Lim, S.D.; Jimenez, R.E.; Chun, T.; Keane, T.E.; McKenney, J.K.; Zavala-Pompa, A.; Cohen, C.; Young, R.H.; Amin, M.B. Relationship of cytokeratin 20 and CD44 protein expression with WHO/ISUP grade in pTa and pT1 papillary urothelial neoplasia. Mod. Pathol. 2000, 13, 1315–1323. [Google Scholar] [CrossRef]
- Choi, W.; Porten, S.; Kim, S.; Willis, D.; Plimack, E.R.; Hoffman-Censits, J.; Roth, B.; Cheng, T.; Tran, M.; Lee, I.L.; et al. Identification of distinct basal and luminal subtypes of muscle-invasive bladder cancer with different sensitivities to frontline chemotherapy. Cancer Cell 2014, 25, 152–165. [Google Scholar] [CrossRef] [Green Version]
- Tan, T.Z.; Rouanne, M.; Tan, K.T.; Huang, R.Y.; Thiery, J.P. Molecular Subtypes of Urothelial Bladder Cancer: Results from a Meta-cohort Analysis of 2411 Tumors. Eur. Urol. 2019, 75, 423–432. [Google Scholar] [CrossRef]
- Dyrskjot, L.; Reinert, T.; Novoradovsky, A.; Zuiverloon, T.C.; Beukers, W.; Zwarthoff, E.; Malats, N.; Real, F.X.; Segersten, U.; Malmstrom, P.U.; et al. Analysis of molecular intra-patient variation and delineation of a prognostic 12-gene signature in non-muscle invasive bladder cancer; technology transfer from microarrays to PCR. Br. J. Cancer 2012, 107, 1392–1398. [Google Scholar] [CrossRef] [PubMed]
- Tsantoulis, P.K.; Gorgoulis, V.G. Involvement of E2F transcription factor family in cancer. Eur. J. Cancer 2005, 41, 2403–2414. [Google Scholar] [CrossRef]
- Santos, M.; Martinez-Fernandez, M.; Duenas, M.; Garcia-Escudero, R.; Alfaya, B.; Villacampa, F.; Saiz-Ladera, C.; Costa, C.; Oteo, M.; Duarte, J.; et al. In vivo disruption of an Rb-E2F-Ezh2 signaling loop causes bladder cancer. Cancer Res. 2014, 74, 6565–6577. [Google Scholar] [CrossRef] [Green Version]
- Lindgren, D.; Sjodahl, G.; Lauss, M.; Staaf, J.; Chebil, G.; Lovgren, K.; Gudjonsson, S.; Liedberg, F.; Patschan, O.; Mansson, W.; et al. Integrated genomic and gene expression profiling identifies two major genomic circuits in urothelial carcinoma. PLoS ONE 2012, 7, e38863. [Google Scholar] [CrossRef] [PubMed]
- Loriot, Y.; Necchi, A.; Park, S.H.; Garcia-Donas, J.; Huddart, R.; Burgess, E.; Fleming, M.; Rezazadeh, A.; Mellado, B.; Varlamov, S.; et al. Erdafitinib in locally advanced or metastatic urothelial carcinoma. N. Engl. J. Med. 2019, 381, 338–348. [Google Scholar] [CrossRef]
- Stroggilos, R.; Mokou, M.; Latosinska, A.; Makridakis, M.; Lygirou, V.; Mavrogeorgis, E.; Drekolias, D.; Frantzi, M.; Mullen, W.; Fragkoulis, C.; et al. Proteome-based classification of nonmuscle invasive bladder cancer. Int. J. Cancer 2020, 146, 281–294. [Google Scholar] [CrossRef]
- Jung, M.; Jang, I.; Kim, K.; Moon, K.C. CK14 expression identifies a basal/squamous-like type of papillary non-muscle-invasive upper tract urothelial carcinoma. Front. Oncol. 2020, 10, 623. [Google Scholar] [CrossRef] [PubMed]
- Schnitzler, T.; Ortiz-Bruchle, N.; Schneider, U.; Lurje, I.; Guricova, K.; Buchner, A.; Schulz, G.B.; Heidenreich, A.; Gaisa, N.T.; Knuchel, R.; et al. Pure high-grade papillary urothelial bladder cancer: A luminal-like subgroup with potential for targeted therapy. Cell. Oncol. 2020. [Google Scholar] [CrossRef]
- Dadhania, V.; Zhang, M.; Zhang, L.; Bondaruk, J.; Majewski, T.; Siefker-Radtke, A.; Guo, C.C.; Dinney, C.; Cogdell, D.E.; Zhang, S.; et al. Meta-analysis of the luminal and basal subtypes of bladder cancer and the identification of signature immunohistochemical markers for clinical use. EBioMedicine 2016, 12, 105–117. [Google Scholar] [CrossRef] [Green Version]
- Bankhead, P.; Loughrey, M.B.; Fernandez, J.A.; Dombrowski, Y.; McArt, D.G.; Dunne, P.D.; McQuaid, S.; Gray, R.T.; Murray, L.J.; Coleman, H.G.; et al. QuPath: Open source software for digital pathology image analysis. Sci. Rep. 2017, 7, 16878. [Google Scholar] [CrossRef] [Green Version]
- Jones, J.C.; Siebold, A.P.; Livi, C.B.; Lucas, A.B. SureSelectXT RNA Direct: A technique for expression analysis through sequencing of target-enriched FFPE total RNA. Methods Mol. Biol. 2018, 1783, 81–104. [Google Scholar] [PubMed]
- Martin, J.A.; Wang, Z. Next-generation transcriptome assembly. Nat. Rev. Genet. 2011, 12, 671–682. [Google Scholar] [CrossRef] [PubMed]
- Bolger, A.M.; Lohse, M.; Usadel, B. Trimmomatic: A flexible trimmer for Illumina sequence data. Bioinformatics 2014, 30, 2114–2120. [Google Scholar] [CrossRef] [Green Version]
- Kim, D.; Paggi, J.M.; Park, C.; Bennett, C.; Salzberg, S.L. Graph-based genome alignment and genotyping with HISAT2 and HISAT-genotype. Nat. Biotechnol. 2019, 37, 907–915. [Google Scholar] [CrossRef]
- Pertea, M.; Pertea, G.M.; Antonescu, C.M.; Chang, T.C.; Mendell, J.T.; Salzberg, S.L. StringTie enables improved reconstruction of a transcriptome from RNA-seq reads. Nat. Biotechnol. 2015, 33, 290–295. [Google Scholar] [CrossRef] [Green Version]
- Subramanian, A.; Tamayo, P.; Mootha, V.K.; Mukherjee, S.; Ebert, B.L.; Gillette, M.A.; Paulovich, A.; Pomeroy, S.L.; Golub, T.R.; Lander, E.S.; et al. Gene set enrichment analysis: A knowledge-based approach for interpreting genome-wide expression profiles. Proc. Natl. Acad. Sci. USA 2005, 102, 15545–15550. [Google Scholar] [CrossRef] [PubMed] [Green Version]
- Supek, F.; Bosnjak, M.; Skunca, N.; Smuc, T. REVIGO summarizes and visualizes long lists of gene ontology terms. PLoS ONE 2011, 6, e21800. [Google Scholar] [CrossRef] [Green Version]
- Kramer, A.; Green, J.; Pollard, J., Jr.; Tugendreich, S. Causal analysis approaches in Ingenuity Pathway Analysis. Bioinformatics 2014, 30, 523–530. [Google Scholar] [CrossRef]
- Chun, H.; Keles, S. Sparse partial least squares regression for simultaneous dimension reduction and variable selection. J. R. Stat. Soc. Ser. B Stat. Methodol. 2010, 72, 3–25. [Google Scholar] [CrossRef] [Green Version]
- Cawley, G.C.; Talbot, N.L. Gene selection in cancer classification using sparse logistic regression with Bayesian regularization. Bioinformatics 2006, 22, 2348–2355. [Google Scholar] [CrossRef] [PubMed] [Green Version]
- Friedman, J.; Hastie, T.; Tibshirani, R. Regularization Paths for Generalized Linear Models via Coordinate Descent. J. Stat. Softw. 2010, 33, 1–22. [Google Scholar] [CrossRef] [PubMed] [Green Version]
- Chen, M.; Hildebrandt, M.A.; Clague, J.; Kamat, A.M.; Picornell, A.; Chang, J.; Zhang, X.; Izzo, J.; Yang, H.; Lin, J.; et al. Genetic variations in the sonic hedgehog pathway affect clinical outcomes in non-muscle-invasive bladder cancer. Cancer Prev. Res. 2010, 3, 1235–1245. [Google Scholar] [CrossRef] [PubMed] [Green Version]
Figure 1.
Gene ontology-biologic processes enriched in upregulated genes in each comparison. The relative size of the rectangles represents statistical significance levels. The overarching gene ontology categories are demonstrated with color bars.
Figure 1.
Gene ontology-biologic processes enriched in upregulated genes in each comparison. The relative size of the rectangles represents statistical significance levels. The overarching gene ontology categories are demonstrated with color bars.

Figure 2.
Biologic and functional signatures of the non-muscle-invasive bladder cancer (NMIBC) groups. (a) Heatmaps of genes included in the proliferation signature (top), the FGFR3 pathway (middle), and the progression signature (bottom). The progression result was obtained by subtracting the low-expression genes from the high-expression genes included in the NMIBC progression gene set. (b) Hallmark gene sets related to cell proliferation from the GSEA. (c) Immunohistochemical (IHC) staining results of Ki-67 (%) and HER2 (histoscore) for each group are illustrated as the mean (dot) and standard deviation (bar). (d) Curated gene sets from the GSEA (“Lindgren_bladder_cancer”) that were significantly enriched in the groups.

Figure 3.
Functional enrichment analyses of the differentially expressed genes (DEGs) identified in the Lund groups. (a) Gene ontology-biologic processes enriched in the upregulated genes from each comparison. The overarching gene ontology categories are demonstrated with color bars (b) Hallmark gene sets related to cell proliferation from the Gene Set Enrichment Analysis (GSEA).

Figure 4.
Summary of the functional enrichment of each comparison.


Table 1.
Significant functional enrichment predicted by Ingenuity Pathway Analysis.
| Category | Predicted Result | Upregulated Group | z-Score 1 | FDR 2 |
|---|---|---|---|---|
| K20-only vs. K5/6-only group | ||||
| Upstream | RABL6 | K20-only | 2.530 | 5.9 × 10⁻⁴ |
| Upstream | ID2 | K20-only | 2.208 | 5.5 × 10⁻³ |
| Upstream | EFNA4 | K20-only | 2.449 | 1.9 × 10⁻² |
| Upstream | PPARGC1A | K20-only | 3.125 | 1.9 × 10⁻² |
| Upstream | EFNA3 | K20-only | 2.449 | 1.9 × 10⁻² |
| Upstream | EFNA5 | K20-only | 2.449 | 2.2 × 10⁻² |
| Upstream | TP53 | K5/6-only | 2.752 | 1.0 × 10⁻⁷ |
| Upstream | TP63 | K5/6-only | 2.213 | 3.3 × 10⁻⁶ |
| Upstream | TGFB1 | K5/6-only | 4.169 | 2.3 × 10⁻⁵ |
| Upstream | PGR | K5/6-only | 2.288 | 8.8 × 10⁻⁵ |
| Upstream | CDKN2A | K5/6-only | 2.701 | 2.8 × 10⁻⁴ |
| Upstream | KDM5B | K5/6-only | 3.143 | 3.3 × 10⁻⁴ |
| Upstream | BRCA1 | K5/6-only | 2.063 | 3.7 × 10⁻⁴ |
| Upstream | RAF1 | K5/6-only | 3.385 | 3.7 × 10⁻⁴ |
| Upstream | CDKN1A | K5/6-only | 2.408 | 4.6 × 10⁻⁴ |
| Upstream | RB1 | K5/6-only | 2.134 | 6.8 × 10⁻⁴ |
| Upstream | SMARCA4 | K5/6-only | 2.959 | 7.6 × 10⁻⁴ |
| Upstream | NUPR1 | K5/6-only | 3.413 | 8.5 × 10⁻⁴ |
| Upstream | IKBKB | K5/6-only | 2.016 | 1.7 × 10⁻³ |
| Upstream | EGF | K5/6-only | 2.089 | 2.0 × 10⁻³ |
| Upstream | HIF1A | K5/6-only | 2.059 | 3.2 × 10⁻³ |
| Upstream | TGF beta | K5/6-only | 2.288 | 3.4 × 10⁻³ |
| Upstream | FSHB | K5/6-only | 2.190 | 6.4 × 10⁻³ |
| Upstream | FGF2 | K5/6-only | 3.083 | 8.0 × 10⁻³ |
| Upstream | JAG1 | K5/6-only | 2.646 | 8.1 × 10⁻³ |
| Upstream | PDGF BB | K5/6-only | 2.652 | 8.9 × 10⁻³ |
| Upstream | IGF1 | K5/6-only | 2.083 | 9.8 × 10⁻³ |
| Upstream | CG | K5/6-only | 2.332 | 1.2 × 10⁻² |
| Upstream | JUN | K5/6-only | 2.502 | 1.3 × 10⁻² |
| Upstream | BNIP3L | K5/6-only | 2.630 | 1.9 × 10⁻² |
| Upstream | CTNNB1 | K5/6-only | 2.630 | 2.3 × 10⁻² |
| Upstream | Calcineurin A | K5/6-only | 2.200 | 2.9 × 10⁻² |
| Upstream | EDN1 | K5/6-only | 2.439 | 3.6 × 10⁻² |
| Upstream | ERK1/2 | K5/6-only | 2.163 | 3.7 × 10⁻² |
| Upstream | TGFB3 | K5/6-only | 2.926 | 3.8 × 10⁻² |
| Upstream | STAT3 | K5/6-only | 2.209 | 3.8 × 10⁻² |
| Disease/function | Endocrine gland tumor | K20-only | 2.213 | 3.1 × 10⁻⁸ |
| Disease/function | Congenital anomaly of digit | K20-only | 2.000 | 7.3 × 10⁻³ |
| Disease/function | Invasion of tumor cell lines | K5/6-only | 2.069 | 1.3 × 10⁻⁵ |
| Disease/function | Migration of cells | K5/6-only | 2.102 | 3.4 × 10⁻⁵ |
| Disease/function | Cell movement | K5/6-only | 2.591 | 4.5 × 10⁻⁵ |
| Disease/function | Adhesion of tumor cell lines | K5/6-only | 2.481 | 7.4 × 10⁻⁴ |
| Disease/function | Binding of tumor cell lines | K5/6-only | 2.444 | 8.7 × 10⁻⁴ |
| Disease/function | Attachment of cells | K5/6-only | 2.040 | 1.5 × 10⁻³ |
| Disease/function | Invasion of breast cancer cell lines | K5/6-only | 2.015 | 1.5 × 10⁻³ |
| Disease/function | Cell movement of breast cancer cell lines | K5/6-only | 2.014 | 4.1 × 10⁻³ |
| Disease/function | Apoptosis of prostate cancer cell lines | K5/6-only | 3.467 | 5.9 × 10⁻³ |
| Disease/function | Formation of gamma H2AX nuclear focus | K5/6-only | 2.345 | 6.1 × 10⁻³ |
| Disease/function | Cell movement of endothelial cells | K5/6-only | 2.190 | 6.3 × 10⁻³ |
| Disease/function | Apoptosis of cancer cells | K5/6-only | 2.420 | 7.0 × 10⁻³ |
| Disease/function | Necrosis of tumor | K5/6-only | 2.495 | 7.7 × 10⁻³ |
| Disease/function | Necrosis of prostate cancer cell lines | K5/6-only | 3.223 | 8.2 × 10⁻³ |
| K20-only vs. double-high group | ||||
| Upstream | ERBB2 | K20-only | 3.284 | 7.2 × 10⁻⁴ |
| Upstream | EP400 | K20-only | 2.449 | 1.8 × 10⁻³ |
| Upstream | E2f | K20-only | 2.199 | 2.8 × 10⁻³ |
| Upstream | RABL6 | K20-only | 3.000 | 5.6 × 10⁻³ |
| Upstream | ID2 | K20-only | 2.563 | 5.6 × 10⁻³ |
| Upstream | ID3 | K20-only | 2.157 | 2.1 × 10⁻² |
| Upstream | E2F3 | K20-only | 2.534 | 2.1 × 10⁻² |
| Upstream | MITF | K20-only | 2.575 | 3.0 × 10⁻² |
| Upstream | SREBF2 | K20-only | 2.557 | 4.7 × 10⁻² |
| Upstream | TP53 | Double-high | 3.069 | 2.8 × 10⁻⁸ |
| Upstream | CDKN2A | Double-high | 4.097 | 3.7 × 10⁻⁴ |
| Upstream | CDKN1A | Double-high | 2.729 | 4.5 × 10⁻⁴ |
| Upstream | MLXIPL | Double-high | 3.592 | 1.4 × 10⁻³ |
| Upstream | OGA | Double-high | 3.272 | 2.5 × 10⁻³ |
| Upstream | MYCN | Double-high | 2.385 | 8.1 × 10⁻³ |
| Disease/function | DNA replication | K20-only | 2.159 | 8.8 × 10⁻⁵ |
| Disease/function | Genitourinary adenocarcinoma | K20-only | 2.177 | 1.0 × 10⁻⁴ |
| Disease/function | Proliferation of connective tissue cells | K20-only | 3.115 | 4.2 × 10⁻⁴ |
| Disease/function | Growth of connective tissue | K20-only | 2.790 | 5.5 × 10⁻⁴ |
| Disease/function | Cell proliferation of breast cancer cell lines | K20-only | 2.032 | 2.6 × 10⁻³ |
| Disease/function | Advanced malignant solid tumor | K20-only | 2.228 | 3.6 × 10⁻³ |
| Disease/function | Growth of organism | K20-only | 2.299 | 6.0 × 10⁻³ |
| Disease/function | Advanced lung cancer | K20-only | 2.578 | 6.4 × 10⁻³ |
| Disease/function | Cell cycle progression of tumor cell lines | K20-only | 2.395 | 1.1 × 10⁻² |
| Disease/function | Visceral metastasis | K20-only | 2.594 | 1.3 × 10⁻² |
| Disease/function | Metastatic solid tumor | K20-only | 2.228 | 1.3 × 10⁻² |
| Disease/function | Advanced extracranial solid tumor | K20-only | 2.576 | 1.8 × 10⁻² |
| Disease/function | Cell death of breast cancer cell lines | Double-high | 2.359 | 2.7 × 10⁻⁵ |
| Disease/function | Cell death of tumor cell lines | Double-high | 3.092 | 4.4 × 10⁻⁵ |
| Disease/function | Apoptosis | Double-high | 2.128 | 2.1 × 10⁻⁴ |
| Disease/function | Gastrointestinal tract cancer | Double-high | 2.000 | 1.1 × 10⁻³ |
| Disease/function | Senescence of cells | Double-high | 2.104 | 1.1 × 10⁻³ |
| Disease/function | Cell death of lung cancer cell lines | Double-high | 2.444 | 3.7× 10⁻³ |
| Disease/function | Colon tumor | Double-high | 2.364 | 7.1 × 10⁻³ |
| Disease/function | Proliferation of hematopoietic progenitor cells | Double-high | 2.005 | 1.6 × 10⁻² |
| Disease/function | Colorectal tumor | Double-high | 2.078 | 1.6 × 10⁻² |
| Disease/function | Cytostasis of tumor cell lines | Double-high | 2.145 | 1.8 × 10⁻² |
| K5/6-only vs. double-high group | ||||
| Upstream | EPAS1 | K5/6-only | 2.000 | 3.9 × 10⁻² |
| Disease/function | NA | NA | NA | NA |
| K20-only vs. double-low group | ||||
| Upstream | ID3 | K20-only | 2.213 | 1.2 × 10⁻² |
| Upstream | MYC | K20-only | 2.299 | 1.3 × 10⁻² |
| Upstream | LLGL2 | K20-only | 2.000 | 4.4 × 10⁻² |
| Upstream | ERBB3 | K20-only | 2.588 | 4.7 × 10⁻² |
| Disease/function | Genitourinary tumor | K20-only | 2.017 | 2.1 × 10⁻³ |
| Disease/function | Malignant genitourinary solid tumor | K20-only | 2.139 | 2.1 × 10⁻³ |
| Disease/function | Adenocarcinoma | K20-only | 2.204 | 3.2 × 10⁻³ |
| Disease/function | Anogenital cancer | K20-only | 2.144 | 3.9 × 10⁻³ |
| Disease/function | Incidence of tumor | K20-only | 2.257 | 7.0 × 10⁻³ |
| Disease/function | Carcinoma | K20-only | 2.292 | 7.8 × 10⁻³ |
| Disease/function | Extracranial solid tumor | K20-only | 2.697 | 1.4 × 10⁻² |
| Disease/function | Malignant solid tumor | K20-only | 2.026 | 2.3 × 10⁻² |
| Disease/function | Epithelial–mesenchymal transition of breast cell lines | K20-only | 2.108 | 2.8 × 10⁻² |
| K5/6-only vs. double-low group | ||||
| Upstream | TP53 | K5/6-only | 2.086 | 1.8 × 10⁻⁴ |
| Disease/function | NA | NA | NA | NA |
1 z-score indicates an activation level of the predicted result based on the DEG fold change and its agreement with the result. 2 FDR, false discovery rate (Benjamini Hochberg).
Table 2.
Significant functional enrichment of the Lund groups predicted by Ingenuity Pathway Analysis.
Table 2.
Significant functional enrichment of the Lund groups predicted by Ingenuity Pathway Analysis.
| Category | Predicted Result | Upregulated Group | z-Score 1 | FDR 2 |
|---|---|---|---|---|
| K20-only_Lund vs. K5/6-only_Lund group | ||||
| Upstream | RABL6 | K20-only | 5.014 | 2.4 × 10⁻²⁷ |
| Upstream | ERBB2 | K20-only | 4.092 | 5.9 × 10⁻²⁴ |
| Upstream | FOXM1 | K20-only | 3.818 | 1.7 × 10⁻¹⁶ |
| Upstream | MITF | K20-only | 3.962 | 7.6 × 10⁻¹⁵ |
| Upstream | FOXO1 | K20-only | 2.493 | 6.7 × 10⁻¹² |
| Upstream | LIN9 | K20-only | 3.130 | 3.6 × 10⁻¹¹ |
| Upstream | AREG | K20-only | 3.195 | 1.3 × 10⁻⁹ |
| Upstream | E2F3 | K20-only | 3.592 | 6.1 × 10⁻⁸ |
| Upstream | E2f | K20-only | 2.449 | 1.4 × 10⁻⁷ |
| Upstream | MYBL2 | K20-only | 2.607 | 3.1 × 10⁻⁷ |
| Upstream | ELAVL1 | K20-only | 3.278 | 2.3 × 10⁻⁵ |
| Upstream | HSPB1 | K20-only | 2.429 | 3.1 × 10⁻⁵ |
| Upstream | RARA | K20-only | 4.000 | 5.4 × 10⁻⁵ |
| Upstream | TAL1 | K20-only | 3.000 | 5.6 × 10⁻⁵ |
| Upstream | KDM1A | K20-only | 3.434 | 7.1 × 10⁻⁵ |
| Upstream | ESR1 | K20-only | 3.601 | 1.0 × 10⁻⁴ |
| Upstream | 26s Proteasome | K20-only | 2.357 | 3.5 × 10⁻⁴ |
| Upstream | BRD4 | K20-only | 2.603 | 3.9 × 10⁻⁴ |
| Upstream | TRAF2 | K20-only | 2.224 | 6.7 × 10⁻⁴ |
| Upstream | NSUN6 | K20-only | 2.449 | 4.3 × 10⁻³ |
| Upstream | S100A6 | K20-only | 2.236 | 6.9 × 10⁻³ |
| Upstream | CREB1 | K20-only | 2.219 | 1.5 × 10⁻² |
| Upstream | TP53 | K5/6-only | 5.972 | 1.4 × 10⁻¹⁴ |
| Upstream | TRPS1 | K5/6-only | 3.742 | 3.4 × 10⁻¹⁴ |
| Upstream | NUPR1 | K5/6-only | 2.592 | 6.7 × 10⁻¹² |
| Upstream | CDKN1A | K5/6-only | 2.783 | 1.4 × 10⁻⁷ |
| Upstream | KDM5B | K5/6-only | 3.487 | 1.5 × 10⁻⁷ |
| Upstream | E2F6 | K5/6-only | 2.236 | 4.3 × 10⁻⁴ |
| Upstream | ATF3 | K5/6-only | 2.369 | 6.0 × 10⁻⁴ |
| Upstream | CTLA4 | K5/6-only | 2.236 | 5.1 × 10⁻³ |
| Upstream | CDKN2A | K5/6-only | 2.433 | 3.4 × 10⁻² |
| Disease/function | M phase | K20-only | 2.142 | 1.2x10⁻¹² |
| Disease/function | Alignment of chromosomes | K20-only | 2.324 | 7.2 × 10⁻¹² |
| Disease/function | M phase of tumor cell lines | K20-only | 2.613 | 5.2 × 10⁻¹⁰ |
| Disease/function | Cytokinesis | K20-only | 2.278 | 2.8 × 10⁻⁸ |
| Disease/function | M phase of cervical cancer cell lines | K20-only | 2.019 | 8.5 × 10⁻⁸ |
| Disease/function | Cytokinesis of tumor cell lines | K20-only | 2.249 | 1.0 × 10⁻⁷ |
| Disease/function | Interphase | K20-only | 2.744 | 2.4 × 10⁻⁷ |
| Disease/function | Cell survival | K20-only | 2.348 | 6.7 × 10⁻⁶ |
| Disease/function | Cell viability of tumor cell lines | K20-only | 2.470 | 1.3 × 10⁻⁵ |
| Disease/function | Cell proliferation of tumor cell lines | K20-only | 2.796 | 5.4 × 10⁻⁵ |
| Disease/function | Cell viability | K20-only | 2.328 | 9.8 × 1−5 |
| Disease/function | G1 phase | K20-only | 2.111 | 1.1 × 10⁻⁴ |
| Disease/function | Mitotic index | K20-only | 2.214 | 5.8 × 10⁻⁴ |
| Disease/function | Cell viability of myeloma cell lines | K20-only | 2.601 | 3.7 × 10⁻³ |
| Disease/function | Interphase of tumor cell lines | K20-only | 2.017 | 6.0 × 10⁻³ |
| Disease/function | Interphase of cervical cancer cell lines | K20-only | 2.392 | 1.8 × 10⁻² |
| Disease/function | Cell viability of lung cancer cell lines | K20-only | 2.100 | 4.7 × 10⁻² |
| Disease/function | Missegregation of chromosomes | K5/6-only | 2.392 | 1.4 × 10⁻³ |
| K20-only_Lund vs. double-high_Lund group | ||||
| Upstream | RABL6 | K20-only | 2.828 | 4.2 × 10⁻⁴ |
| Upstream | ERBB2 | K20-only | 2.219 | 1.2 × 10⁻² |
| Upstream | TGFB1 | K20-only | 2.186 | 4.3 × 10⁻² |
| Disease/function | NA | NA | NA | NA |
| K5/6-only_Lund vs. double-high_Lund group | ||||
| Upstream | KDM5B | K5/6-only | 2.000 | 8.6 × 10⁻³ |
| Upstream | RABL6 | Double-high | 2.236 | 2.2 × 10⁻⁴ |
| Disease/function | NA | NA | NA | NA |
| K20-only_Lund vs. double-low_Lund group | ||||
| Upstream | RABL6 | K20-only | 3.207 | 6.4 × 10⁻¹⁰ |
| Upstream | FOXM1 | K20-only | 3.382 | 7.1 × 10⁻⁸ |
| Upstream | ERBB2 | K20-only | 2.538 | 7.1 × 10⁻⁷ |
| Upstream | MYBL2 | K20-only | 2.412 | 2.3 × 10⁻⁶ |
| Upstream | LIN9 | K20-only | 2.438 | 7.0 × 10⁻⁶ |
| Upstream | AREG | K20-only | 2.132 | 2.9 × 10⁻⁵ |
| Upstream | HIF1A-AS1 | K20-only | 2.236 | 3.6 × 10⁻⁴ |
| Upstream | 26s Proteasome | K20-only | 2.607 | 2.9 × 10⁻³ |
| Upstream | E2F3 | K20-only | 2.646 | 7.3 × 10⁻³ |
| Upstream | RARA | K20-only | 3.000 | 2.1 × 10⁻² |
| Upstream | MITF | K20-only | 2.646 | 2.4 × 10⁻² |
| Upstream | ESR1 | K20-only | 2.718 | 4.8 × 10⁻² |
| Upstream | TRPS1 | Double-low | 2.828 | 7.1 × 10⁻⁷ |
| Upstream | TP53 | Double-low | 3.827 | 3.2 × 10⁻⁶ |
| Upstream | CDKN1A | Double-low | 2.848 | 2.9 × 10⁻⁵ |
| Upstream | CTLA4 | Double-low | 2.236 | 1.3x10⁻³ |
| Upstream | KDM5B | Double-low | 2.823 | 5.3 × 10⁻³ |
| Disease/function | Segregation of chromosomes | K20-only | 2.000 | 4.9 × 10⁻⁴ |
| K5/6-only_Lund vs. double-low_Lund group | ||||
| Upstream | NA | NA | NA | NA |
| Disease/function | NA | NA | NA | NA |
1 z-score indicates an activation level of the predicted result based on the DEG fold change and its agreement with the result. 2 FDR, false discovery rate (Benjamini Hochberg).
Publisher’s Note: MDPI stays neutral with regard to jurisdictional claims in published maps and institutional affiliations. |
© 2020 by the authors. Licensee MDPI, Basel, Switzerland. This article is an open access article distributed under the terms and conditions of the Creative Commons Attribution (CC BY) license (http://creativecommons.org/licenses/by/4.0/).
Share and Cite
MDPI and ACS Style
Jung, M.; Jang, I.; Kim, K.; Moon, K.C. Non-Muscle-Invasive Bladder Carcinoma with Respect to Basal Versus Luminal Keratin Expression. Int. J. Mol. Sci. 2020, 21, 7726. https://doi.org/10.3390/ijms21207726
AMA Style
Jung M, Jang I, Kim K, Moon KC. Non-Muscle-Invasive Bladder Carcinoma with Respect to Basal Versus Luminal Keratin Expression. International Journal of Molecular Sciences. 2020; 21(20):7726. https://doi.org/10.3390/ijms21207726
Chicago/Turabian StyleJung, Minsun, Insoon Jang, Kwangsoo Kim, and Kyung Chul Moon. 2020. "Non-Muscle-Invasive Bladder Carcinoma with Respect to Basal Versus Luminal Keratin Expression" International Journal of Molecular Sciences 21, no. 20: 7726. https://doi.org/10.3390/ijms21207726
Note that from the first issue of 2016, this journal uses article numbers instead of page numbers. See further details here.