Induced Short-Term Hearing Loss due to Stimulation of Age-Related Factors by Intermittent Hypoxia, High-Fat Diet, and Galactose Injection

 ,
, 
Abstract
: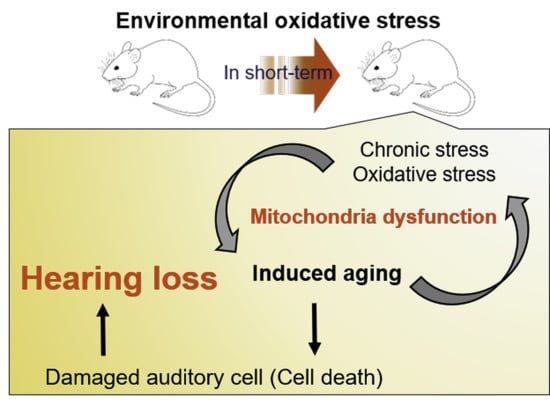
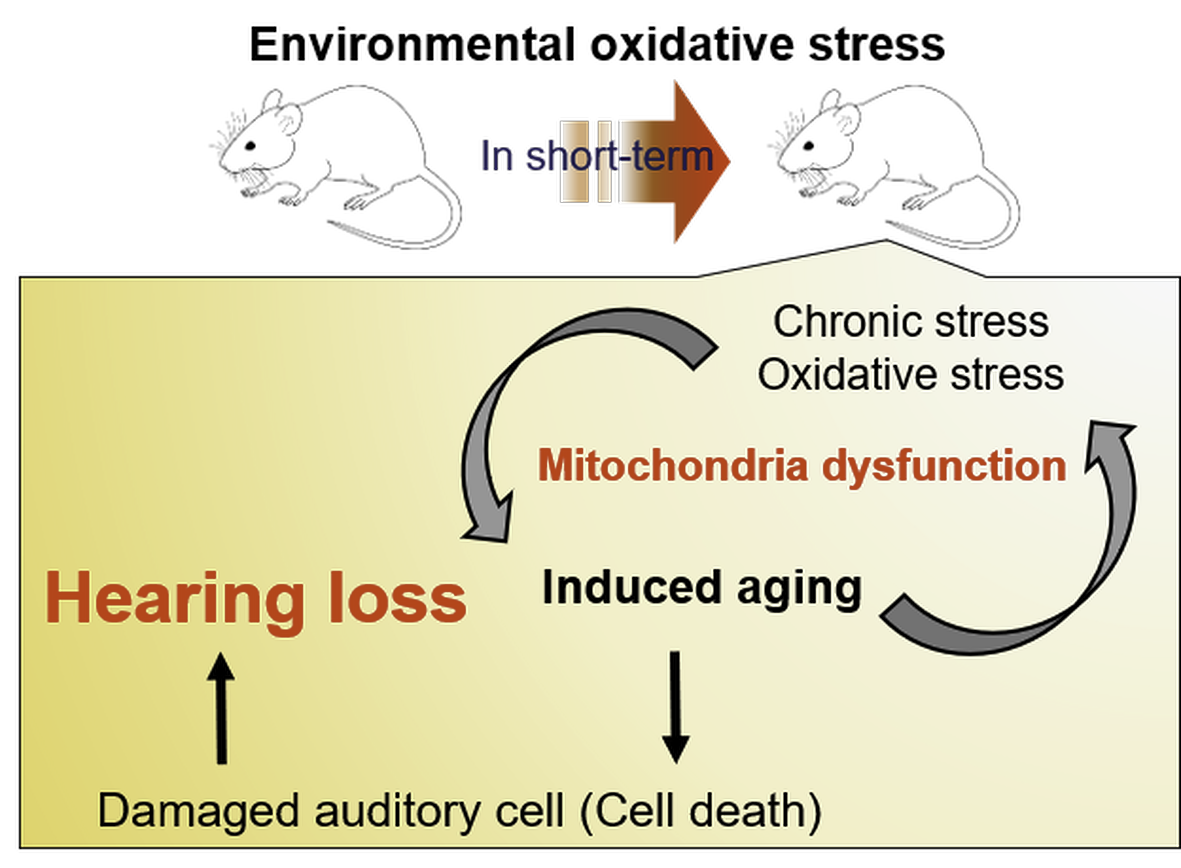
1. Introduction
2. Results
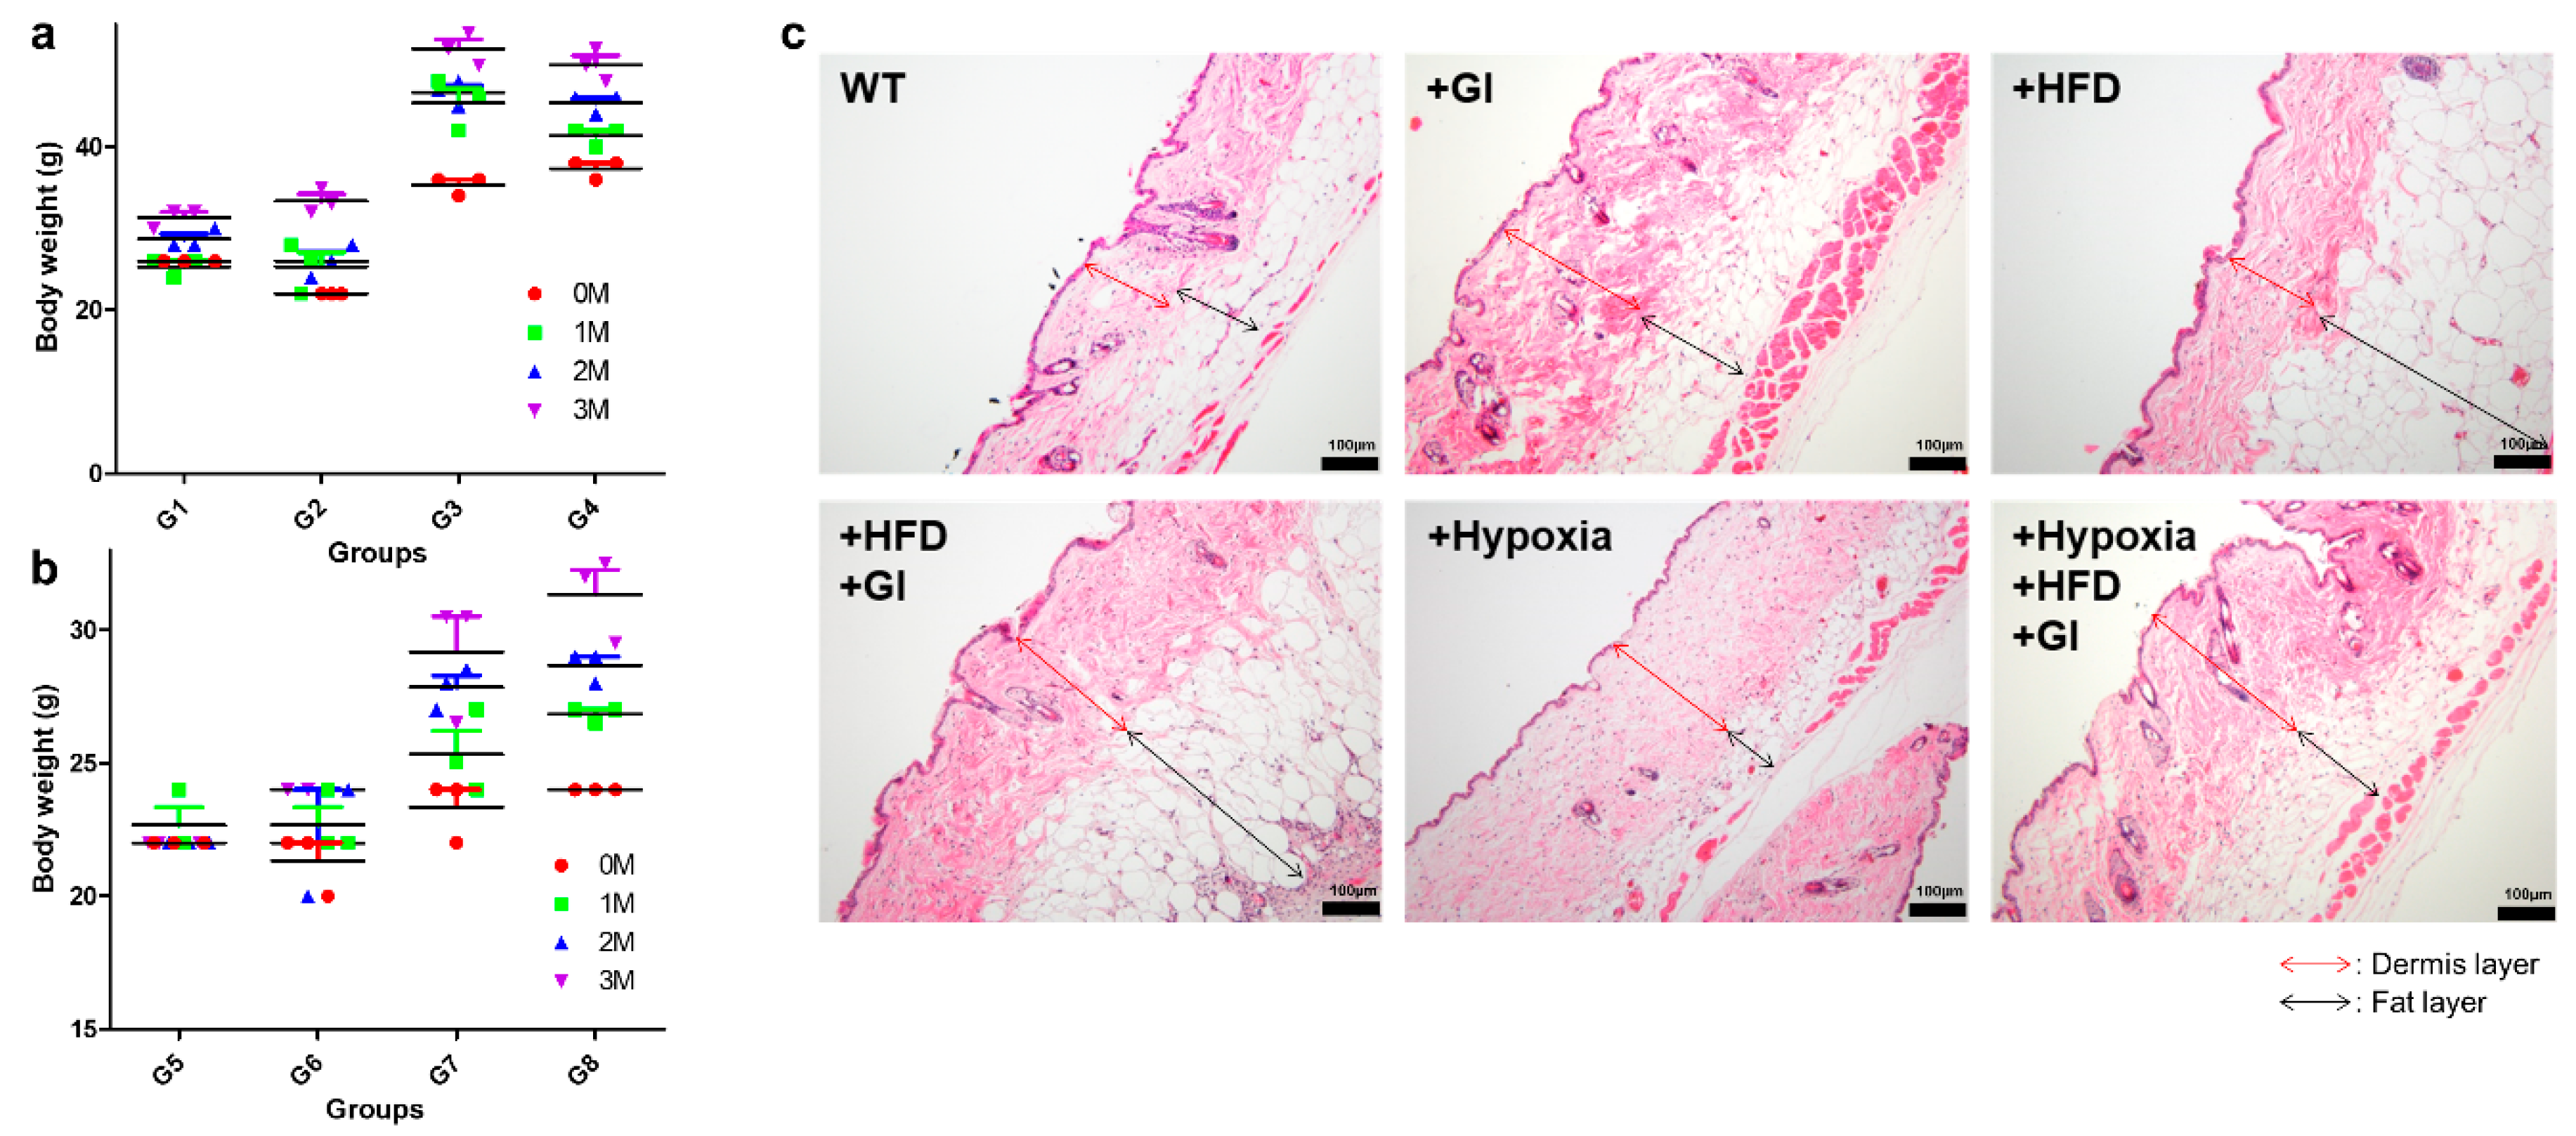
2.1. Phenotypic Analysis of the Different Groups for Ageing
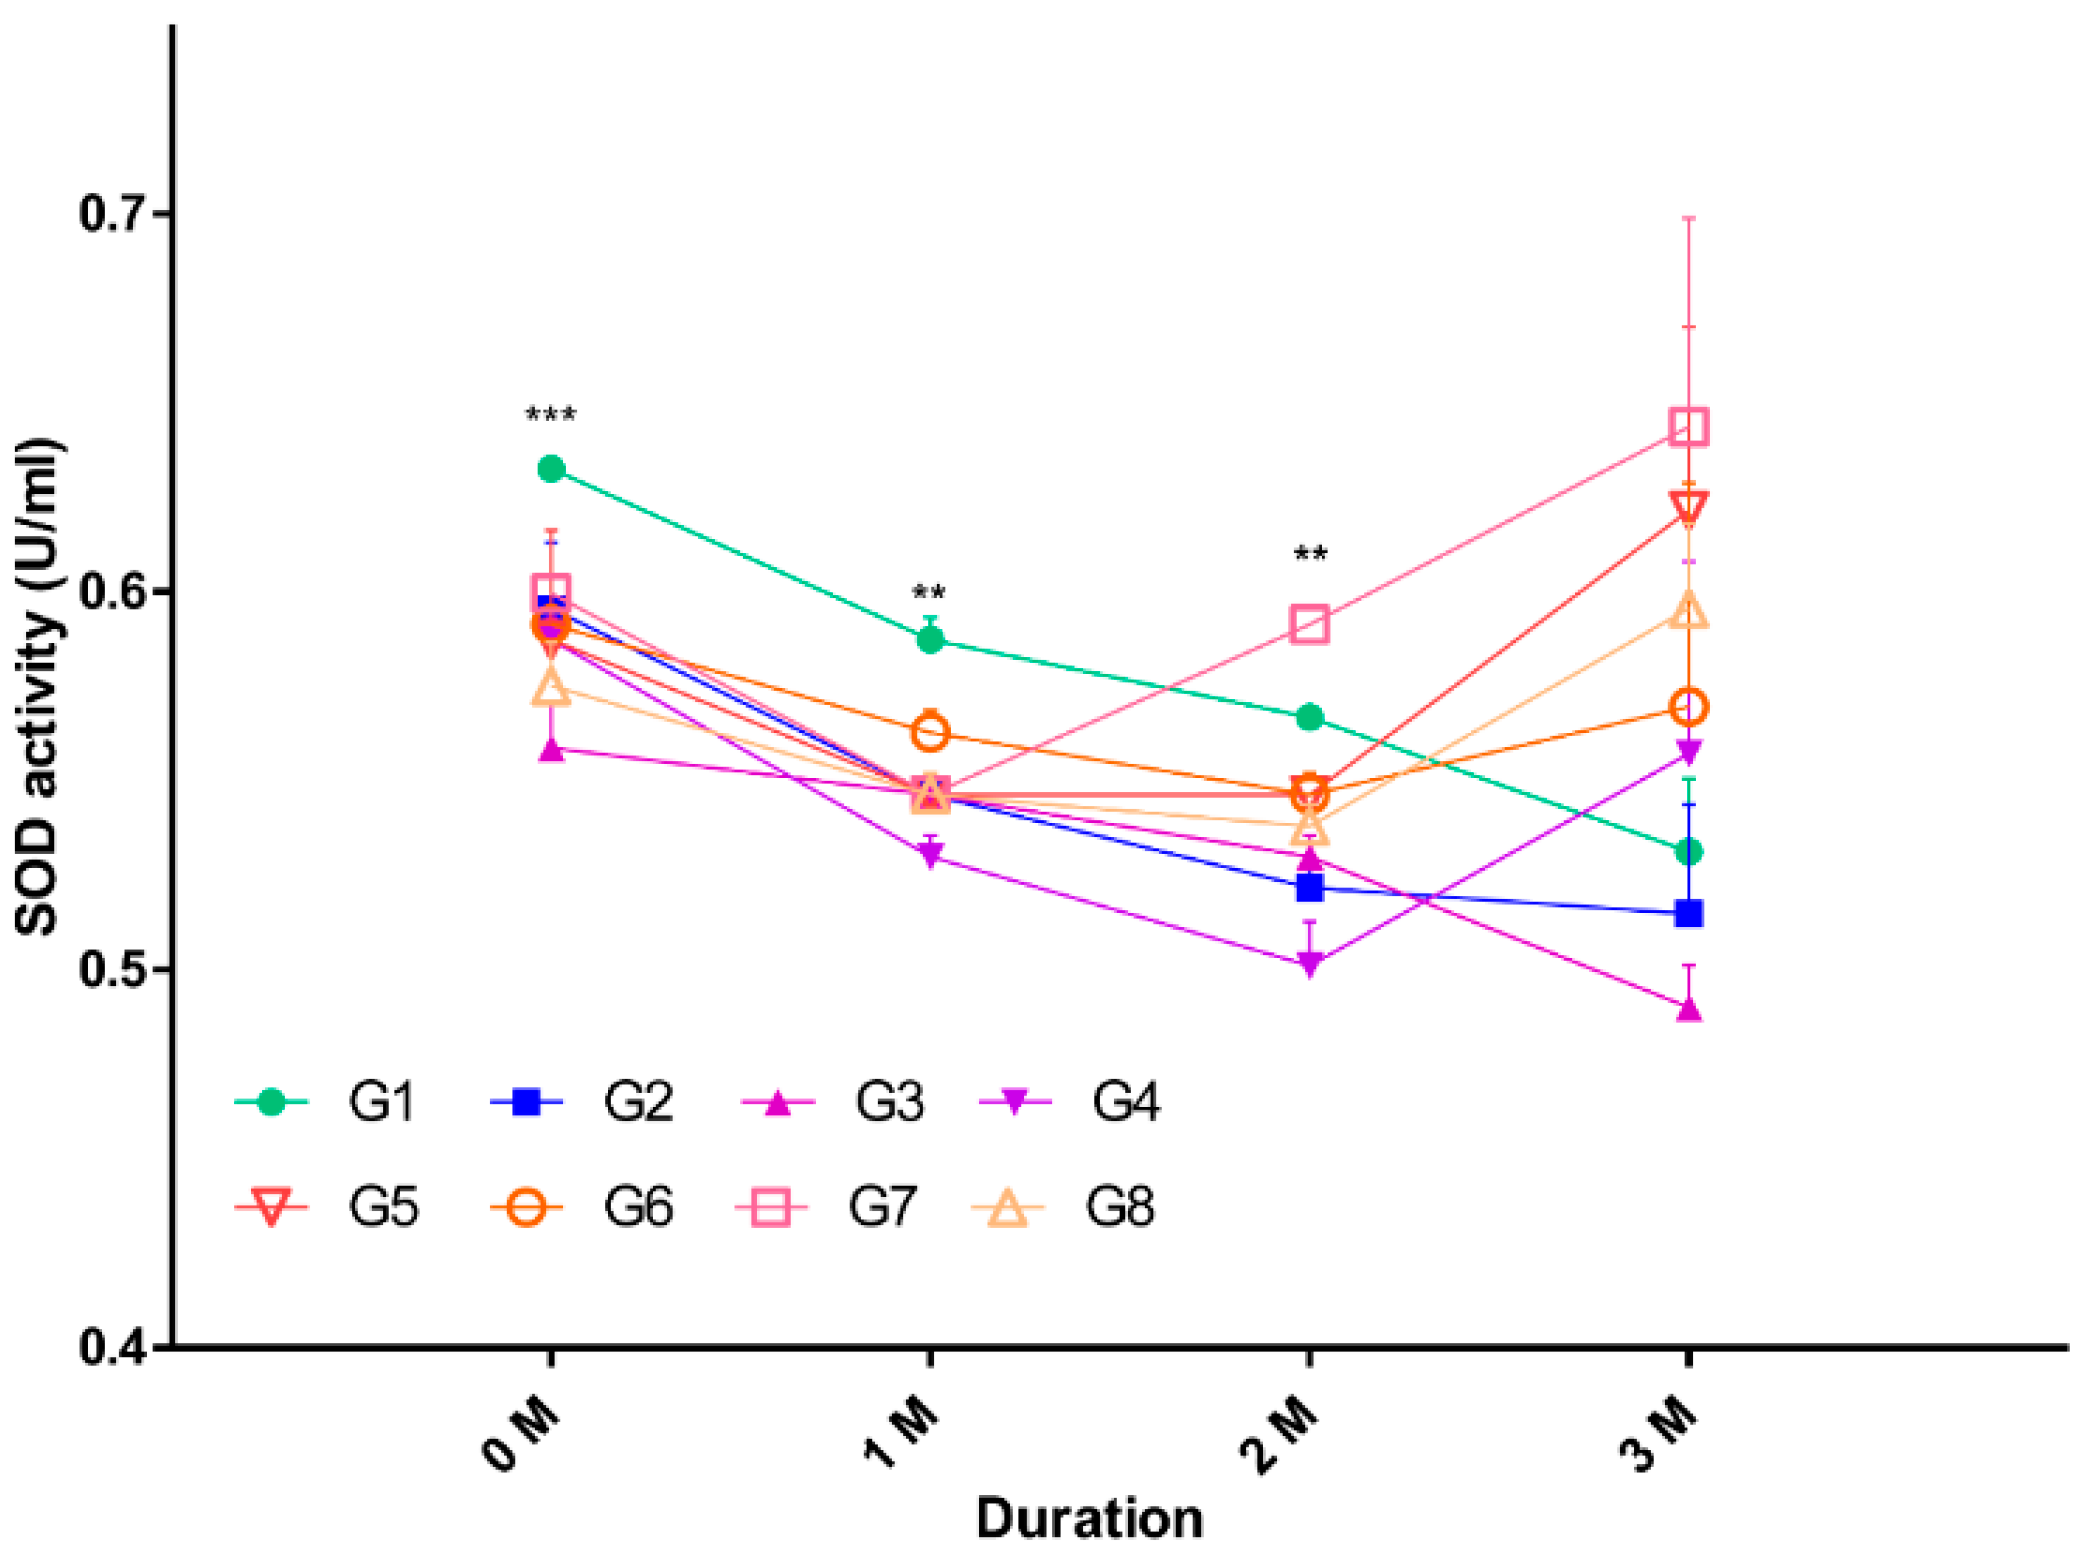
2.2. Oxidative Stress in Serum
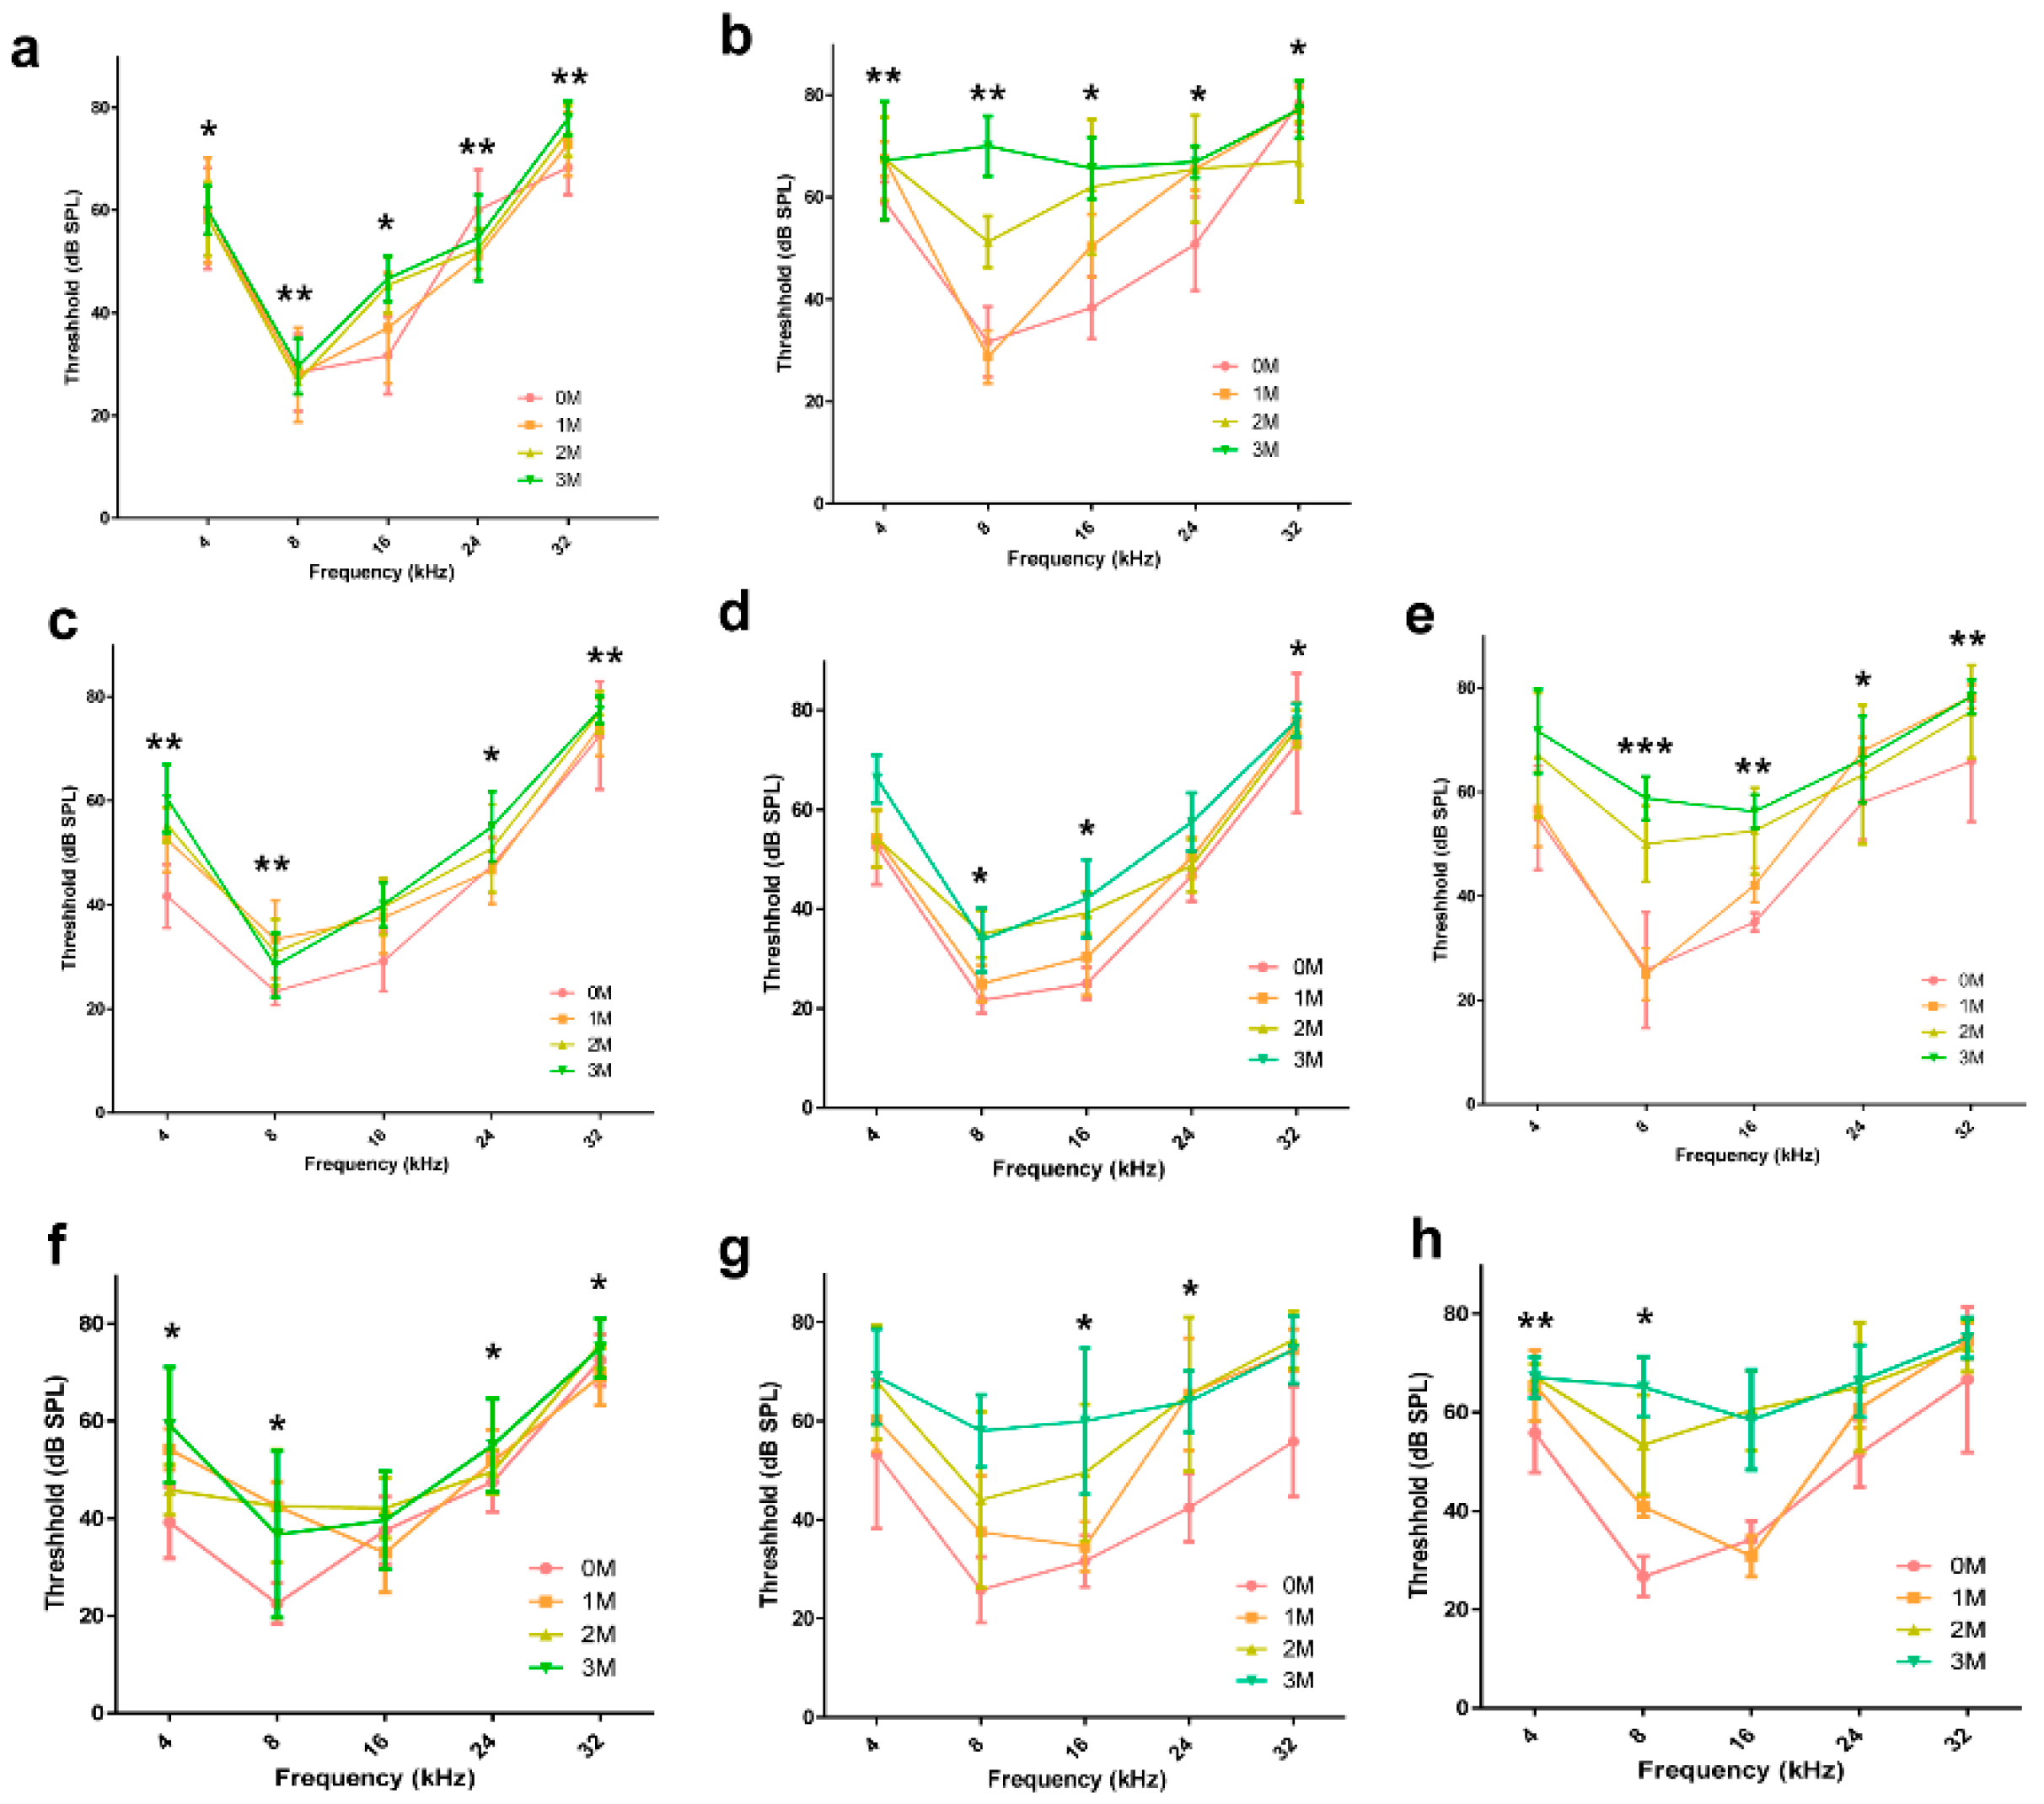
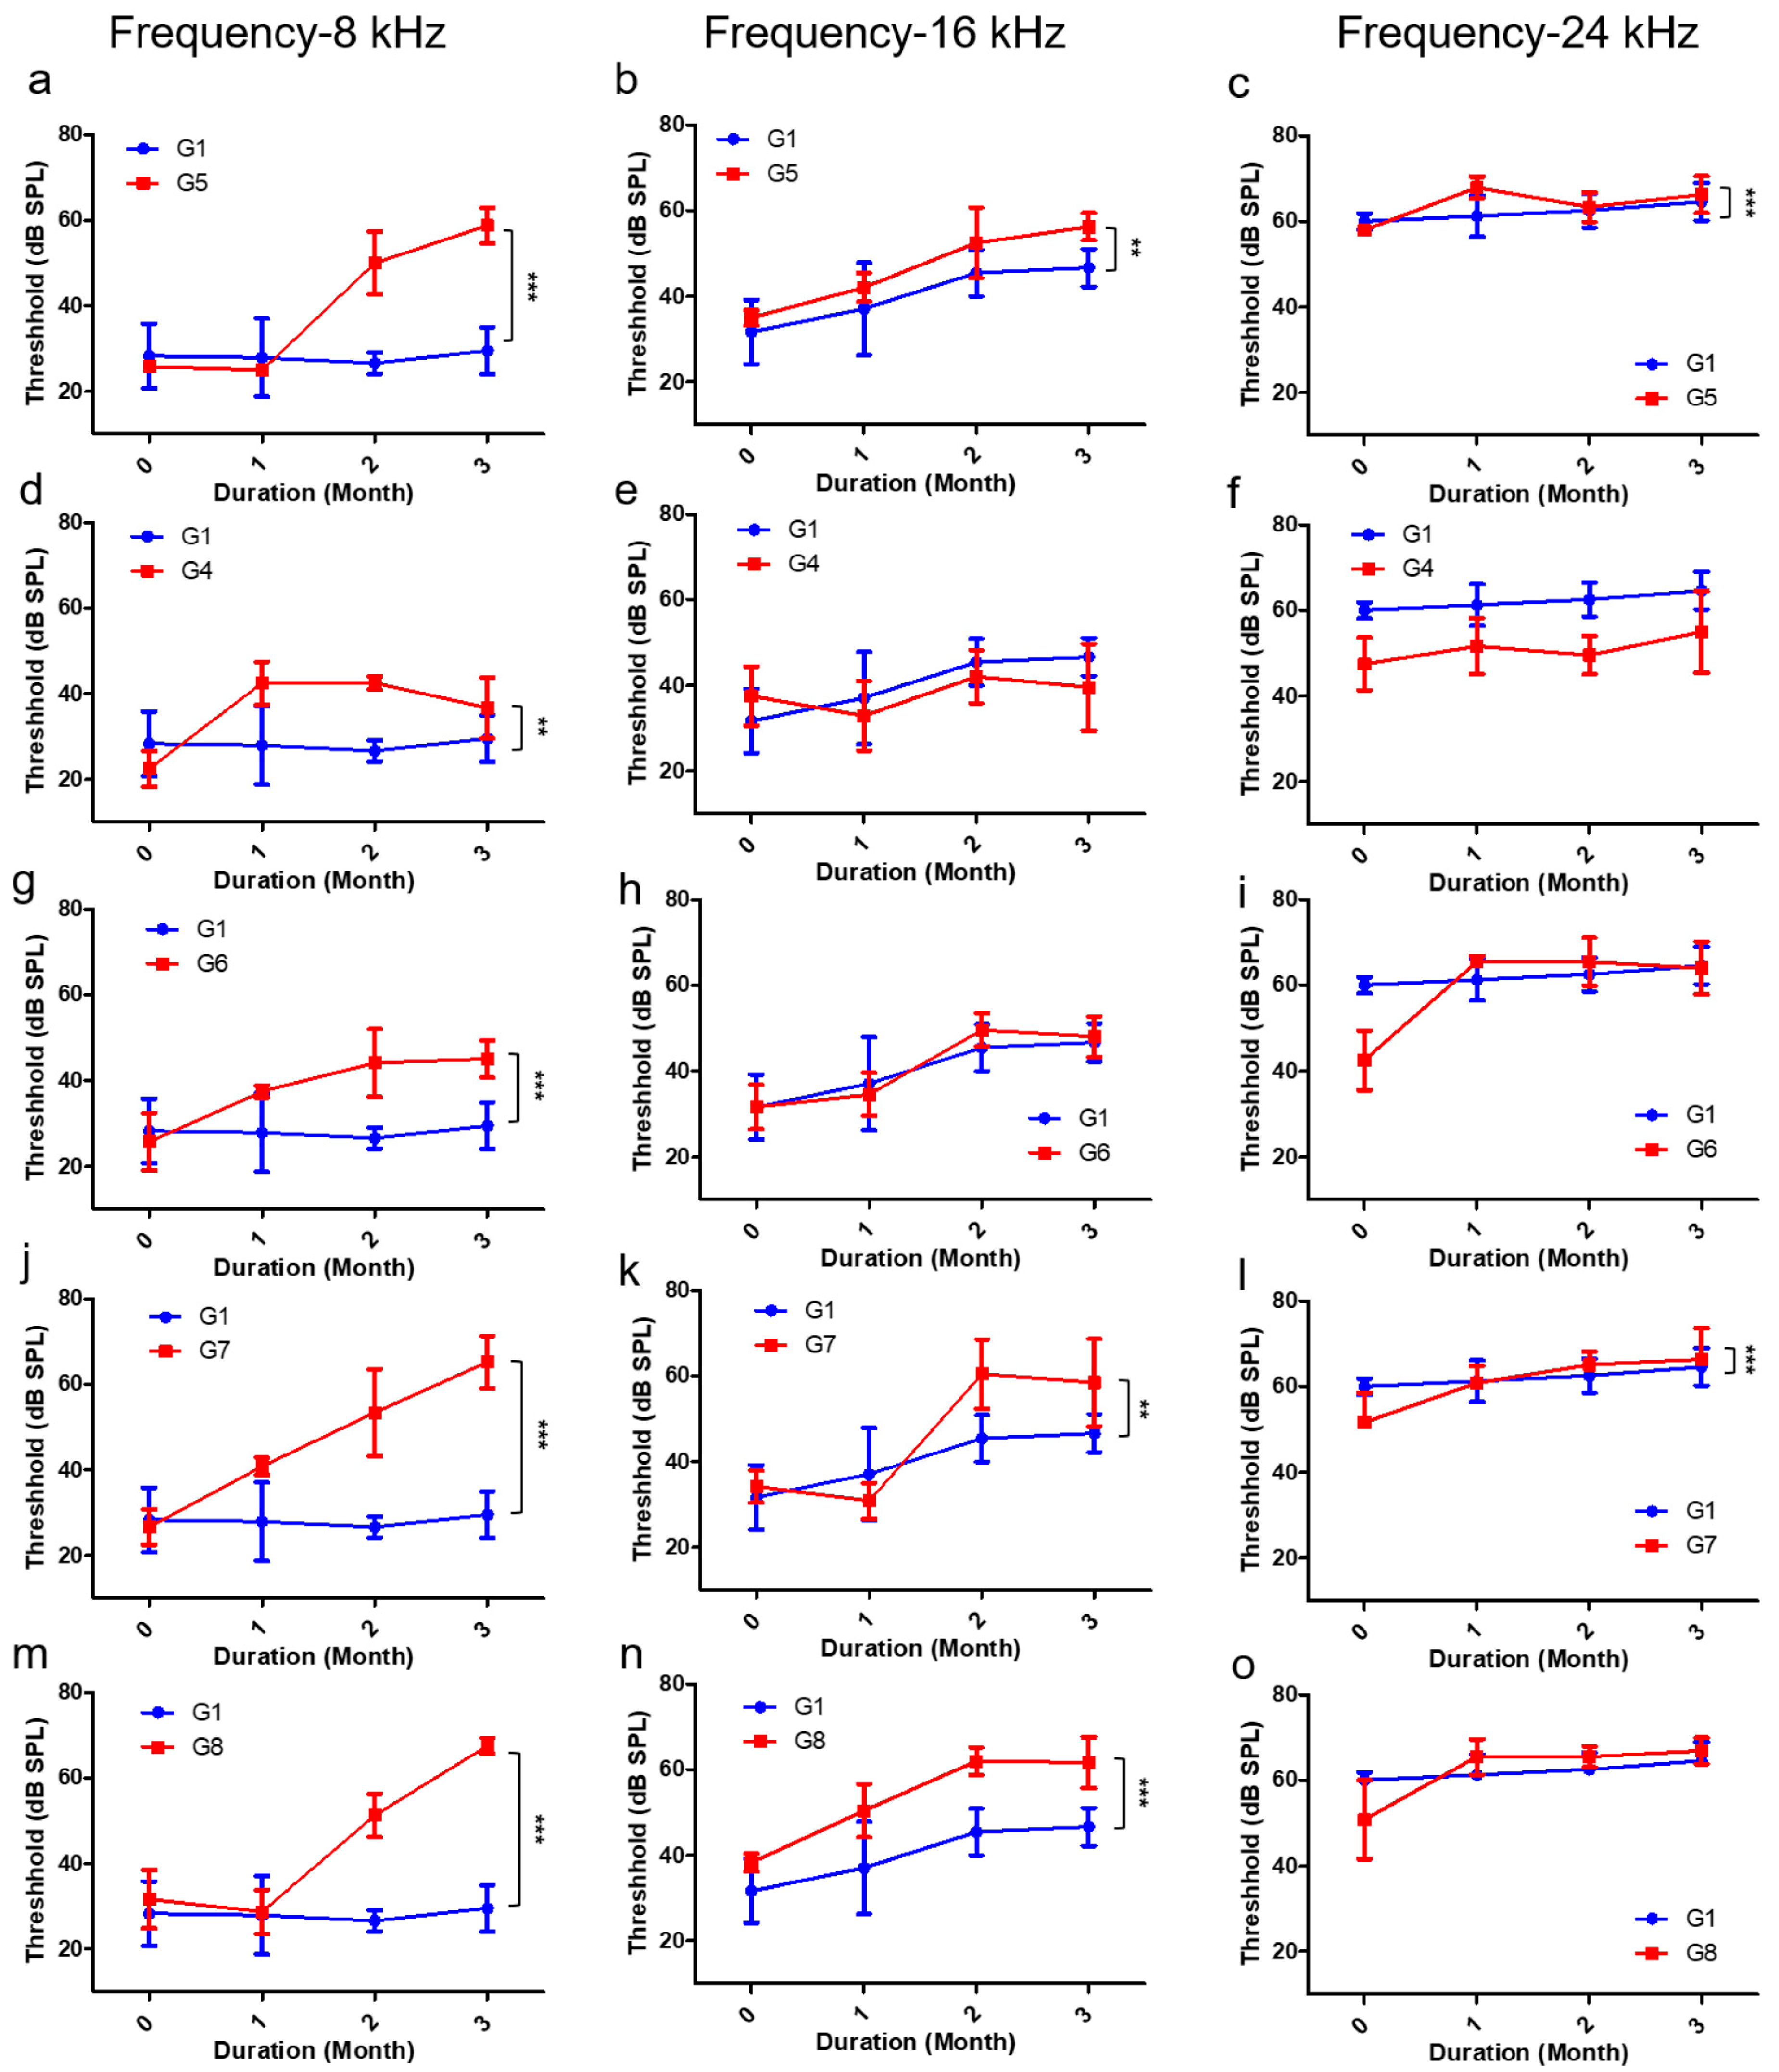
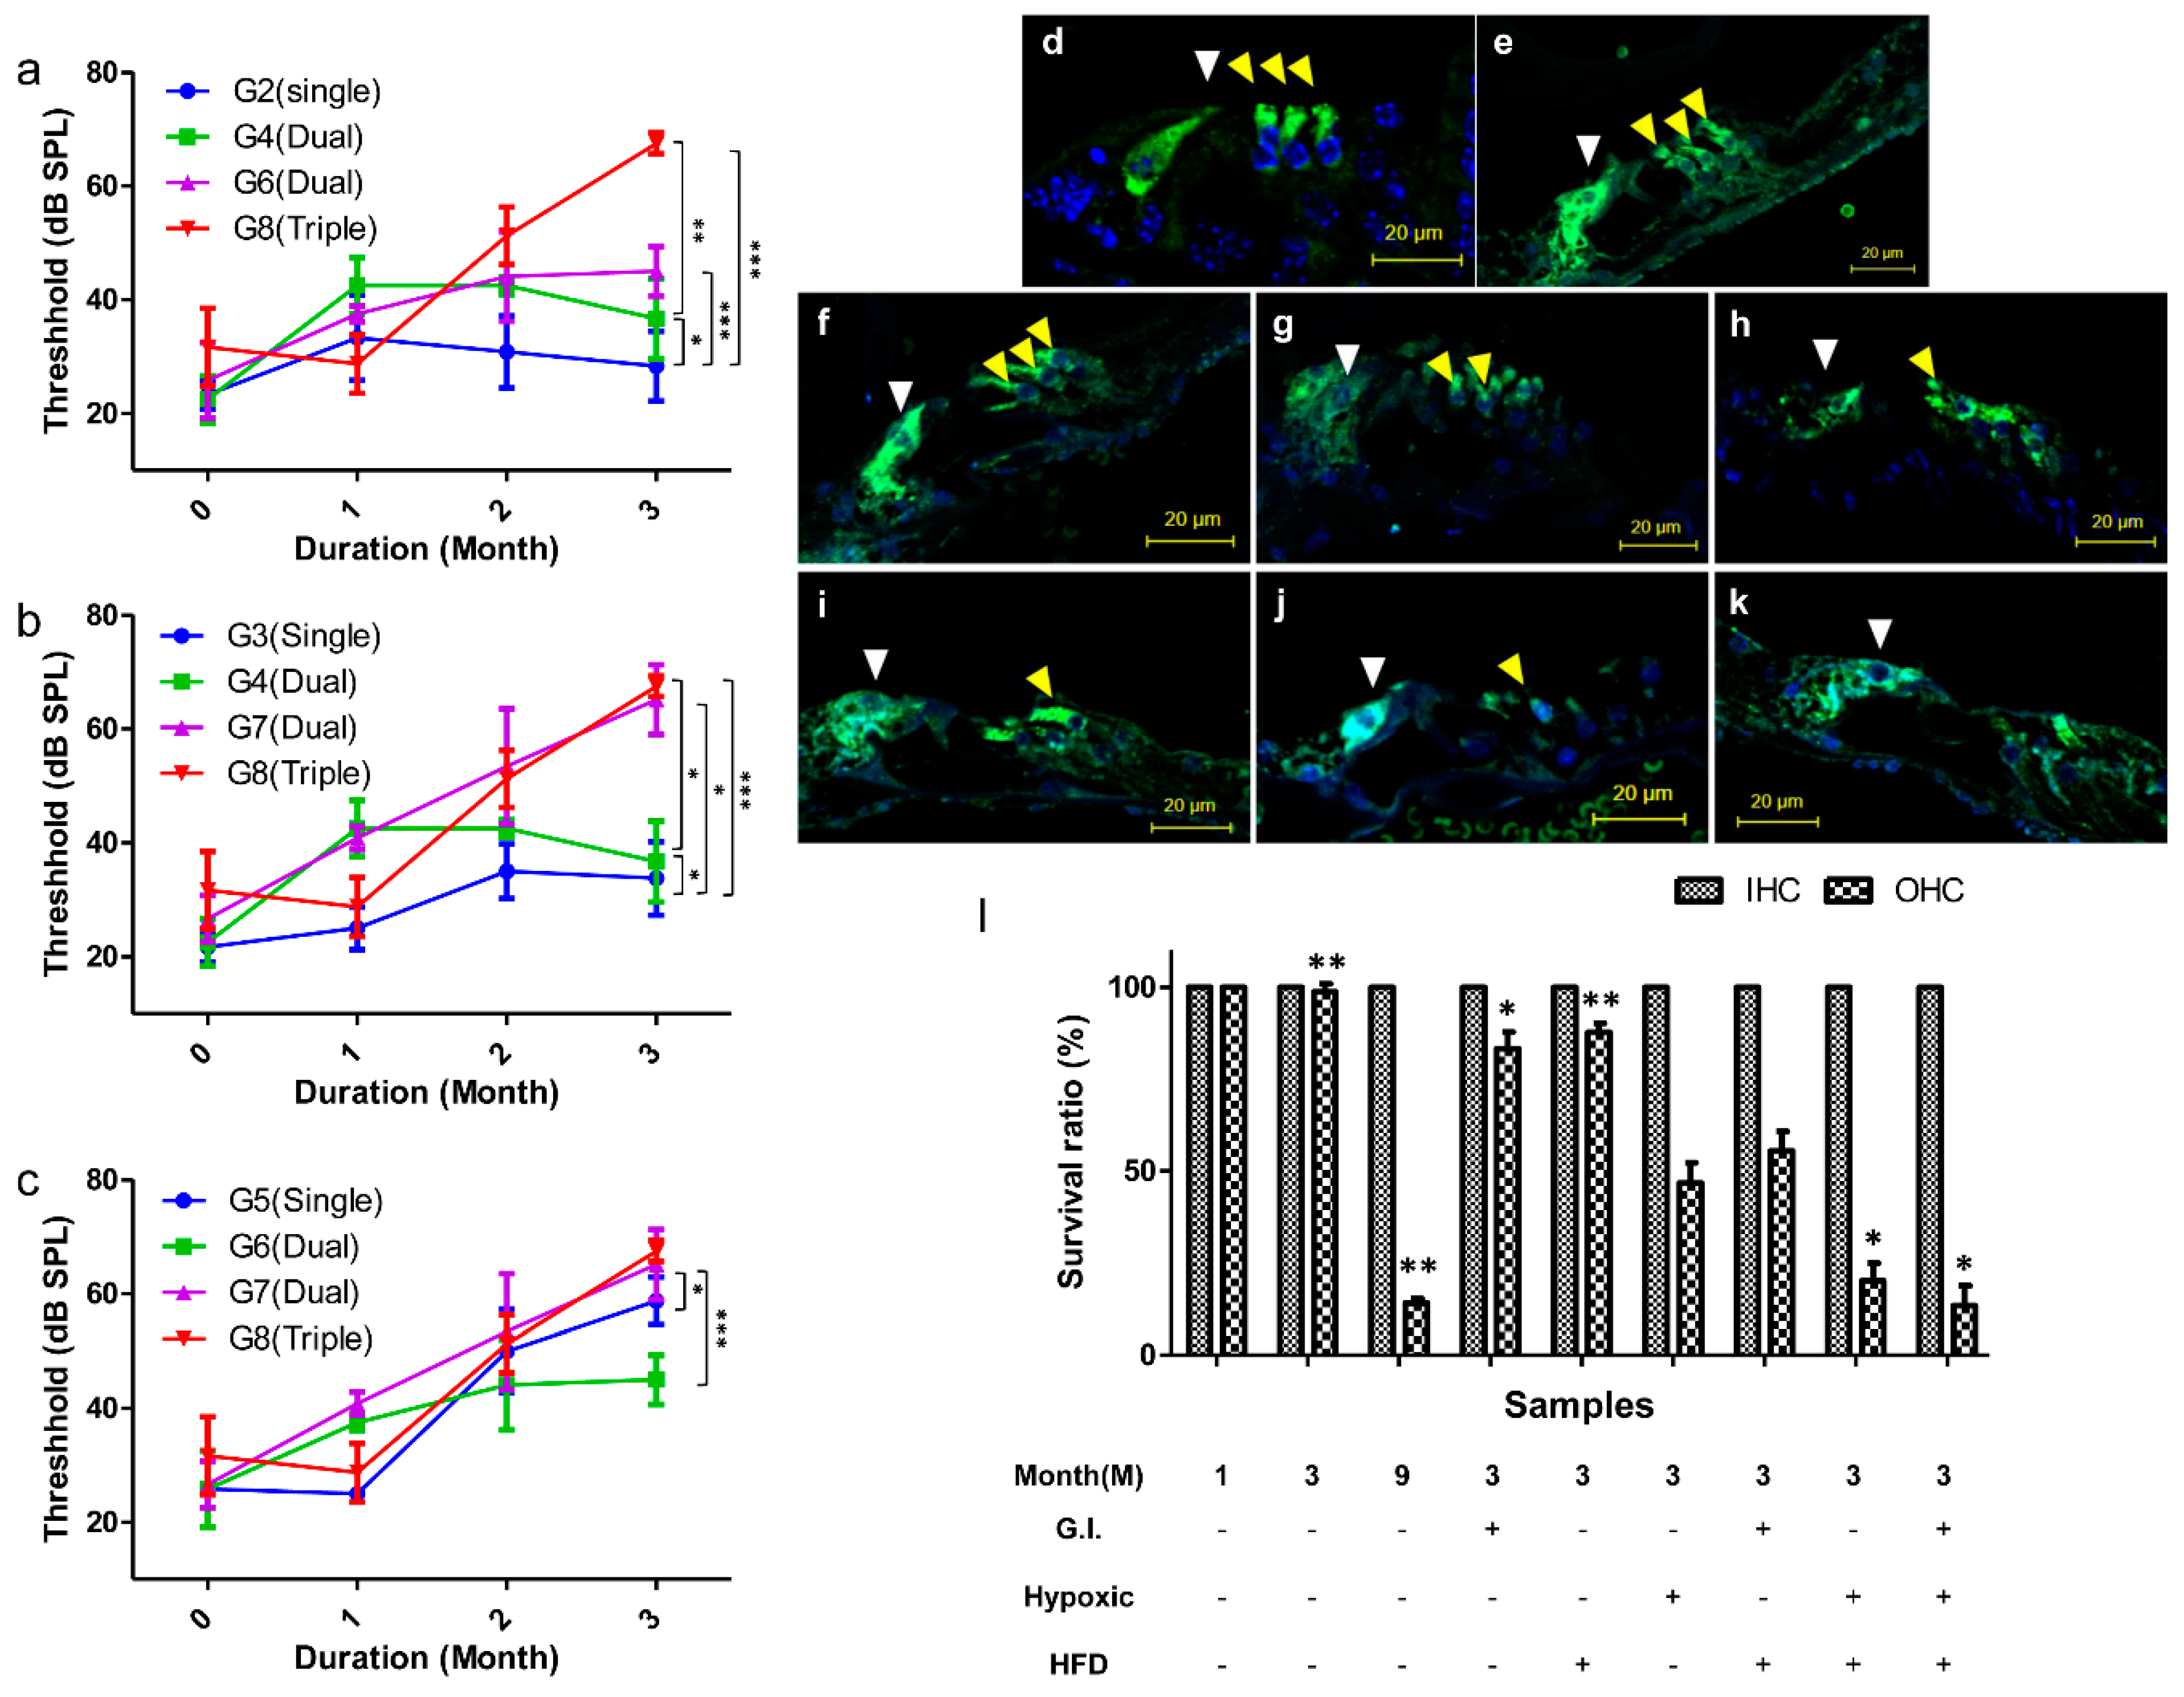
2.3. Comparison of the Hearing Threshold
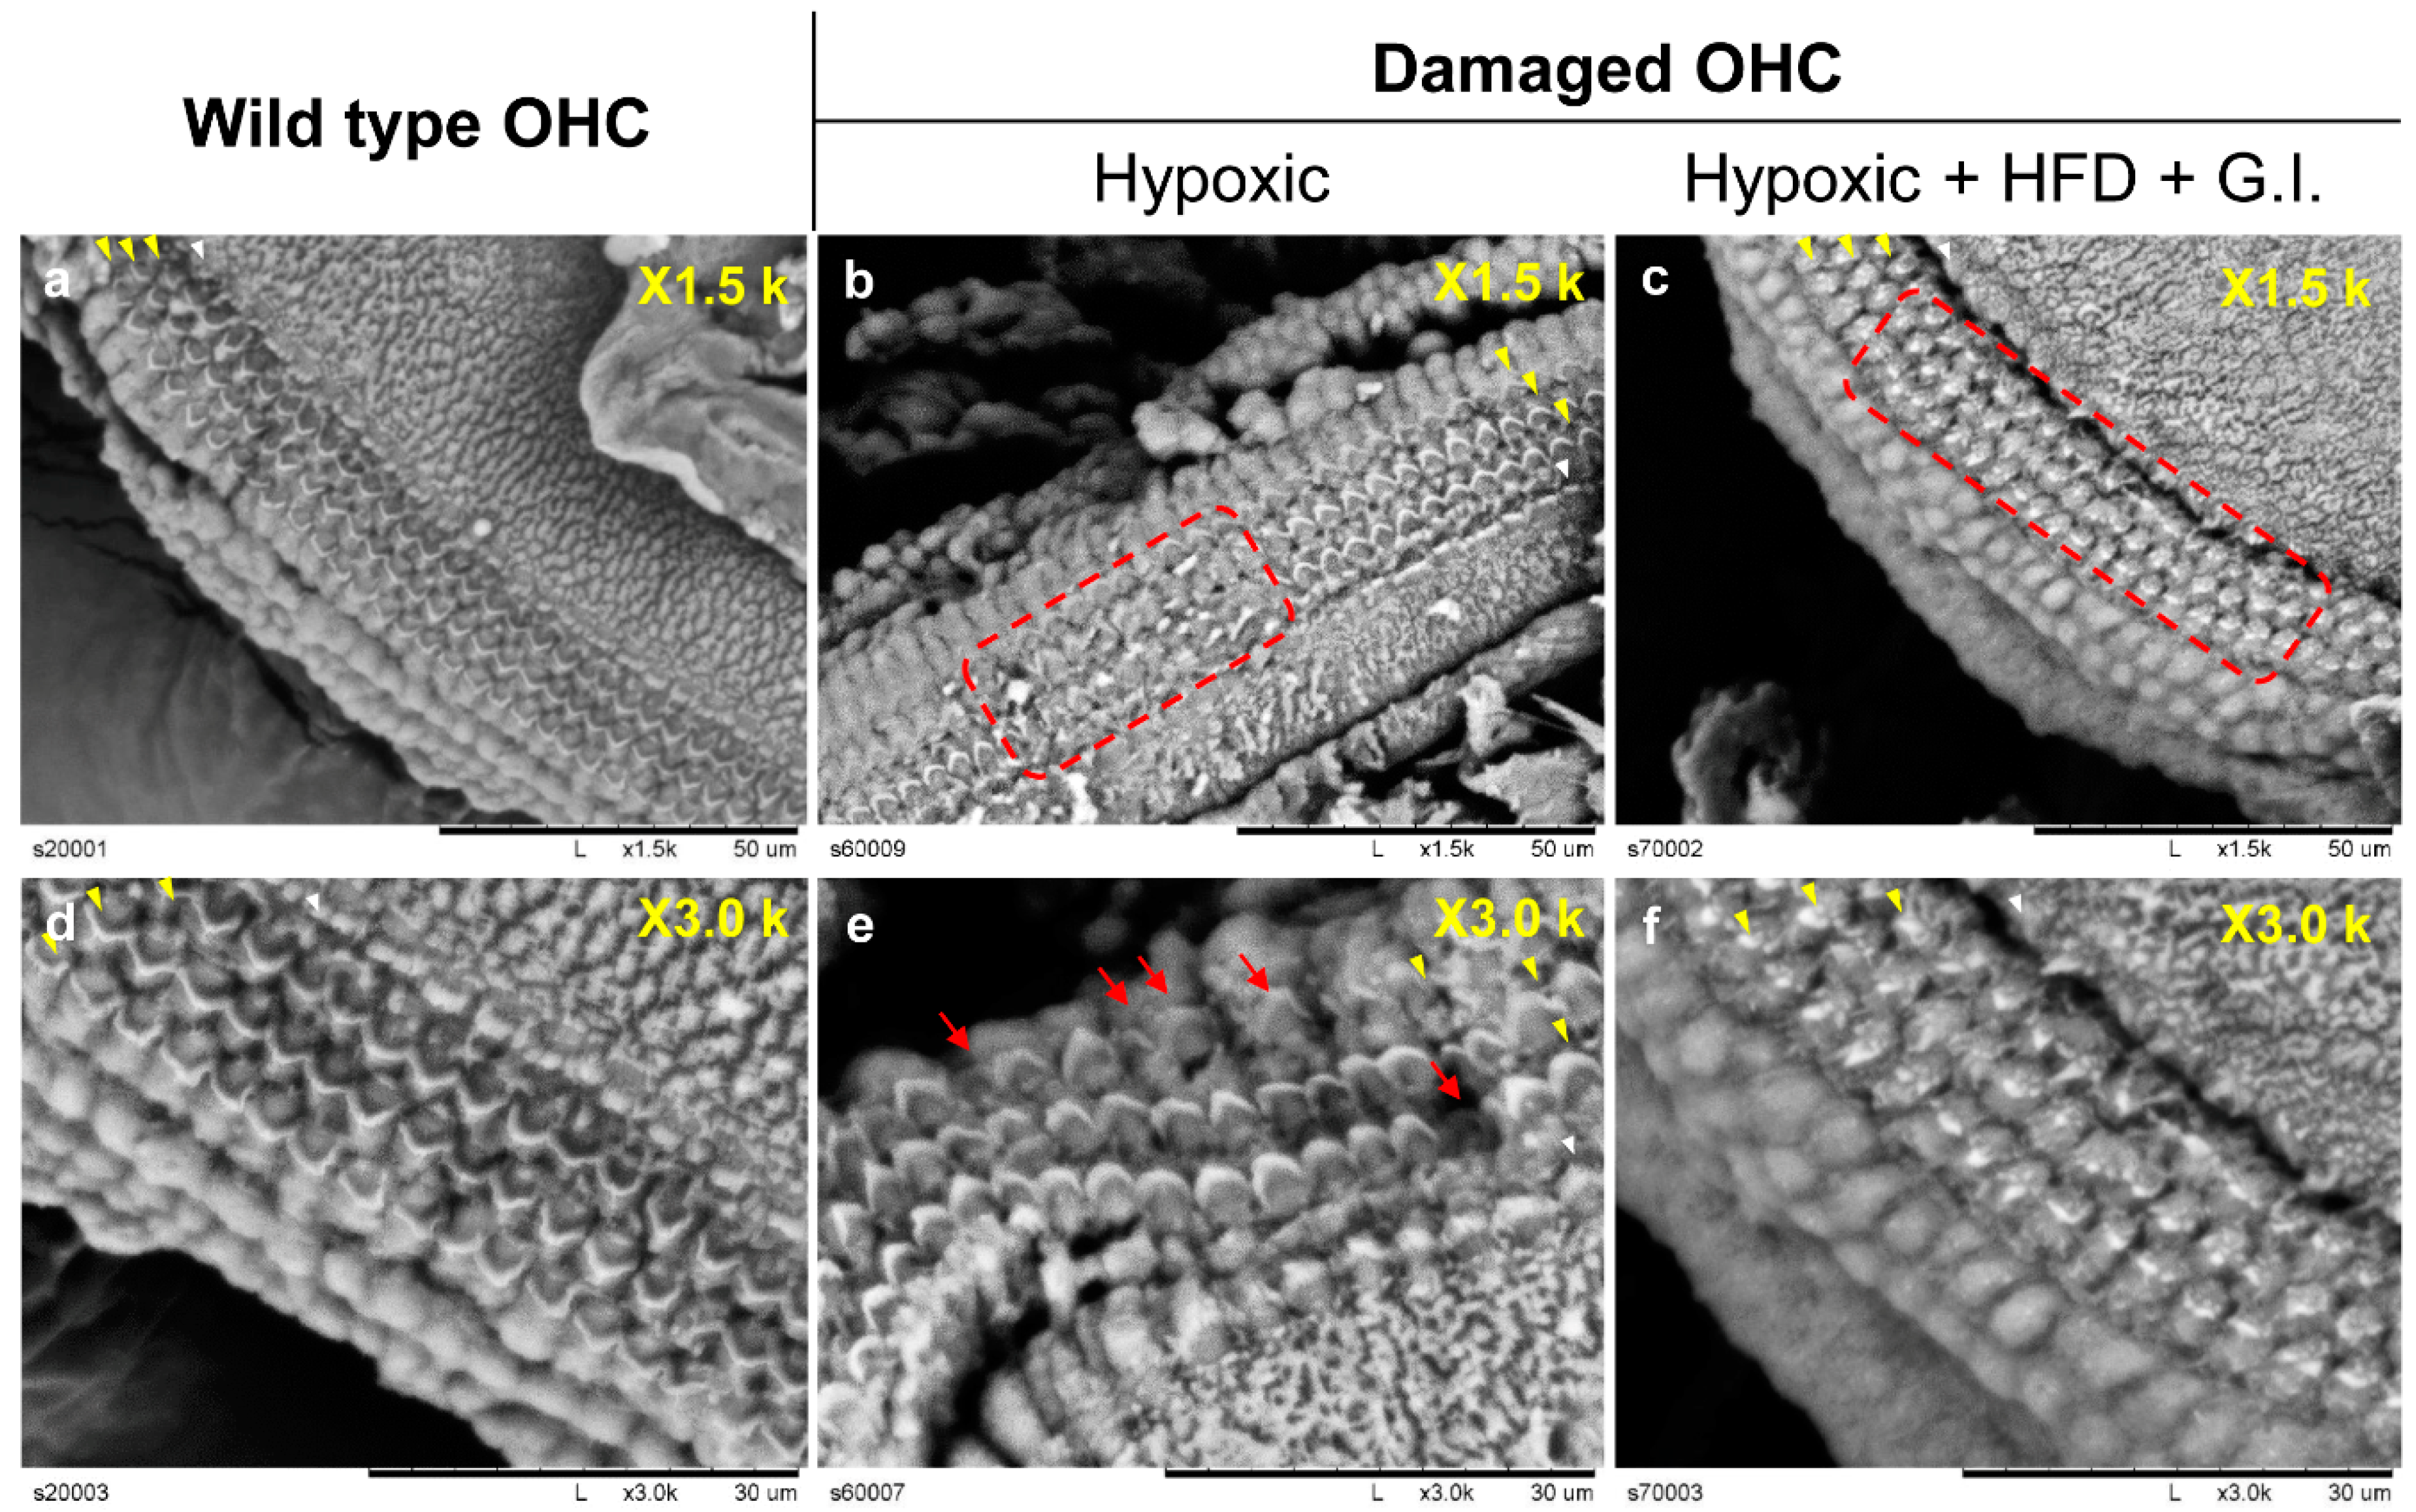
2.4. Histological Observations of Hair Cells
2.5. Expression of Age-Related Factors in Cochlea
3. Discussion
4. Materials and Methods
4.1. Experimental Groups
4.2. Animal Procedures
4.3. Hypoxia Chamber Design
4.4. Auditory Brainstem Response
4.5. Superoxide Dismutase (SOD) Activity Test
4.6. Histological Analysis
4.7. Immunostaining
4.8. Scanning Electron Microscope (SEM)
4.9. Real-Time PCR
4.10. Statistical Analysis
5. Conclusions
Supplementary Materials
Author Contributions
Funding
Conflicts of Interest
Abbreviations
| ABR | Auditory brainstem response |
| ARHL | Age-related hearing loss |
| GI | Galactose injection |
| H&E | Haematoxylin and eosin |
| HFD | High-fat diet |
| IHC | Inner hair cell |
| KHIDI | Korea Health Industry Development Institute |
| NF | Normally fed |
| OC | Organ of Corti |
| OHC | Outer hair cell |
| OSAS | Obstructive sleep apnoea syndrome |
| ROS | Reactive oxidative stress |
| RT | Room temperature |
References
- Bowl, M.R.; Dawson, S.J. The mouse as a model for age-related hearing loss-a mini-review. Gerontology 2015, 61, 149–157. [Google Scholar] [CrossRef] [PubMed]
- Yamasoba, T.; Lin, F.R.; Someya, S.; Kashio, A.; Sakamoto, T.; Kondo, K. Current concepts in age-related hearing loss: Epidemiology and mechanistic pathways. Hear. Res. 2013, 303, 30–38. [Google Scholar] [CrossRef] [PubMed] [Green Version]
- Zelaya, C.E.; Lucas, J.W.; Hoffman, H.J. Self-Reported Hearing Trouble in Adults Aged 18 and Over: United States, 2014; Nchs Data Brief, No 214; National Center for Health Statistics: Hyattsville, MD, USA, 2015.
- Someya, S.; Xu, J.Z.; Kondo, K.; Ding, D.L.; Salvi, R.J.; Yamasoba, T.; Rabinovitch, P.S.; Weindruch, R.; Leeuwenburgh, C.; Tanokura, M.; et al. Age-related hearing loss in c57bl/6j mice is mediated by bak-dependent mitochondrial apoptosis. Proc. Natl. Acad. Sci. USA 2009, 106, 19432–19437. [Google Scholar] [CrossRef] [PubMed] [Green Version]
- Alimardani, M.; Hosseini, S.M.; Khaniani, M.S.; Haghi, M.R.; Eslahi, A.; Farjami, M.; Chezgi, J.; Derakhshan, S.M.; Mojarrad, M. Targeted mutation analysis of the slc26a4, myo6, pjvk and cdh23 genes in iranian patients with ar nonsyndromic hearing loss. Fetal Pediatr. Pathol. 2019, 38, 93–102. [Google Scholar] [CrossRef]
- Seidman, M.D.; Ahmad, N.; Joshi, D.; Seidman, J.; Thawani, S.; Quirk, W.S. Age-related hearing loss and its association with reactive oxygen species and mitochondrial DNA damage. Acta Otolaryngol. Suppl. 2004, 552, 16–24. [Google Scholar] [CrossRef]
- Holme, R.H.; Steel, K.P. Stereocilia defects in waltzer (cdh23), shaker1 (myo7a) and double waltzer/shaker1 mutant mice. Hear. Res. 2002, 169, 13–23. [Google Scholar] [CrossRef]
- Chen, H.; Tang, J. The role of mitochondria in age-related hearing loss. Biogerontology 2014, 15, 13–19. [Google Scholar] [CrossRef]
- Johnson, K.R.; Tian, C.; Gagnon, L.H.; Jiang, H.; Ding, D.; Salvi, R. Effects of cdh23 single nucleotide substitutions on age-related hearing loss in c57bl/6 and 129s1/sv mice and comparisons with congenic strains. Sci. Rep. 2017, 7, 44450. [Google Scholar] [CrossRef] [Green Version]
- White, K.; Kim, M.J.; Han, C.; Park, H.J.; Ding, D.; Boyd, K.; Walker, L.; Linser, P.; Meneses, Z.; Slade, C.; et al. Loss of idh2 accelerates age-related hearing loss in male mice. Sci. Rep. 2018, 8, 5039. [Google Scholar] [CrossRef]
- Ren, H.M.; Ren, J.; Liu, W. Recognition and control of the progression of age-related hearing loss. Rejuvenation Res. 2013, 16, 475–486. [Google Scholar] [CrossRef] [Green Version]
- Liu, X.Z.; Yan, D. Ageing and hearing loss. J. Pathol. 2007, 211, 188–197. [Google Scholar] [CrossRef] [PubMed]
- Kim, S.H.; Yeo, S.G. Presbycusis. Hanyang Med. Rev. 2015, 35, 78–83. [Google Scholar] [CrossRef] [Green Version]
- Hildesheimer, M.; Rubinstein, M.; Nuttal, A.L.; Lawrence, M. Influence of blood viscosity on cochlear action potentials and oxygenation. Hear. Res. 1982, 8, 187–198. [Google Scholar] [CrossRef] [Green Version]
- Nash, S.D.; Cruickshanks, K.J.; Klein, R.; Klein, B.E.; Nieto, F.J.; Huang, G.H.; Pankow, J.S.; Tweed, T.S. The prevalence of hearing impairment and associated risk factors: The Beaver Dam Offspring Study. Arch. Otolaryngol. Head Neck Surg. 2011, 137, 432–439. [Google Scholar] [CrossRef] [PubMed] [Green Version]
- Seo, Y.J.; Park, S.Y.; Chung, H.J.; Kim, C.H.; Lee, J.G.; Kim, S.H.; Cho, H.J. Lowest oxyhemoglobin saturation may be an independent factor influencing auditory function in severe obstructive sleep apnea. J. Clin. Sleep Med. 2016, 12, 653–658. [Google Scholar] [CrossRef] [Green Version]
- Hao, S.; Wang, L.; Zhao, K.; Zhu, X.; Ye, F. rs1894720 polymorphism in miat increased susceptibility to age-related hearing loss by modulating the activation of mir-29b/sirt1/pgc-1alpha signaling. J. Cell. Biochem. 2019, 120, 4975–4986. [Google Scholar] [CrossRef]
- Fujimoto, C.; Yamasoba, T. Oxidative stresses and mitochondrial dysfunction in age-related hearing loss. Oxid. Med. Cell. Longev. 2014, 2014, 582849. [Google Scholar] [CrossRef] [Green Version]
- Fujita, T.; Yamashita, D.; Uehara, N.; Inokuchi, G.; Hasegawa, S.; Otsuki, N.; Nibu, K. A high-fat diet delays age-related hearing loss progression in c57bl/6j mice. PLoS ONE 2015, 10, e0117547. [Google Scholar] [CrossRef] [Green Version]
- Kume, S.; Uzu, T.; Horiike, K.; Chin-Kanasaki, M.; Isshiki, K.; Araki, S.; Sugimoto, T.; Haneda, M.; Kashiwagi, A.; Koya, D. Calorie restriction enhances cell adaptation to hypoxia through sirt1-dependent mitochondrial autophagy in mouse aged kidney. J. Clin. Investig. 2010, 120, 1043–1055. [Google Scholar] [CrossRef] [Green Version]
- Mitchell, P.; Gopinath, B.; McMahon, C.M.; Rochtchina, E.; Wang, J.J.; Boyages, S.C.; Leeder, S.R. Relationship of type 2 diabetes to the prevalence, incidence and progression of age-related hearing loss. Diabet. Med. 2009, 26, 483–488. [Google Scholar] [CrossRef]
- Guo, B.; Guo, Q.; Wang, Z.; Shao, J.B.; Liu, K.; Du, Z.D.; Gong, S.S. D-galactose-induced oxidative stress and mitochondrial dysfunction in the cochlear basilar membrane: An in vitro aging model. Biogerontology 2020, 21, 311–323. [Google Scholar] [CrossRef] [PubMed] [Green Version]
- Ho, S.C.; Liu, J.H.; Wu, R.Y. Establishment of the mimetic aging effect in mice caused by d-galactose. Biogerontology 2003, 4, 15–18. [Google Scholar] [CrossRef] [PubMed]
- Liao, C.H.; Chen, B.H.; Chiang, H.S.; Chen, C.W.; Chen, M.F.; Ke, C.C.; Wang, Y.Y.; Lin, W.N.; Wang, C.C.; Lin, Y.H. Optimizing a male reproductive aging mouse model by d-galactose injection. Int. J. Mol. Sci. 2016, 17, 98. [Google Scholar] [CrossRef] [PubMed] [Green Version]
- Parameshwaran, K.; Irwin, M.H.; Steliou, K.; Pinkert, C.A. D-galactose effectiveness in modeling aging and therapeutic antioxidant treatment in mice. Rejuvenation Res. 2010, 13, 729–735. [Google Scholar] [CrossRef]
- Alameda, J.P.; Ramirez, A.; Garcia-Fernandez, R.A.; Navarro, M.; Page, A.; Segovia, J.C.; Sanchez, R.; Suarez-Cabrera, C.; Paramio, J.M.; Bravo, A.; et al. Premature aging and cancer development in transgenic mice lacking functional cyld. Aging 2019, 11, 127–159. [Google Scholar] [CrossRef]
- Bourguignon, L.Y.; Wong, G.; Xia, W.; Man, M.Q.; Holleran, W.M.; Elias, P.M. Selective matrix (hyaluronan) interaction with cd44 and rhogtpase signaling promotes keratinocyte functions and overcomes age-related epidermal dysfunction. J. Dermatol. Sci. 2013, 72, 32–44. [Google Scholar] [CrossRef] [Green Version]
- Orioli, D.; Dellambra, E. Epigenetic regulation of skin cells in natural aging and premature aging diseases. Cells 2018, 7, 268. [Google Scholar] [CrossRef] [Green Version]
- Raynor, L.A.; Pankow, J.S.; Miller, M.B.; Huang, G.H.; Dalton, D.; Klein, R.; Klein, B.E.; Cruickshanks, K.J. Familial aggregation of age-related hearing loss in an epidemiological study of older adults. Am. J. Audiol. 2009, 18, 114–118. [Google Scholar] [CrossRef] [Green Version]
- Guo, Y.; Zhang, C.; Du, X.; Nair, U.; Yoo, T.J. Morphological and functional alterations of the cochlea in apolipoprotein e gene deficient mice. Hear. Res. 2005, 208, 54–67. [Google Scholar] [CrossRef]
- Kim, Y.Y.; Chao, J.R.; Kim, C.; Kim, B.; Nguyen, P.T.T.; Jung, H.; Chang, J.; Lee, J.H.; Suh, J.G. Hearing loss through apoptosis of the spiral ganglion neurons in apolipoprotein e knockout mice fed with a western diet. Biochem. Biophys. Res. Commun. 2020, 523, 692–698. [Google Scholar] [CrossRef]
- Kurniawan, C.; Westendorp, R.G.; de Craen, A.J.; Gussekloo, J.; de Laat, J.; van Exel, E. Gene dose of apolipoprotein e and age-related hearing loss. Neurobiol. Aging 2012, 33, 2230.e7–2230.e12. [Google Scholar] [CrossRef] [PubMed]
- Bondurand, N.; Dufour, S.; Pingault, V. News from the endothelin-3/ednrb signaling pathway: Role during enteric nervous system development and involvement in neural crest-associated disorders. Dev. Biol. 2018, 444 (Suppl. S1), S156–S169. [Google Scholar] [CrossRef] [PubMed]
- Uchida, Y.; Sugiura, S.; Nakashima, T.; Ando, F.; Shimokata, H. Endothelin-1 gene polymorphism and hearing impairment in elderly japanese. Laryngoscope 2009, 119, 938–943. [Google Scholar] [CrossRef]
- Usami, S.I.; Nishio, S.Y.; Moteki, H.; Miyagawa, M.; Yoshimura, H. Cochlear implantation from the perspective of genetic background. Anat. Rec. 2020, 303, 563–593. [Google Scholar] [CrossRef] [PubMed] [Green Version]
- Park, H.J.; Shaukat, S.; Liu, X.Z.; Hahn, S.H.; Naz, S.; Ghosh, M.; Kim, H.N.; Moon, S.K.; Abe, S.; Tukamoto, K.; et al. Origins and frequencies of slc26a4 (pds) mutations in east and south asians: Global implications for the epidemiology of deafness. J. Med. Genet. 2003, 40, 242–248. [Google Scholar] [CrossRef] [PubMed] [Green Version]
- Muller, U.; Barr-Gillespie, P.G. New treatment options for hearing loss. Nat. Rev. Drug Discov. 2015, 14, 346–365. [Google Scholar] [CrossRef]
- Wang, J.; Puel, J.L. Presbycusis: An update on cochlear mechanisms and therapies. J. Clin. Med. 2020, 9, 218. [Google Scholar] [CrossRef] [Green Version]
- Bouzid, A.; Smeti, I.; Chakroun, A.; Loukil, S.; Gibriel, A.A.; Grati, M.; Ghorbel, A.; Masmoudi, S. Cdh23 methylation status and presbycusis risk in elderly women. Front. Aging Neurosci. 2018, 10, 241. [Google Scholar] [CrossRef] [Green Version]
- Reeves, P.G.; Nielsen, F.H.; Fahey, G.C., Jr. Ain-93 purified diets for laboratory rodents: Final report of the american institute of nutrition ad hoc writing committee on the reformulation of the ain-76a rodent diet. J. Nutr. 1993, 123, 1939–1951. [Google Scholar] [CrossRef]
- Seo, Y.J.; Ju, H.M.; Lee, S.H.; Kwak, S.H.; Kang, M.J.; Yoon, J.H.; Kim, C.H.; Cho, H.J. Damage of inner ear sensory hair cells via mitochondrial loss in a murine model of sleep apnea with chronic intermittent hypoxia. Sleep 2017, 40, zsx106. [Google Scholar] [CrossRef]
- Ju, H.M.; Lee, S.H.; Choi, J.S.; Seo, Y.J. A simple model for inducing optimal increase of sdf-1 with aminoglycoside ototoxicity. Biomed. Res. Int. 2017, 2017, 4630241. [Google Scholar] [CrossRef] [PubMed]
- Chatuphonprasert, W.; Lao-Ong, T.; Jarukamjorn, K. Improvement of superoxide dismutase and catalase in streptozotocin-nicotinamide-induced type 2-diabetes in mice by berberine and glibenclamide. Pharm. Biol. 2013, 52, 419–427. [Google Scholar] [CrossRef] [PubMed]
- Kim, Y.Y.; Nam, H.; Jung, H.; Kim, B.; Suh, J.G. Over-expression of myosin7a in cochlear hair cells of circling mice. Lab. Anim. Res. 2017, 33, 1–7. [Google Scholar] [CrossRef] [PubMed] [Green Version]
- Riva, C.; Donadieu, E.; Magnan, J.; Lavieille, J.P. Age-related hearing loss in cd/1 mice is associated to ros formation and hif target proteins up-regulation in the cochlea. Exp. Gerontol. 2007, 42, 327–336. [Google Scholar] [CrossRef] [PubMed]
- Potter, P.K.; Bowl, M.R.; Jeyarajan, P.; Wisby, L.; Blease, A.; Goldsworthy, M.E.; Simon, M.M.; Greenaway, S.; Michel, V.; Barnard, A.; et al. Novel gene function revealed by mouse mutagenesis screens for models of age-related disease. Nat. Commun. 2016, 7, 12444. [Google Scholar] [CrossRef] [PubMed]


| Groups | 0 Month | 1 Month | 2 Months | 3 Months |
|---|---|---|---|---|
| 1 | 0.6325 ± 0.000 | 0.5873 ± 0.005 | 0.5667 ± 0.000 | 0.5311 ± 0.019 |
| 2 | 0.5955 ± 0.017 | 0.5463 ± 0.005 | 0.5216 ± 0.005 | 0.5148 ± 0.028 |
| 3 | 0.5586 ± 0.011 | 0.5463 ± 0.005 | 0.5298 ± 0.005 | 0.4901 ± 0.011 |
| 4 | 0.5873 ± 0.005 | 0.5298 ± 0.005 | 0.5011 ± 0.011 | 0.5572 ± 0.050 |
| 5 | 0.5873 ± 0.029 | 0.5463 ± 0.005 | 0.5463 ± 0.005 | 0.6215 ± 0.048 |
| 6 | 0.5914 ± 0.000 | 0.5627 ± 0.005 | 0.5463 ± 0.005 | 0.5695 ± 0.059 |
| 7 | 0.5996 ± 0.000 | 0.5463 ± 0.005 | 0.5914 ± 0.000 | 0.6435 ± 0.055 |
| 8 | 0.5750 ± 0.011 | 0.5463 ± 0.005 | 0.5380 ± 0.005 | 0.5955 ± 0.022 |
| Merged Condition | Effect of a Single Factor | |||||
|---|---|---|---|---|---|---|
| Triple | Dual | Single | Hypoxia | HFD | GI | |
| Phenotype | ||||||
| Body weight | +++ | ++ | + | ++ | +++ | + |
| Skin thickness | +++ | ++ | + | ++ | +++ | + |
| Hair cell loss | +++ | ++ | + | +++ | ++ | + |
| Oxidative stress | +++ | ++ | + | +++ | ++ | + |
| Hearing loss | +++ | ++ | + | +++ | ++ | + |
| Age-related gene expression | +++ | ++ | + | +++ | ++ | + |
© 2020 by the authors. Licensee MDPI, Basel, Switzerland. This article is an open access article distributed under the terms and conditions of the Creative Commons Attribution (CC BY) license (http://creativecommons.org/licenses/by/4.0/).
Share and Cite
Park, D.J.; Ha, S.; Choi, J.S.; Lee, S.H.; Park, J.-E.; Seo, Y.J. Induced Short-Term Hearing Loss due to Stimulation of Age-Related Factors by Intermittent Hypoxia, High-Fat Diet, and Galactose Injection. Int. J. Mol. Sci. 2020, 21, 7068. https://doi.org/10.3390/ijms21197068
Park DJ, Ha S, Choi JS, Lee SH, Park J-E, Seo YJ. Induced Short-Term Hearing Loss due to Stimulation of Age-Related Factors by Intermittent Hypoxia, High-Fat Diet, and Galactose Injection. International Journal of Molecular Sciences. 2020; 21(19):7068. https://doi.org/10.3390/ijms21197068
Chicago/Turabian StylePark, Dong Jun, Sunmok Ha, Jin Sil Choi, Su Hoon Lee, Jeong-Eun Park, and Young Joon Seo. 2020. "Induced Short-Term Hearing Loss due to Stimulation of Age-Related Factors by Intermittent Hypoxia, High-Fat Diet, and Galactose Injection" International Journal of Molecular Sciences 21, no. 19: 7068. https://doi.org/10.3390/ijms21197068