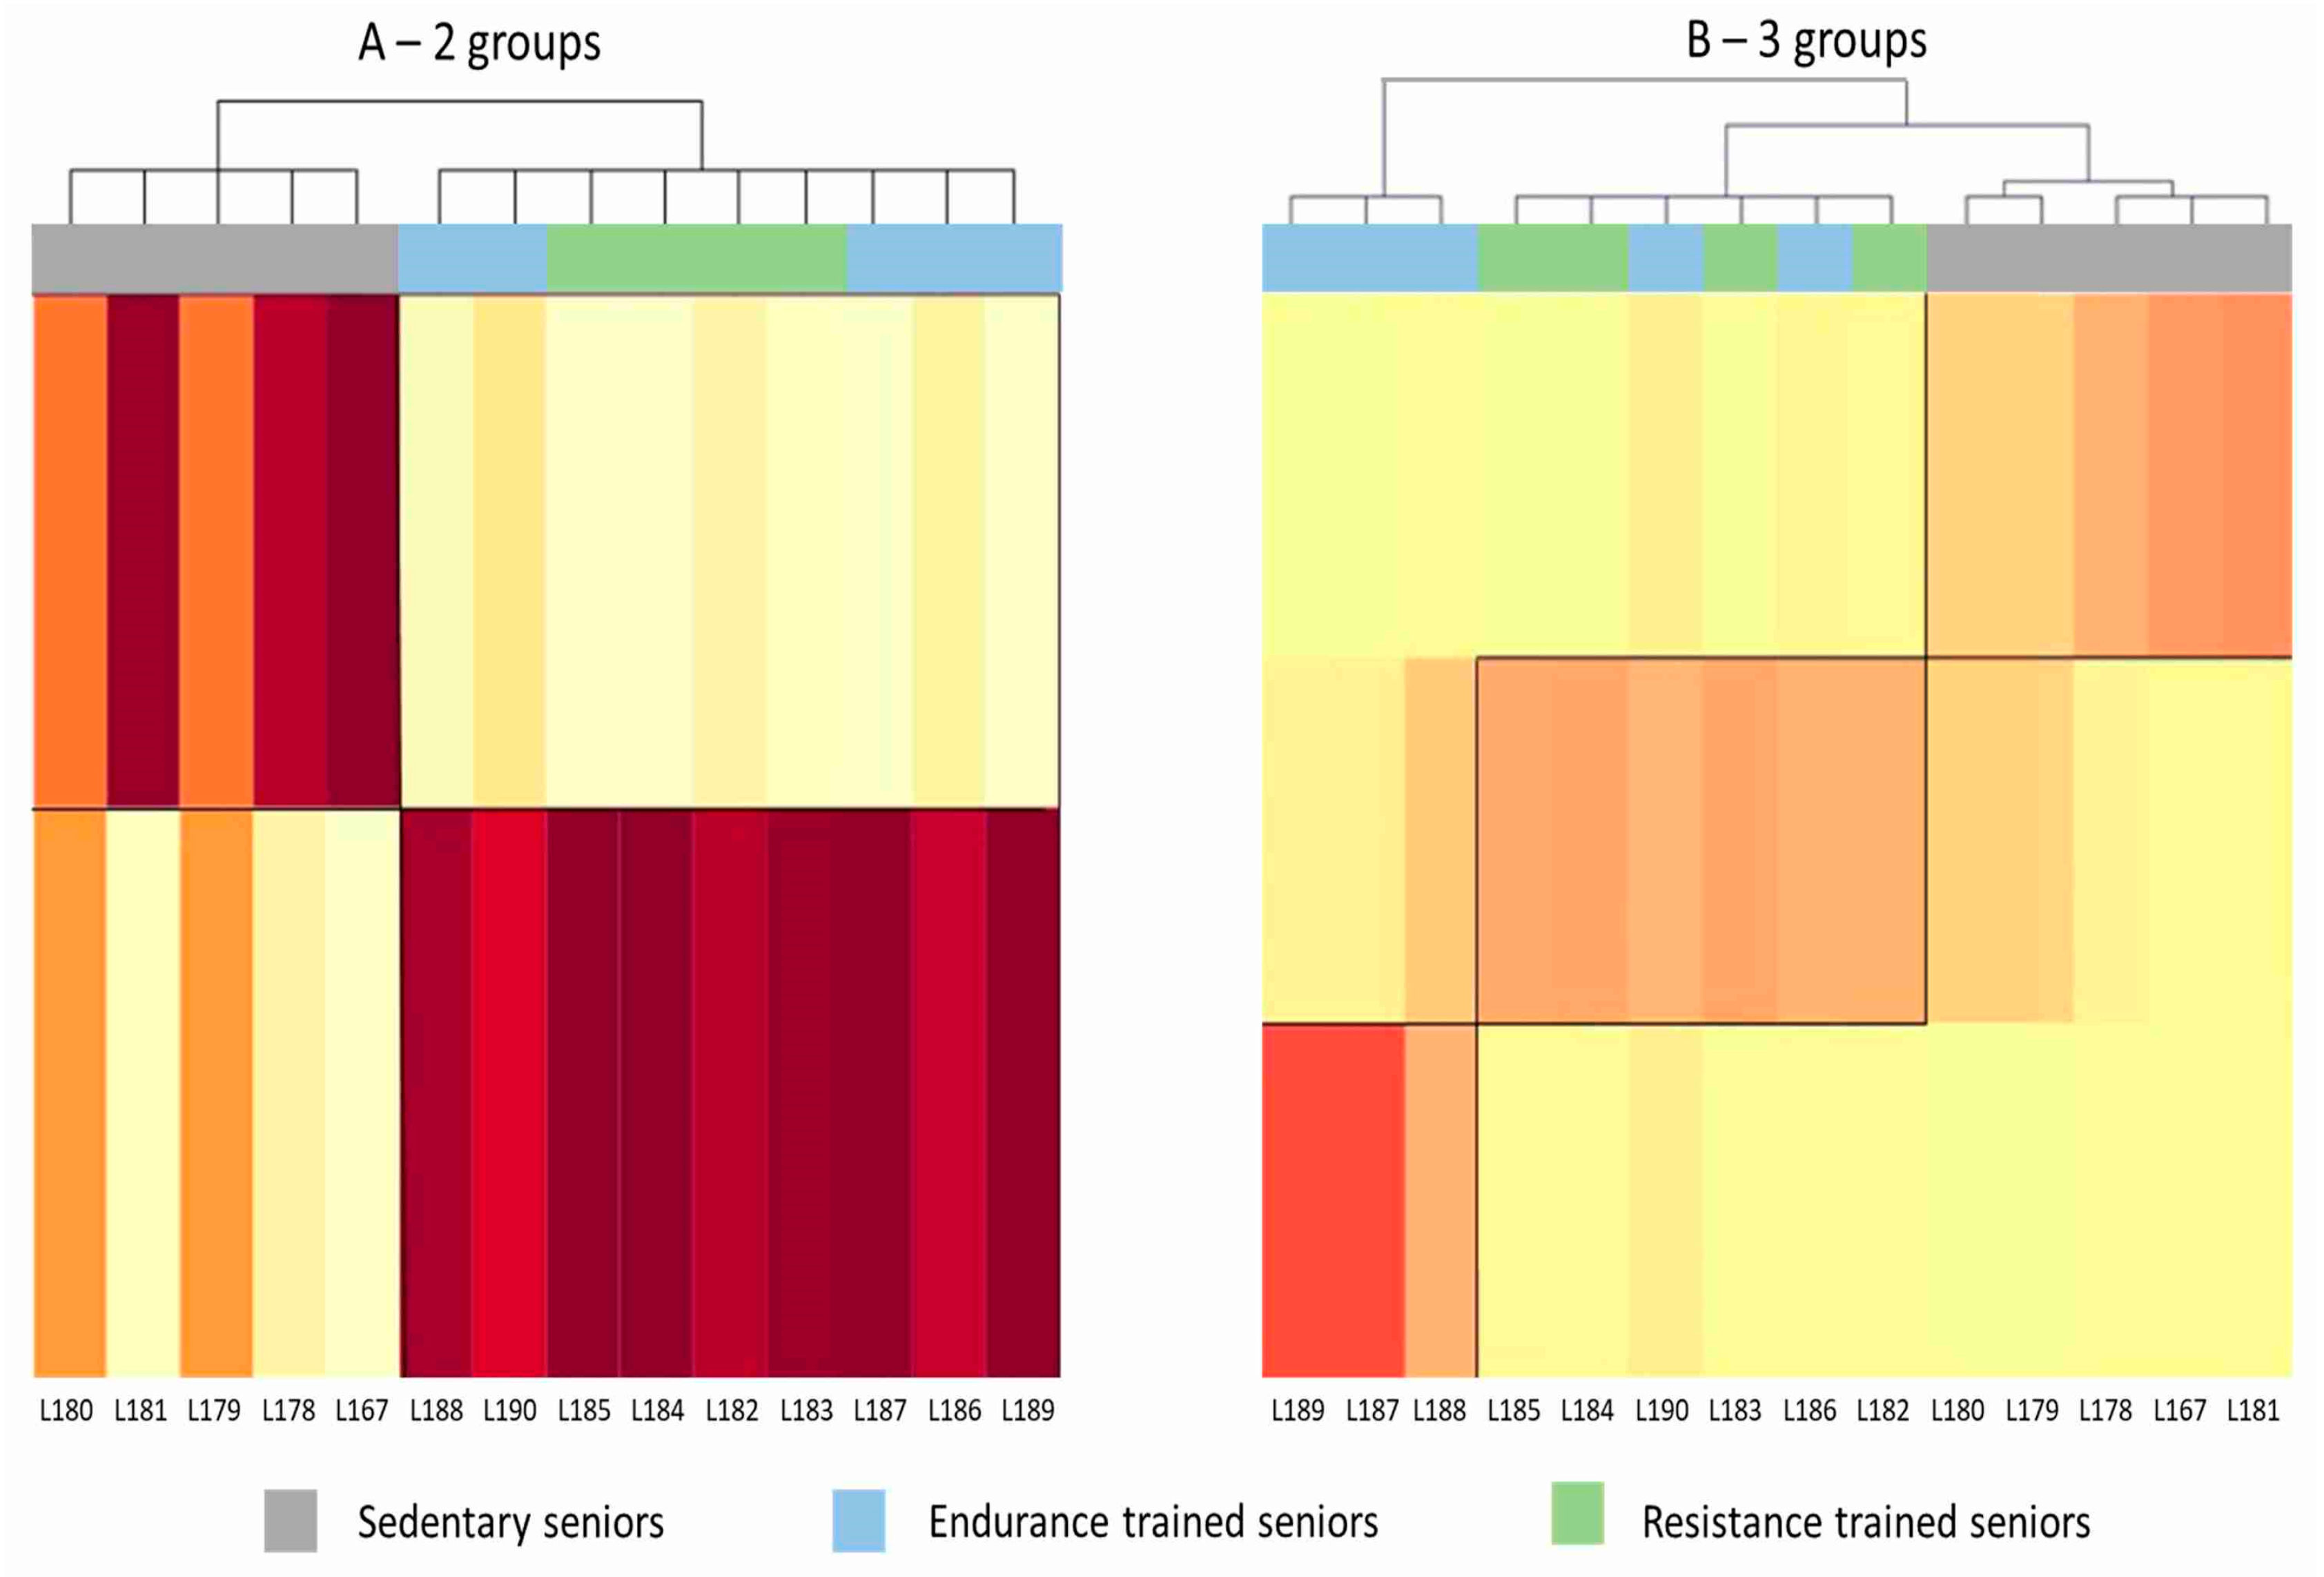
Figure 1.
Heat maps generated by mixture distribution analysis. Each column represents one subject. The darker the color shade, the closer is the affinity of the subject’s pattern of gene expression to that characterizing the group to which he was assigned by the cluster analysis. (A) Unsupervised analysis clustered subjects in two groups, SED and TRA, without being able to discriminate between ET and RT athletes. (B) Trying to group the subjects in three clusters (SED, ET and RT), mixture analysis misclassified two ET subjects, who were assigned to the RT group.
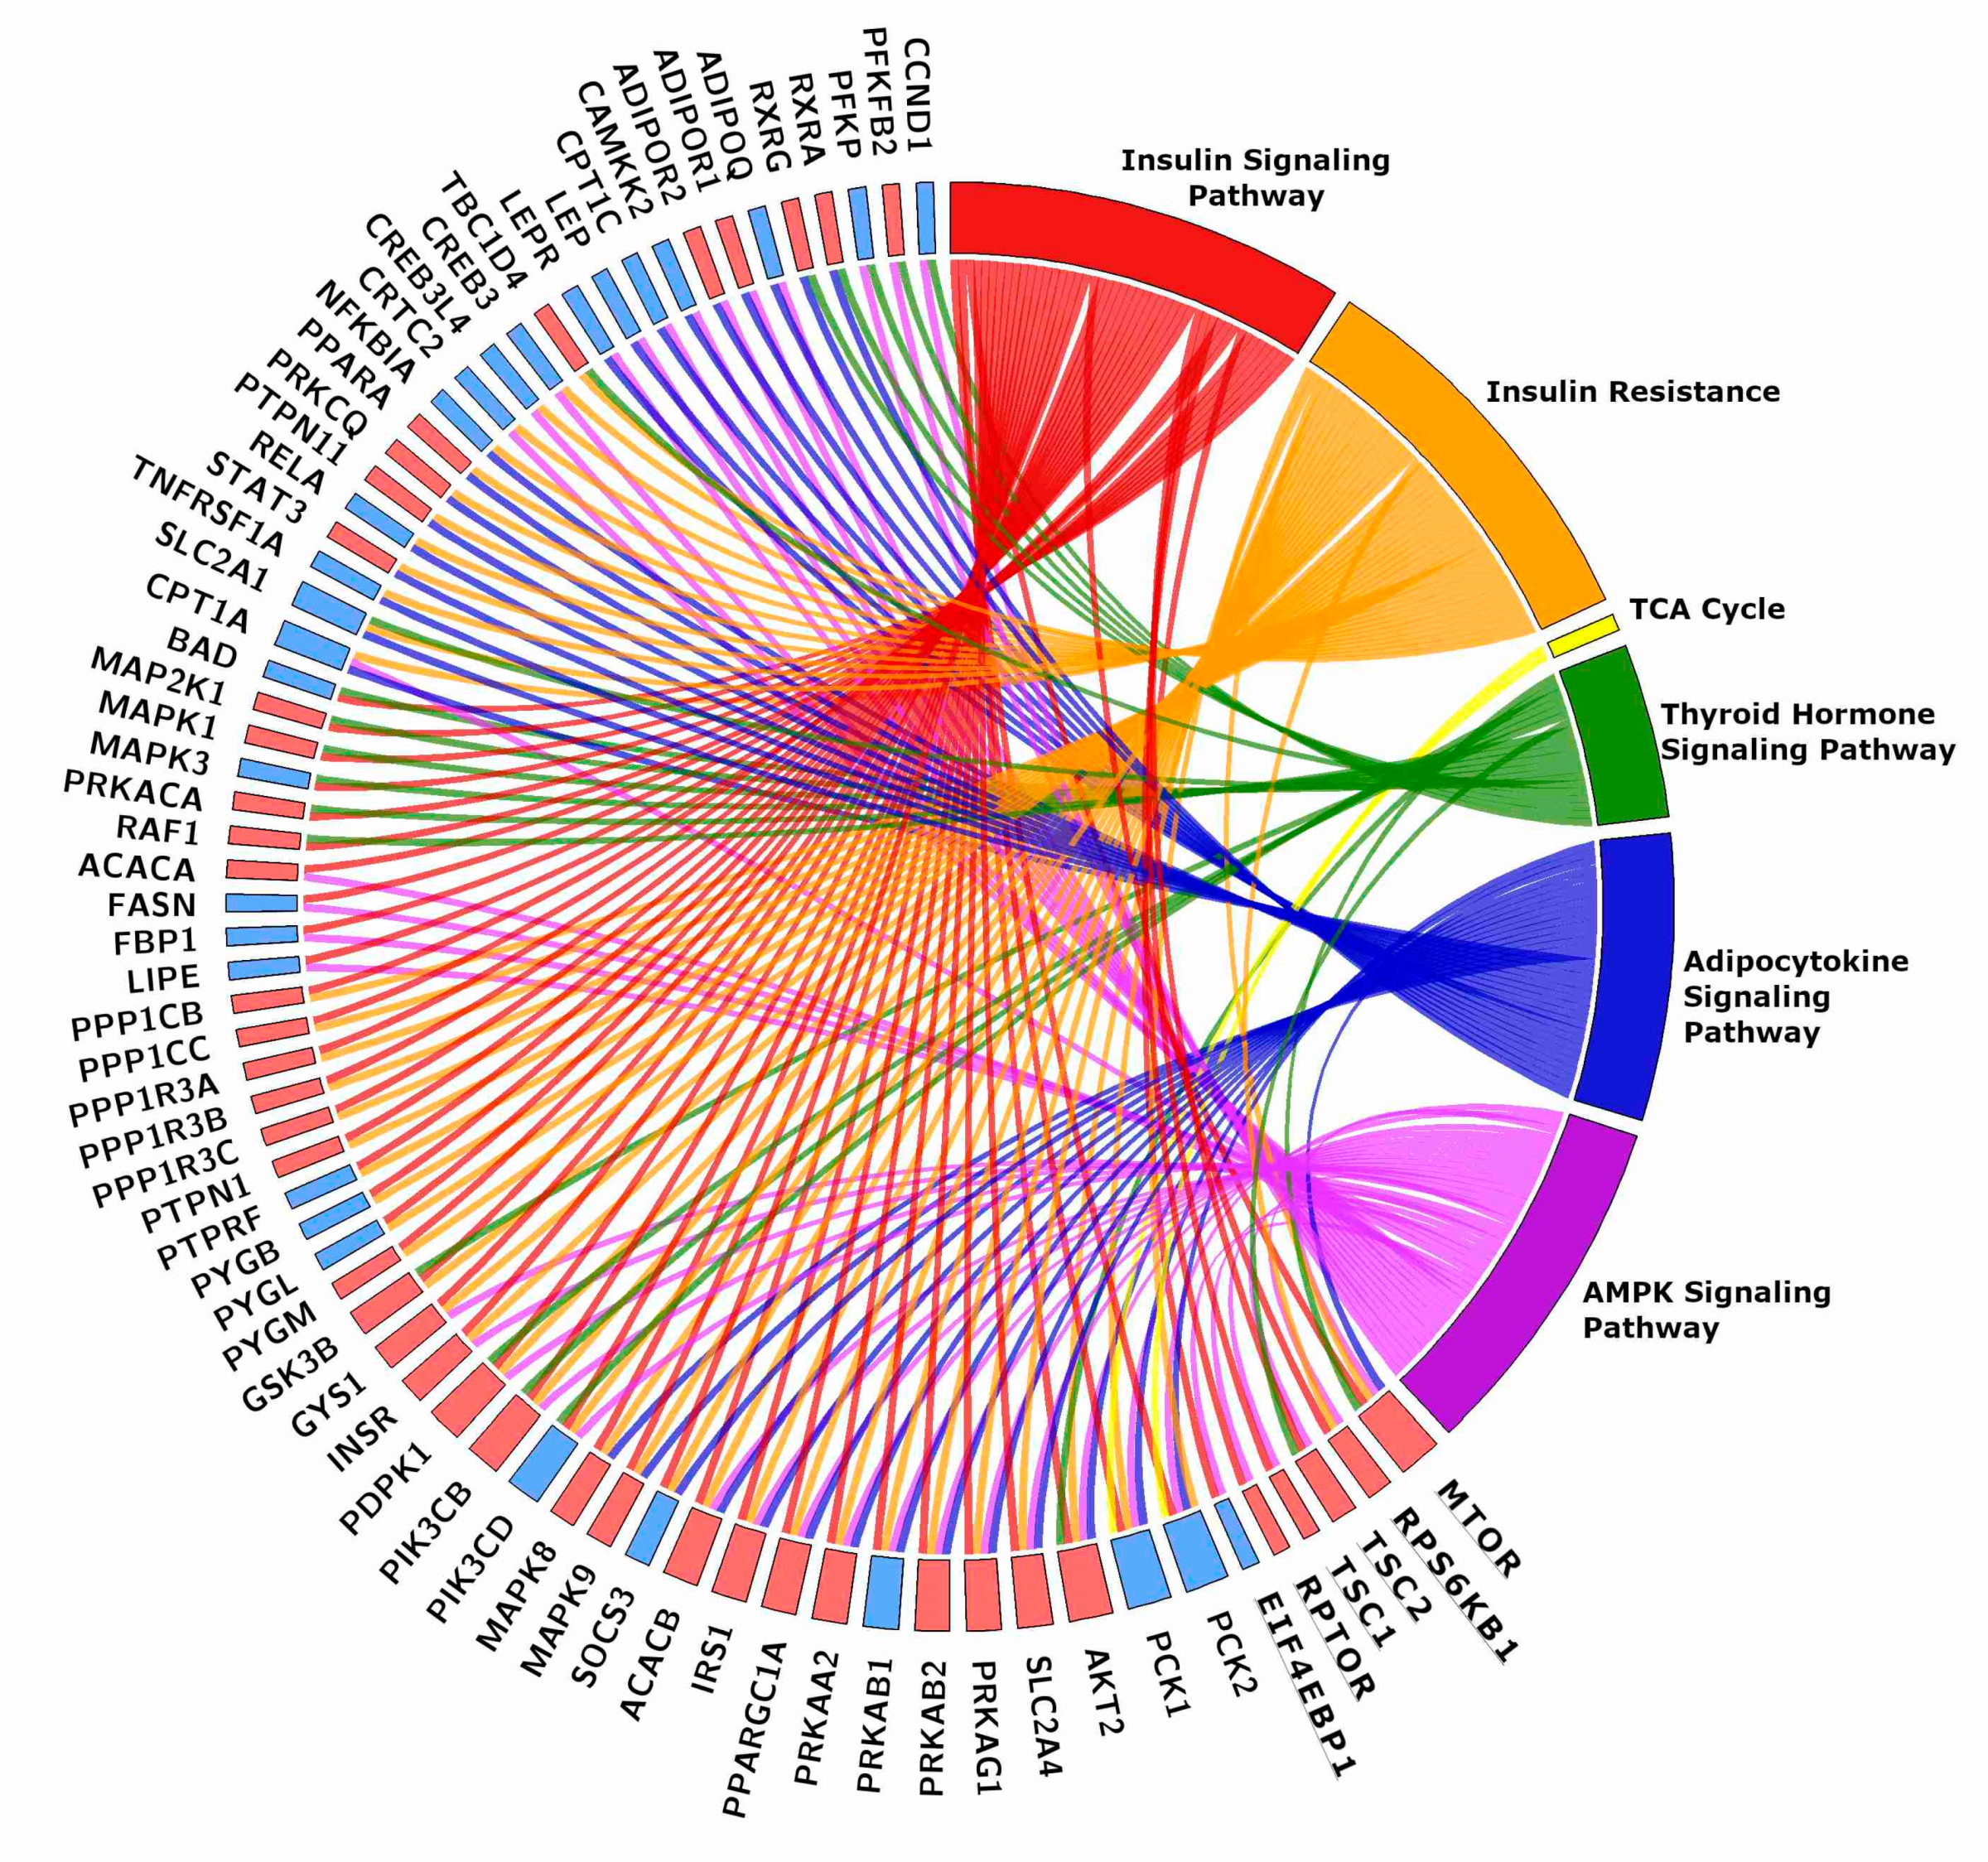
Figure 2.
Chord plot showing the genes shared by two or more energy-related KEGGs. The rectangle flanking the gene name is red when the gene is more expressed in TRA than in SED VL, blue when it is less expressed. The plot includes six genes of the mTOR pathway, which were grouped together for clarity sake. Gene names and details on the pathways are in the text.
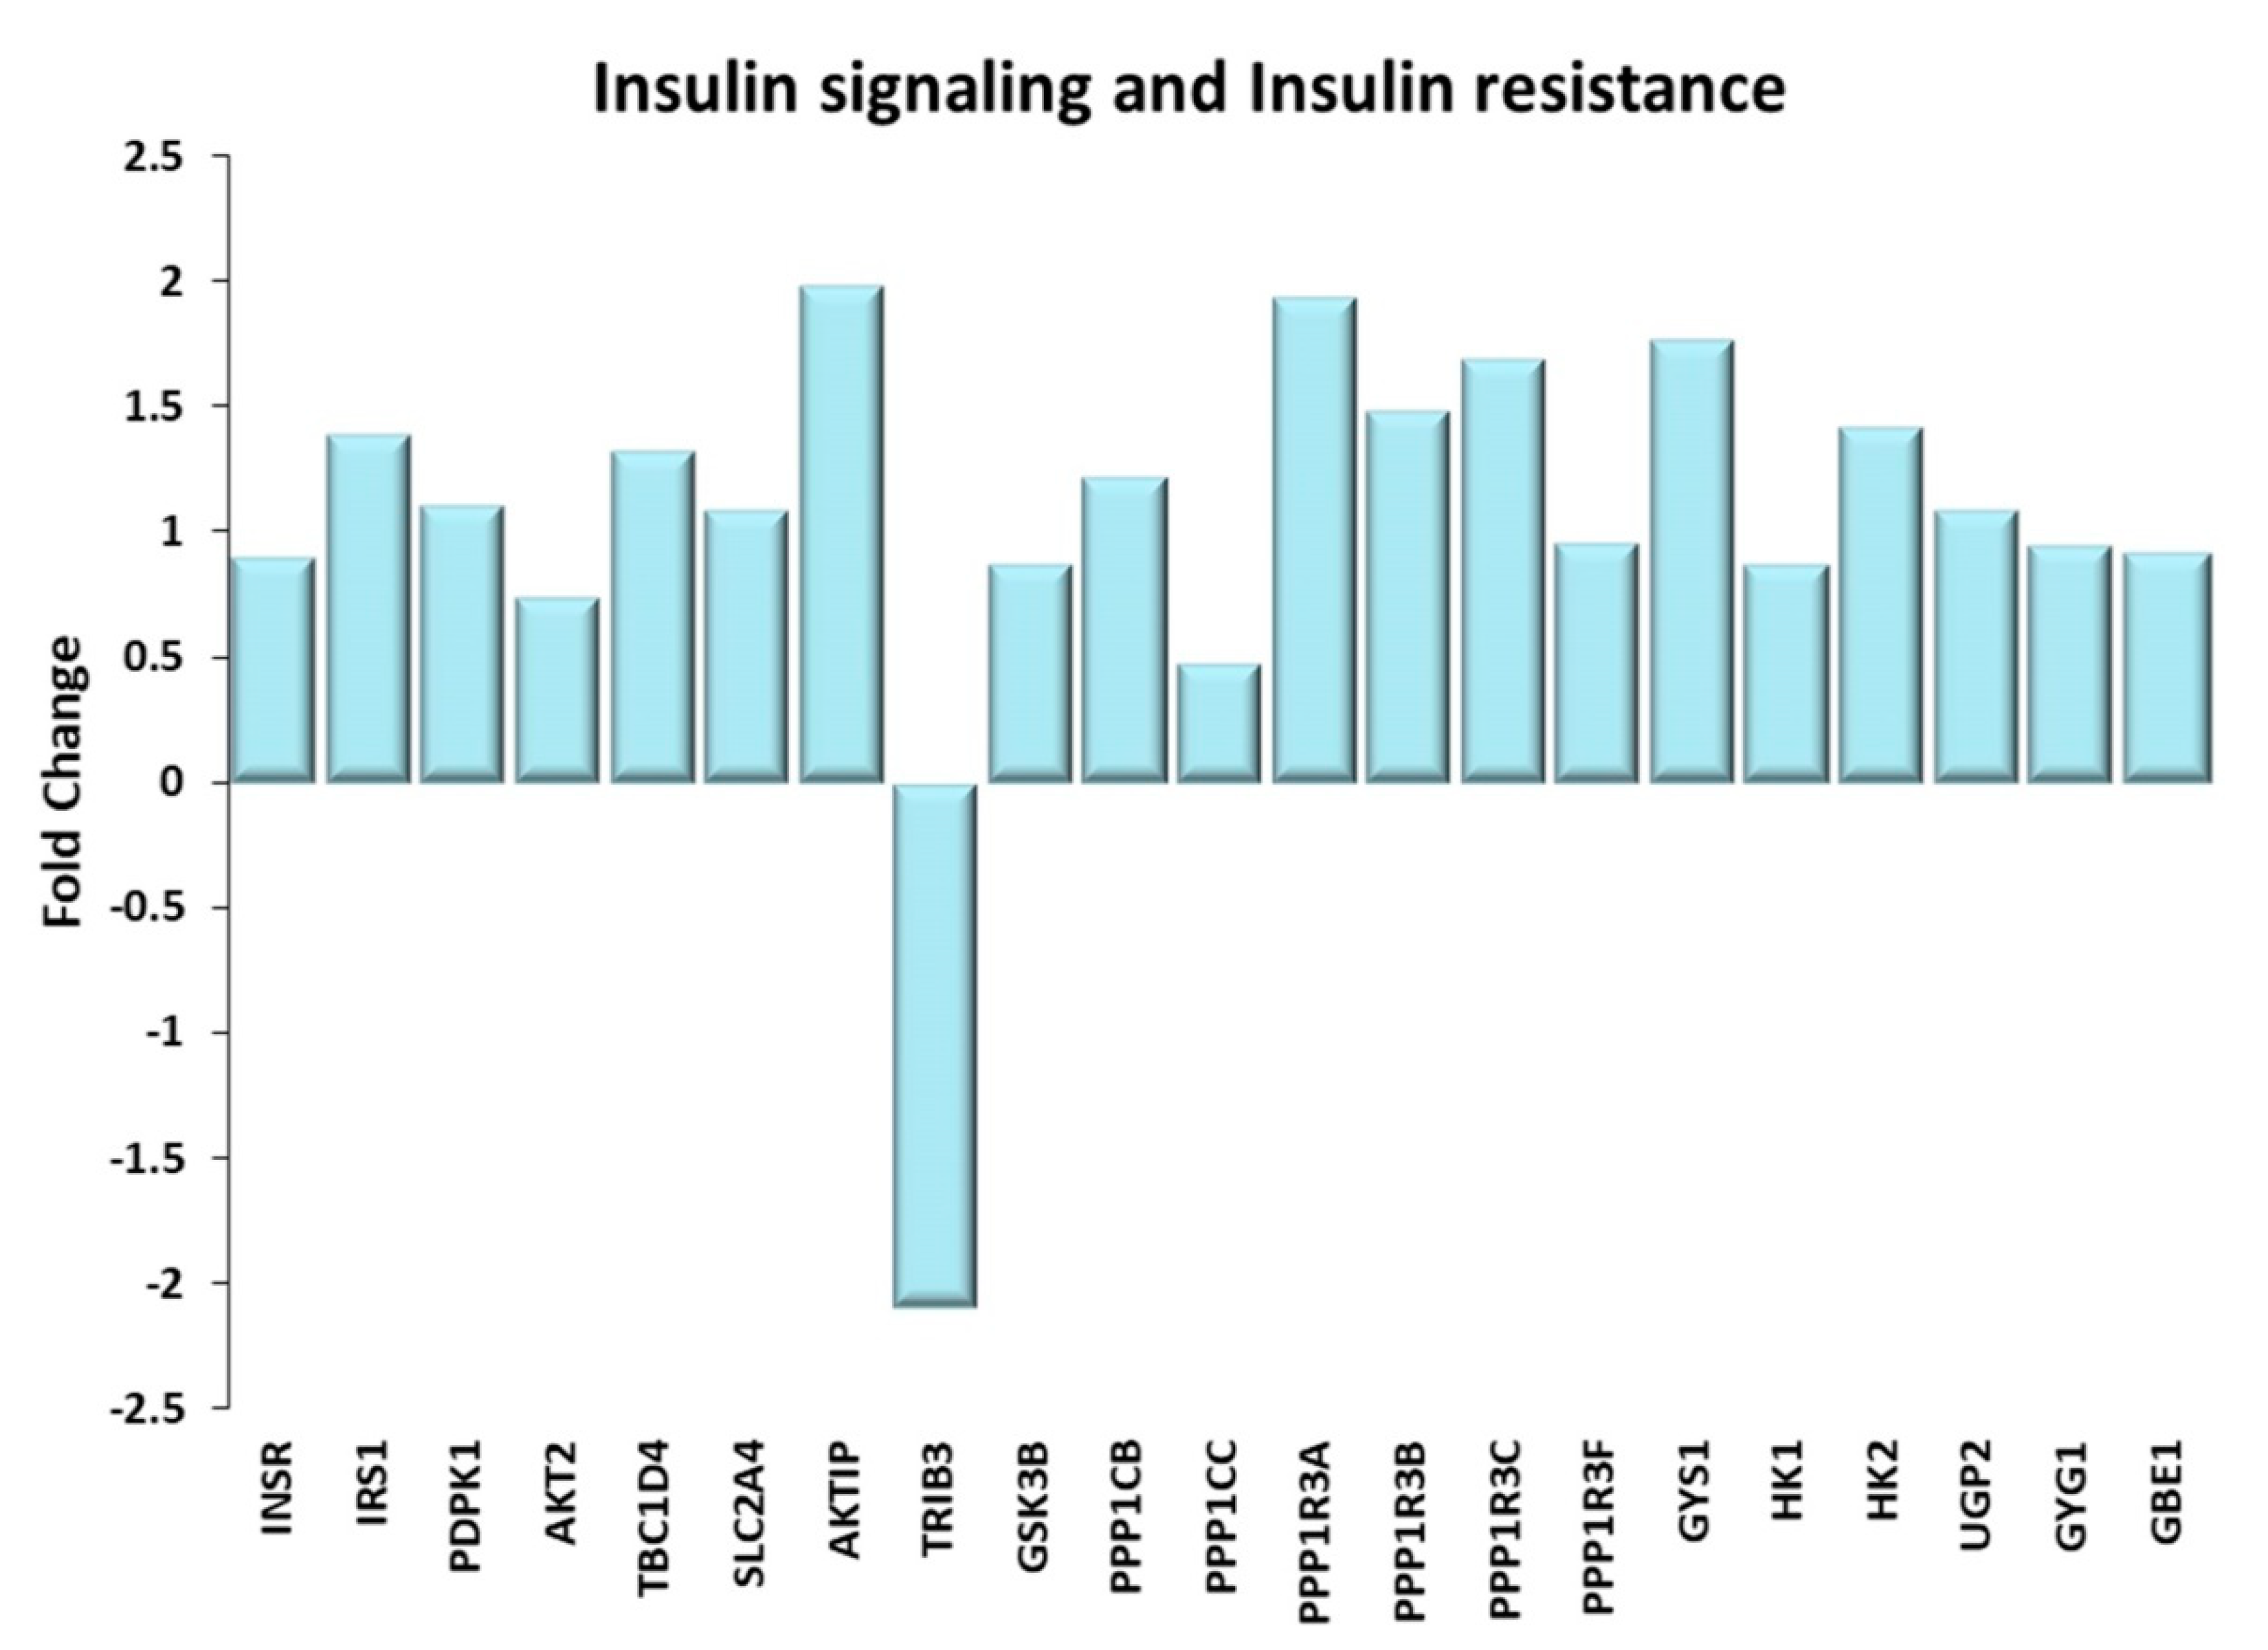
Figure 3.
Insulin signaling and Insulin resistance. Genes discussed in the text are shown here as fold change in the comparison of TRA and SED subjects. INSR: Insulin receptor; IRS1: Insulin receptor substrate 1; PDPK1: 3-phosphoinositide dependent protein kinase 1; AKT2: AKT serine/threonine kinase 2; TBC1D4: Akt substrate of 160 kDa or AS160; SLC2A4: glucose transporter type 4 or GLUT-4; AKTIP: AKT interacting protein; TRIB3: tribbles pseudokinase 3; GSK3B: glycogen synthase kinase 3 beta; PPP1CB, PPP1CC: protein phosphatase 1 catalytic subunit beta, gamma; PPP1R3A, PPP1R3B, PPP1R3C, PPP1R3F: protein phosphatase 1 regulatory subunit 3A, 3B, 3C, 3F; GYS1: glycogen synthase 1; HK1, HK2: Hexokinases 1, 2; UGP2: UDP-glucose pyrophosphorylase 2; GYG1: glycogenin; GBE1: Glycogen branching enzyme.
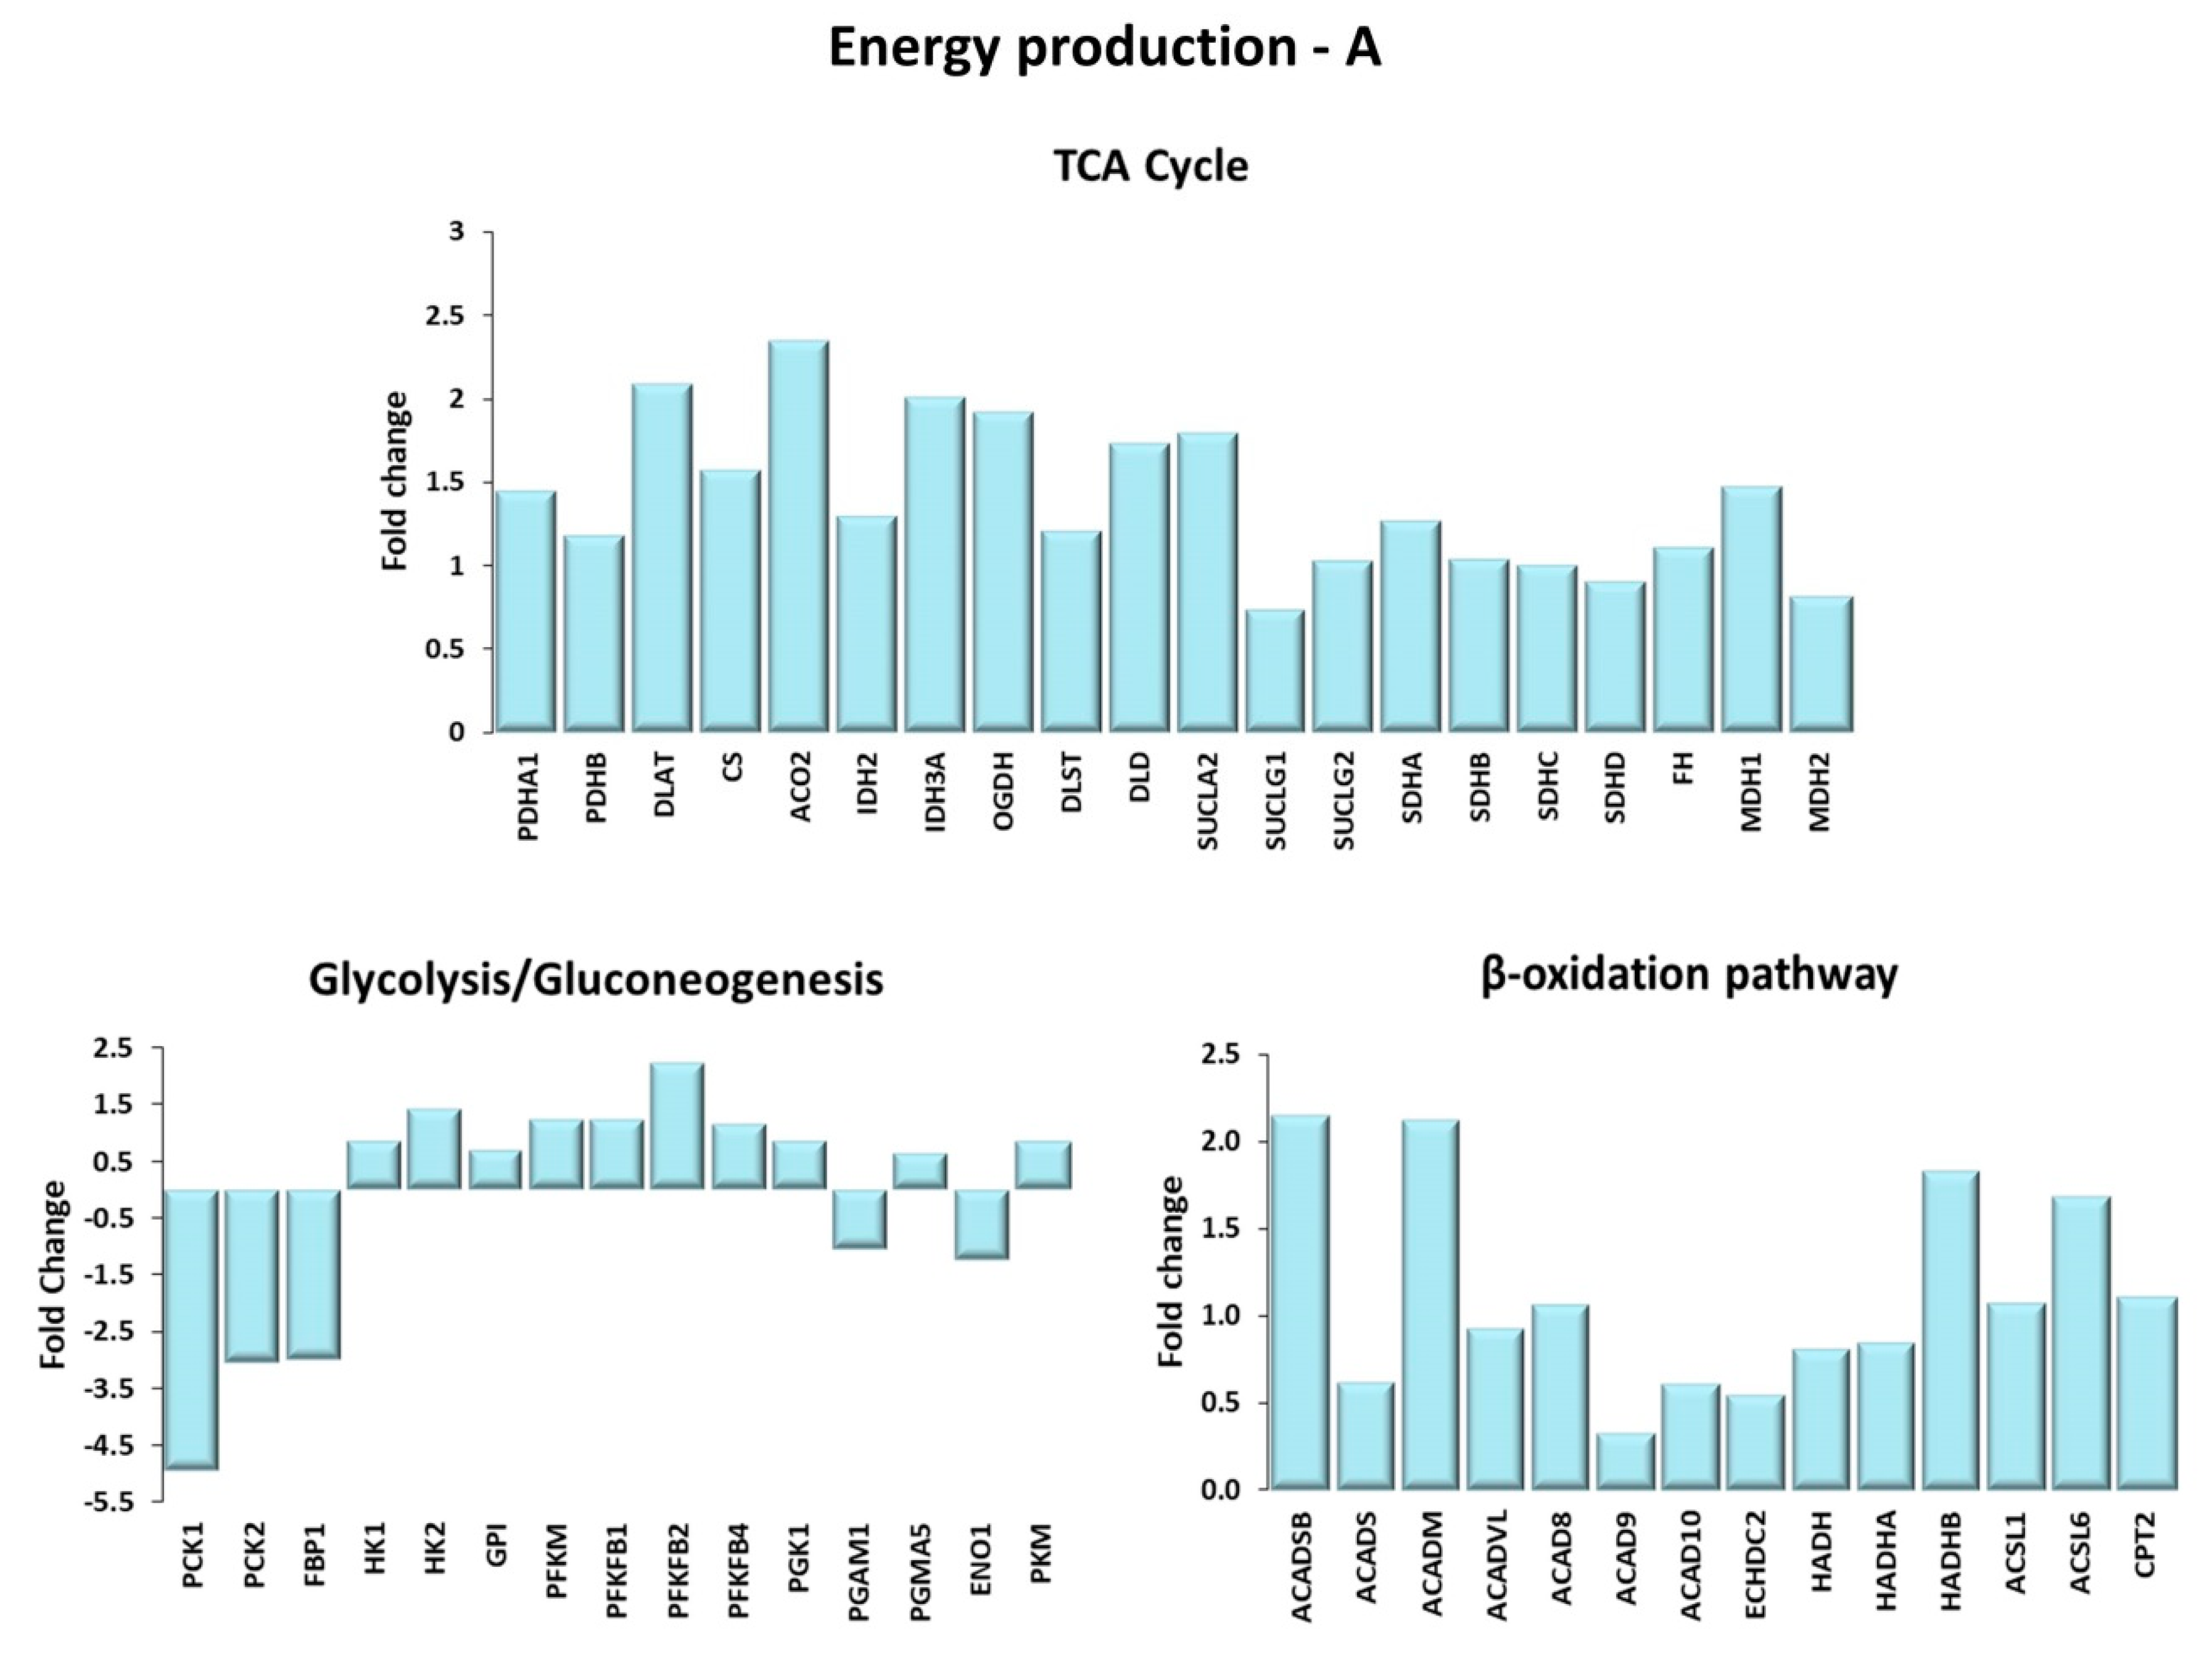
Figure 4.
Energy production. Genes are shown here as fold change in the comparison of TRA and SED subjects. (A) TCA cycle. PDHA1, PDHB: pyruvate dehydrogenase E1 subunit α 1, β; DLAT: Dihydrolipoamide S-acetyltransferase; CS: citrate synthase; ACO2: aconitase 2; IDH2: isocitrate dehydrogenase (NADP+)2; IDH3A: isocitrate dehydrogenase (NADP+)3 catalytic subunit α; OGDH: oxoglutarate dehydrogenase; DLST: dihydrolipoamide S-succinyltransferase; DLD: dihydrolipoamide dehydrogenase; SUCLA2: succinate-CoA ligase ADP-forming subunit β; SUCLG1: succinate-CoA ligase GDP/ADP-forming subunit α; SUCLG2: succinate-CoA ligase GDP-forming subunit β; SDHA: succinate dehydrogenase complex flavoprotein subunit A; SDHB: succinate dehydrogenase complex iron sulfur subunit B; SDHC: succinate dehydrogenase complex subunit C; SDHD: succinate dehydrogenase complex subunit D; FH: fumarate hydratase; MDH1 and MDH2: malate dehydrogenase 1 and 2. Glycolysis/Gluconeogenesis. PCK1, PCK2: phosphoenolpyruvate carboxykinase 1, 2; FBP1: fructose-bisphosphatase 1; HK1, HK2: hexokinases 1, 2; GPI: glucose-6-phosphate isomerase; PFKM: phosphofructokinase muscle; PFKFB1, PFKFB2, PFKB4: 6-phospho-fructo-2-kinase/fructose-2,6-biphosphatase 1, 2, 4; PGK1: phosphoglycerate kinase 1; PGAM1, PGMA5: phosphoglycerate mutase 1, 5; ENO1: enolase 1; PKM: pyruvate kinase. β-oxidation pathway. ACADSB: acyl-CoA dehydrogenase short/branched chain; ACADS: acyl-CoA dehydrogenase short chain; ACADM: acyl-CoA dehydrogenase medium chain; ACADVL: acyl-CoA dehydrogenase very long chain; ACAD8, ACAD9, ACAD10: acyl-CoA dehydrogenase family member 8, 9, 10; ECHDC2: enoyl-CoA hydratase domain containing 2; HADH: hydroxyacyl-CoA dehydrogenase; HADHA, HADHB: 3-ketoacyl-CoA thiolase α, β; ACSL1, ACSL6: acyl-CoA synthetase long chain family member 1, 6; CPT2: carnitine palmitoyl transferase-2. (B) Mitochondrial electron transport chain. Complex I: NDUFS1, NDUFS2, NDUFS7, NDUFV1: NADH:ubiquinone oxidoreductase core subunit S1, S2, S7, V1; MTND4P12: mitochondrially encoded NADH dehydrogenase 4 psuedogene 12; MTND5P11: mitochondrially encoded NADH dehydrogenase 5 psuedogene 11; NDUFA4L2: NDUFA4 mitochondrial complex associated like 2; NDUFA5, NDUFA8, NDUFA9, NDUFA10, NDUFB3, NDUFB4, NDUFB5, NDUFC1, NDUFV3: NADH:ubiquinone oxidoreductase subunit A5, A8, A9, A10, B3, B4, B5, C1, V3; NDUFAF4, NDUFAF5, NDUFAF6, NDUFAF7: NADH:ubiquinone oxidoreductase complex assembly factor 4, 5, 6, 7. Complex II: SDHA: succinate dehydrogenase complex flavoprotein subunit A; SDHB: succinate dehydrogenase complex iron sulfur subunit B; SDHC: succinate dehydrogenase complex subunit C; SDHD: succinate dehydrogenase complex subunit D. Complex III: CYC1: cytochrome c1; CYCS: cytochrome c, somatic; UQCRFS1: ubiquinol-cytochrome c reductase, Rieske iron-sulfur polypeptide 1; UQCRFS1P1: ubiquinol-cytochrome c reductase, Rieske iron-sulfur polypeptide 1 pseudogene 1; UQCRC1 and UQCRC2: ubiquinol-cytochrome c reductase core protein 1 and 2. Complex IV: COX4I2, COX5A, COX6A1: cytochrome c oxidase subunit 4I2, 5A, 6A1; COX7A3: cytochrome c oxidase subunit 7A2 pseudogene 2; COA1: cytochrome c oxidase assembly factor 1 homolog; COX11: cytochrome c oxidase copper chaperone COX11; COX15: cytochrome c oxidase assembly homolog COX15; COX18, COX20 cytochrome c oxidase assembly factor COX18, COX20. Complex V: ATP5A1, ATP5B, ATP5C1: ATP synthase F1 subunit α, β, γ; ATPAF1, ATPAF2: ATP synthase mitochondrial F1 complex assembly factor 1, 2; MTATP6P1: MT-ATP6 pseudogene 1; ATP synthase peripheral stalk-membrane subunit b; ATP5G1, ATP5G3: ATP synthase membrane subunit c locus 1, locus 3; ATP5S: distal membrane arm assembly complex 2 like or DMAC2L; ATP5SL: distal membrane arm assembly complex 2 or DMAC2.
![Ijms 21 03988 g004a]()
![Ijms 21 03988 g004b]()
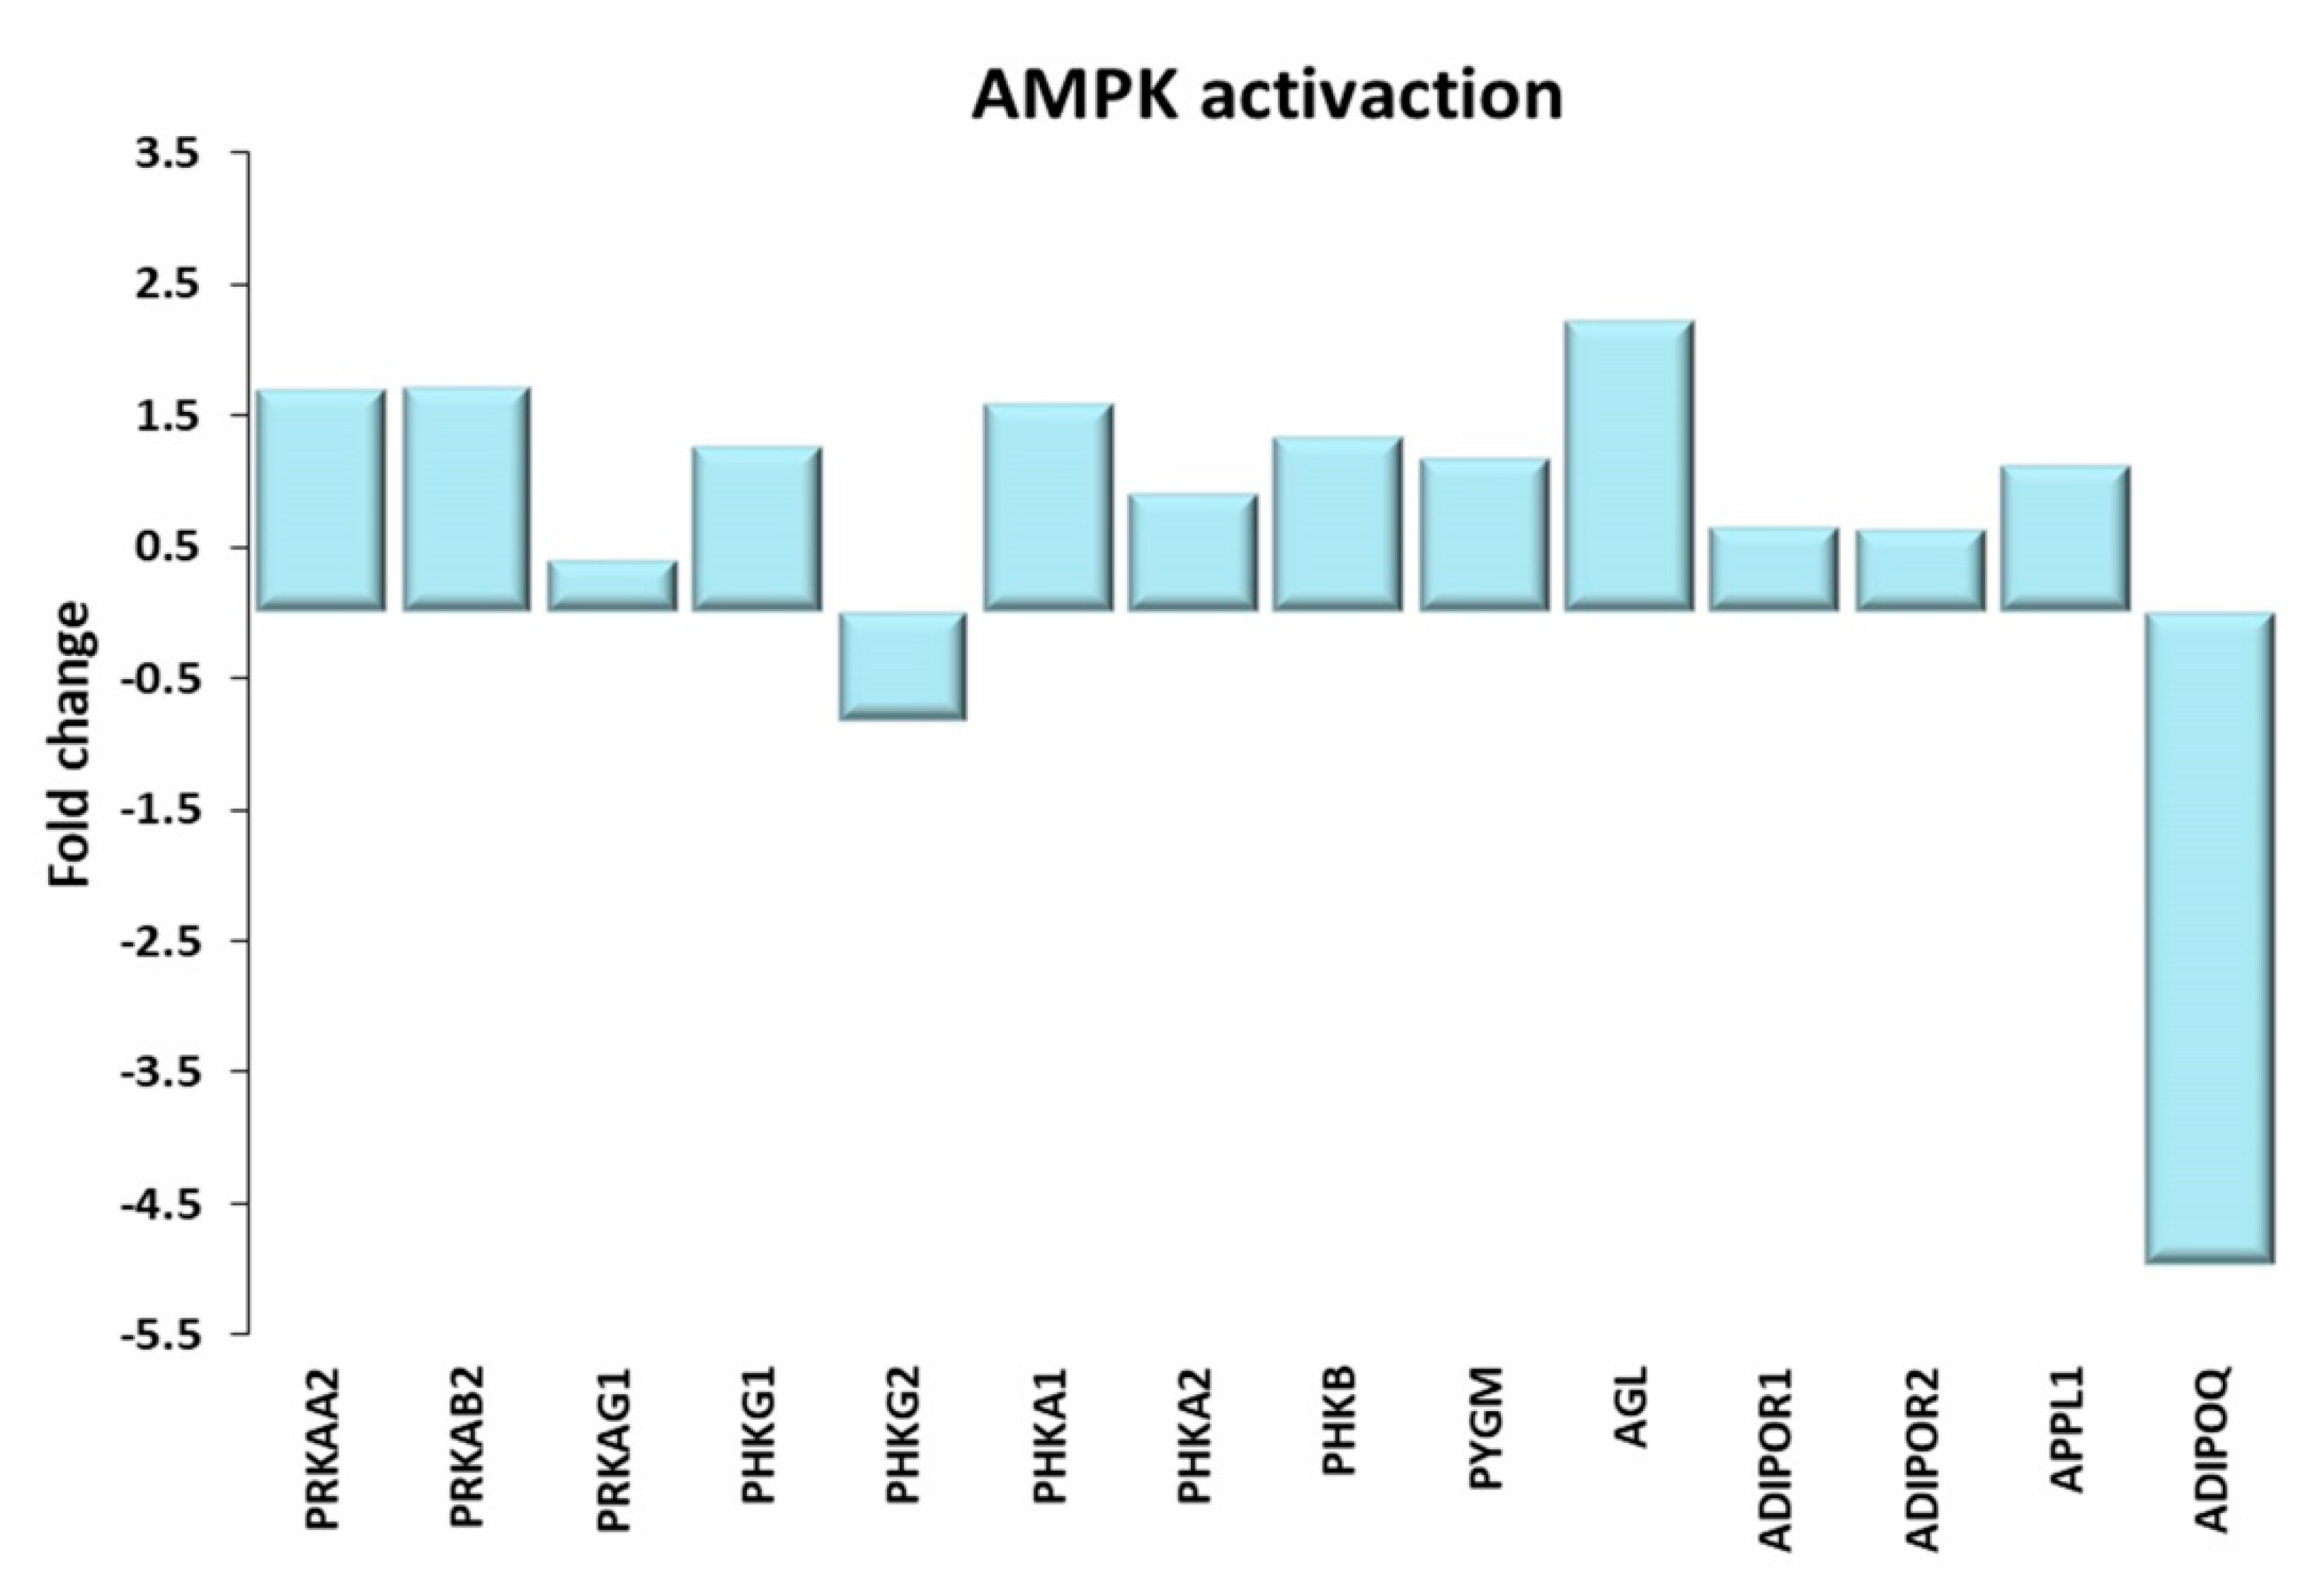
Figure 5.
AMPK activation. Genes discussed in the text are shown here as fold change in the comparison of TRA and SED subjects. PRKAA2: Protein kinase AMP-activated catalytic subunit α 2; PRKAB2, PRKAG1: Protein kinase AMP-activated non-catalytic subunit β 2, γ 1; PHKG1, PHKG2: phosphorylase kinase catalytic subunit γ 1, 2; PHKA1, PHKA2, PHKB: phosphorylase kinase regulatory subunit α 1, α 2, β; PYGM, glycogen phosphorylase, muscle associated; AGL amylo-α-1, 6-glucosidase, 4-α-glucanotransferase; ADIPOR1, ADIPOR2: adiponectin receptor 1, 2; APPL1: adaptor protein, phosphotyrosine interacting with PH domain and leucine zipper 1; ADIPOQ: adiponectin.
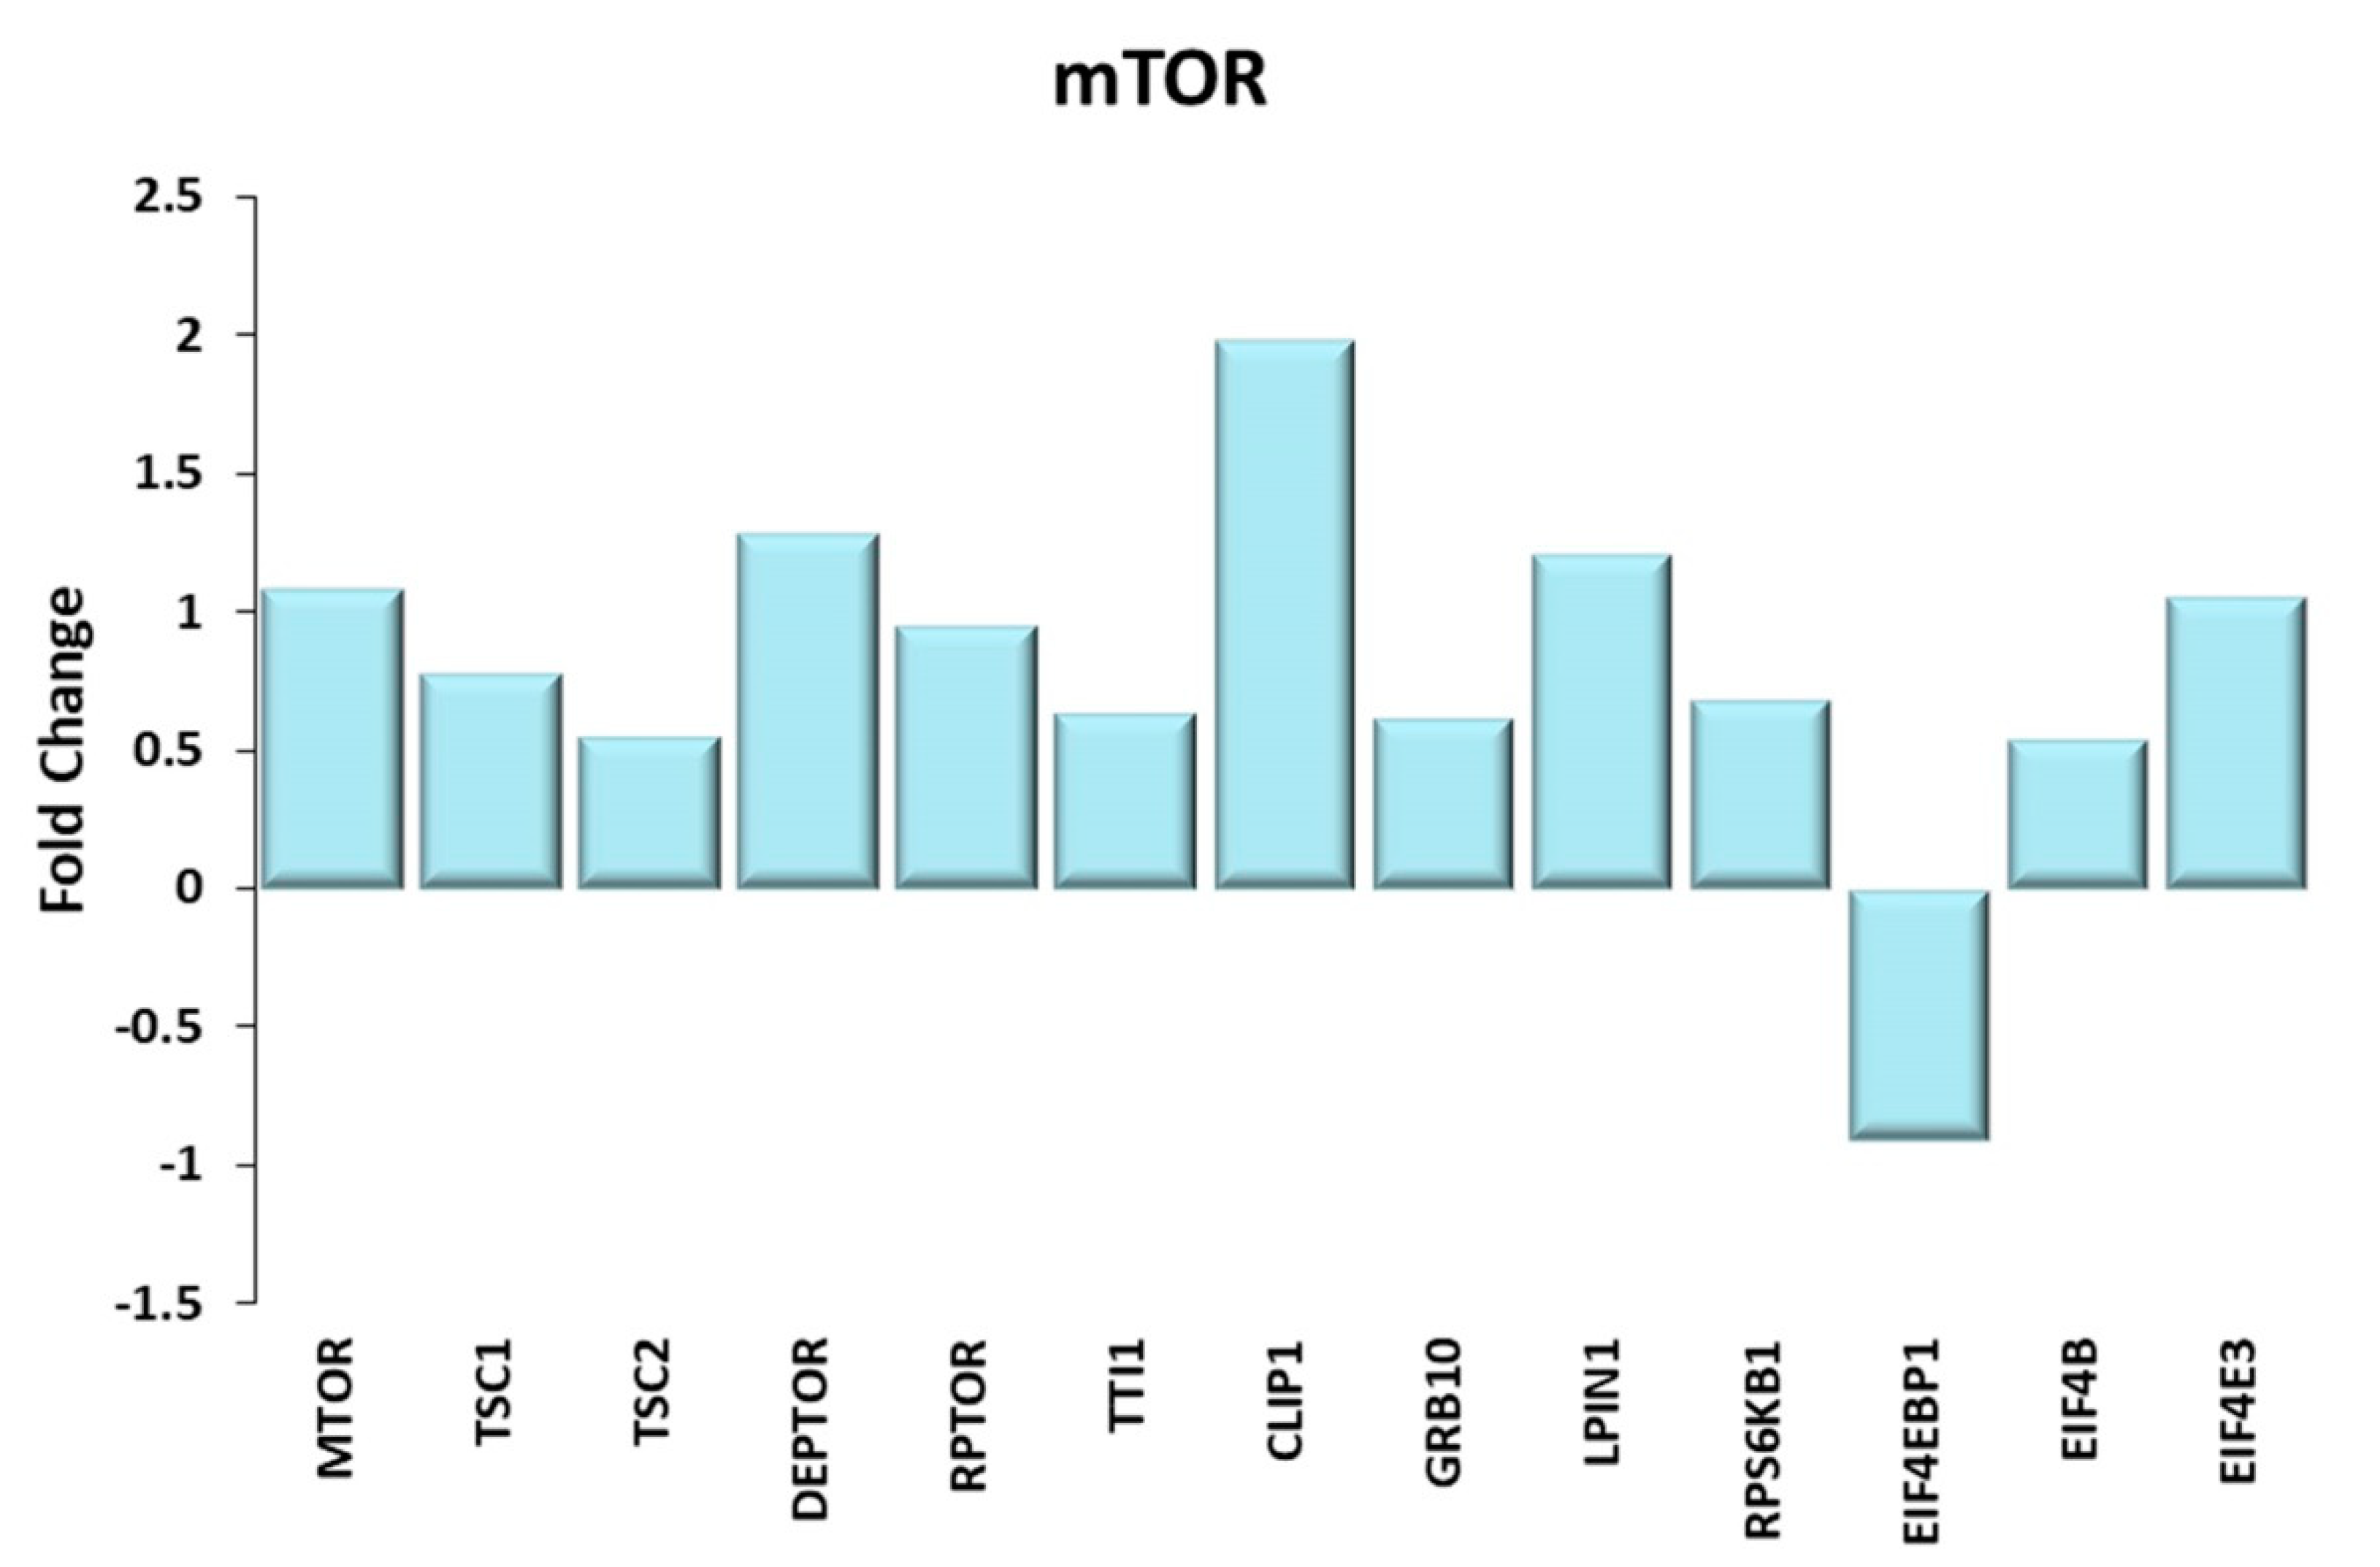
Figure 6.
mTOR. Genes discussed in the text are shown here as fold change in the comparison of TRA and SED subjects. MTOR: mechanistic target of rapamycin kinase; TSC1 and TSC2: TSC complex subunit 1, 2; DEPTOR: DEP domain containing MTOR interacting protein; RPTOR: regulatory associated protein of MTOR complex 1; TTI1: TELO2 interacting protein 1; CLIP-1: CAP-Gly domain containing linker protein 1; GRB10: growth factor receptor bound protein 10; LPIN1: lipin 1; RPS6KB1: ribosomal protein S6 kinase B1; EIF4EBP1: eukaryotic translation initiation factor 4E binding protein 1 or 4E-BP1; EIF4B: eukaryotic translation initiation factor 4B; EIF4E3: eukaryotic translation initiation factor 4E family member 3.
Figure 7.
Mitochondria and NAD+/NADH ratio regulation. Genes discussed in the text are shown here as fold change in the comparison of TRA and SED subjects. PPARGC1A: proliferator-activated receptor γ coactivator-1 α or PGC1α; ESRRA, ESRRB, ESRRG: estrogen related receptors α, β, γ; TFAM: mitochondrial transcription factor A; SLC25A4: solute carrier family 25 member 4 or ANT1; OPA1: OPA1 mitochondrial dynamin like GTPase; NNT: nicotinamide nucleotide transhydrogenase; NNMT: nicotinamide N-methyltransferase; NMRK1: nicotinamide riboside kinase 1; NT5E: 5′-nucleotidase ecto; NAMPT: Nicotinamide Phosphoribosyltransferase; NMNAT1, NMNAT3: Nicotinamide Mononucleotide Adenylyl Transferase 1, 3.
Figure 8.
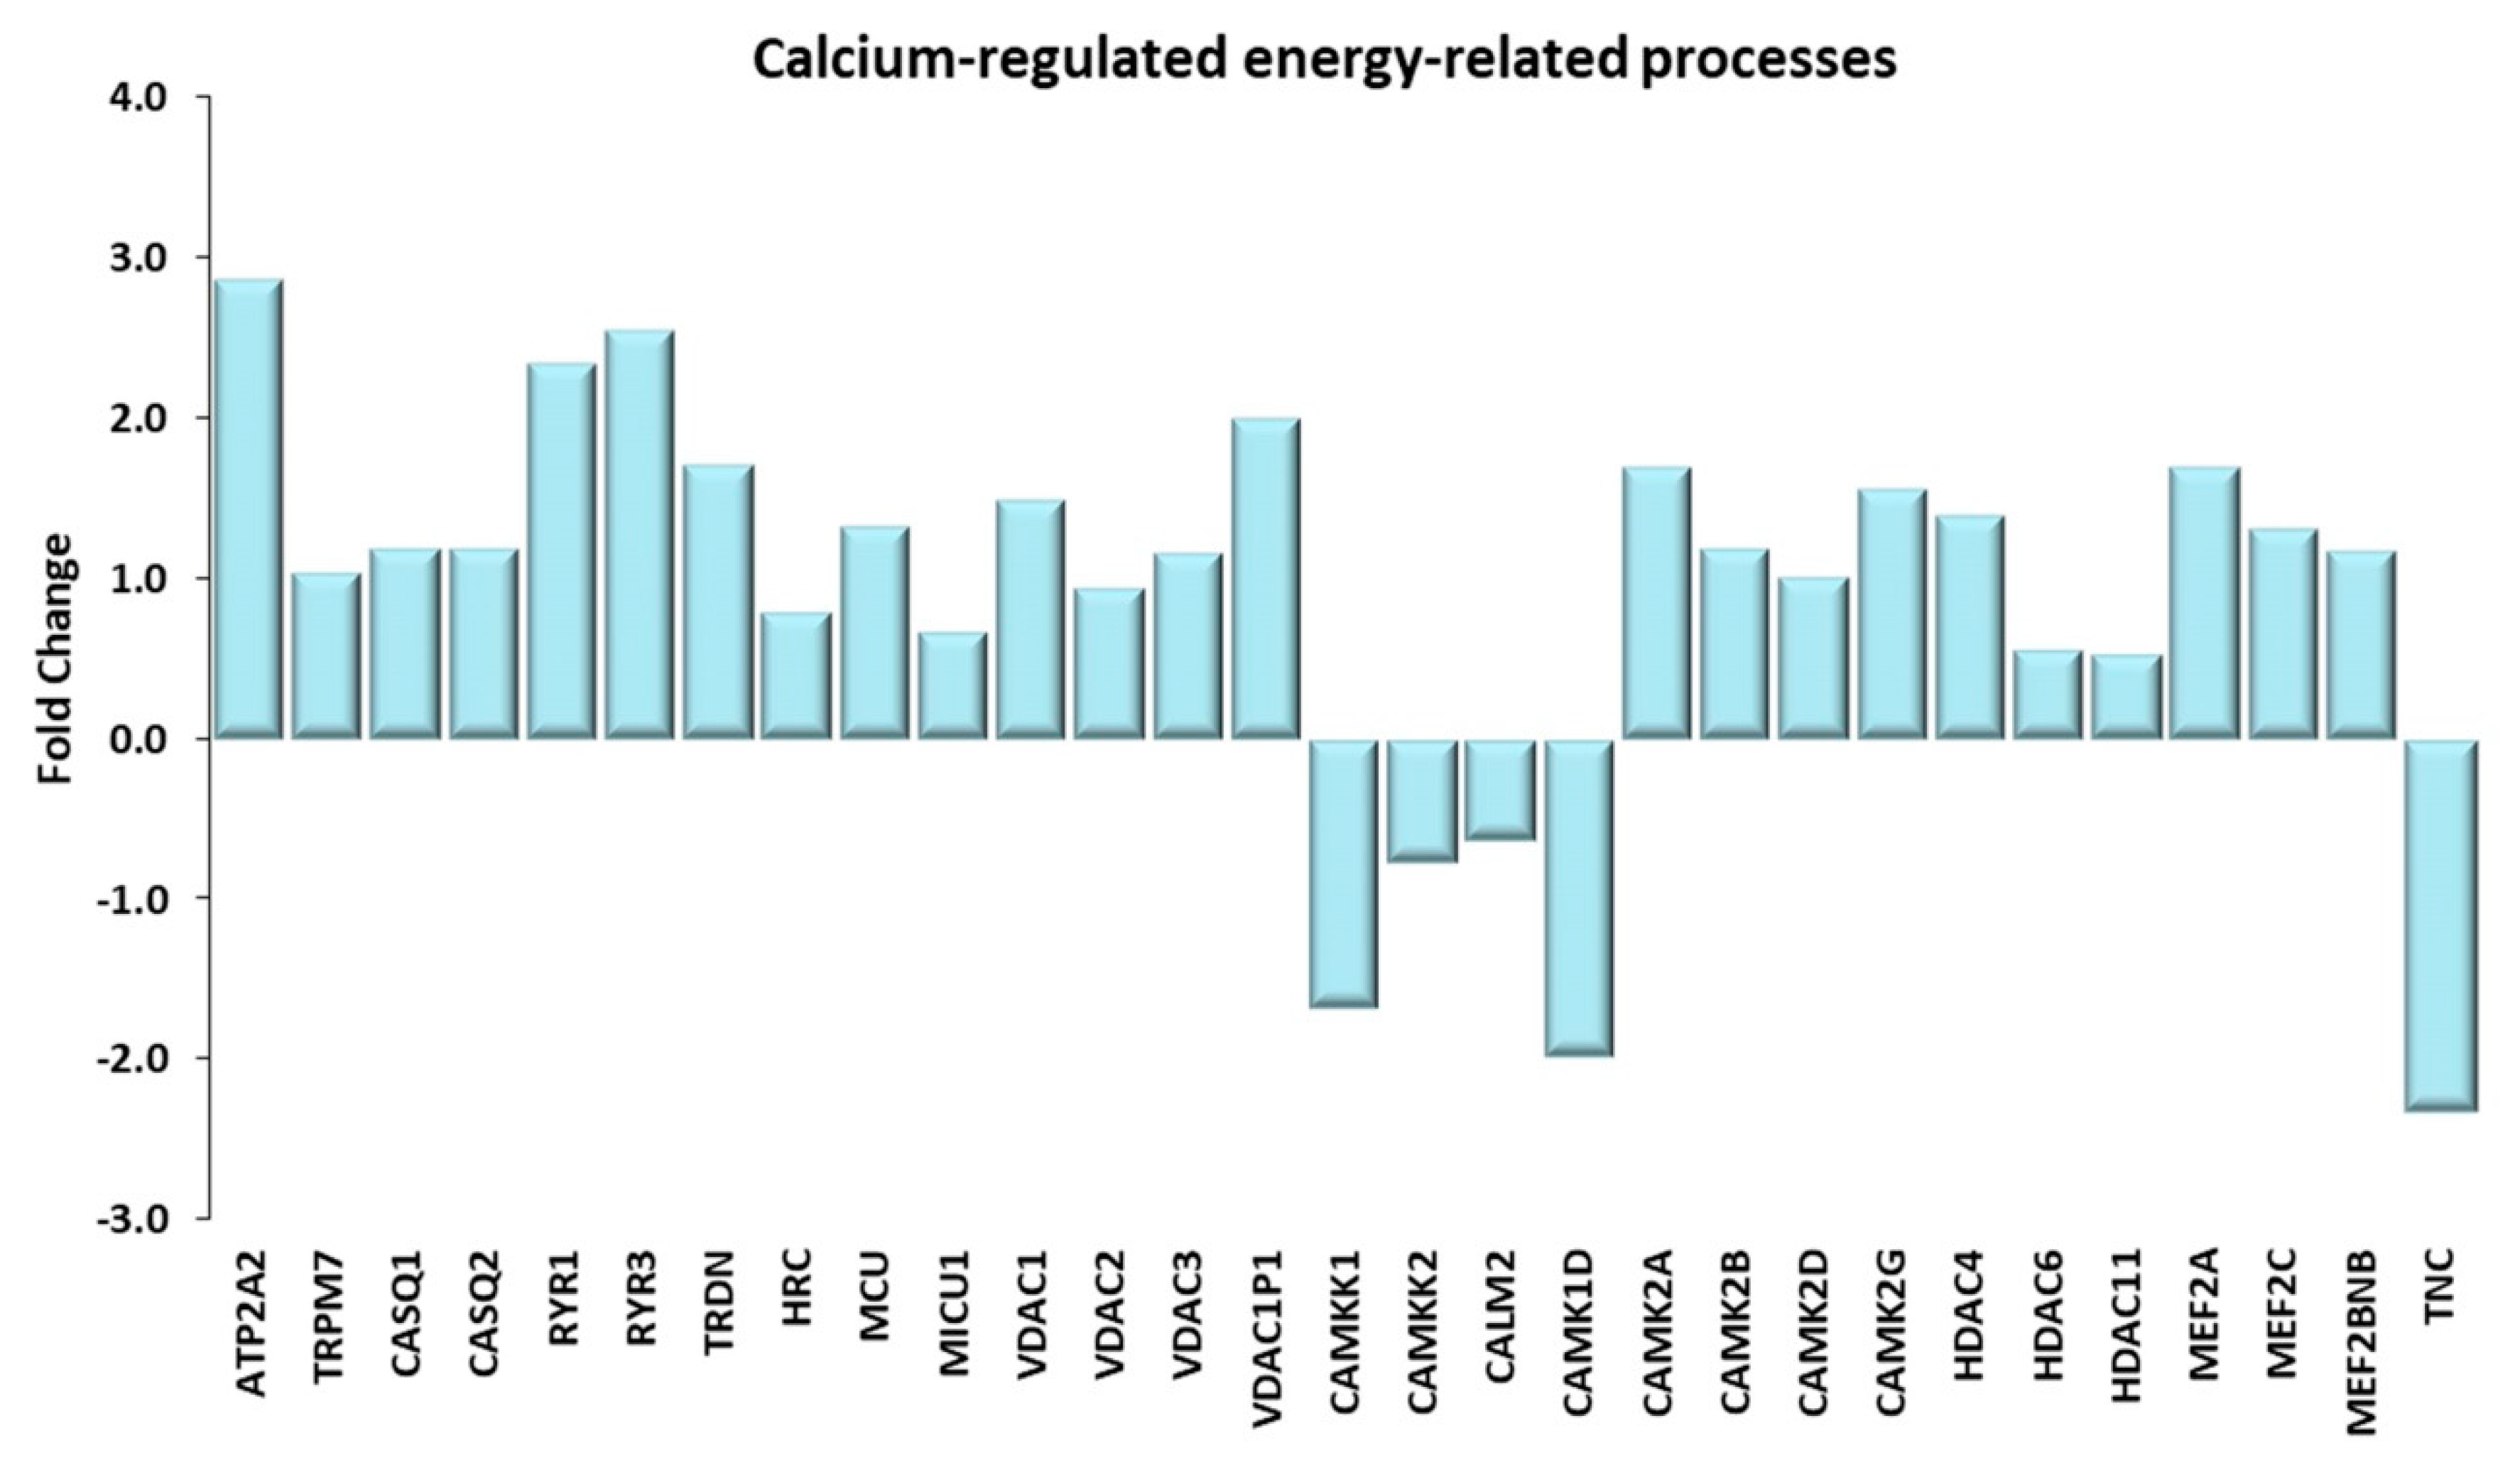
Calcium-regulated energy-related processes. Genes discussed in the text are shown here as fold change in the comparison of TRA and SED subjects. ATP2A2: ATPase sarcoplasmic/endoplasmic reticulum Ca2+ transporting 2 or SERCA2; TRPM7: transient receptor potential cation channel subfamily M member 7; CASQ1, CASQ2: calsequestrin 1, 2; RYR1, RYR3: ryanodine receptor 1, 3; TRDN: triadin; HCR: histidine rich calcium binding protein; MCU: mitochondrial calcium uniporter; MICU1: mitochondrial calcium uptake 1; VDAC1, VDAC2, VDAC3, VDAC1P1: voltage dependent anion channel 1, 2, 3, 1 pseudogene 1; CAMKK1, CAMKK2: calcium/calmodulin dependent protein kinase kinase 1, 2; CALM2: calmodulin 2; CAMK1D: calcium/calmodulin dependent protein kinase ID; CAMK2A, CAMK2B, CAMK2D, CAMK2G: calcium/calmodulin dependent protein kinase II α, II β, II δ, II γ; HDAC4, HDAC6, HDAC11 histone deacetylase 4, 6, 11. MEF2A, MEF2C: myocyte enhancer factor 2A, 2C; MEF2BNB: BLOC-1 related complex subunit 8; TNC, tenascin C.
Figure 8.
Calcium-regulated energy-related processes. Genes discussed in the text are shown here as fold change in the comparison of TRA and SED subjects. ATP2A2: ATPase sarcoplasmic/endoplasmic reticulum Ca2+ transporting 2 or SERCA2; TRPM7: transient receptor potential cation channel subfamily M member 7; CASQ1, CASQ2: calsequestrin 1, 2; RYR1, RYR3: ryanodine receptor 1, 3; TRDN: triadin; HCR: histidine rich calcium binding protein; MCU: mitochondrial calcium uniporter; MICU1: mitochondrial calcium uptake 1; VDAC1, VDAC2, VDAC3, VDAC1P1: voltage dependent anion channel 1, 2, 3, 1 pseudogene 1; CAMKK1, CAMKK2: calcium/calmodulin dependent protein kinase kinase 1, 2; CALM2: calmodulin 2; CAMK1D: calcium/calmodulin dependent protein kinase ID; CAMK2A, CAMK2B, CAMK2D, CAMK2G: calcium/calmodulin dependent protein kinase II α, II β, II δ, II γ; HDAC4, HDAC6, HDAC11 histone deacetylase 4, 6, 11. MEF2A, MEF2C: myocyte enhancer factor 2A, 2C; MEF2BNB: BLOC-1 related complex subunit 8; TNC, tenascin C.
![Ijms 21 03988 g008]()
Figure 9.
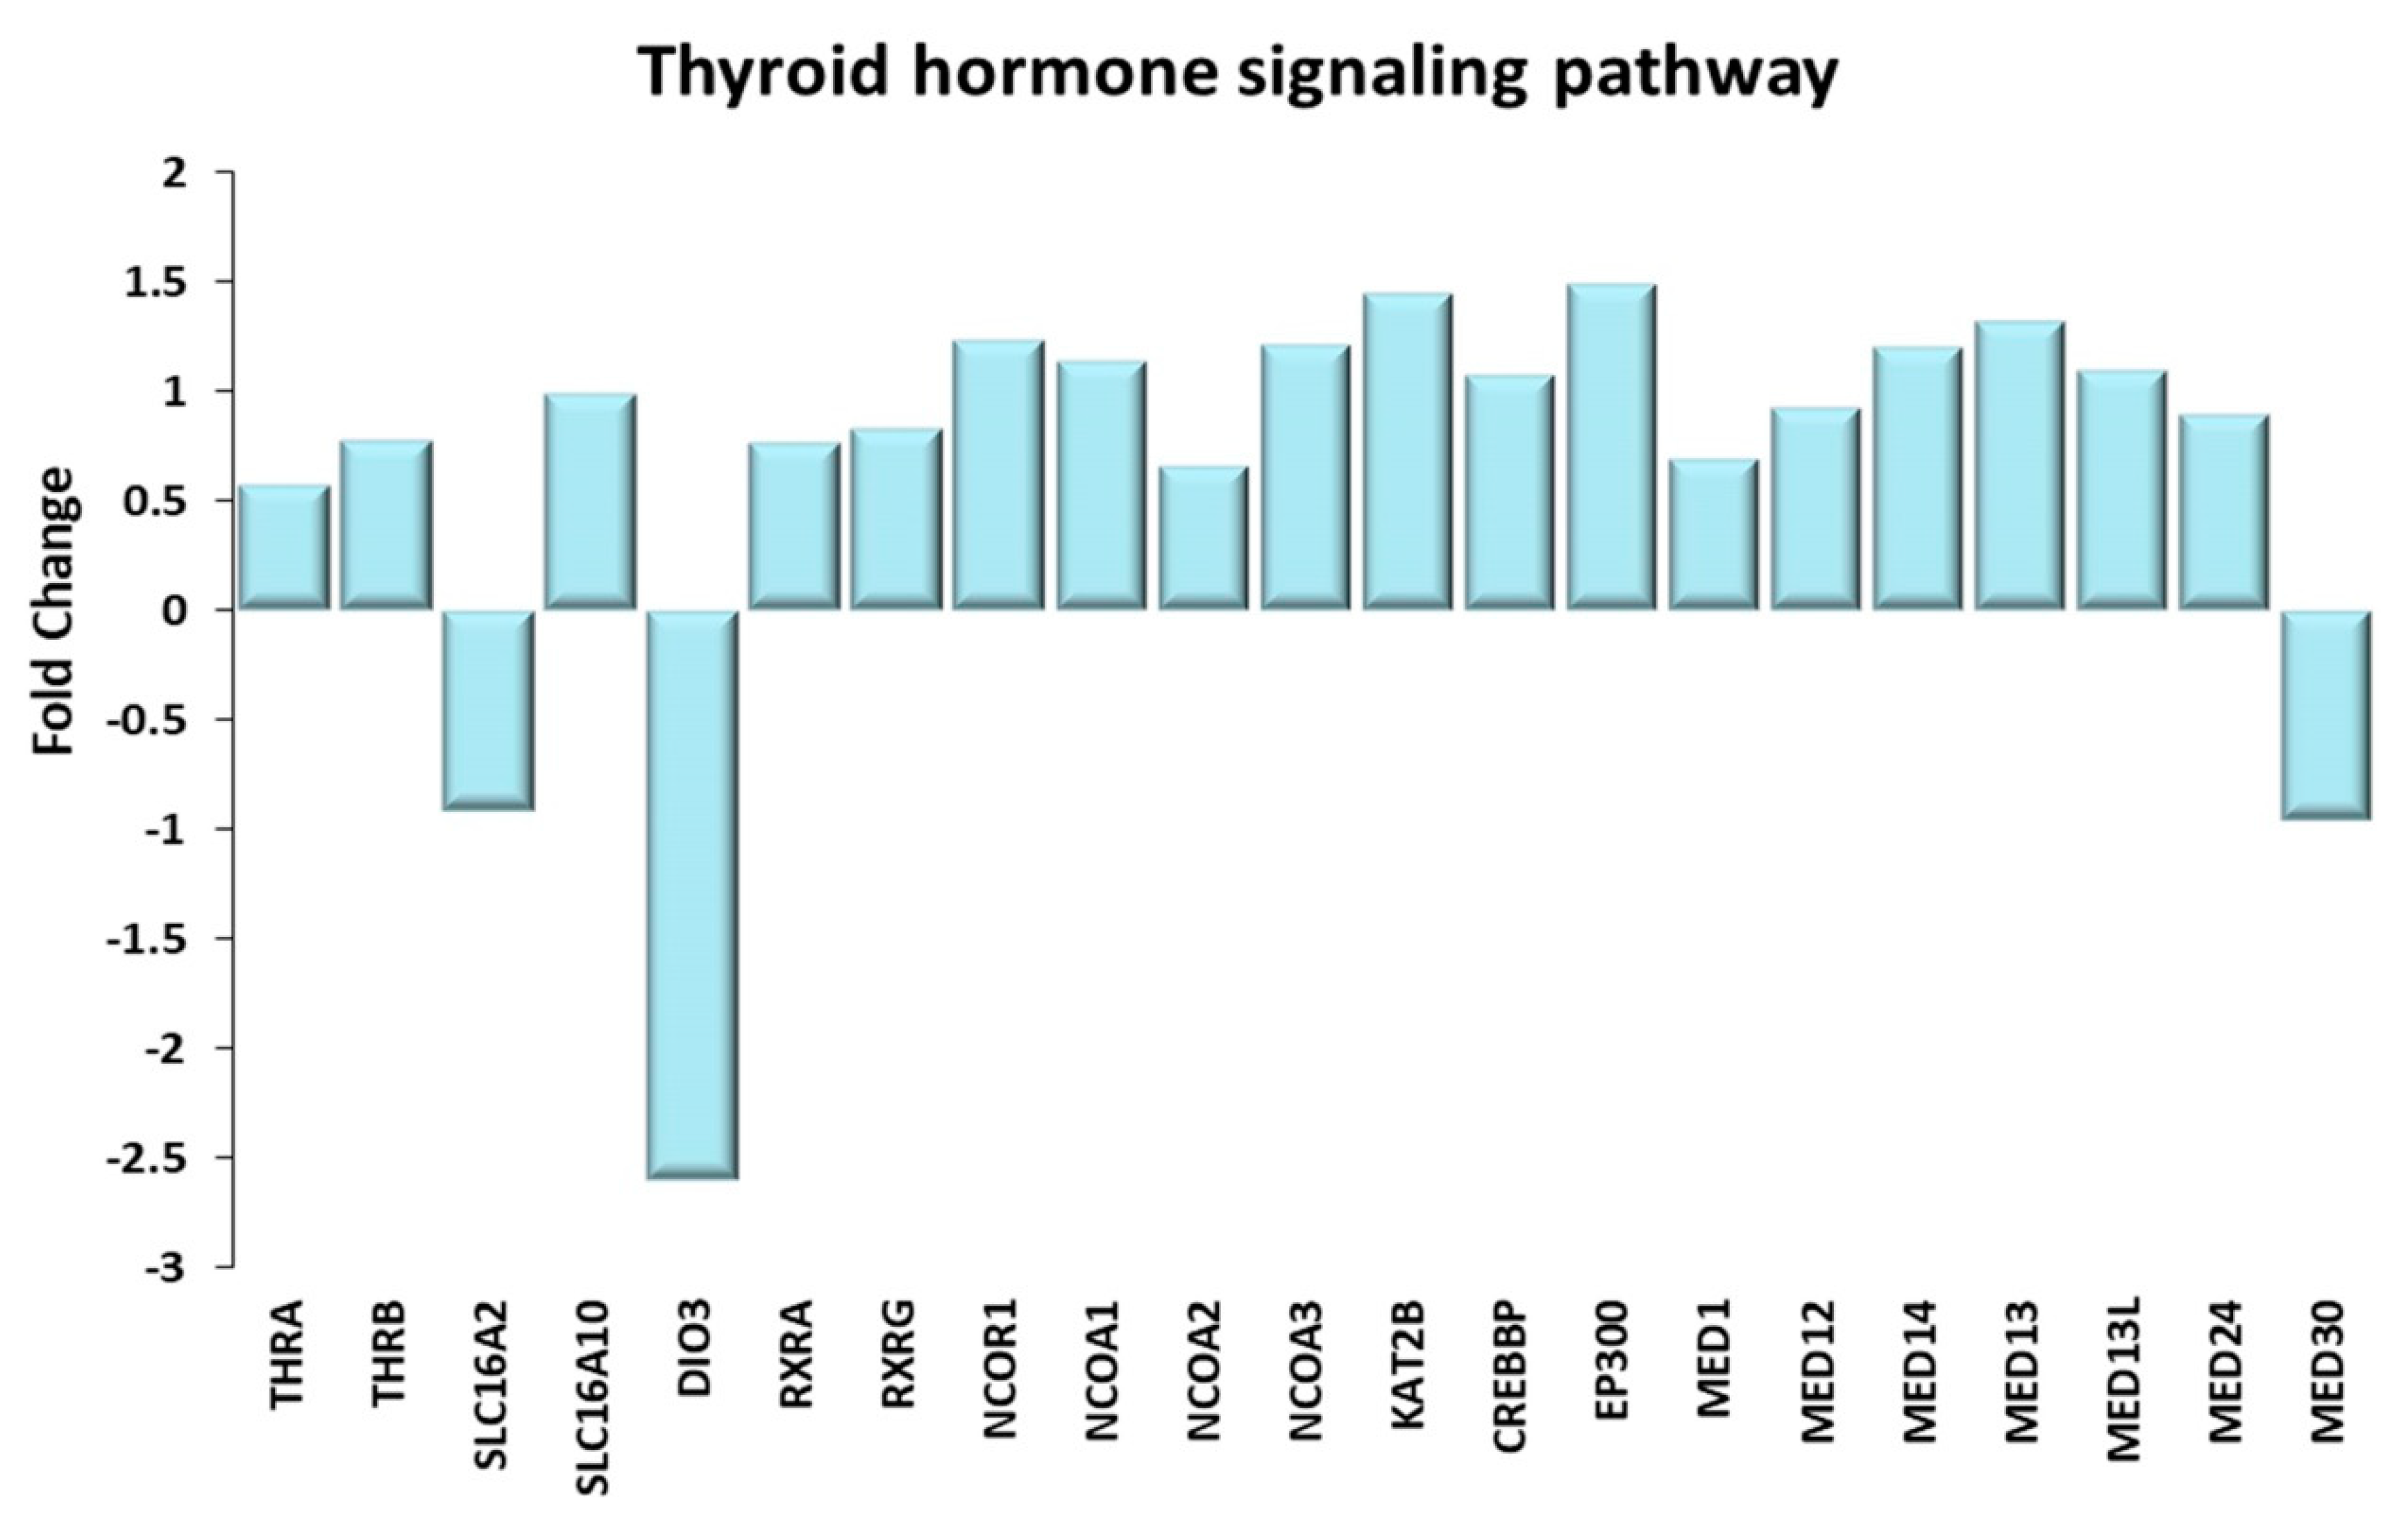
Thyroid hormone signaling pathway. Genes discussed in the text are shown here as fold change in the comparison of TRA and SED subjects. THRA, THRB: thyroid hormone receptor α and β; SLC16A2: solute carrier family 16 member 2 or MCT8; SLC16A10: solute carrier family 16 member 10 or MCT10; DIO3: iodothyronine deiodinase 3; RXRA, RXRG: retinoid X receptor α, γ; NCOR1: nuclear receptor corepressor 1; NCOA1, NCOA2, NCOA3: nuclear receptor coactivator 1, 2, 3; KAT2B: lysine acetyltransferase 2B or PCAF; CREBBP: CREB binding protein or CBP; EP300: E1A binding protein p300 or p300; MED1, MED12, MED13, MED13L, MED14, MED24, MED30: mediator complex subunit 1, 12, 13, 13L, 14, 24, 30 or thyroid hormone receptor (TR)-associated proteins (TRAPs).
Figure 9.
Thyroid hormone signaling pathway. Genes discussed in the text are shown here as fold change in the comparison of TRA and SED subjects. THRA, THRB: thyroid hormone receptor α and β; SLC16A2: solute carrier family 16 member 2 or MCT8; SLC16A10: solute carrier family 16 member 10 or MCT10; DIO3: iodothyronine deiodinase 3; RXRA, RXRG: retinoid X receptor α, γ; NCOR1: nuclear receptor corepressor 1; NCOA1, NCOA2, NCOA3: nuclear receptor coactivator 1, 2, 3; KAT2B: lysine acetyltransferase 2B or PCAF; CREBBP: CREB binding protein or CBP; EP300: E1A binding protein p300 or p300; MED1, MED12, MED13, MED13L, MED14, MED24, MED30: mediator complex subunit 1, 12, 13, 13L, 14, 24, 30 or thyroid hormone receptor (TR)-associated proteins (TRAPs).
Figure 10.
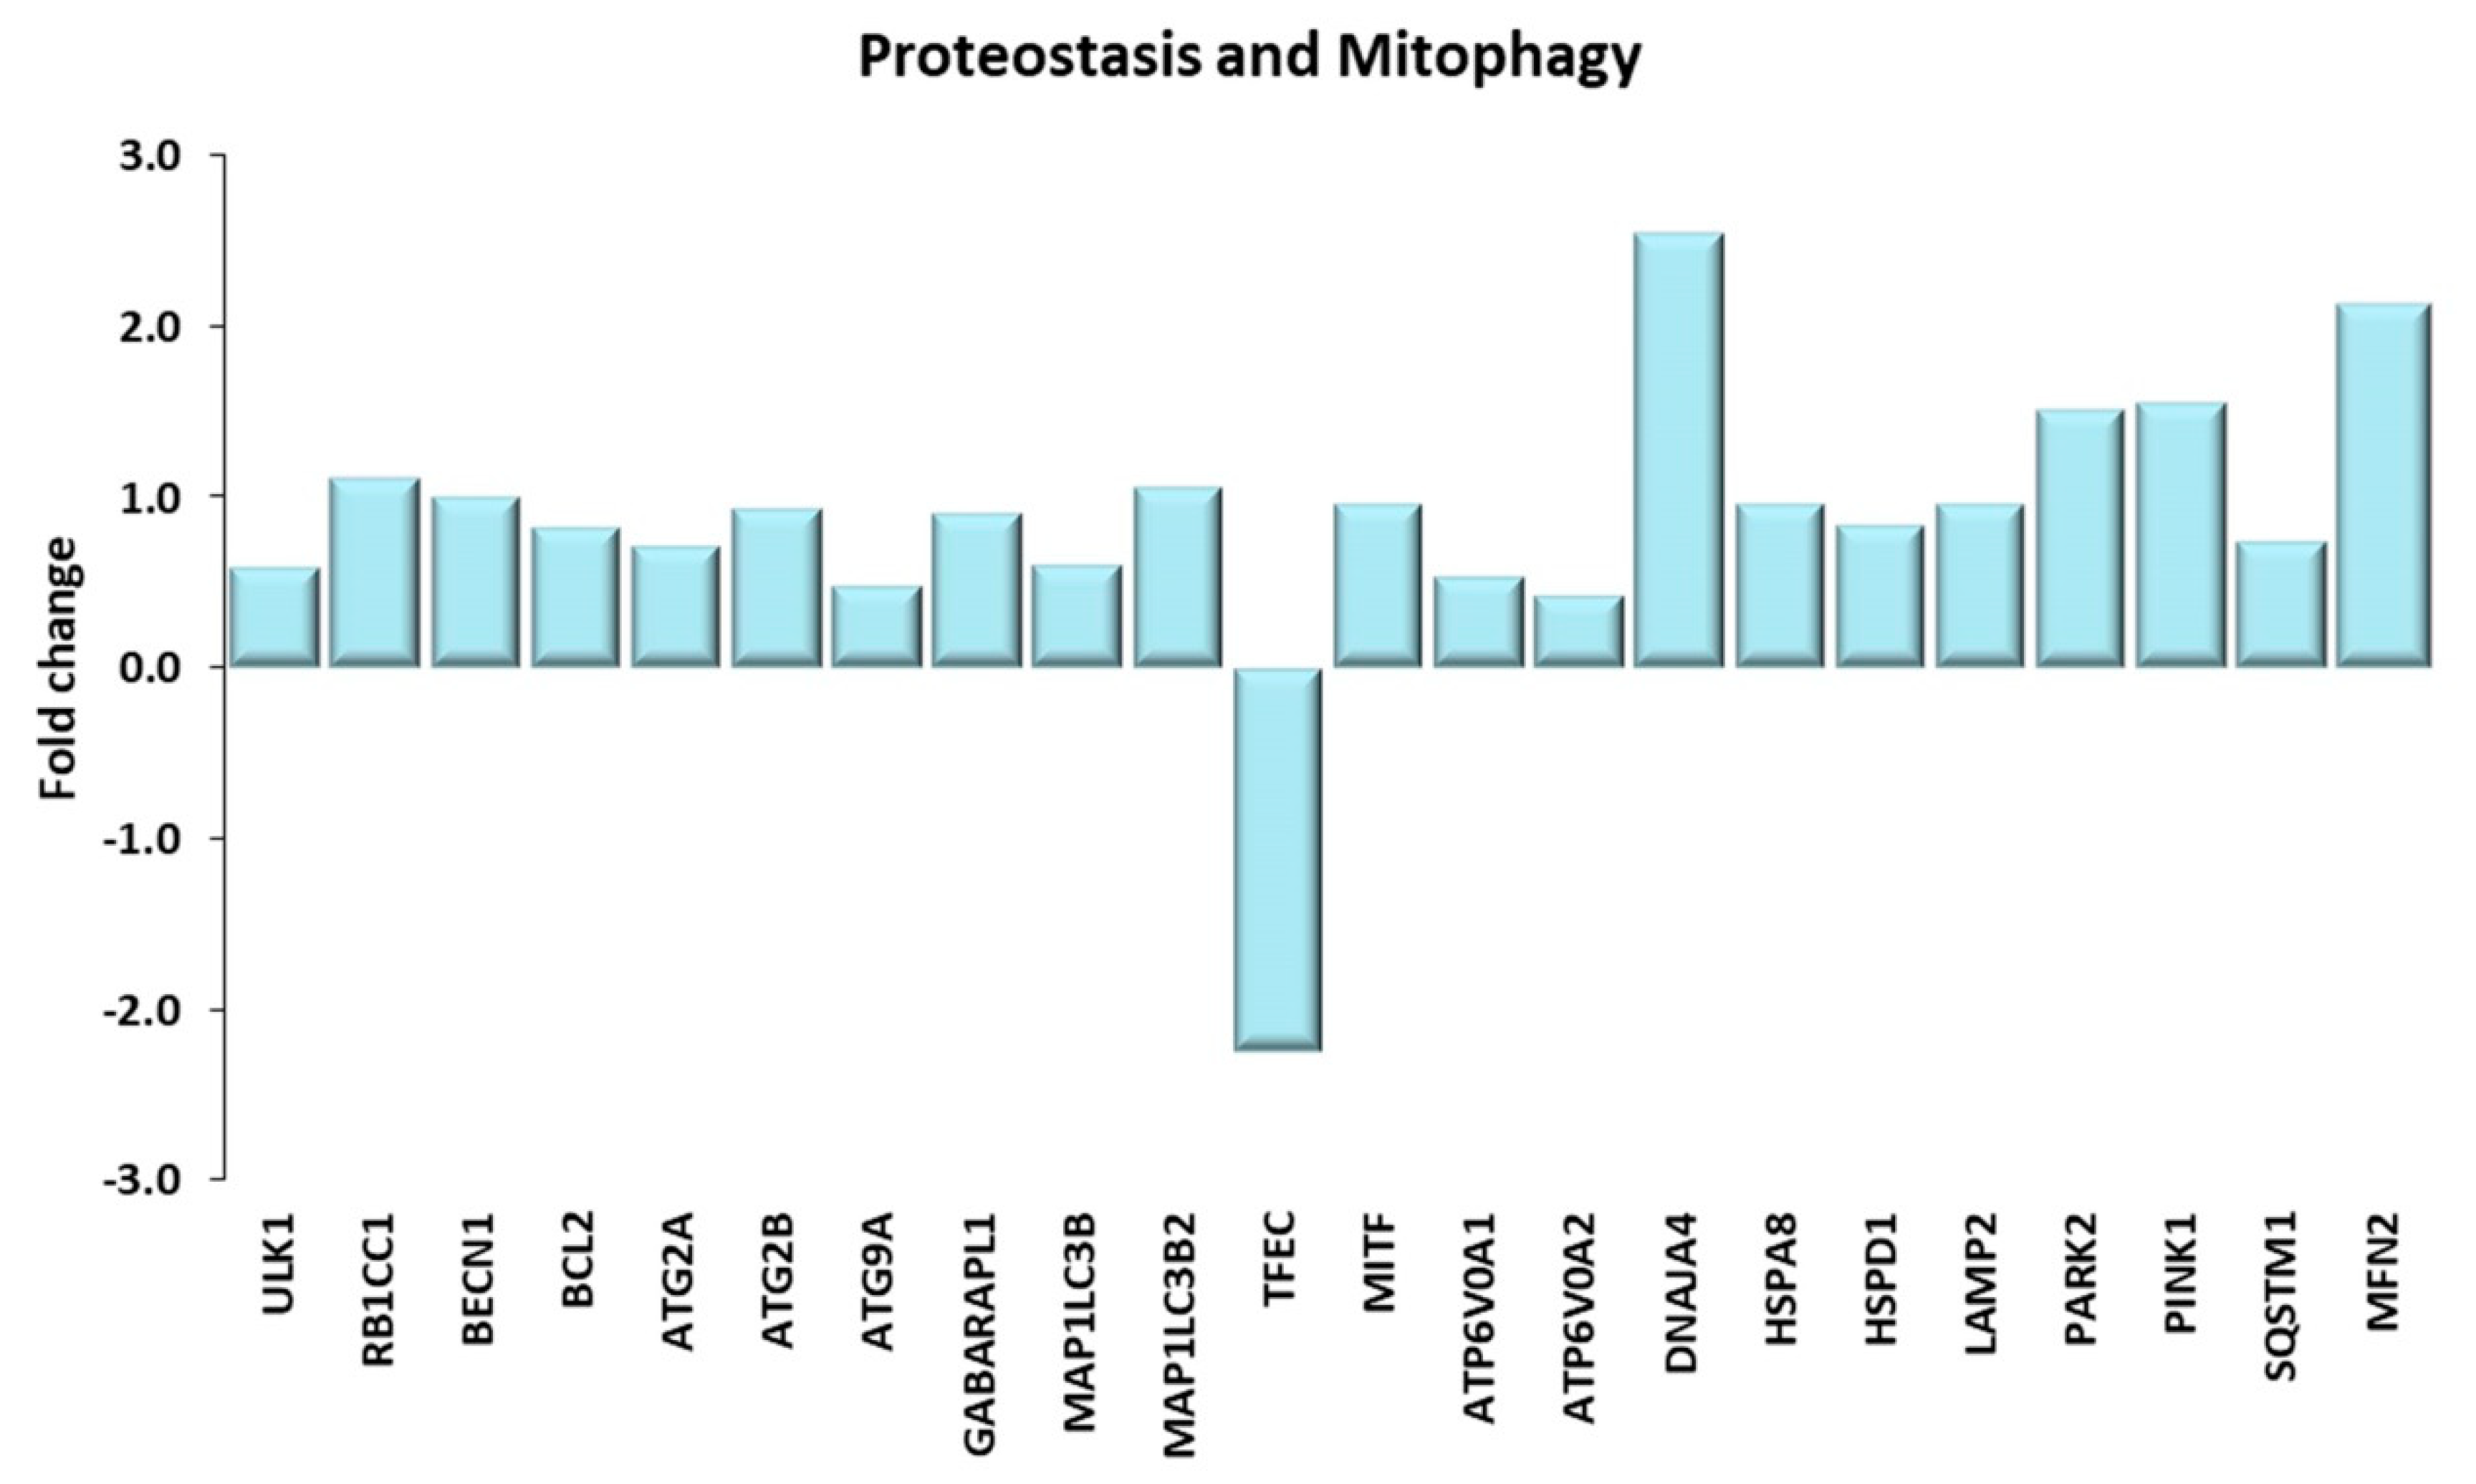
Proteostasis and Mitophagy. Genes discussed in the text are shown here as fold change in the comparison of TRA and SED subjects. ULK1: unc-51 like autophagy activating kinase 1; RB1CC1: RB1 inducible coiled-coil 1 or FIP220; BECN1: beclin1; BCL2: BCL2 apoptosis regulator; ATG2A, ATG2B, ATG9A: autophagy related 2A, 2B, 9A. GABARAPL1: GABA(A) receptor-associated protein like 1; MAP1LC3B, MAP1LC3B2: microtubule associated protein 1 light chain 3 β, β2; TFEC: transcription factor EC; MITF: melanocyte inducing transcription factor; ATP6V0A1, ATP6V0A2: ATPase H+ transporting V0 subunit A1, A2; DNAJA4: DnaJ heat shock protein family (Hsp40) member A4; HSPA8: heat shock protein family A (Hsp70) member 8; HSPD1: heat shock protein family D (Hsp60) member 1; LAMP2: lysosomal associated membrane protein 2; PARK2: parkin RBR E3 ubiquitin protein ligase; PINK1: PTEN induced kinase 1; SQSTM1: sequestosome 1 or p62; MFN2: mitofusin 2.
Figure 10.
Proteostasis and Mitophagy. Genes discussed in the text are shown here as fold change in the comparison of TRA and SED subjects. ULK1: unc-51 like autophagy activating kinase 1; RB1CC1: RB1 inducible coiled-coil 1 or FIP220; BECN1: beclin1; BCL2: BCL2 apoptosis regulator; ATG2A, ATG2B, ATG9A: autophagy related 2A, 2B, 9A. GABARAPL1: GABA(A) receptor-associated protein like 1; MAP1LC3B, MAP1LC3B2: microtubule associated protein 1 light chain 3 β, β2; TFEC: transcription factor EC; MITF: melanocyte inducing transcription factor; ATP6V0A1, ATP6V0A2: ATPase H+ transporting V0 subunit A1, A2; DNAJA4: DnaJ heat shock protein family (Hsp40) member A4; HSPA8: heat shock protein family A (Hsp70) member 8; HSPD1: heat shock protein family D (Hsp60) member 1; LAMP2: lysosomal associated membrane protein 2; PARK2: parkin RBR E3 ubiquitin protein ligase; PINK1: PTEN induced kinase 1; SQSTM1: sequestosome 1 or p62; MFN2: mitofusin 2.
Figure 11.
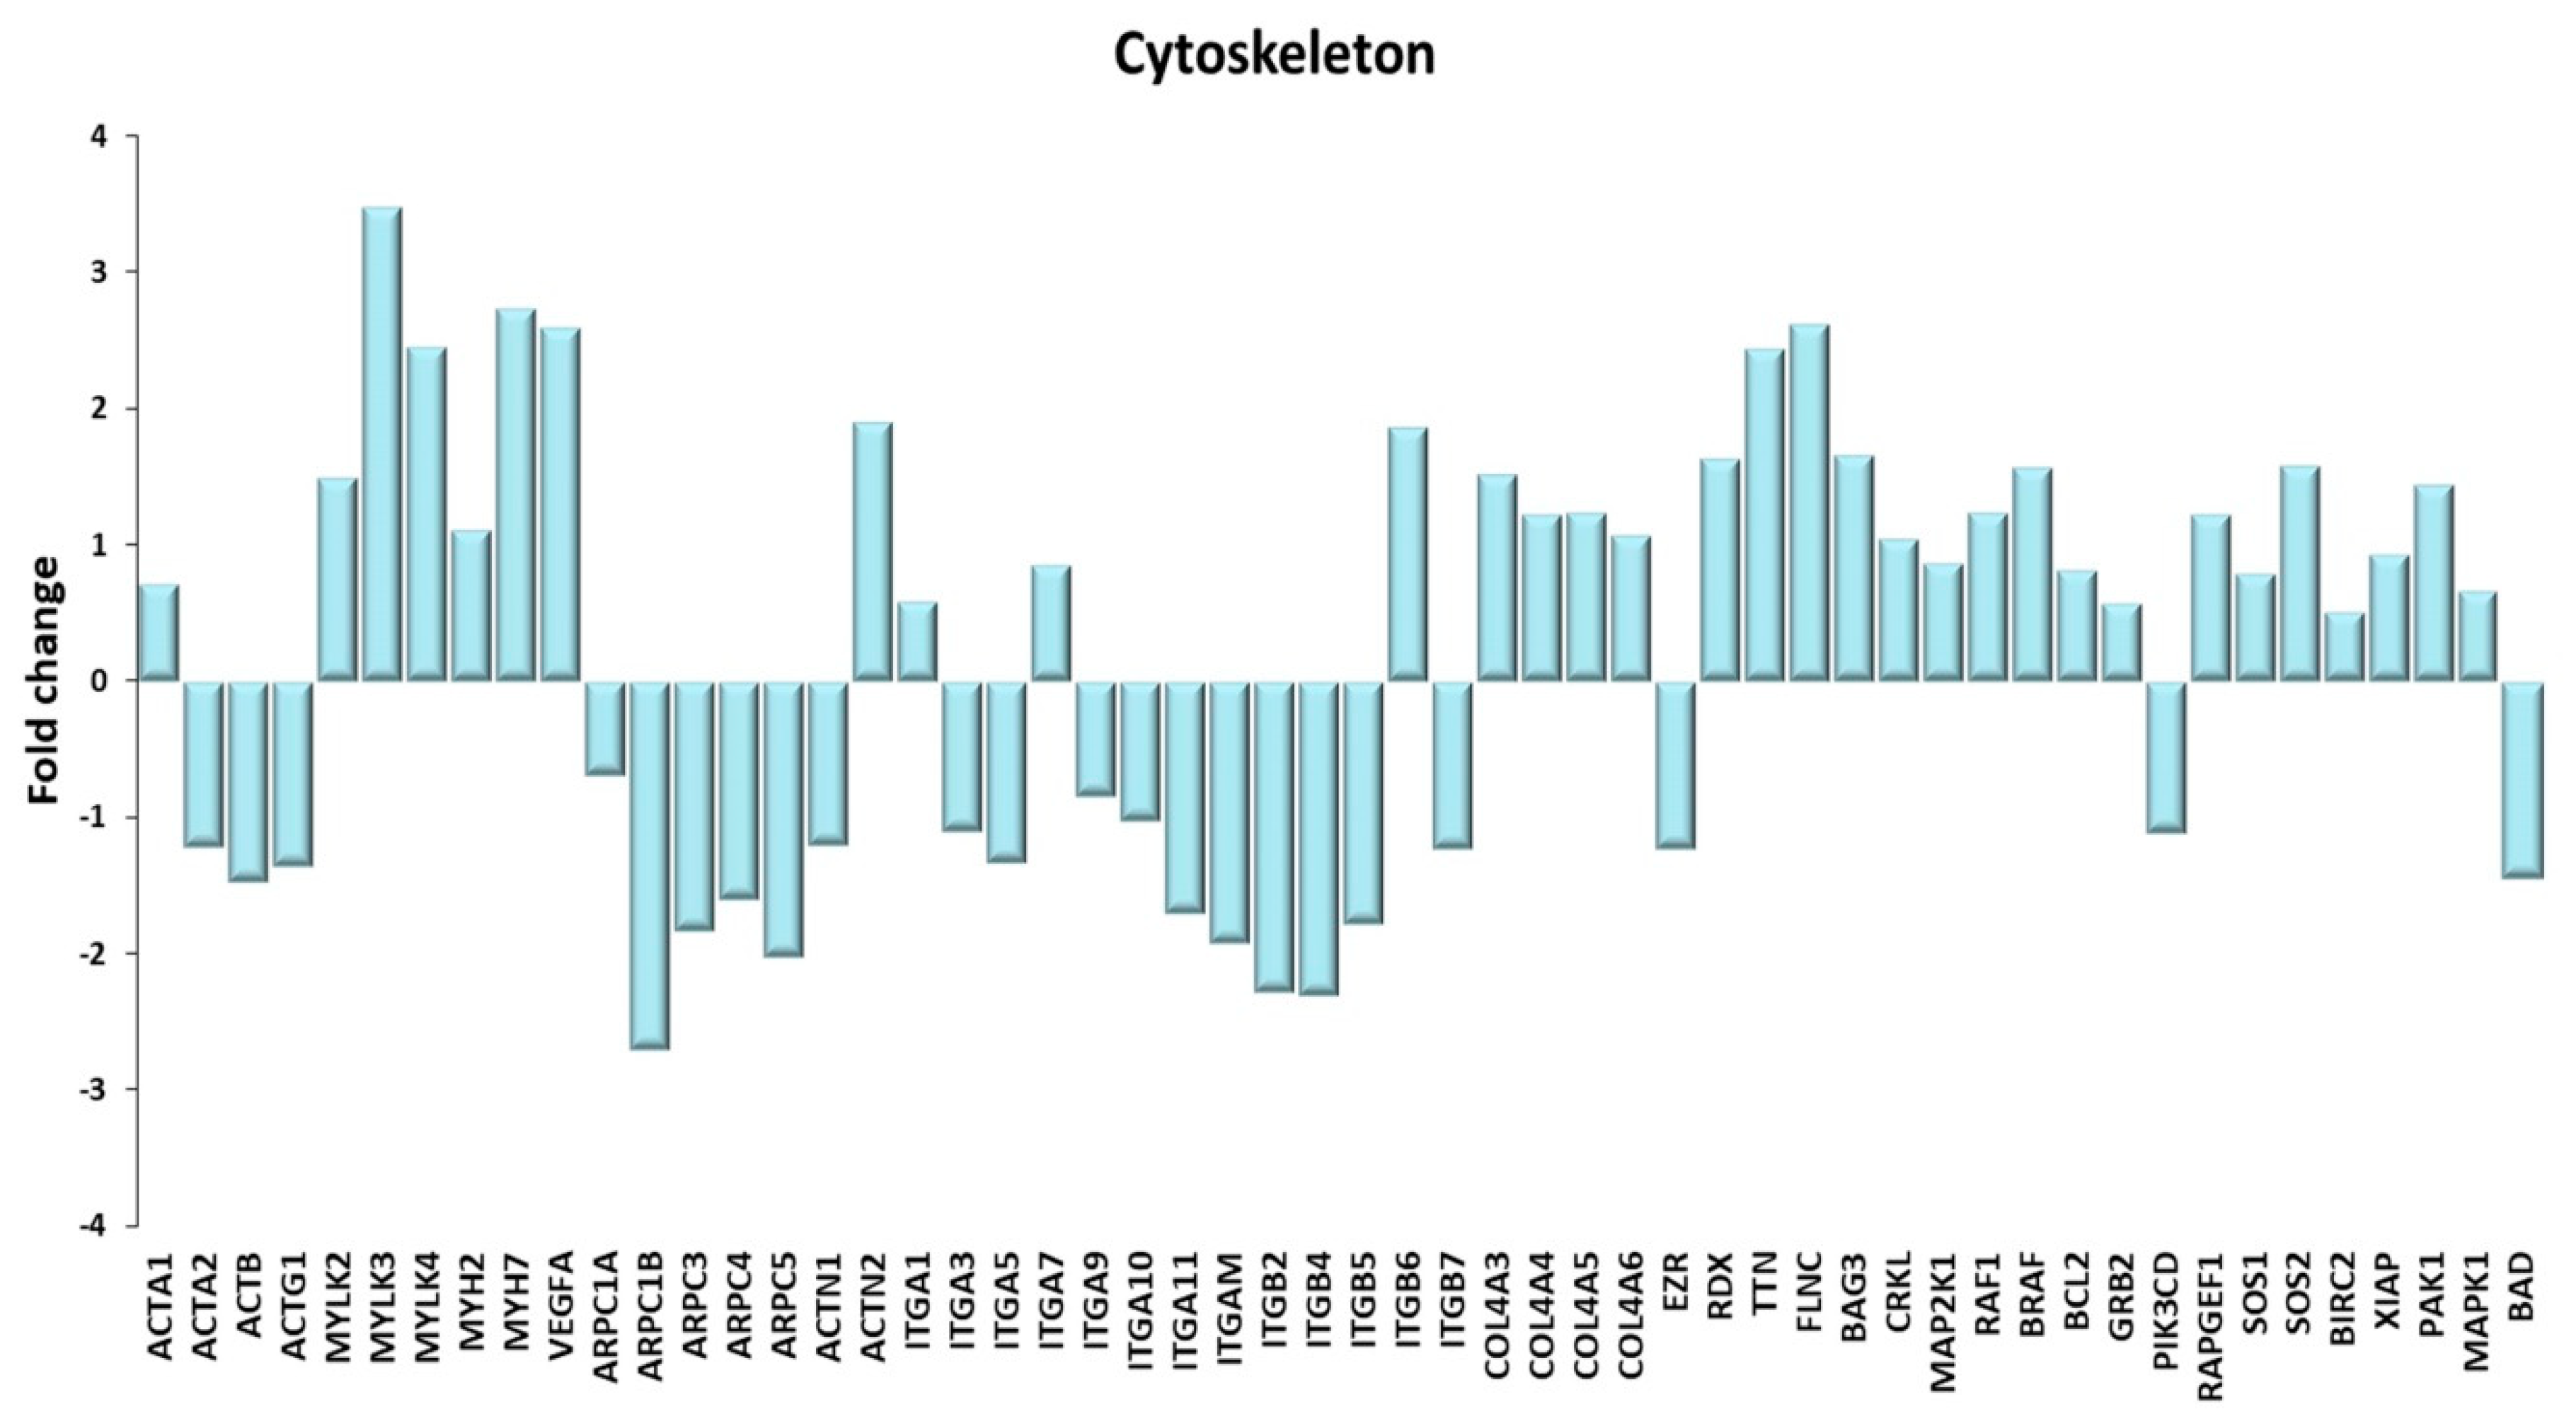
Cytoskeleton. A Genes discussed in the text are shown here as fold change in the comparison of TRA and SED subjects. ACTA1: actin α 1, skeletal muscle; ACTA2: actin α 2, smooth muscle; ACTB: actin β; ACTG1: actin γ 1; MYLK2, MYLK3 myosin light chain kinase 2, 3; MYLK4: myosin light chain kinase family member 4; MYH2, MYH7: myosin heavy chain 2, 7; VEGFA: vascular endothelial growth factor A; ARPC1A, ARPC1B, ARPC3, ARPC4, ARPC5: actin related protein 2/3 complex subunit 1A, 1B, 3, 4, 5; ACTN1, ACTN2: actinin α 1, 2; ITGA1, ITGA3, ITGA5, ITGA7, ITGA9, ITGA10, ITGA11, ITGAM, ITGB2, ITGB4, ITGB5, ITGB6, ITGB7: integrin subunit α1, α3, α5, α7, α9, α10, α11, α M, β2, β4, β5, β6, β7; COL4A3, COL4A4, COL4A5, COL4A6: collagen type IV α3, α4, α5, α6 chain; EZR: ezrin; RDX: radixin; TTN: titin; FLNC: Filamin C; BAG3: BAG co-chaperone 3; CRKL: CRK like proto-oncogene, adaptor protein; MAP2K1: mitogen-activated protein kinase kinase 1; RAF1: Raf-1 proto-oncogene, serine/threonine kinase; BRAF1: B-Raf proto-oncogene, serine/threonine kinase; BCL2: BCL2 apoptosis regulator; GRB2: growth factor receptor bound protein 2; PIK3CD: phosphatidylinositol-4,5-bisphosphate 3-kinase catalytic subunit δ; RAPGEF1: Rap guanine nucleotide exchange factor 1; SOS1, SOS2: SOS Ras/Rac guanine nucleotide exchange factor 1, 2; BIRC2: baculoviral IAP repeat containing 2; XIAP: X-linked inhibitor of apoptosis; PAK1: p21 (RAC1) activated kinase 1; MAPK1: mitogen-activated protein kinase 1; BAD: BCL2 associated agonist of cell death.
Figure 11.
Cytoskeleton. A Genes discussed in the text are shown here as fold change in the comparison of TRA and SED subjects. ACTA1: actin α 1, skeletal muscle; ACTA2: actin α 2, smooth muscle; ACTB: actin β; ACTG1: actin γ 1; MYLK2, MYLK3 myosin light chain kinase 2, 3; MYLK4: myosin light chain kinase family member 4; MYH2, MYH7: myosin heavy chain 2, 7; VEGFA: vascular endothelial growth factor A; ARPC1A, ARPC1B, ARPC3, ARPC4, ARPC5: actin related protein 2/3 complex subunit 1A, 1B, 3, 4, 5; ACTN1, ACTN2: actinin α 1, 2; ITGA1, ITGA3, ITGA5, ITGA7, ITGA9, ITGA10, ITGA11, ITGAM, ITGB2, ITGB4, ITGB5, ITGB6, ITGB7: integrin subunit α1, α3, α5, α7, α9, α10, α11, α M, β2, β4, β5, β6, β7; COL4A3, COL4A4, COL4A5, COL4A6: collagen type IV α3, α4, α5, α6 chain; EZR: ezrin; RDX: radixin; TTN: titin; FLNC: Filamin C; BAG3: BAG co-chaperone 3; CRKL: CRK like proto-oncogene, adaptor protein; MAP2K1: mitogen-activated protein kinase kinase 1; RAF1: Raf-1 proto-oncogene, serine/threonine kinase; BRAF1: B-Raf proto-oncogene, serine/threonine kinase; BCL2: BCL2 apoptosis regulator; GRB2: growth factor receptor bound protein 2; PIK3CD: phosphatidylinositol-4,5-bisphosphate 3-kinase catalytic subunit δ; RAPGEF1: Rap guanine nucleotide exchange factor 1; SOS1, SOS2: SOS Ras/Rac guanine nucleotide exchange factor 1, 2; BIRC2: baculoviral IAP repeat containing 2; XIAP: X-linked inhibitor of apoptosis; PAK1: p21 (RAC1) activated kinase 1; MAPK1: mitogen-activated protein kinase 1; BAD: BCL2 associated agonist of cell death.
![Ijms 21 03988 g011]()
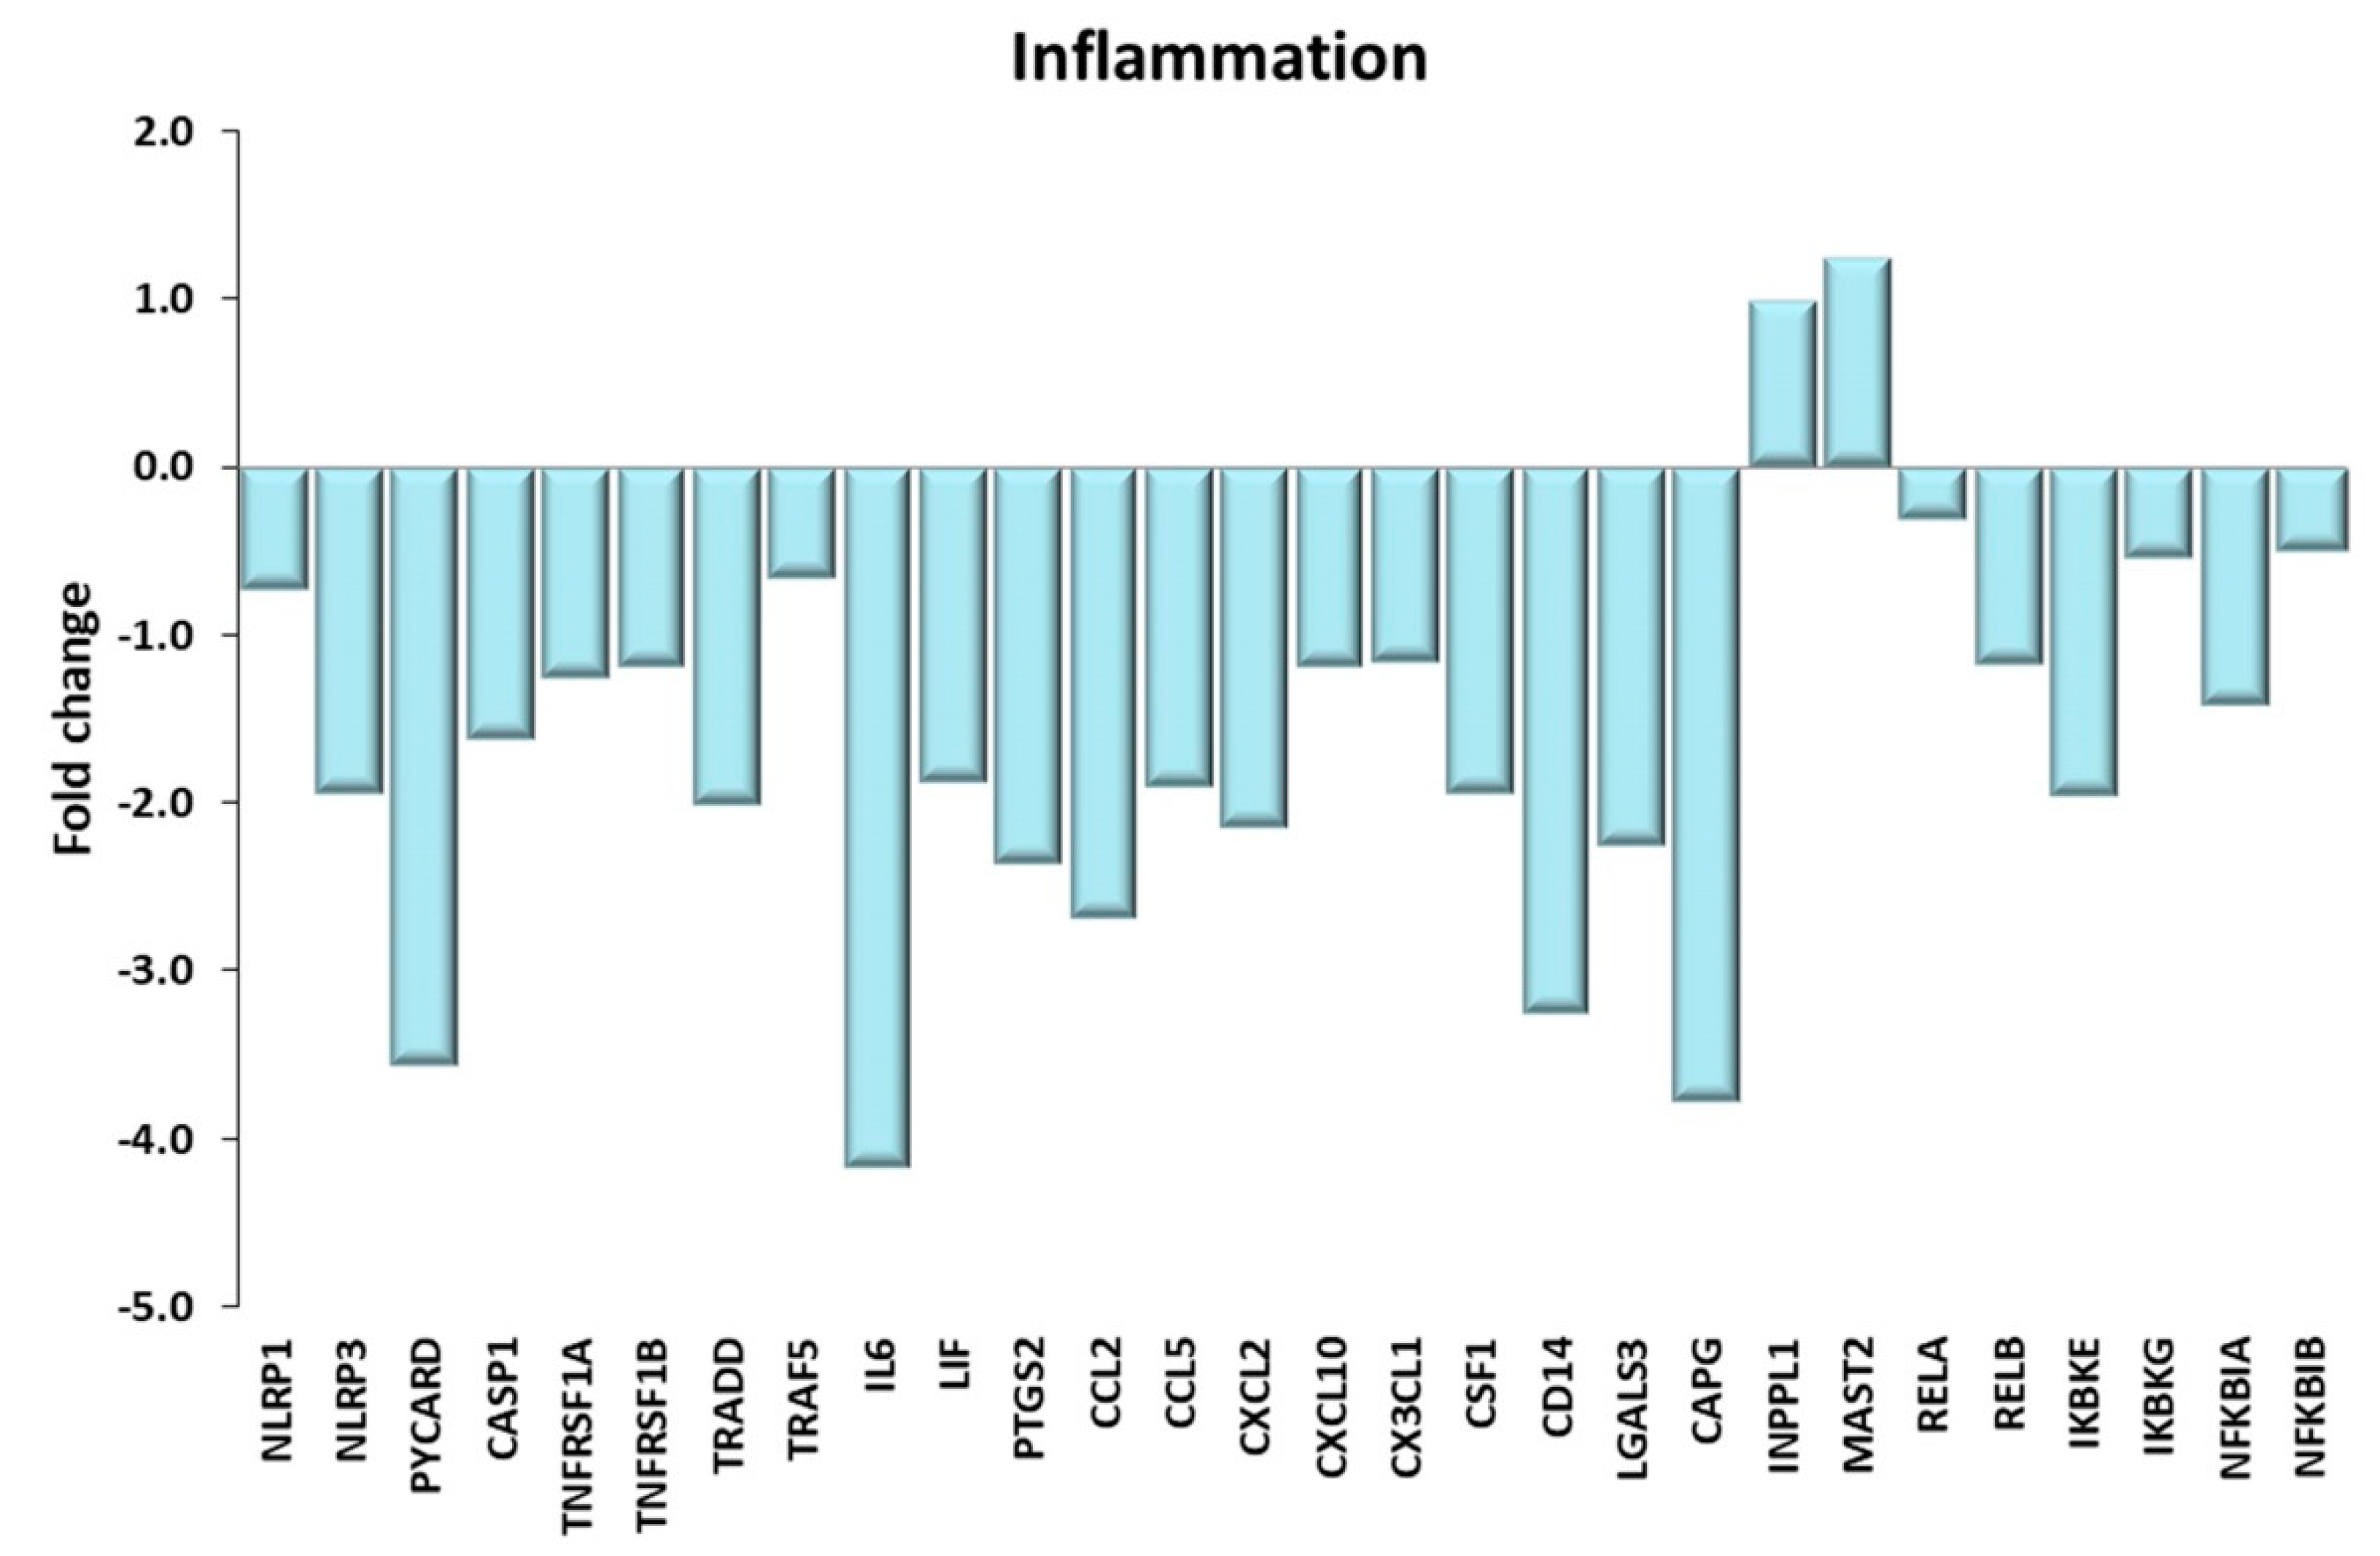
Figure 12.
Inflammation. Genes discussed in the text are shown here as fold change in the comparison of TRA and SED subjects. NLRP1, NLRP3: NLR family pyrin domain containing 1, 3; PYCARD: PYD and CARD domain containing or ASC; CASP1: caspase1; TNFRSF1A, TNFRSF1B: TNF receptor superfamily member 1A, 1B; TRADD: TNFRSF1A associated via death domain. TRAF5: TNF receptor associated factor 5; IL6: interleukin 6; LIF: LIF interleukin 6 family cytokine; PTGS2: prostaglandin-endoperoxide synthase 2; CCL2, CCL5: C-C motif chemokine ligand 2, 5; CXCL2, CXCL10: C-X-C motif chemokine ligand 2, 10; CX3CL1: C-X3-C motif chemokine ligand 1; CSF1: colony stimulating factor 1; CD14: CD14 molecule; LGALS3: galectin 3; CAPG: capping actin protein, gelsolin like; INPPL1: inositol polyphosphate phosphatase like 1; MAST2: microtubule associated serine/threonine kinase 2; RELA, RELB: RELA, RELB proto-oncogene, NF-kB subunit; IKBKE, IKBKG: inhibitor of nuclear factor κ B kinase subunit ε, γ; NFKBIA, NFKBIB: NFKB inhibitor α, β.
![Ijms 21 03988 g012]()
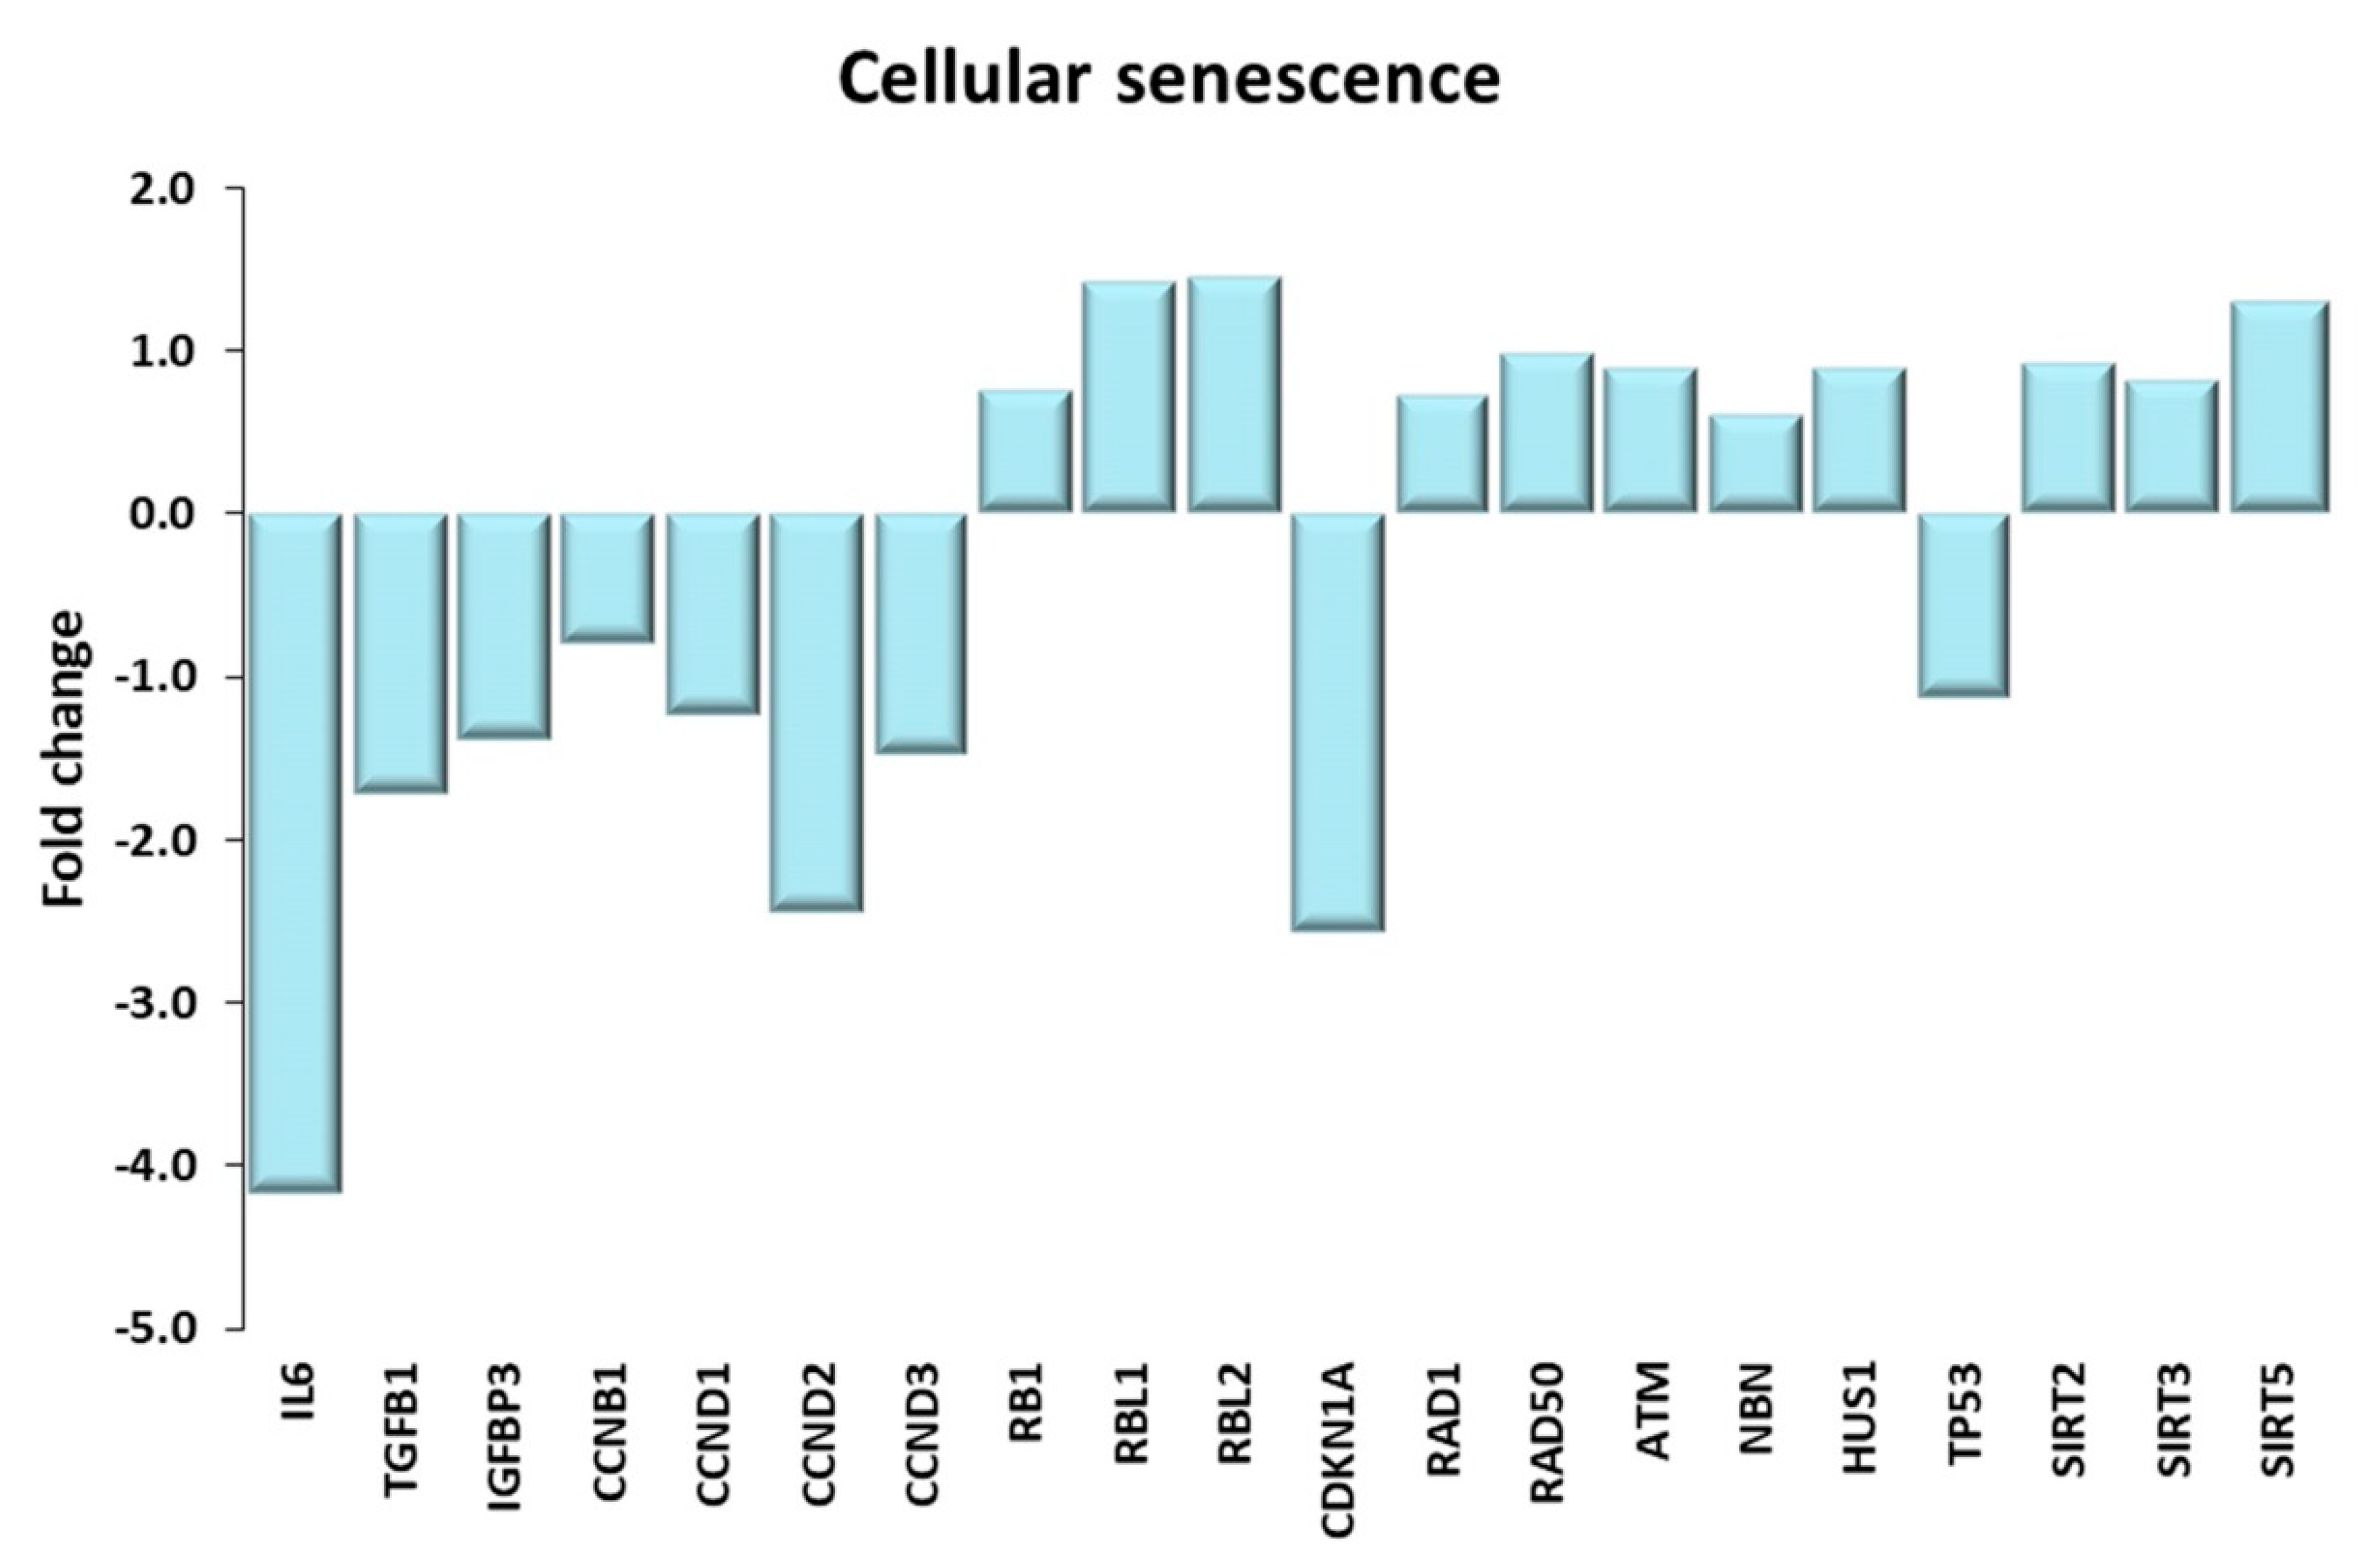
Figure 13.
Cellular senescence. Genes discussed in the text are shown here as fold change in the comparison of TRA and SED subjects. IL6: interleukin 6, TGFB1: transforming growth factor beta 1; IGFBP3 insulin like growth factor binding protein 3; CCNB1, CCND1, CCND2, CCND3: cyclin B1, D1, D2, D3; RB1: RB transcriptional corepressor 1; RBL1, RBL2: RB transcriptional corepressor like 1, 2. CDKN1A: cyclin dependent kinase inhibitor 1A; RAD1: RAD1 checkpoint DNA exonuclease; RAD50: RAD50 double strand break repair protein; ATM: ATM serine/threonine kinase; NBN: nibrin; HSU1: HUS1 checkpoint clamp component; TP53: tumor protein p53; SIRT2, SIRT3, SIRT5: sirtuin 2, 3, 5.
Table 1.
Anthropometric characteristics of healthy sedentary subjects.
Table 1.
Anthropometric characteristics of healthy sedentary subjects.
| Code | Age (years) | Height (cm) | Body Mass (kg) | Body Mass Index (BMI) |
|---|
| L167 | 70 | 181 | 81 | 24.7 |
| L178 | 76 | 173 | 77 | 25.7 |
| L179 | 72 | 160 | 83 | 32.4 |
| L180 | 75 | 178 | 89 | 28.1 |
| L181 | 71 | 170 | 78 | 27.0 |
Table 2.
Anthropometric and training characteristics of trained subjects.
Table 2.
Anthropometric and training characteristics of trained subjects.
| Code | Age (years) | Height (cm) | Body Mass (kg) | BMI | Resistance Training (%) | Endurance Training (%) | Mean Duration of Sessions (hrs) | Sessions/Week (no.) | Duration/Week (hrs) |
|---|
| L182 | 68.5 | 169.5 | 81.6 | 28.4 | 100 | 0 | 1.5 | 3 | 4.5 |
| L183 | 65.0 | 184.0 | 99.0 | 29.2 | 89 | 11 | 3.0 | 5 | 9.0 |
| L184 | 70.6 | 174.0 | 78.5 | 25.8 | 100 | 0 | 2.3 | 6 | 6.9 |
| L185 | 69.3 | 184.0 | 87.0 | 25.7 | 65 | 35 | 2.0 | 3 | 6.0 |
| L186 | 68.2 | 176.0 | 73.6 | 23.8 | 13 | 87 | 2.0 | 4 | 8.0 |
| L187 | 65.5 | 174.2 | 73.4 | 24.2 | 0 | 100 | 3.0 | 8 | 14.0 |
| L188 | 66.0 | 174.0 | 76.0 | 25.1 | 14 | 86 | 1.5 | 4 | 6.0 |
| L189 | 66.8 | 180.0 | 93.0 | 28.7 | 14 | 86 | 5.5 | 13 | 24.5 |
| L190 | 79.7 | 170.0 | 67.0 | 23.2 | 0 | 100 | 2.0 | 6 | 12.0 |
| Mean ± SD | 68.84 ± 4.5 | 176.19 ± 5.4 | 81.01 ± 10.3 | 26.01 ± 2.2 | | | 2.53 ± 1.2 | 5.78 ± 3.1 | 10.1 ± 6.2 |
Table 3.
Muscle performance of trained subjects.
Table 3.
Muscle performance of trained subjects.
| Code | Knee Extension Torque Left Leg (N∙m) | Knee Extension Torque Right Leg (N∙m) | Knee Extension Torque Left Leg (N∙m/kg) | Knee Extension Torque Right Leg (N∙m/kg) |
|---|
| L182 | 147.0 | 176.0 | 1.80 | 2.16 |
| L183 | 215.0 | 215.0 | 2.17 | 2.17 |
| L184 * | | | | |
| L185 | 142.0 | 196.0 | 1.63 | 1.07 |
| L186 | 164.0 | 202.0 | 2.23 | 2.74 |
| L187 | 167.0 | 175.0 | 2.28 | 2.38 |
| L188 | 164.0 | 192.0 | 2.16 | 2.53 |
| L189 | 191.0 | 215.0 | 2.05 | 2.31 |
| L190 | 157.0 | 175.0 | 2.34 | 2.61 |
| Mean ± SD | 168.38 ± 23.9 | 193.25 ± 16.9 | 2.08 ± 0.2 | 2.25 ± 0.5 |
Table 4.
Mean myofiber diameter calculated on skeletal muscle biopsies from RT and ET trained subjects.
Table 4.
Mean myofiber diameter calculated on skeletal muscle biopsies from RT and ET trained subjects.
| Fiber Diameter | RT | ET | p Value |
|---|
| Overall (mean ± SD) | 70.30 ± 8.7 | 58.6 ± 6.6 | 0.0129 |
| Slow type (mean ± SD) | 66.14 ± 7.1 | 63.9 ± 6.4 | 0.5180 |
| % | 68 | 67 | |
| Fast type (mean ± SD) | 74.62 ± 9.9 | 56.27 ± 8.1 | 0.0019 |
| % | 32 | 34 | |
Table 5.
Genes characterizing the two groups of trained subjects.
Table 5.
Genes characterizing the two groups of trained subjects.
| Gene Name | logFC edgeR | logCPM edgeR | p Value edgeR | FDR edgeR | logFC Limma | AveExpr Limma | t Limma | p.Value Limma | adj.p.Val Limma | L187 | L188 | L189 | L182 | L183 | L184 | L185 |
|---|
| NR4A3 | 5.58938 | 8.05454 | 0.00000 | 0.00006 | 5.84709 | 6.64827 | 12.82643 | 0.00000 | 0.00086 | 610.02 | 880.91 | 1891.64 | 29.65 | 8.81 | 19.26 | 19.24 |
| ANKRD1 | 5.44798 | 9.39036 | 0.00000 | 0.00001 | 6.18242 | 7.78585 | 13.94543 | 0.00000 | 0.00049 | 4183.80 | 1110.87 | 3514.04 | 38.07 | 22.20 | 39.67 | 45.05 |
| ATF3 | 5.30250 | 8.04398 | 0.00000 | 0.00220 | 6.16321 | 6.54035 | 19.07142 | 0.00000 | 0.00023 | 1513.03 | 685.26 | 1144.91 | 19.77 | 9.18 | 18.19 | 14.85 |
| OTUD1 | 4.66495 | 9.20151 | 0.00000 | 0.00598 | 5.61890 | 7.95328 | 14.97490 | 0.00000 | 0.00037 | 3795.33 | 1300.29 | 2408.51 | 33.82 | 41.22 | 78.98 | 42.52 |
| FOS | 4.32165 | 8.69905 | 0.00006 | 0.03627 | 5.53600 | 5.84895 | 11.70230 | 0.00000 | 0.00166 | 820.07 | 383.46 | 435.27 | 6.70 | 11.47 | 6.30 | 30.46 |
| XIRP1 | 3.73963 | 11.72048 | 0.00000 | 0.00089 | 4.47180 | 11.11266 | 15.02730 | 0.00000 | 0.00037 | 18,249.37 | 7680.84 | 15,550.17 | 566.93 | 457.31 | 546.19 | 822.20 |
| HBEGF | 3.49074 | 6.92300 | 0.00002 | 0.01783 | 4.50824 | 6.13966 | 10.76029 | 0.00000 | 0.00215 | 769.71 | 237.69 | 401.67 | 18.46 | 15.76 | 12.42 | 31.39 |
| MYC | 3.40054 | 5.54740 | 0.00000 | 0.00089 | 4.18256 | 4.66004 | 15.03225 | 0.00000 | 0.00037 | 182.95 | 93.34 | 132.65 | 7.68 | 5.70 | 9.14 | 6.92 |
| IER5 | 3.32338 | 7.68888 | 0.00001 | 0.01181 | 3.97225 | 7.12766 | 14.22916 | 0.00000 | 0.00048 | 883.14 | 393.64 | 869.56 | 36.60 | 41.37 | 53.42 | 41.43 |
| CYR61 | 3.32101 | 7.30011 | 0.00008 | 0.04099 | 4.47312 | 6.08245 | 8.95268 | 0.00001 | 0.00448 | 891.86 | 202.52 | 339.93 | 20.50 | 10.58 | 25.20 | 18.81 |
| NR4A1 | 3.25759 | 7.89653 | 0.00002 | 0.01783 | 3.65943 | 7.50826 | 15.68667 | 0.00000 | 0.00037 | 586.58 | 787.75 | 994.26 | 46.65 | 51.14 | 82.17 | 71.38 |
| BTG2 | 3.13166 | 8.92563 | 0.00003 | 0.02371 | 3.61149 | 8.46996 | 10.98758 | 0.00000 | 0.00210 | 1825.79 | 755.04 | 2331.93 | 124.91 | 111.09 | 141.27 | 108.59 |
| ENAH | 3.04548 | 8.97210 | 0.00003 | 0.01977 | 3.74105 | 8.59328 | 8.12615 | 0.00002 | 0.00661 | 2844.32 | 707.23 | 2407.53 | 111.83 | 85.63 | 139.59 | 192.28 |
| CSRNP1 | 2.79483 | 5.52248 | 0.00008 | 0.04099 | 3.62103 | 4.88653 | 10.18447 | 0.00000 | 0.00263 | 194.28 | 71.28 | 134.73 | 9.39 | 8.44 | 12.33 | 10.38 |
| NFIL3 | 2.71683 | 5.92826 | 0.00000 | 0.00089 | 3.17555 | 5.65796 | 10.36495 | 0.00000 | 0.00241 | 183.04 | 116.54 | 258.44 | 12.50 | 19.69 | 23.16 | 25.65 |
| ARRDC4 | 2.27807 | 5.64728 | 0.00004 | 0.02555 | 3.04853 | 5.50522 | 10.40753 | 0.00000 | 0.00241 | 227.91 | 105.32 | 145.64 | 22.71 | 20.94 | 11.89 | 19.41 |
| RAB15 | 2.00799 | 4.71411 | 0.00010 | 0.04384 | 2.51144 | 4.76790 | 9.78657 | 0.00000 | 0.00305 | 82.59 | 48.65 | 97.42 | 12.91 | 10.21 | 13.93 | 14.85 |
| B3GNT5 | 1.97126 | 6.45269 | 0.00009 | 0.04256 | 2.51777 | 6.53882 | 9.65582 | 0.00001 | 0.00305 | 337.24 | 150.67 | 311.67 | 49.01 | 45.00 | 38.25 | 43.54 |
| GADD45A | 1.92487 | 5.14147 | 0.00002 | 0.01783 | 2.41089 | 4.46737 | 8.53077 | 0.00001 | 0.00568 | 85.12 | 39.41 | 56.07 | 13.15 | 12.14 | 9.67 | 8.52 |
| CD300LG | 1.32879 | 4.94671 | 0.00004 | 0.02708 | 1.31297 | 4.97485 | 6.37281 | 0.00014 | 0.01987 | 52.10 | 44.97 | 61.64 | 19.85 | 14.80 | 26.71 | 25.82 |
Table 6.
Genes responsible of the wrong assignment of the ET subjects to their group (shaded genes are also in
Table 5).
Table 6.
Genes responsible of the wrong assignment of the ET subjects to their group (shaded genes are also in
Table 5).
| Gene Name | logFC Limma | AveExpr Limma | t Limma | p.Value Limma | adj.p.Val Limma | L187 | L188 | L189 | L186 | L190 |
|---|
| HBEGF | 4.16469 | 7.05932 | 8.42677 | 0.00006 | 0.09556 | 769.71 | 237.69 | 401.67 | 18.94 | 29.60 |
| ARRDC4 | 2.74324 | 6.15656 | 8.31871 | 0.00006 | 0.09556 | 227.91 | 105.32 | 145.64 | 21.99 | 23.45 |
| ANKRD1 | 4.48285 | 9.52091 | 8.74260 | 0.00005 | 0.09556 | 4183.80 | 1110.87 | 3514.04 | 123.13 | 104.22 |
| IER5 | 3.78093 | 7.89060 | 8.76015 | 0.00004 | 0.09556 | 883.14 | 393.64 | 869.56 | 34.57 | 70.45 |
| OTUD1 | 5.55686 | 8.94707 | 10.97613 | 0.00001 | 0.06737 | 3795.33 | 1300.29 | 2408.51 | 31.39 | 76.81 |
| XIRP1 | 3.56566 | 12.23974 | 8.18312 | 0.00007 | 0.09556 | 18,249.37 | 7680.84 | 15,550.17 | 740.04 | 1607.97 |
| DDN | 1.58921 | 6.14486 | 9.41066 | 0.00003 | 0.09493 | 123.19 | 111.54 | 95.67 | 38.79 | 33.97 |
| MAOA | −3.20244 | 5.34823 | −10.15969 | 0.00002 | 0.07575 | 27.36 | 11.22 | 14.84 | 152.31 | 156.95 |
| Xxbac-B476C20.17 | 2.157934 | 5.3604339 | 11.274756 | 8.26 × 10⁻⁶ | 0.06737 | 83.55 | 66.85 | 74.84 | 18.81 | 14.49 |
Table 7.
Relevant highest scoring KEGG pathways.
Table 7.
Relevant highest scoring KEGG pathways.
| Term | Overlap | p-Value | Adjusted p-Value | Number of Genes Up-Regulated in TRA VL vs. SED VL |
|---|
| Insulin signaling pathway | 80/137 | 3.10 × 10⁻⁷ | 9.56 × 10⁻⁵ | 54/80 |
| Lysosome | 72/123 | 1.05 × 10⁻⁶ | 1.61 × 10⁻⁴ | 17/72 |
| Focal adhesion | 105/199 | 4.39 × 10⁻⁶ | 3.38 × 10⁻⁴ | 48/105 |
| Ribosome | 84/153 | 5.21 × 10⁻⁶ | 3.21 × 10⁻⁴ | 10/84 |
| Adipocytokine signaling pathway | 44/69 | 6.09 × 10⁻⁶ | 2.34 × 10⁻⁴ | 25/44 |
| Regulation of actin cytoskeleton | 110/214 | 1.26 × 10⁻⁵ | 4.30 × 10⁻⁴ | 45/110 |
| AMPK signaling pathway | 66/120 | 4.74 × 10⁻⁵ | 1.22 × 10⁻³ | 41/66 |
| Thyroid hormone signaling pathway | 64/116 | 5.40 × 10⁻⁵ | 1.28 × 10⁻³ | 44/64 |
| Citrate cycle (TCA cycle) | 22/30 | 5.90 × 10⁻⁵ | 1.30 × 10⁻³ | 20/22 |
| Insulin resistance | 60/108 | 6.98 × 10⁻⁵ | 1.34 × 10⁻³ | 35/60 |
| Ubiquitin mediated proteolysis | 73/137 | 7.85 × 10⁻⁵ | 1.42 × 10⁻³ | 55/73 |
| TNF signaling pathway | 60/110 | 1.40 × 10⁻⁴ | 2.16 × 10⁻³ | 22/60 |
| NOD-like receptor signaling pathway | 89/178 | 2.80 × 10⁻⁴ | 3.93 × 10⁻³ | 33/89 |
| Cellular senescence | 81/160 | 3.12 × 10⁻⁴ | 4.17 × 10⁻³ | 43/81 |

 ,
, 


