PDE2A Is Indispensable for Mouse Liver Development and Hematopoiesis

 , , , , and
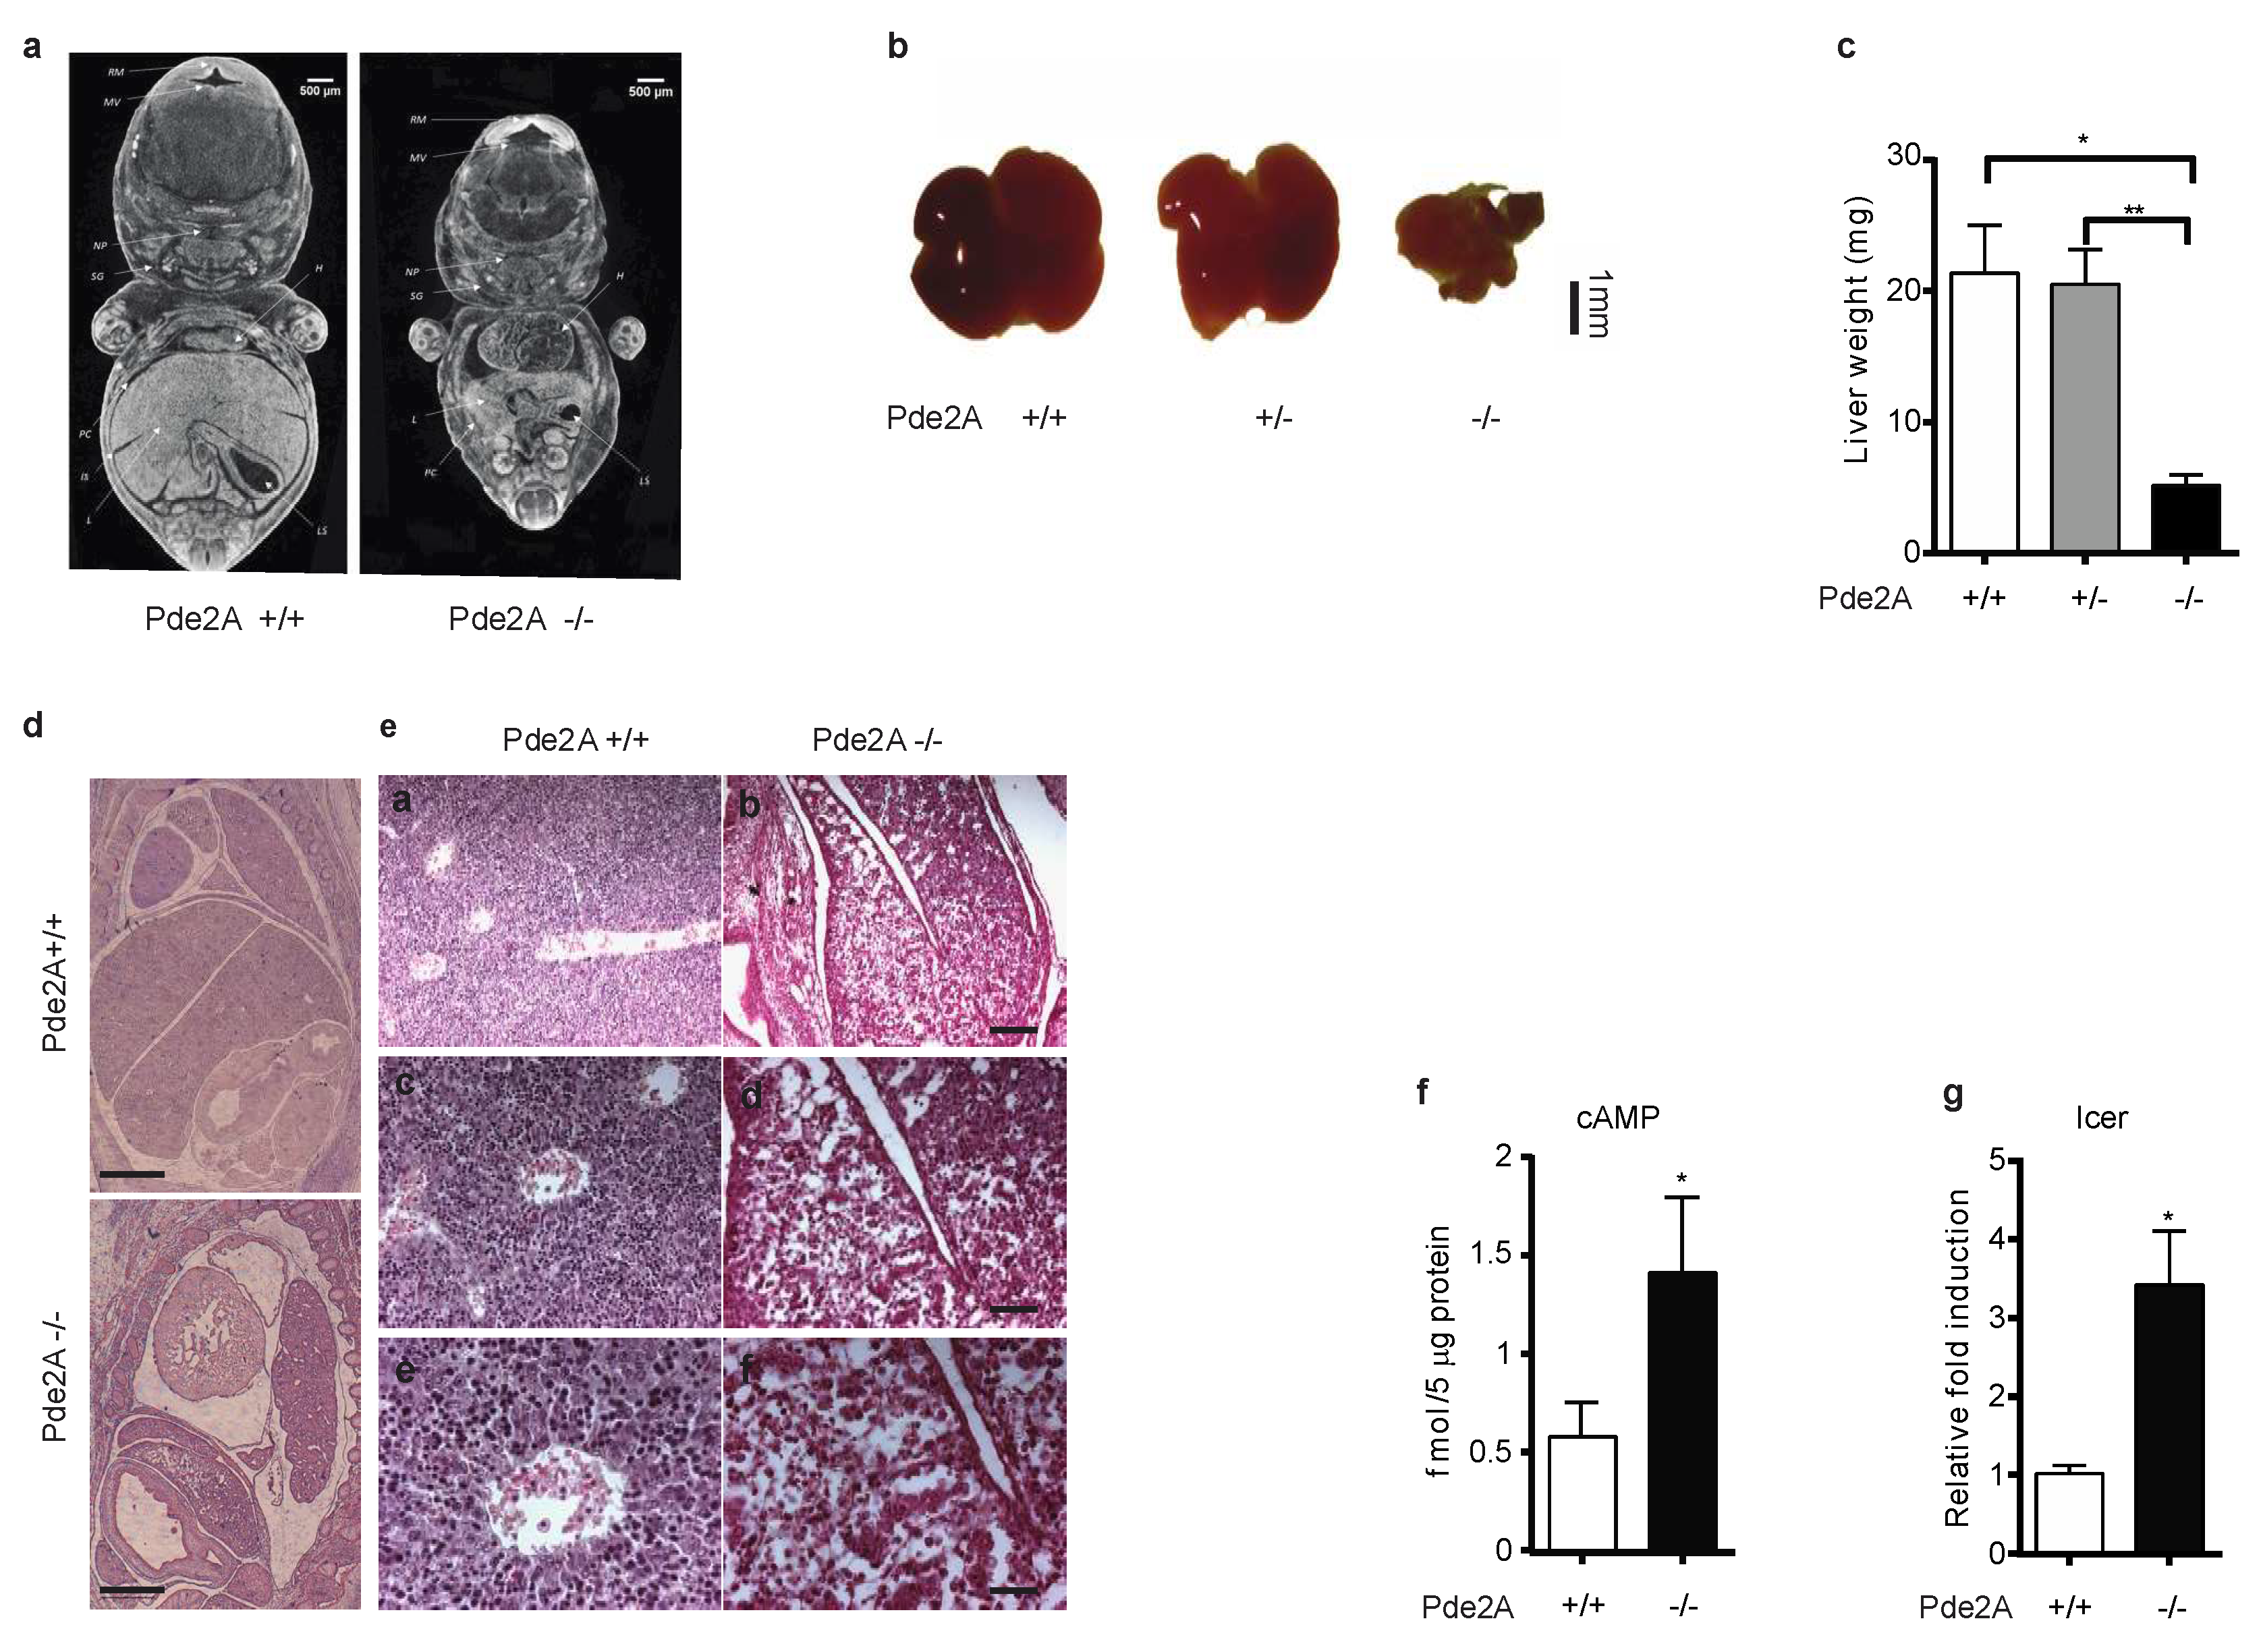
Abstract
:1. Introduction
2. Results
2.1. PDE2A Deficient Embryos Display Fetal Liver Defects
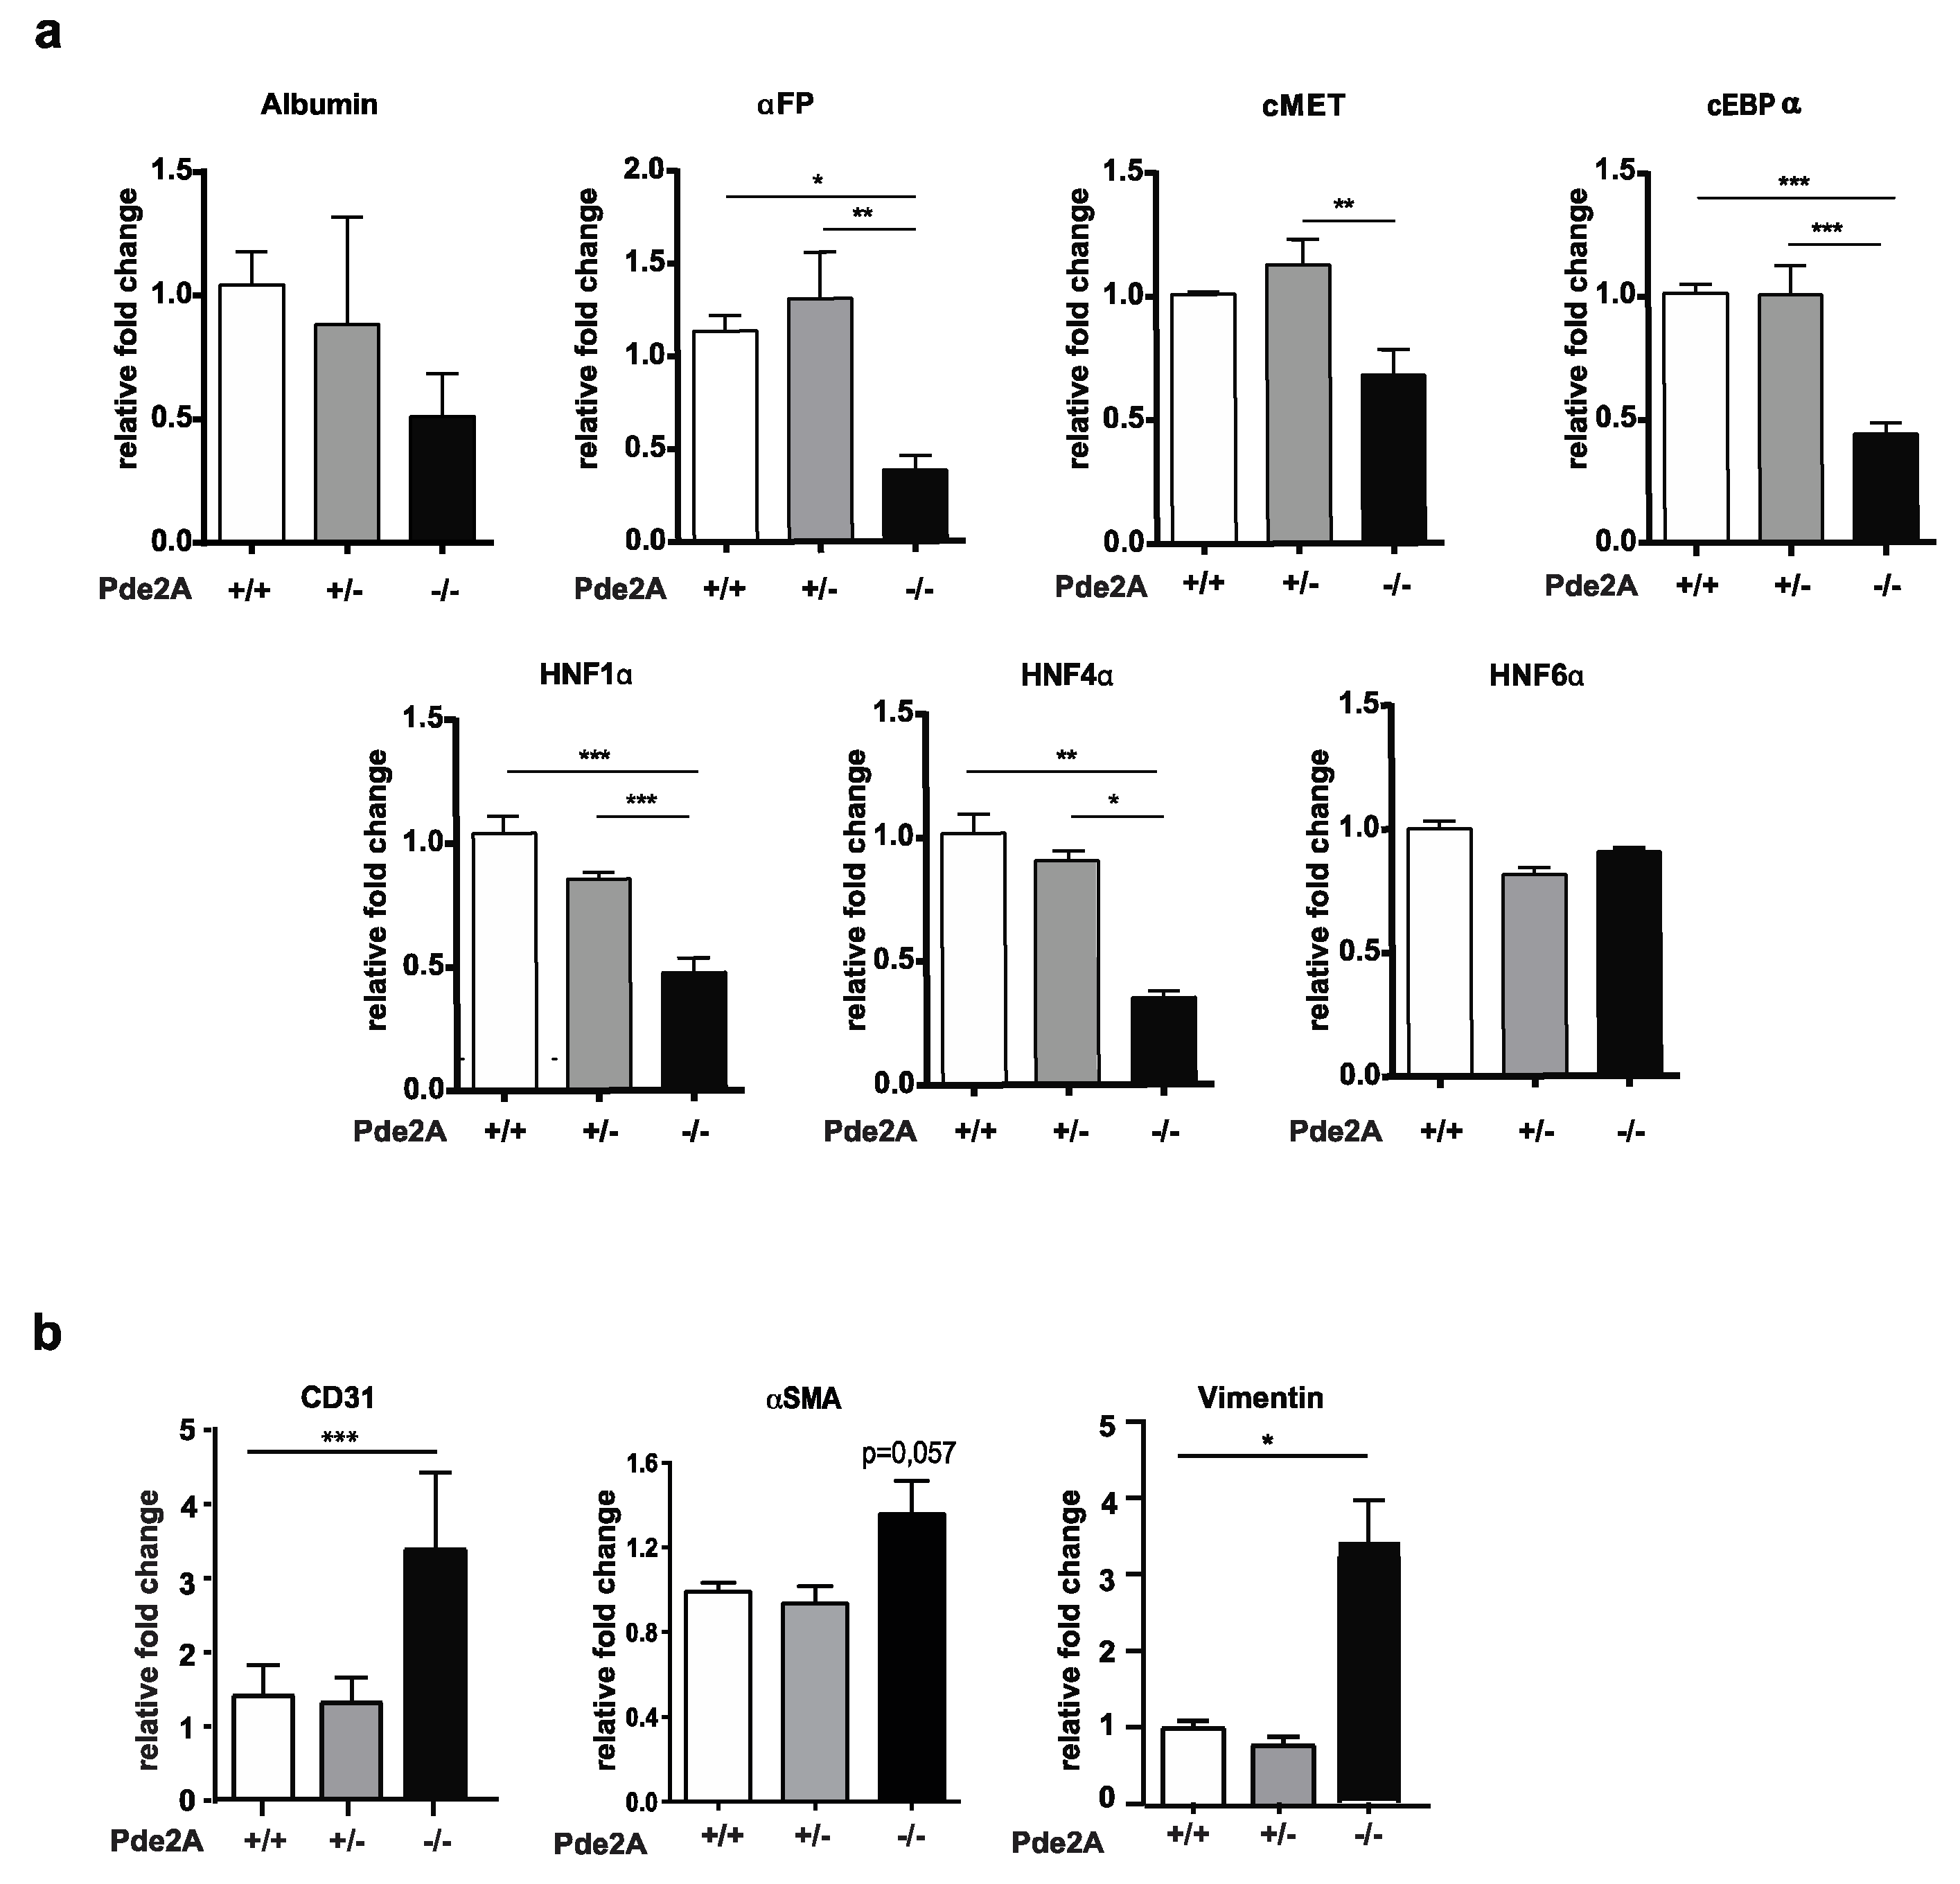
2.2. Hepatic Markers Are Reduced Whereas Stromal and Endothelial Markers Are Increased in Liver Of PDE2A Mutant
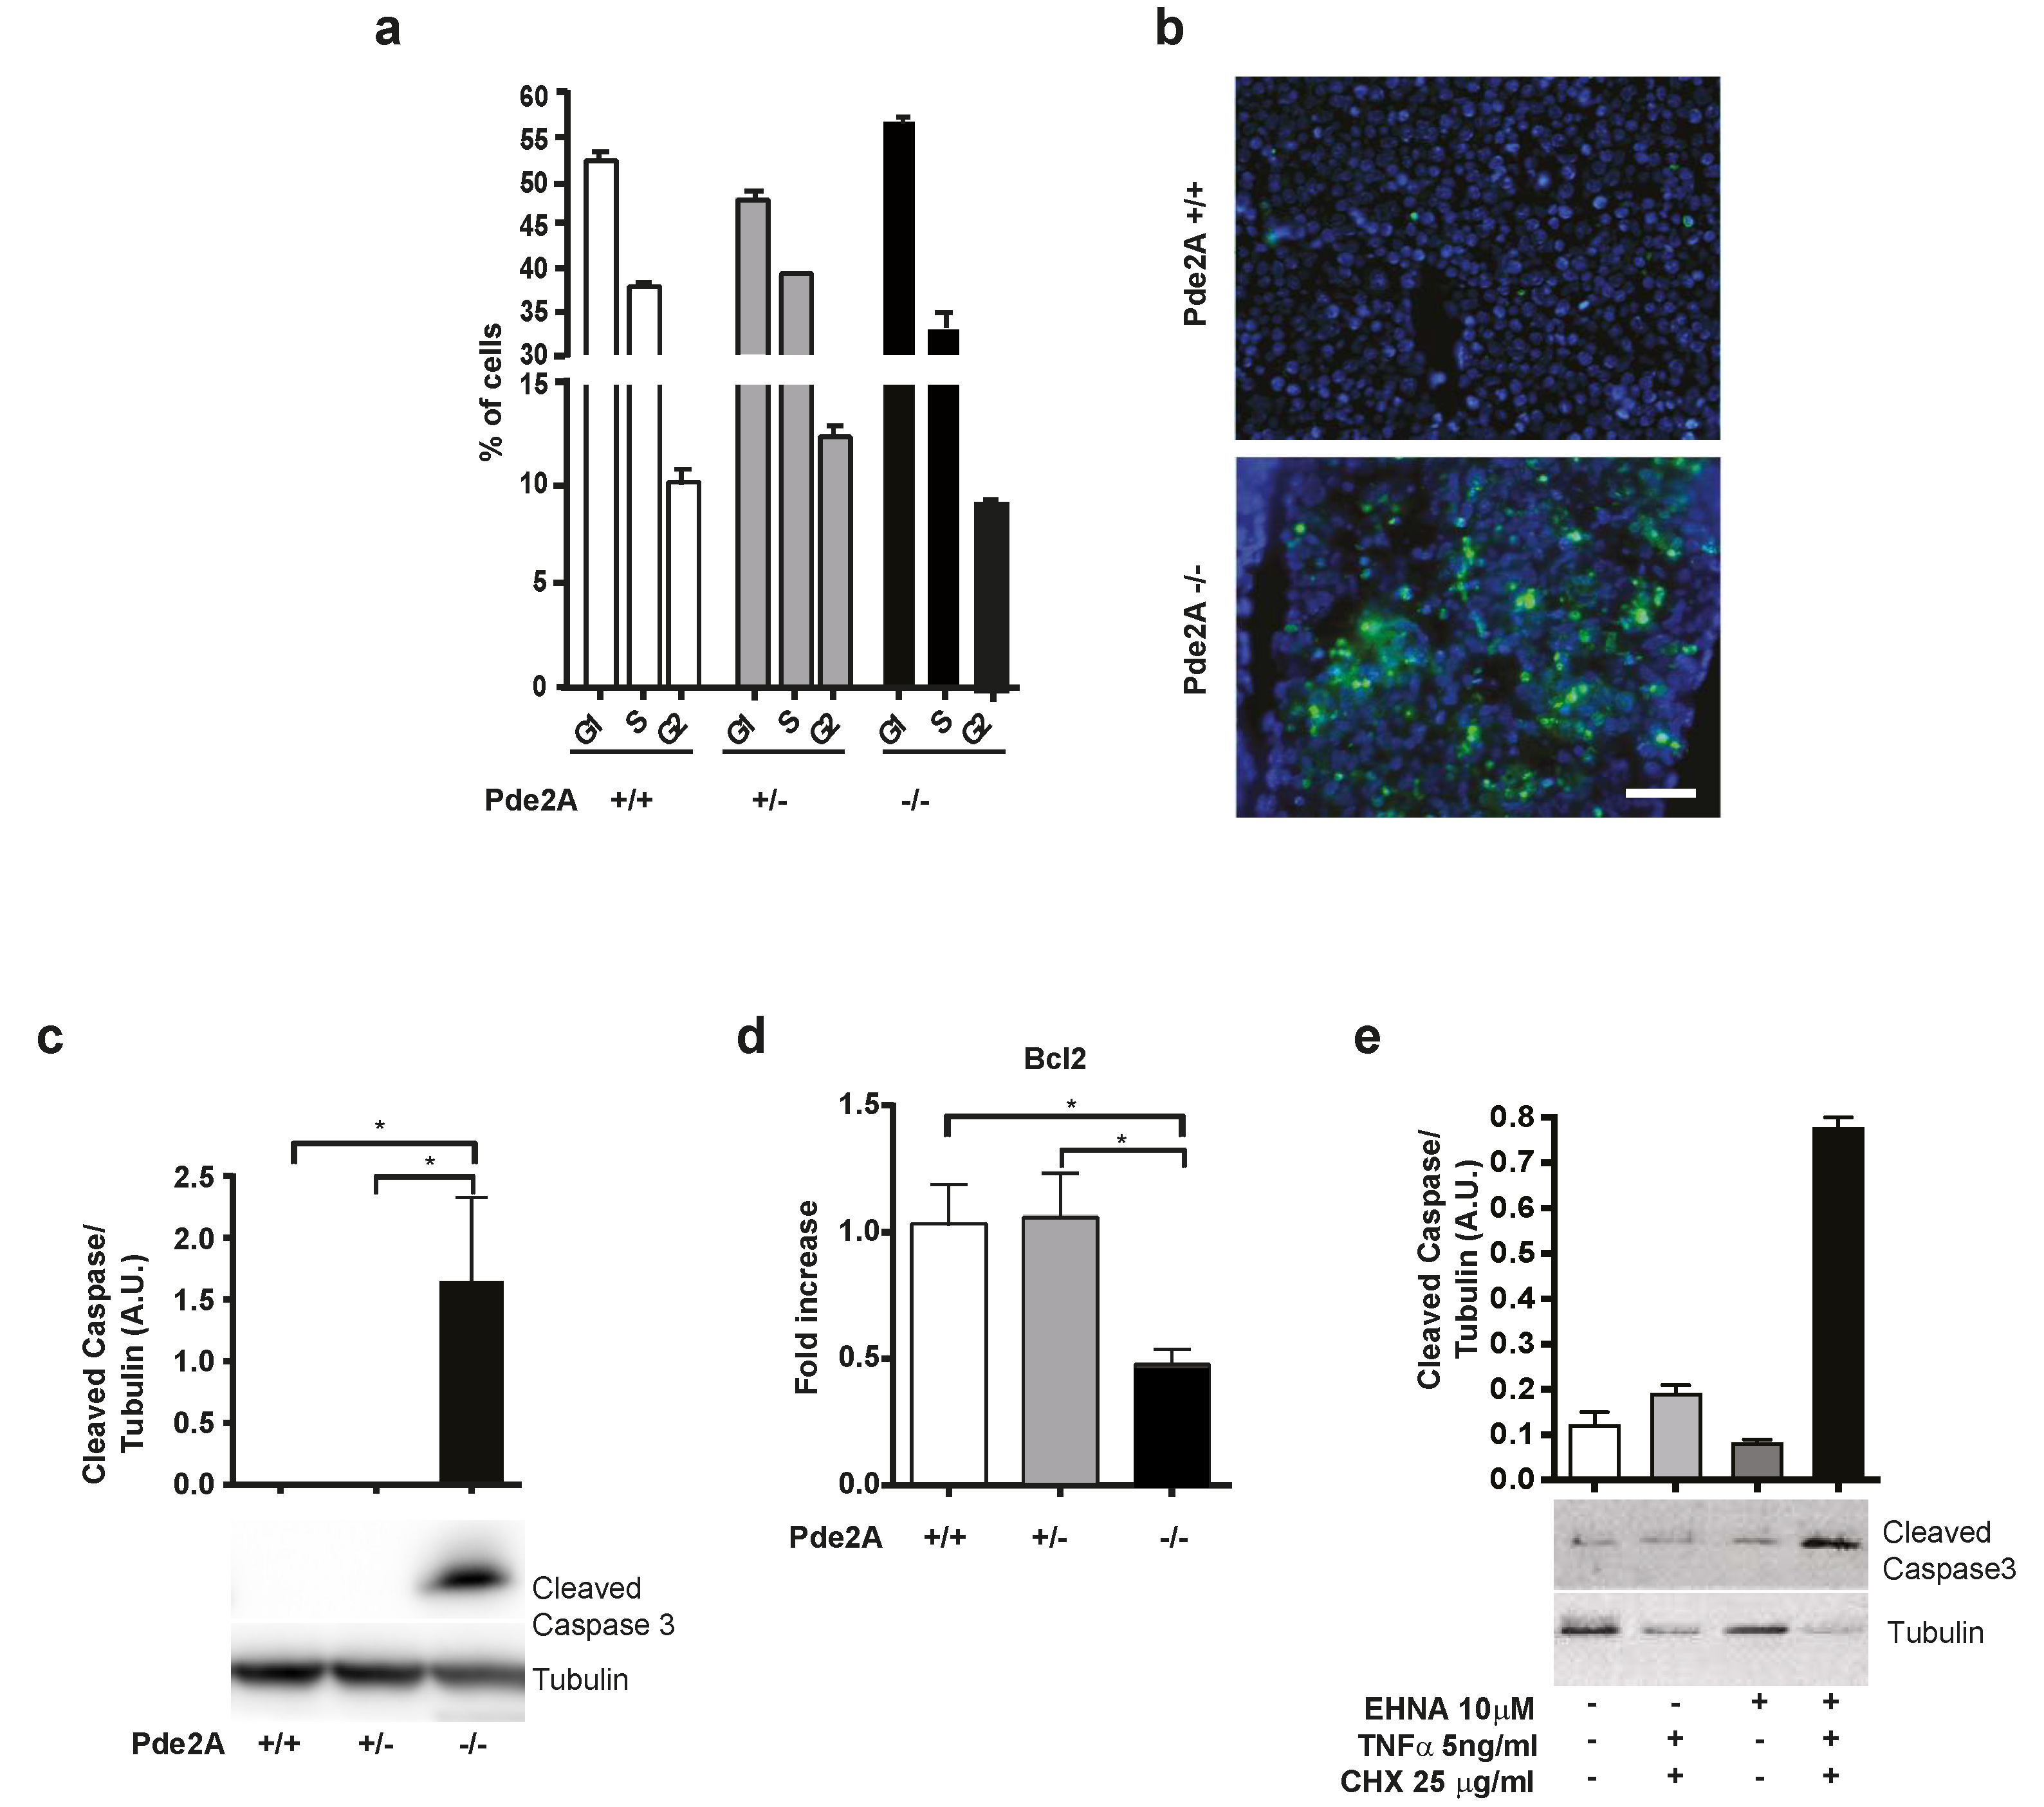
2.3. Increased Apoptosis in PDE2A−/− Fetal Livers
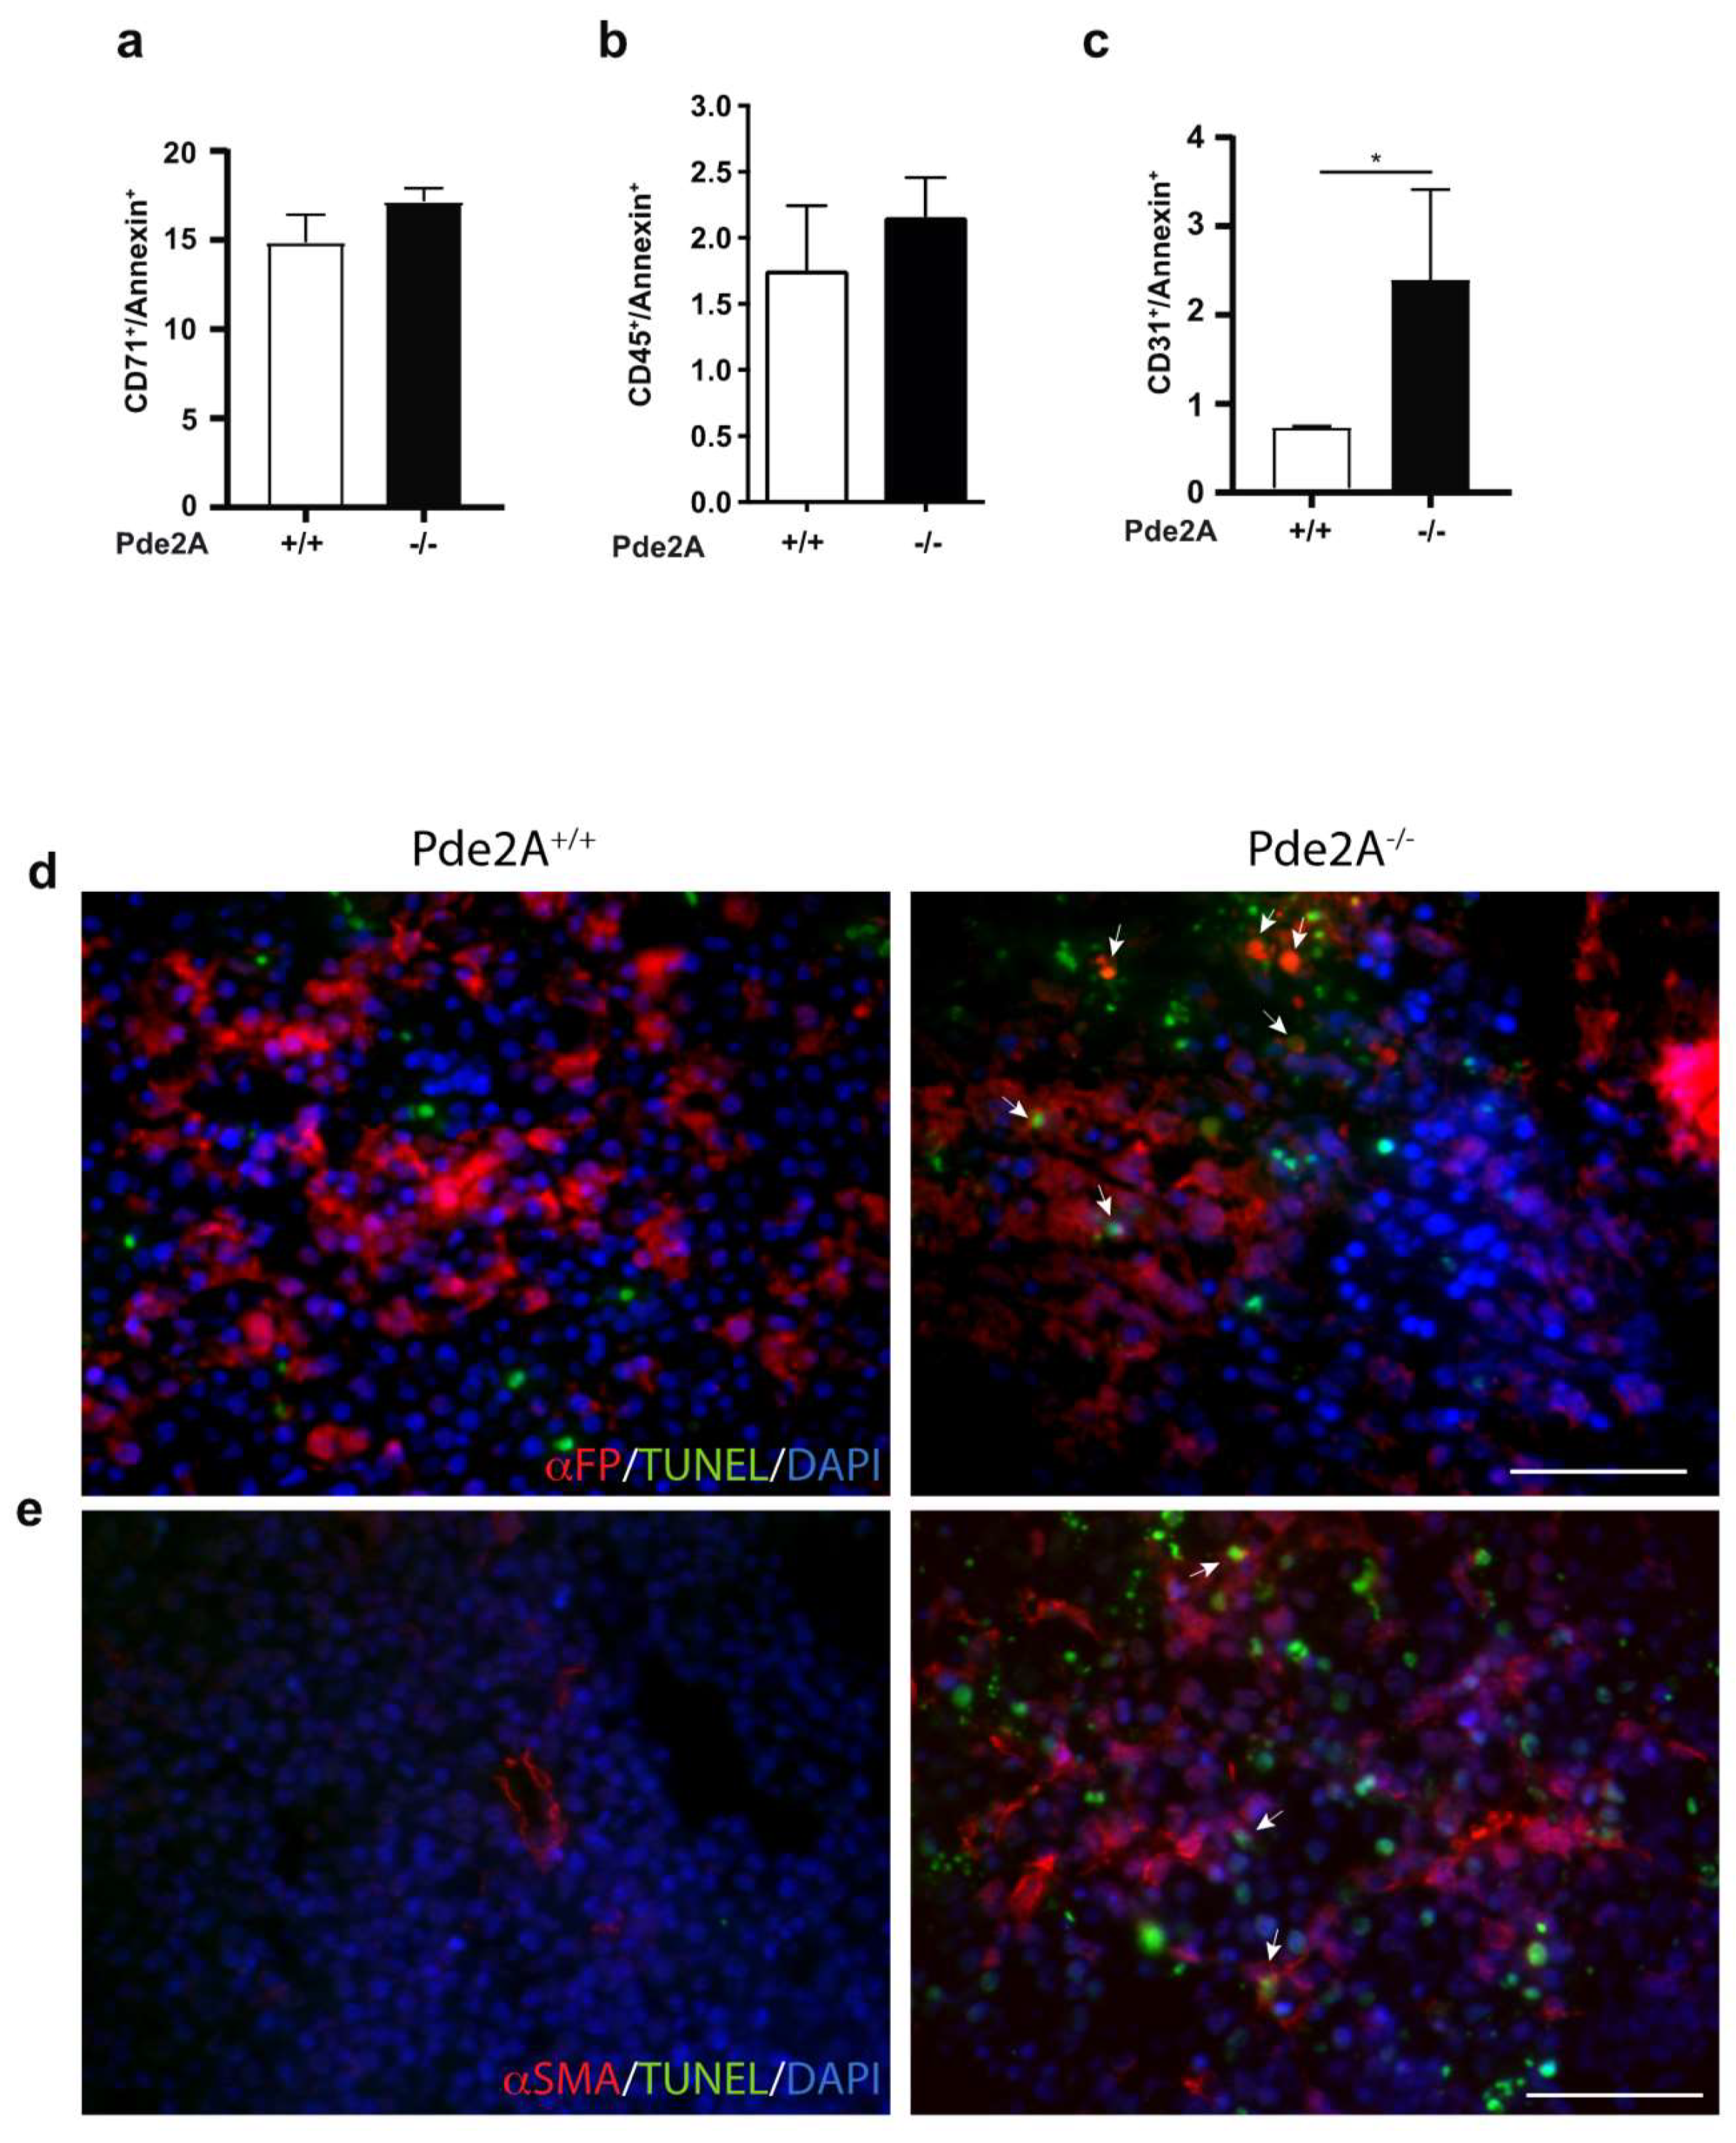
2.4. Hepatoblasts, Endothelial and Stromal Cells Undergo Apotosis in Livers of PDE2A−/− Embryos−
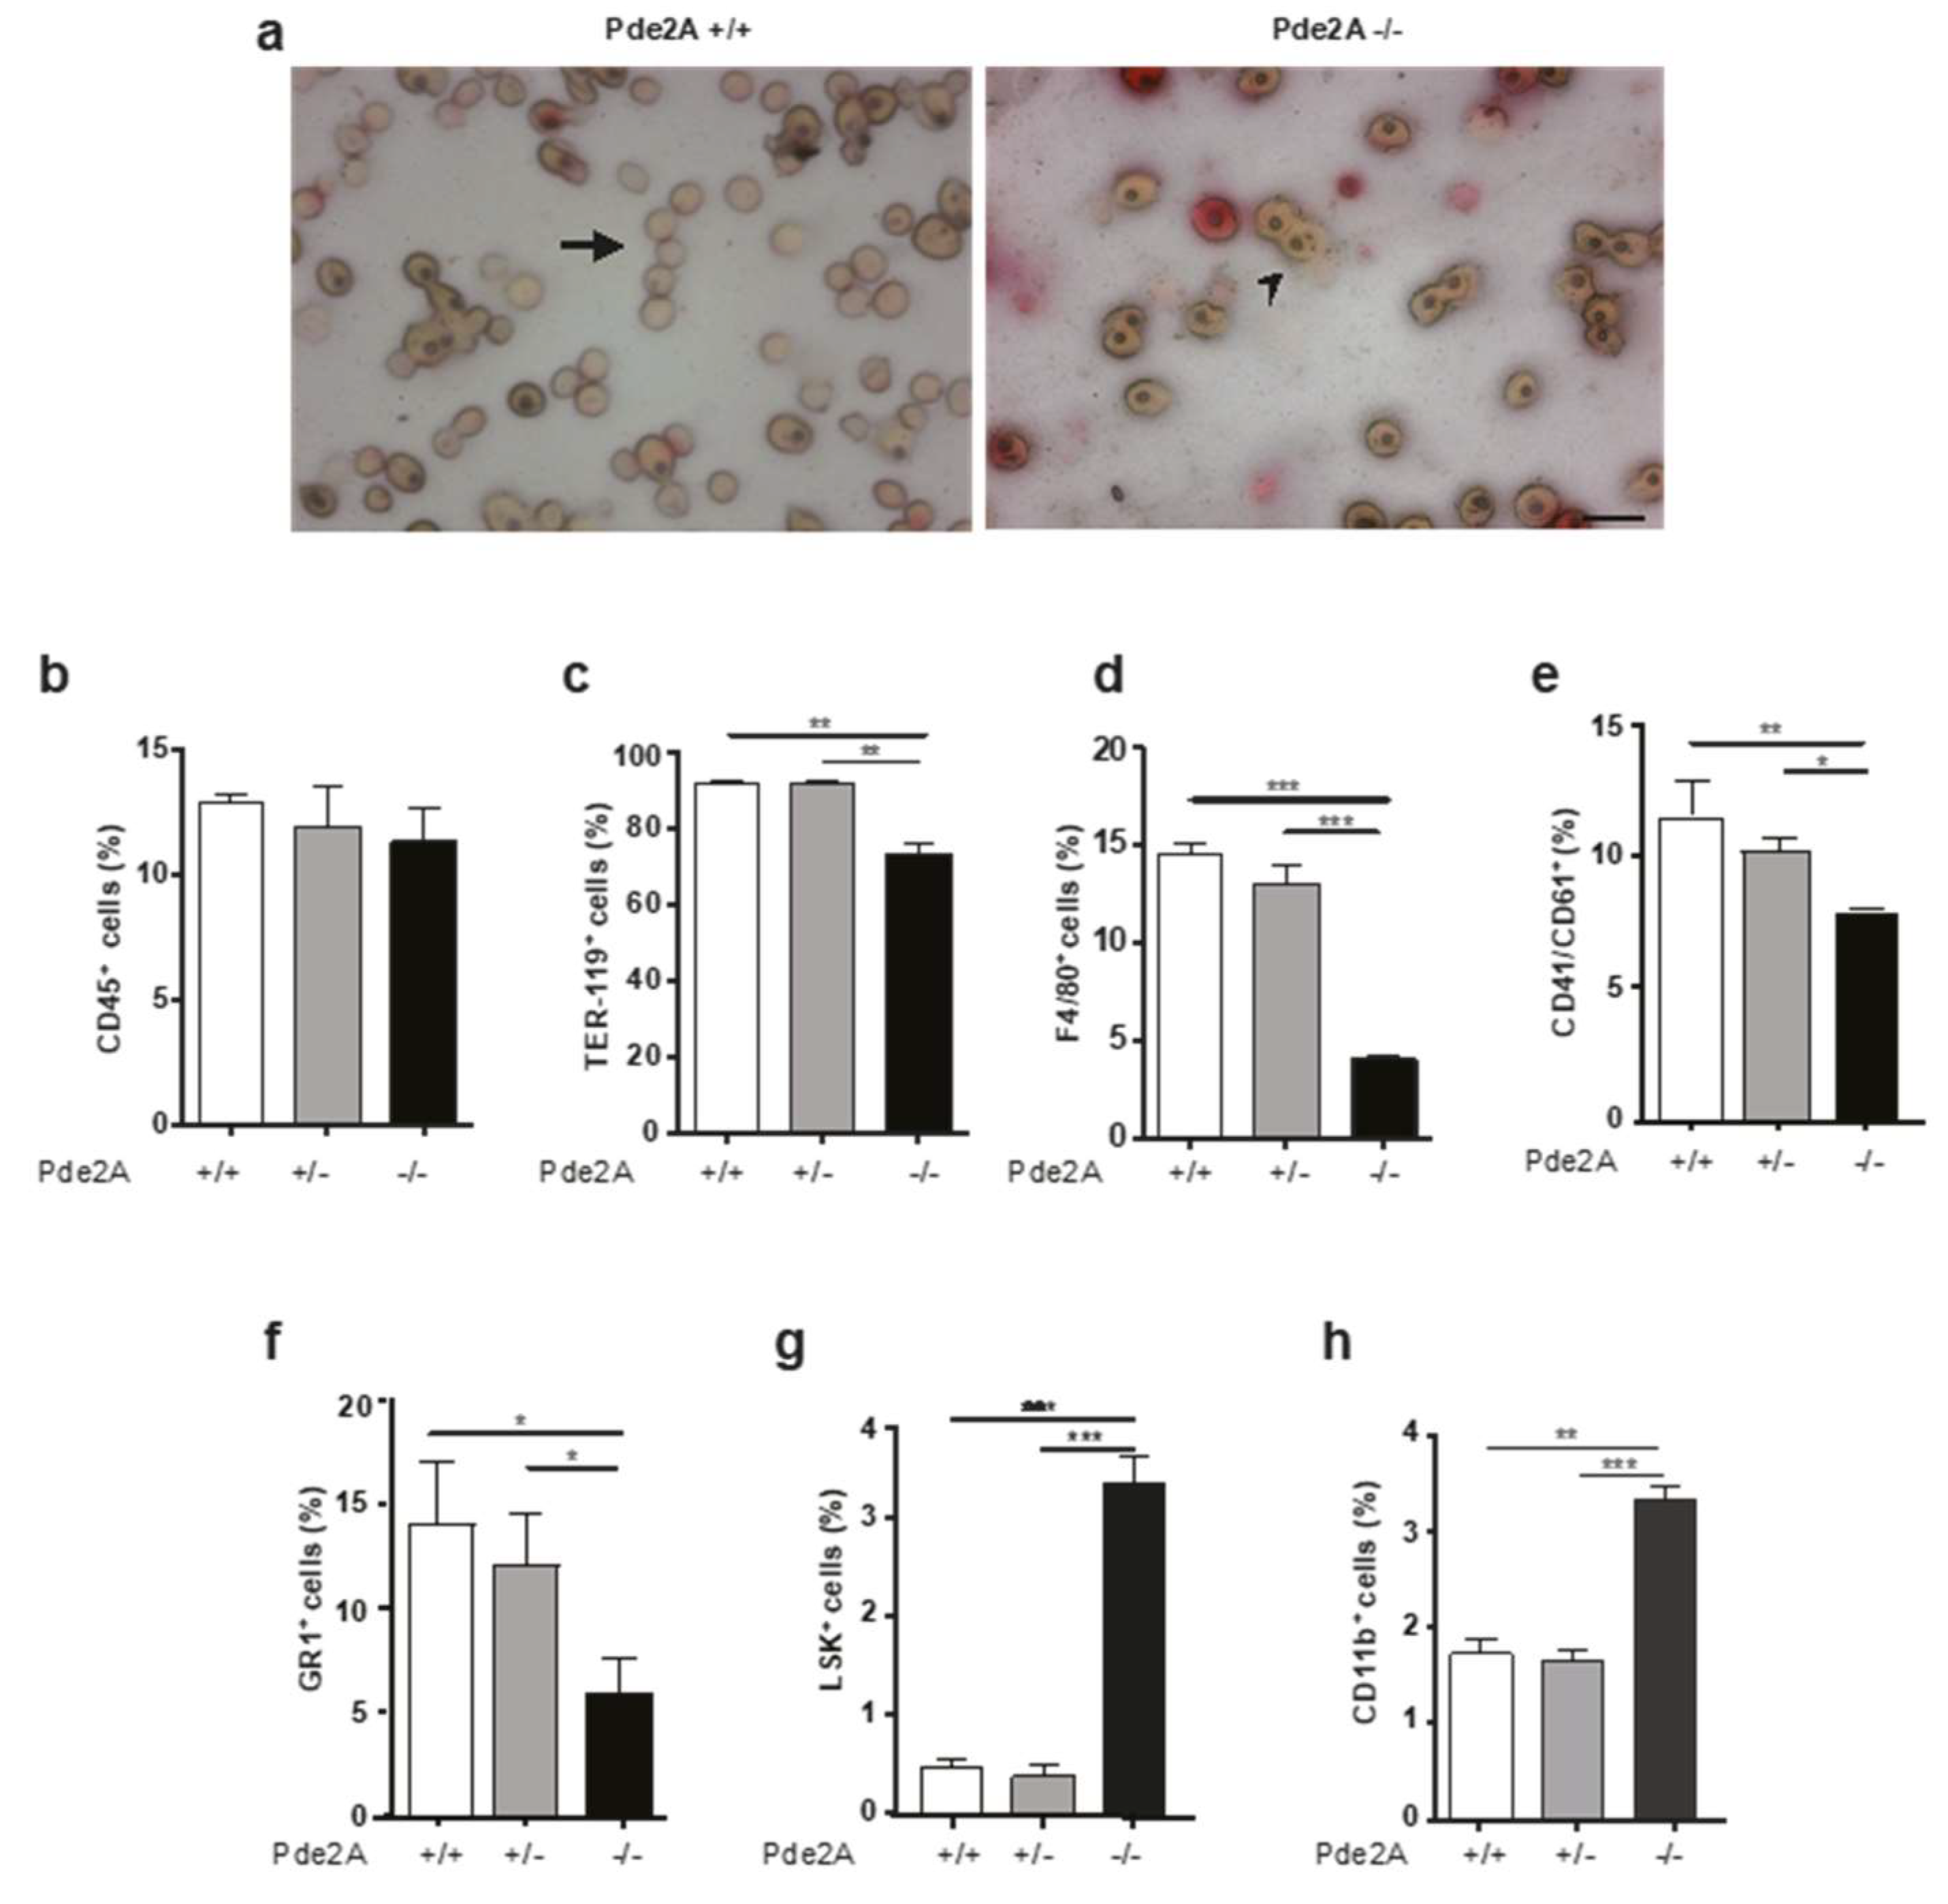
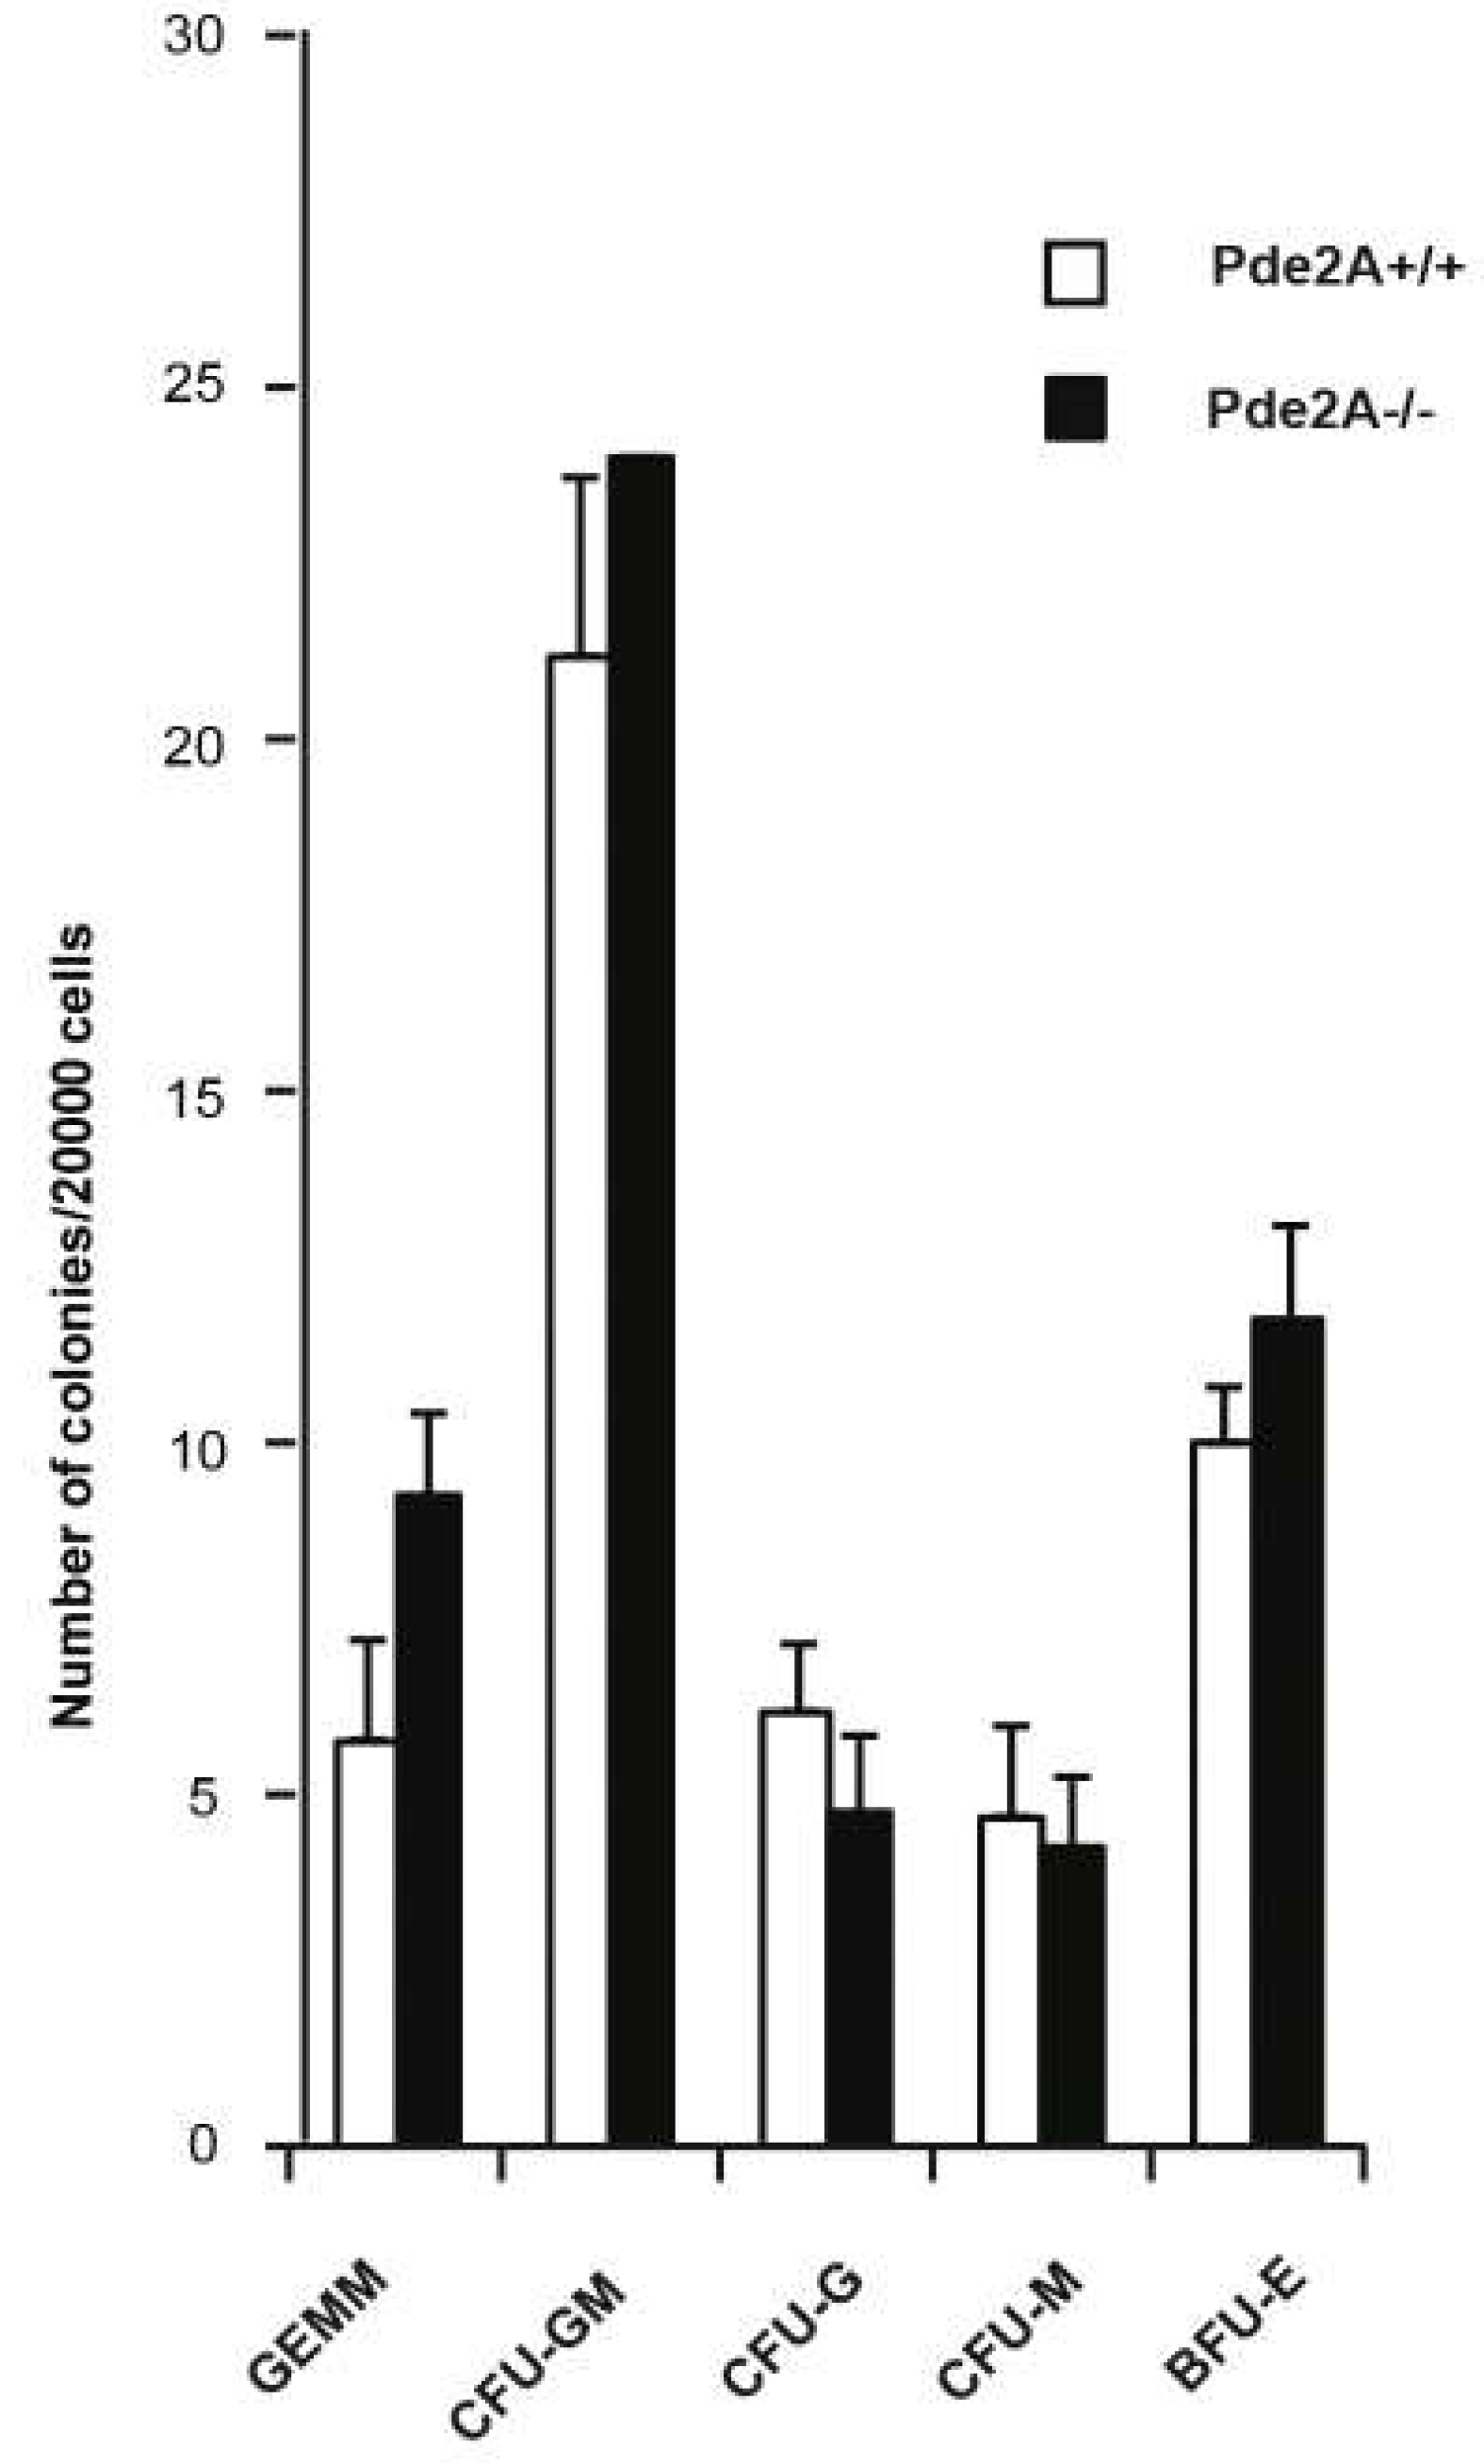
2.5. Impairment of Hematopoietic Differentation in PDE2A−/− Embryos
3. Discussion
4. Materials and Methods
4.1. Mice Husbandry
- PDE2A screen F1: 5′-CTGCCTGATGGTGAAGAAAGGCTA-3′,
- PDE2A screen F2: 5′-GGGCCAGCTCATTCCTCCCACTCAT-3′,
- PDE2A screen R: 5′-TGAGCAGACCCCTTATGGAAGGTG-3′
4.2. Histological Procedures and TUNEL Assay
4.3. Micro-CT Imaging and Volume Measurements
4.4. Immunofluorescence
4.5. cAMP Assay
4.6. Liver Cell Culture and Treatments
4.7. Western Blot Analyses
4.8. mRNA Extraction, RT-PCR and qRT-PCR
- cMET fw 5′GATCGTTCAACCGGATCAGAA3′
- cMET rev 5′GGAAGAGCCCGGATAATAACAA3′
- cEBPα fw 5′AAGAAGTCGGTGGACAAGAACAG3′
- cEBPα rw 5′TTGCGTTGTTTGGCTTTATCTC3′
- HNF1 fw 5′GCTAGGCTCCAACCTTGTCACG3′
- HNF1 rev 5′TTGTGCCGGAAGGCTTCCT3′
- HNF4 fw 5′TGGTGTTTAAGGACGTGCTGC3′
- HNF4 rev 5′ACGGCTCATCTCCGCTAGCT3′
- HNF6 fw 5′AAATAAGCGTCCGTCCAAAGAA3′
- HNF6 rev 5′GACGATGAACTGCCTGAGTTG3′
- ALBUMIN fw 5′GCTACGGCACAGTGCTTG3′
- ALBUMIN rev 5′GTCTTCCACACAAGGCAGTC3′
- α-FETOPROTEIN (αFP) fw 5′TCGTATTCCAACAGGAGG3′
- α-FETOPROTEIN (αFP) rev 5′AGGCTTTTGCTTCACCAG3′
- ICER fw 5′CAAAAGCCCAACATGGCTGT3′
- ICER rev 5′GTTACTCTGCTTTATGGCAA3′
- BCL2 fw 5′AACCTGTCACAGAGGGGCTA3′
- BCL2 rev 5′TGCCGGTTCAGGTACTCAGTC3′
- CD31 fw 5′GGTCTTGTCGCAGTATCAGA3′
- CD31 rev 5′AGCATTTCGCACACCTGGAT3′
- Vimentin fw 5′GTGGAATCCTTGCAGGAAGA3′
- Vimentin rev 5′ CAGTGAGGTCAGGCTTGGAA3′
- αSMA fw 5′ATGTACCCAGGCATTGCTGA3′
- αSMA rev 5′ TTGCTGATCCACATCTGCTG3′
- GAPDH fw 5′TGCGACTTCAACAGCAACTC3′
- GAPDH rev 5′ATGTAGGCCATGAGGTCCAC3′
4.9. Flow Cytometry Analysis
4.10. Cell Cycle Analysis
4.11. Colony-Forming Assay
4.12. Statistical Analyses
Supplementary Materials
Author Contributions
Funding
Acknowledgments
Conflicts of Interest
Abbreviations
| PDE2A | Phosphodiesterase 2A |
| Micro-CT | Micro computational tomography |
| cAMP | Cyclic adenosine monophosphate |
| cGMP | Cyclic guanosine monophosphate |
| E12.5-14.5 | Embryonic day |
| ICER | Inducible cAMP Early Repressor |
| αFP | Alpha fetoprotein |
| cMet | Hepatocyte growth factor receptor |
| cEBP-α | CCAAT/enhancer binding protein alpha |
| HNFs | Hepatocyte nuclear factors |
| EHNA | Erythro-9-(2-hydroxy-3-nonly)adenine |
| CHX | Cycloheximide |
| TNFα | Tumor necrosis factor-alpha |
| α-SMA | alpha-Smooth muscle actin |
| LSK | Lin−, Sca-1+, c-kit+ |
References
- Chou, S.; Lodish, H.F. Fetal liver hepatic progenitors are supportive stromal cells for hematopoietic stem cells. Proc. Natl. Acad. Sci. USA 2010, 107, 7799–7804. [Google Scholar] [CrossRef] [PubMed] [Green Version]
- Nierhoff, D.; Ogawa, A.; Oertel, M.; Chen, Y.Q.; Shafritz, D.A. Purification and characterization of mouse fetal liver epithelial cells with high in vivo repopulation capacity. Hepatology 2005, 42, 130–139. [Google Scholar] [CrossRef] [PubMed]
- Gordillo, M.; Evans, T.; Gouon-Evans, V. Orchestrating liver development. Dev. (Camb.) 2015, 142, 2094–2108. [Google Scholar] [CrossRef] [PubMed] [Green Version]
- Tanaka, M.; Fuentes, M.E.; Yamaguchi, K.; Durnin, M.H.; Dalrymple, S.A.; Hardy, K.L.; Goeddel, D.V. Embryonic lethality, liver degeneration, and impaired NF-kappa B activation in IKK-beta-deficient mice. Immunity 1999, 10, 421–429. [Google Scholar] [CrossRef] [Green Version]
- Bonnard, M. Deficiency of T2K leads to apoptotic liver degeneration and impaired NF-kappaB-dependent gene transcription. Embo. J. 2000, 19, 4976–4985. [Google Scholar] [CrossRef]
- Reimold, A.M.; Etkin, A.; Clauss, I.; Perkins, A.; Friend, D.S.; Zhang, J.; Horton, H.F.; Scott, A.; Orkin, S.H.; Byrne, M.C.; et al. An essential role in liver development for transcription factor XBP-1. Genes Dev. 2000, 14, 152–157. [Google Scholar]
- Conti, M. Phosphodiesterases and cyclic nucleotide signaling in endocrine cells. Mol. Endocrinol. 2000, 14, 1317–1327. [Google Scholar] [CrossRef]
- Stephenson, D.T.; Coskran, T.M.; Wilhelms, M.B.; Adamowicz, W.O.; O’Donnell, M.M.; Muravnick, K.B.; Menniti, F.S.; Kleiman, R.J.; Morton, D. Immunohistochemical localization of phosphodiesterase 2A in multiple mammalian species. J. Histochem. Cytochem. Off. J. Histochem. Soc. 2009, 57, 933–949. [Google Scholar] [CrossRef] [Green Version]
- Assenza, M.R.; Barbagallo, F.; Barrios, F.; Cornacchione, M.; Campolo, F.; Vivarelli, E.; Gianfrilli, D.; Auletta, L.; Soricelli, A.; Isidori, A.M.; et al. Critical role of phosphodiesterase 2A in mouse congenital heart defects. Cardiovasc. Res. 2018, 114, 830–845. [Google Scholar] [CrossRef]
- Servillo, G.; Della Fazia, M.A.; Sassone-Corsi, P. Coupling cAMP signaling to transcription in the liver: Pivotal role of CREB and CREM. Exp. Cell Res. 2002, 275, 143–154. [Google Scholar] [CrossRef]
- Wahlang, B.; McClain, C.; Barve, S.; Gobejishvili, L. Role of cAMP and phosphodiesterase signaling in liver health and disease. Cell. Signal. 2018, 49, 105–115. [Google Scholar] [CrossRef] [PubMed]
- Rebel, V.I.; Miller, C.L.; Thornbury, G.R.; Dragowska, W.H.; Eaves, C.J.; Lansdorp, P.M. A comparison of long-term repopulating hematopoietic stem cells in fetal liver and adult bone marrow from the mouse. Exp. Hematol. 1996, 24, 638–648. [Google Scholar] [PubMed]
- Draper, J.E.; Sroczynska, P.; Fadlullah, M.Z.H.; Patel, R.; Newton, G.; Breitwieser, W.; Kouskoff, V.; Lacaud, G. A novel prospective isolation of murine fetal liver progenitors to study in utero hematopoietic defects. PLoS Genet. 2018, 14, e1007127. [Google Scholar] [CrossRef] [PubMed] [Green Version]
- Wolber, F.M.; Leonard, E.; Michael, S.; Orschell-Traycoff, C.M.; Yoder, M.C.; Srour, E.F. Roles of spleen and liver in development of the murine hematopoietic system. Exp. Hematol. 2002, 30, 1010–1019. [Google Scholar] [CrossRef]
- Payushina, O.V. Hematopoietic Microenvironment in the Fetal Liver: Roles of Different Cell Populations. Isrn. Cell Biol. 2012, 2012, 7. [Google Scholar] [CrossRef] [Green Version]
- Kunisaki, Y.; Masuko, S.; Noda, M.; Inayoshi, A.; Sanui, T.; Harada, M.; Sasazuki, T.; Fukui, Y. Defective fetal liver erythropoiesis and T lymphopoiesis in mice lacking the phosphatidylserine receptor. Blood 2004, 103, 3362–3364. [Google Scholar] [CrossRef]
- Fraser, S.T.; Isern, J.; Baron, M.H. Maturation and enucleation of primitive erythroblasts during mouse embryogenesis is accompanied by changes in cell-surface antigen expression. Blood 2007, 109, 343–352. [Google Scholar] [CrossRef]
- Chasis, J.A.; Mohandas, N. Erythroblastic islands: Niches for erythropoiesis. Blood 2008, 112, 470–478. [Google Scholar] [CrossRef] [Green Version]
- Ferkowicz, M.J.; Starr, M.; Xie, X.; Li, W.; Johnson, S.A.; Shelley, W.C.; Morrison, P.R.; Yoder, M.C. CD41 expression defines the onset of primitive and definitive hematopoiesis in the murine embryo. Dev. (Camb. Engl.) 2003, 130, 4393–4403. [Google Scholar] [CrossRef] [Green Version]
- Ciriza, J.; García-Ojeda, M.E. Expression of migration-related genes is progressively upregulated in murine Lineage-Sca-1+c-Kit+ population from the fetal to adult stages of development. Stem Cell Res. 2010, 1, 14. [Google Scholar] [CrossRef] [Green Version]
- Morrison, S.J.; Hemmati, H.D.; Wandycz, A.M.; Weissman, I.L. The purification and characterization of fetal liver hematopoietic stem cells. Proc. Natl. Acad. Sci. USA 1995, 92, 10302–10306. [Google Scholar] [CrossRef] [Green Version]
- Tan, X.; Yuan, Y.; Zeng, G.; Apte, U.; Thompson, M.D.; Cieply, B.; Stolz, D.B.; Michalopoulos, G.K.; Kaestner, K.H.; Monga, S.P. Beta-catenin deletion in hepatoblasts disrupts hepatic morphogenesis and survival during mouse development. Hepatology 2008, 47, 1667–1679. [Google Scholar] [CrossRef] [PubMed] [Green Version]
- Hata, S.; Namae, M.; Nishina, H. Liver development and regeneration: From laboratory study to clinical therapy. Dev. Growth Differ. 2007, 49, 163–170. [Google Scholar] [CrossRef] [PubMed]
- Tilghman, S.M.; Belayew, A. Transcriptional control of the murine albumin/alpha-fetoprotein locus during development. Proc. Natl. Acad. Sci. USA 1982, 79, 5254–5257. [Google Scholar] [CrossRef] [PubMed] [Green Version]
- Crawford, L.; Foley, J.; Elmore, S.A. Histology atlas of the developing mouse hepatobiliary system with emphasis on embryonic days 9.5-18.5. Toxicol. Pathol. 2010, 38, 872–906. [Google Scholar] [CrossRef] [Green Version]
- Schmidt, C.; Bladt, F.; Goedecke, S.; Brinkmann, V.; Zschiesche, W.; Sharpe, M.; Gherardi, E.; Goedecke, S. Scatter factor/hepatocyte growth factor is essential for liver development. Nature 1995, 373, 699–702. [Google Scholar] [CrossRef]
- Lee, Y.H.; Sauer, B.; Johnson, P.F.; Gonzalez, F.J. Disruption of the c/ebp alpha gene in adult mouse liver. Mol. Cell. Biol. 1997, 17, 6014–6022. [Google Scholar] [CrossRef] [Green Version]
- Westmacott, A.; Burke, Z.D.; Oliver, G.; Slack, J.M.W.; Tosh, D. C/EBPα and C/EBPβ are markers of early liver development. Int. J. Dev. Biol. 2006, 50, 653–657. [Google Scholar] [CrossRef] [Green Version]
- Jochheim, A.; Hillemann, T.; Kania, G.; Scharf, J.; Attaran, M.; Manns, M.P.; Wobus, A.M.; Ott, M. Quantitative gene expression profiling reveals a fetal hepatic phenotype of murine ES-derived hepatocytes. Int. J. Dev. Biol. 2004, 48, 23–29. [Google Scholar] [CrossRef] [Green Version]
- Nagaki, M.; Moriwaki, H. Transcription factor HNF and hepatocyte differentiation. Hepatol. Res. 2008, 38, 961–969. [Google Scholar] [CrossRef]
- Sekhon, S.S.; Tan, X.; Micsenyi, A.; Bowen, W.C.; Monga, S.P. Fibroblast growth factor enriches the embryonic liver cultures for hepatic progenitors. Am. J. Pathol. 2004, 164, 2229–2240. [Google Scholar] [CrossRef] [Green Version]
- Vaidya, A.; Kale, V.P. TGF-beta signaling and its role in the regulation of hematopoietic stem cells. Syst. Synth. Biol. 2015, 9, 1–10. [Google Scholar] [CrossRef] [PubMed] [Green Version]
- Singbrant, S.; Karlsson, G.; Ehinger, M.; Olsson, K.; Jaako, P.; Miharada, K.; Stadtfeld, M.; Graf, T.; Karlsson, S. Canonical BMP signaling is dispensable for hematopoietic stem cell function in both adult and fetal liver hematopoiesis, but essential to preserve colon architecture. Blood 2010, 115, 4689–4698. [Google Scholar] [CrossRef] [PubMed] [Green Version]
- Takabe, Y.; Yagi, S.; Koike, T.; Shiojiri, N. Immunomagnetic exclusion of E-cadherin-positive hepatoblasts in fetal mouse liver cell cultures impairs morphogenesis and gene expression of sinusoidal endothelial cells. J. Anat. 2012, 221, 229–239. [Google Scholar] [CrossRef] [PubMed]
- Li, Q.; Van Antwerp, D.J.; Mercurio, F.; Lee, K.-F.; Inder, V.M. Severe Liver Degeneration in Mice Lacking the IκB Kinase 2 Gene. Science 1999, 284, 321–325. [Google Scholar] [CrossRef] [Green Version]
- Rudolph, D.; Yeh, W.C.; Wakeham, A.; Rudolph, B.; Nallainathan, D.; Potter, J.; Elia, A.J.; Mak, T.W. Severe liver degeneration and lack of NF-κB activation in NEMO/IKK γ- deficient mice. Genes Dev. 2000, 14, 854–862. [Google Scholar]
- Mayr, B.; Montminy, M. Transcriptional regulation by the phosphorylation-dependent factor creb. Nat. Rev. Mol. Cell Biol. 2001, 2, 599–609. [Google Scholar] [CrossRef]
- Beg, A.A.; Baltimore, D. An essential role for NF-κB in preventing TNF-α-induced cell death. Science 1996, 274, 782–784. [Google Scholar] [CrossRef]
- Ohsawa, T.; Natori, S. Expression of tumor necrosis factor at a specific developmental stage of mouse embryos. Dev. Biol. 1989, 135, 459–461. [Google Scholar] [CrossRef]
- Kizaki, H.; Suzuki, K.; Tadakuma, T.; Ishimura, Y. Adenosine Receptor-mediated T-lymphocyte Death through Internucleosomal. J. Biol. Chem. 1990, 265, 5280–5284. [Google Scholar]
- McConkey, D.J.; Orrenius, S.; Jondal, M. Agents that elevate cAMP stimulate DNA fragmentation in thymocytes. J. Immunol. 1990, 145, 1227–1230. [Google Scholar]
- Vintermyr, O.K.; Gjertsen, B.T.; Lanotte, M.; Døskeland, S.O. Microinjected catalytic subunit of cAMP-dependent protein kinase induces apoptosis in myeloid leukemia (IPC-81) cells. Exp. Cell Res. 1993, 206, 157–161. [Google Scholar] [CrossRef] [PubMed]
- Aharoni, D.; Dantes, A.; Oren, M.; Amsterdam, A. cAMP-mediated signals as determinants for apoptosis in primary granulosa cells. Exp. Cell Res. 1995, 218, 271–282. [Google Scholar] [CrossRef] [PubMed]
- Keren-Tal, I.; Suh, B.S.; Dantes, A.; Lindner, S.; Oren, M.; Amsterdam, A. Involvement of p53 expression in cAMP-mediated apoptosis in immortalized granulosa cells. Exp. Cell Res. 1995, 218, 283–295. [Google Scholar] [CrossRef] [PubMed]
- Bøe, R.; Gjertsen, B.T.; Døskeland, S.O.; Vintermyr, O.K. 8-Chloro-cAMP induces apoptotic cell death in a human mammary carcinoma cell (MCF-7) line. Br. J. Cancer 1995, 72, 1151–1159. [Google Scholar] [CrossRef] [Green Version]
- Rossi, A.G.; Cousin, J.M.; Dransfield, I.; Lawson, M.F.; Chilvers, E.R.; Haslett, C. Agents that elevate cAMP inhibit human neutrophil apoptosis. Biochem. Biophys. Res. Commun. 1995, 217, 892–899. [Google Scholar] [CrossRef]
- Messmer, U.K.; Lapetina, E.G.; Brune, B. Nitric oxide-induced apoptosis in RAW 264.7 macrophages is antagonized by protein kinase C- and protein kinase A-activating compounds. Mol. Pharmacol. 1995, 47, 757–765. [Google Scholar]
- Flaws, J.A.; Desanti, A.; Tilly, K.I.; Javid, R.O.; Kugu, K.; Johnson, A.L.; Hirshfield, A.N.; Tilly, J.L. Vasoactive intestinal peptide-mediated suppression of apoptosis in the ovary: Potential mechanisms of action and evidence of a conserved antiatretogenic role through evolution. Endocrinology 1995, 136, 4351–4359. [Google Scholar] [CrossRef]
- Hoshi, S.; Furutani-selki, M.; Seto, M.; Tada, T.; Asano, Y. Prevention of TCR-mediated apoptosis by the elevation ofcAMP. Int. Immunol. 1994, 6, 1081–1090. [Google Scholar] [CrossRef]
- Li, D.; Wang, G.Y.; Liu, Z.F.; Shi, Y.X.; Zhang, H.; Bai, Z.L. Macrophage-associated erythropoiesis and lymphocytopoiesis in mouse fetal liver: Ultrastructural and ISH analysis. Cell Biol. Int. 2004, 28, 457–461. [Google Scholar] [CrossRef]
- Molina, C.A.; Foulkes, N.S.; Lalli, E.; Sassone-Corsi, P. Inducibility and negative autoregulation of CREM: An alternative promoter directs the expression of ICER, an early response repressor. Cell 1993, 75, 875–886. [Google Scholar] [CrossRef]
- Jaworski, J.; Mioduszewska, B.; Sánchez-Capelo, A.; Figiel, I.; Habas, A.; Gozdz, A.; Proszynski, T.; Hetman, M.; Mallet, J.; Kaczmarek, L. Inducible cAMP early repressor, an endogenous antagonist of cAMP responsive element-binding protein, evokes neuronal apoptosis in vitro. J. Neurosci. 2003, 23, 4519–4526. [Google Scholar] [CrossRef] [PubMed] [Green Version]
- Ding, B.; Abe, J.I.; Wei, H.; Xu, H.; Che, W.; Aizawa, T.; Liu, W.; Molina, C.A.; Sadoshima, J.; Blaxall, B.C.; et al. A positive feedback loop of phosphodiesterase 3 (PDE3) and inducible cAMP early repressor (ICER) leads to cardiomyocyte apoptosis. Proc. Natl. Acad. Sci. USA 2005, 102, 14771–14776. [Google Scholar] [CrossRef] [PubMed] [Green Version]
- Amaya, M.J.; Nathanson, M.H. Calcium signaling in the liver. Compr. Physiol. 2013, 3, 515–539. [Google Scholar] [CrossRef] [PubMed] [Green Version]
- Baldock, R.; Bard, J.; Davidson, D.R.; Morriss-Kay, G. Kaufman’s Atlas of Mouse Development Supplement; Academic Press: Cambridge, MA, USA, 2015. [Google Scholar] [CrossRef]
- Dorr, A.E.; Lerch, J.P.; Spring, S.; Kabani, N.; Henkelman, R.M. High resolution three-dimensional brain atlas using an average magnetic resonance image of 40 adult C57Bl/6J mice. NeuroImage 2008, 42, 60–69. [Google Scholar] [CrossRef]


© 2020 by the authors. Licensee MDPI, Basel, Switzerland. This article is an open access article distributed under the terms and conditions of the Creative Commons Attribution (CC BY) license (http://creativecommons.org/licenses/by/4.0/).
Share and Cite
Barbagallo, F.; Rotilio, V.; Assenza, M.R.; Aguanno, S.; Orsini, T.; Putti, S.; Isidori, A.M.; Lenzi, A.; Naro, F.; De Angelis, L.; et al. PDE2A Is Indispensable for Mouse Liver Development and Hematopoiesis. Int. J. Mol. Sci. 2020, 21, 2902. https://doi.org/10.3390/ijms21082902
Barbagallo F, Rotilio V, Assenza MR, Aguanno S, Orsini T, Putti S, Isidori AM, Lenzi A, Naro F, De Angelis L, et al. PDE2A Is Indispensable for Mouse Liver Development and Hematopoiesis. International Journal of Molecular Sciences. 2020; 21(8):2902. https://doi.org/10.3390/ijms21082902
Chicago/Turabian StyleBarbagallo, Federica, Valentina Rotilio, Maria Rita Assenza, Salvatore Aguanno, Tiziana Orsini, Sabrina Putti, Andrea M. Isidori, Andrea Lenzi, Fabio Naro, Luciana De Angelis, and et al. 2020. "PDE2A Is Indispensable for Mouse Liver Development and Hematopoiesis" International Journal of Molecular Sciences 21, no. 8: 2902. https://doi.org/10.3390/ijms21082902