Transcriptome Analysis and Identification of Genes Associated with Starch Metabolism in Castanea henryi Seed (Fagaceae)

 and
and 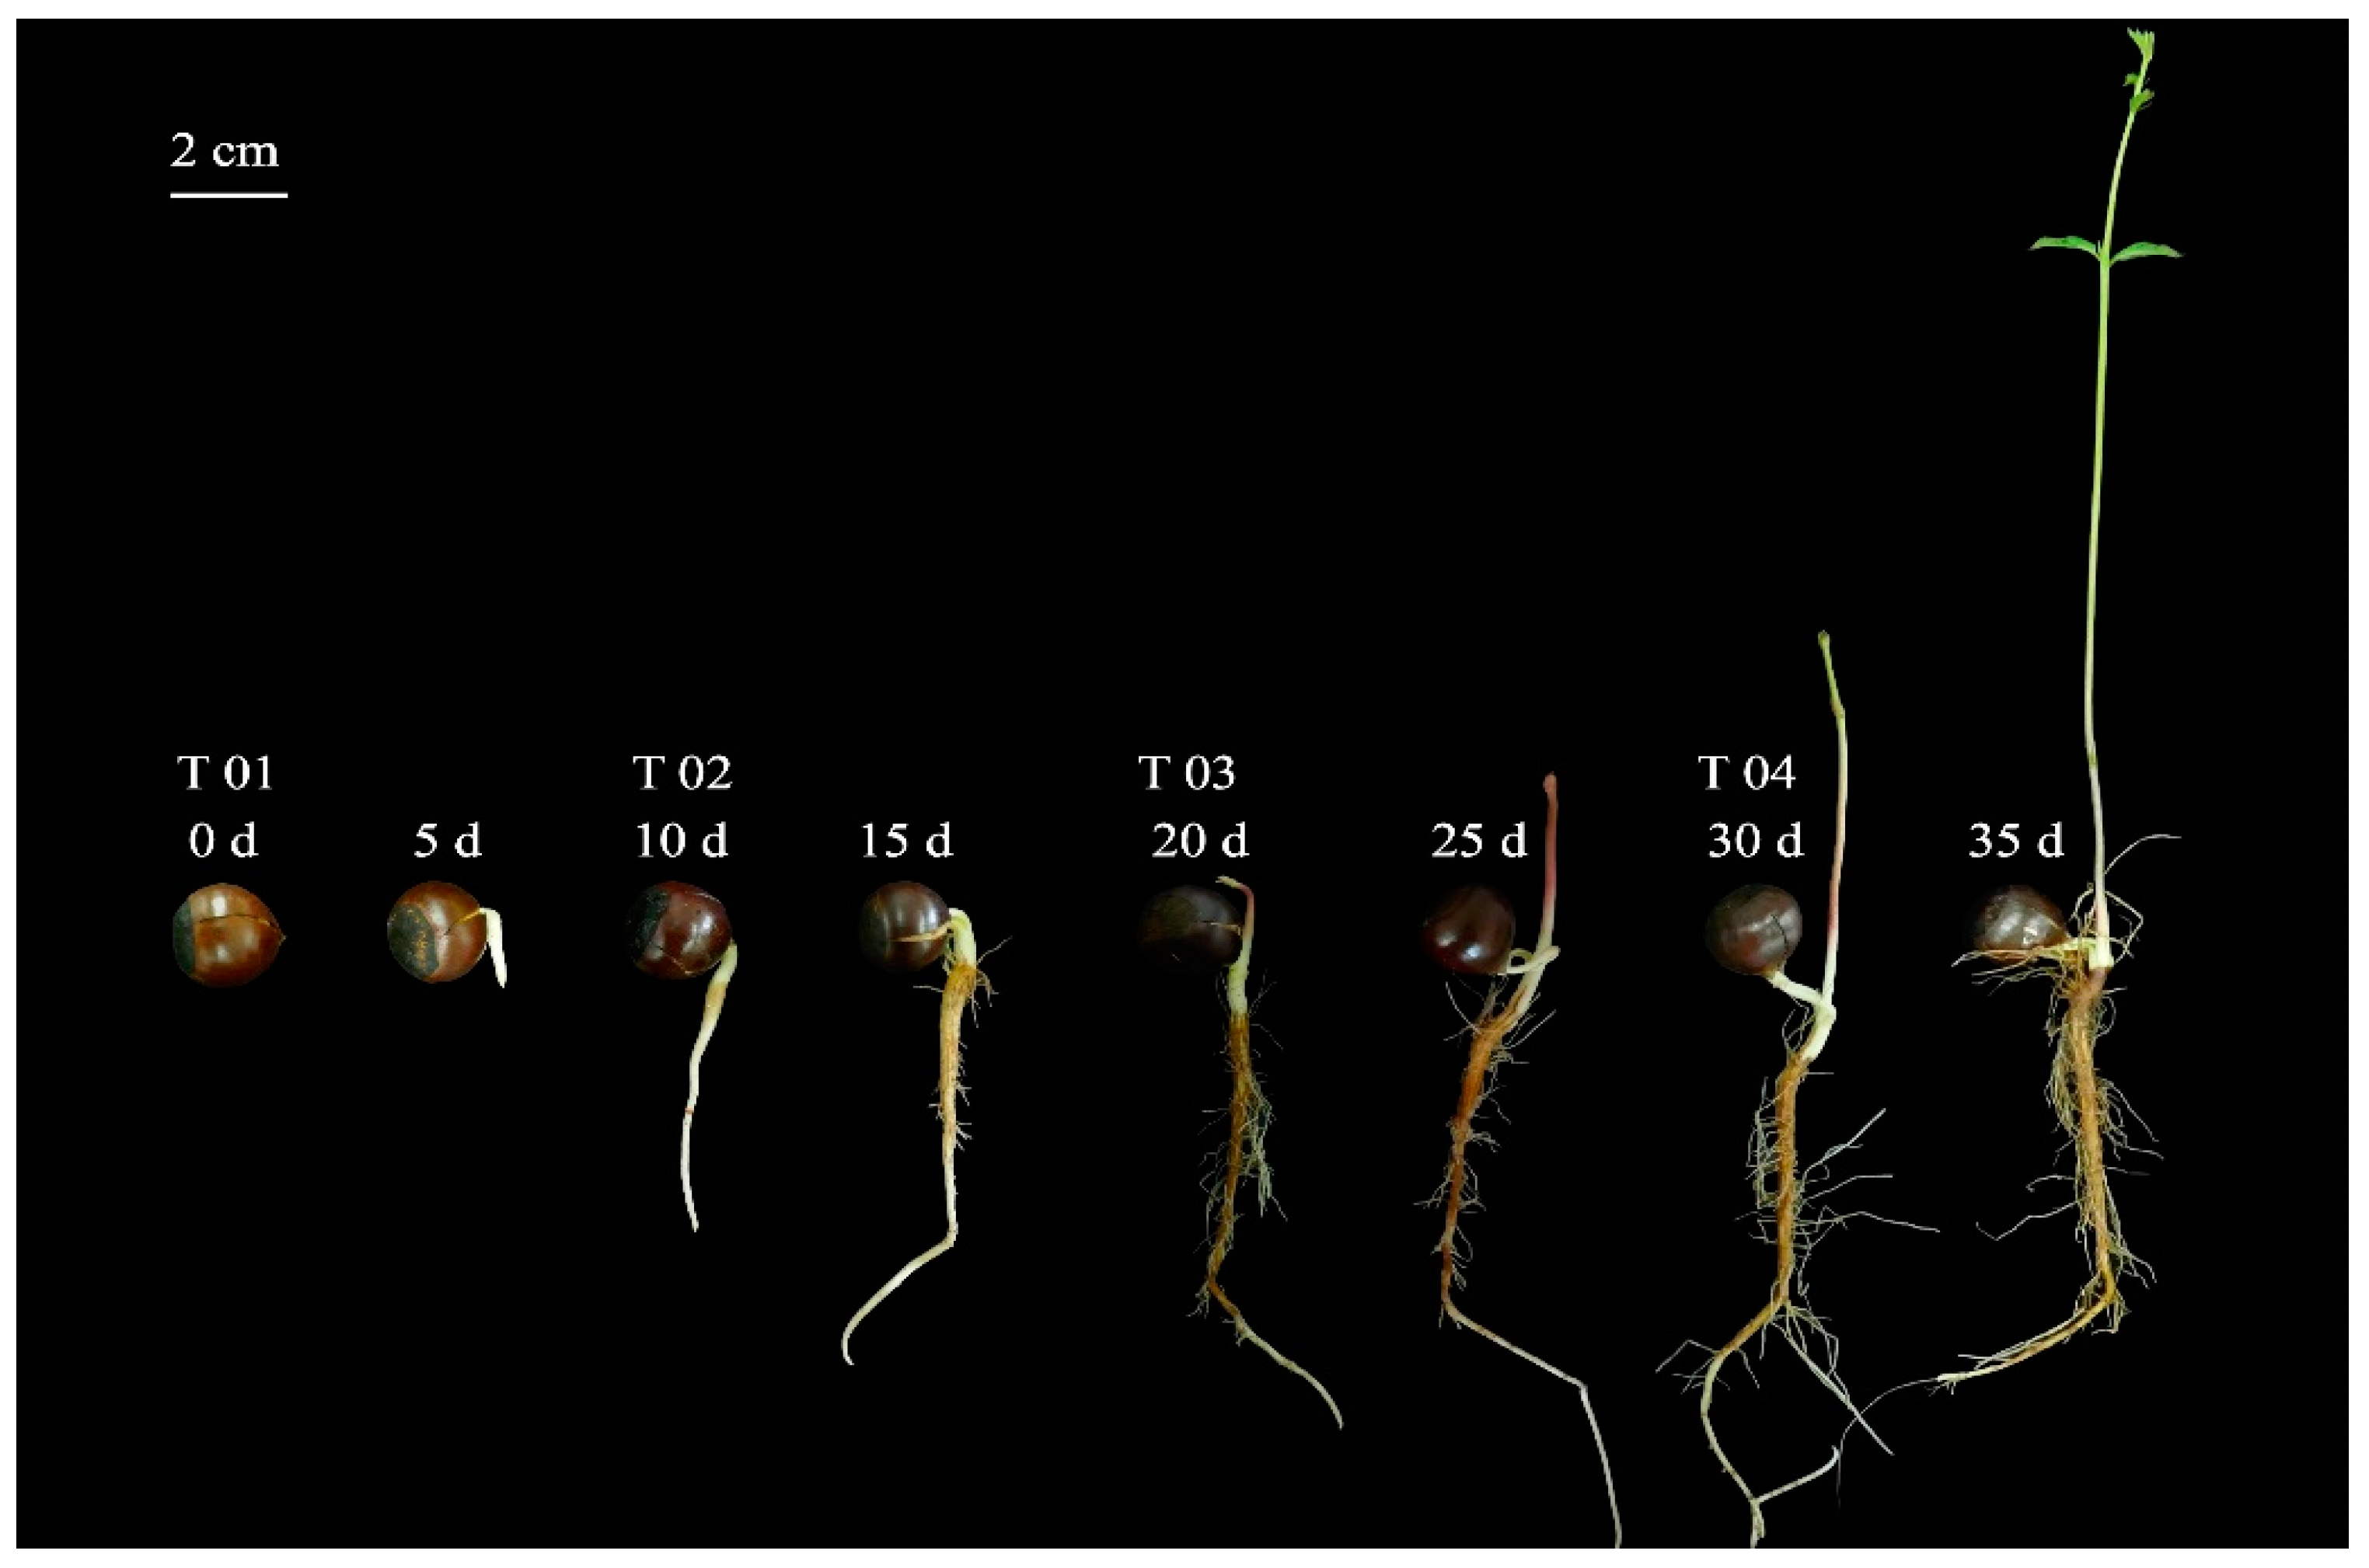
Abstract
:1. Introduction
2. Results
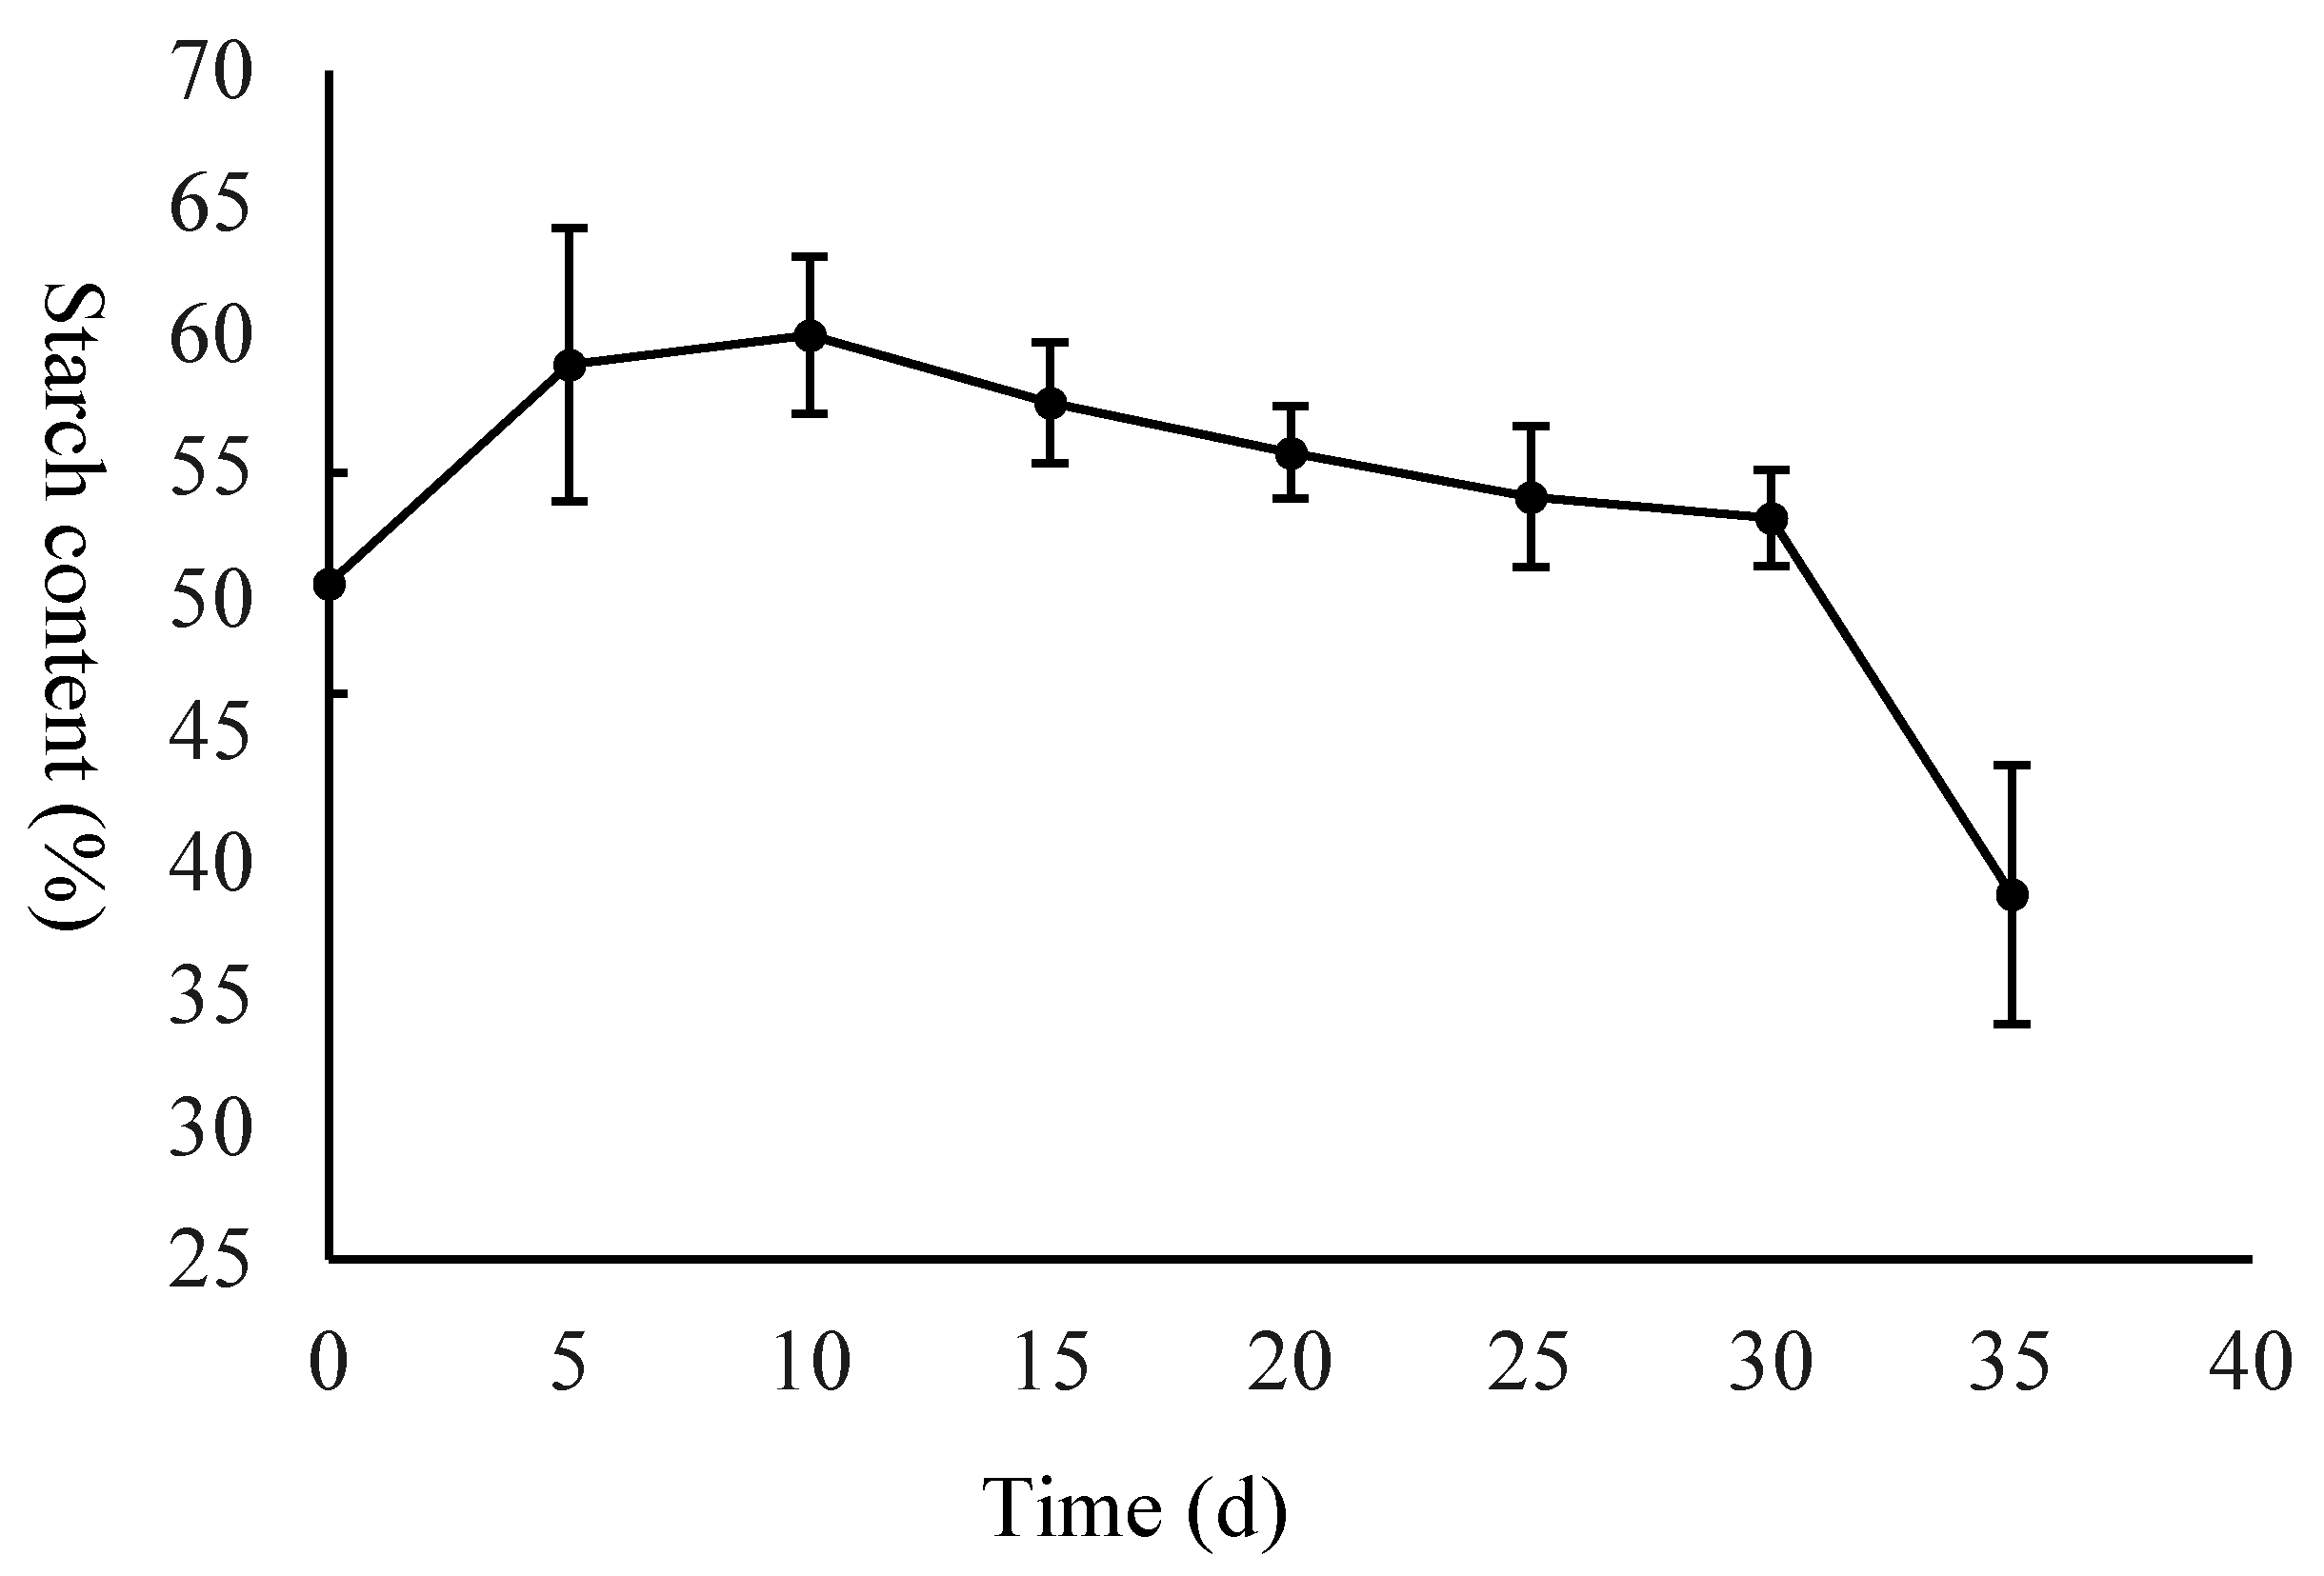
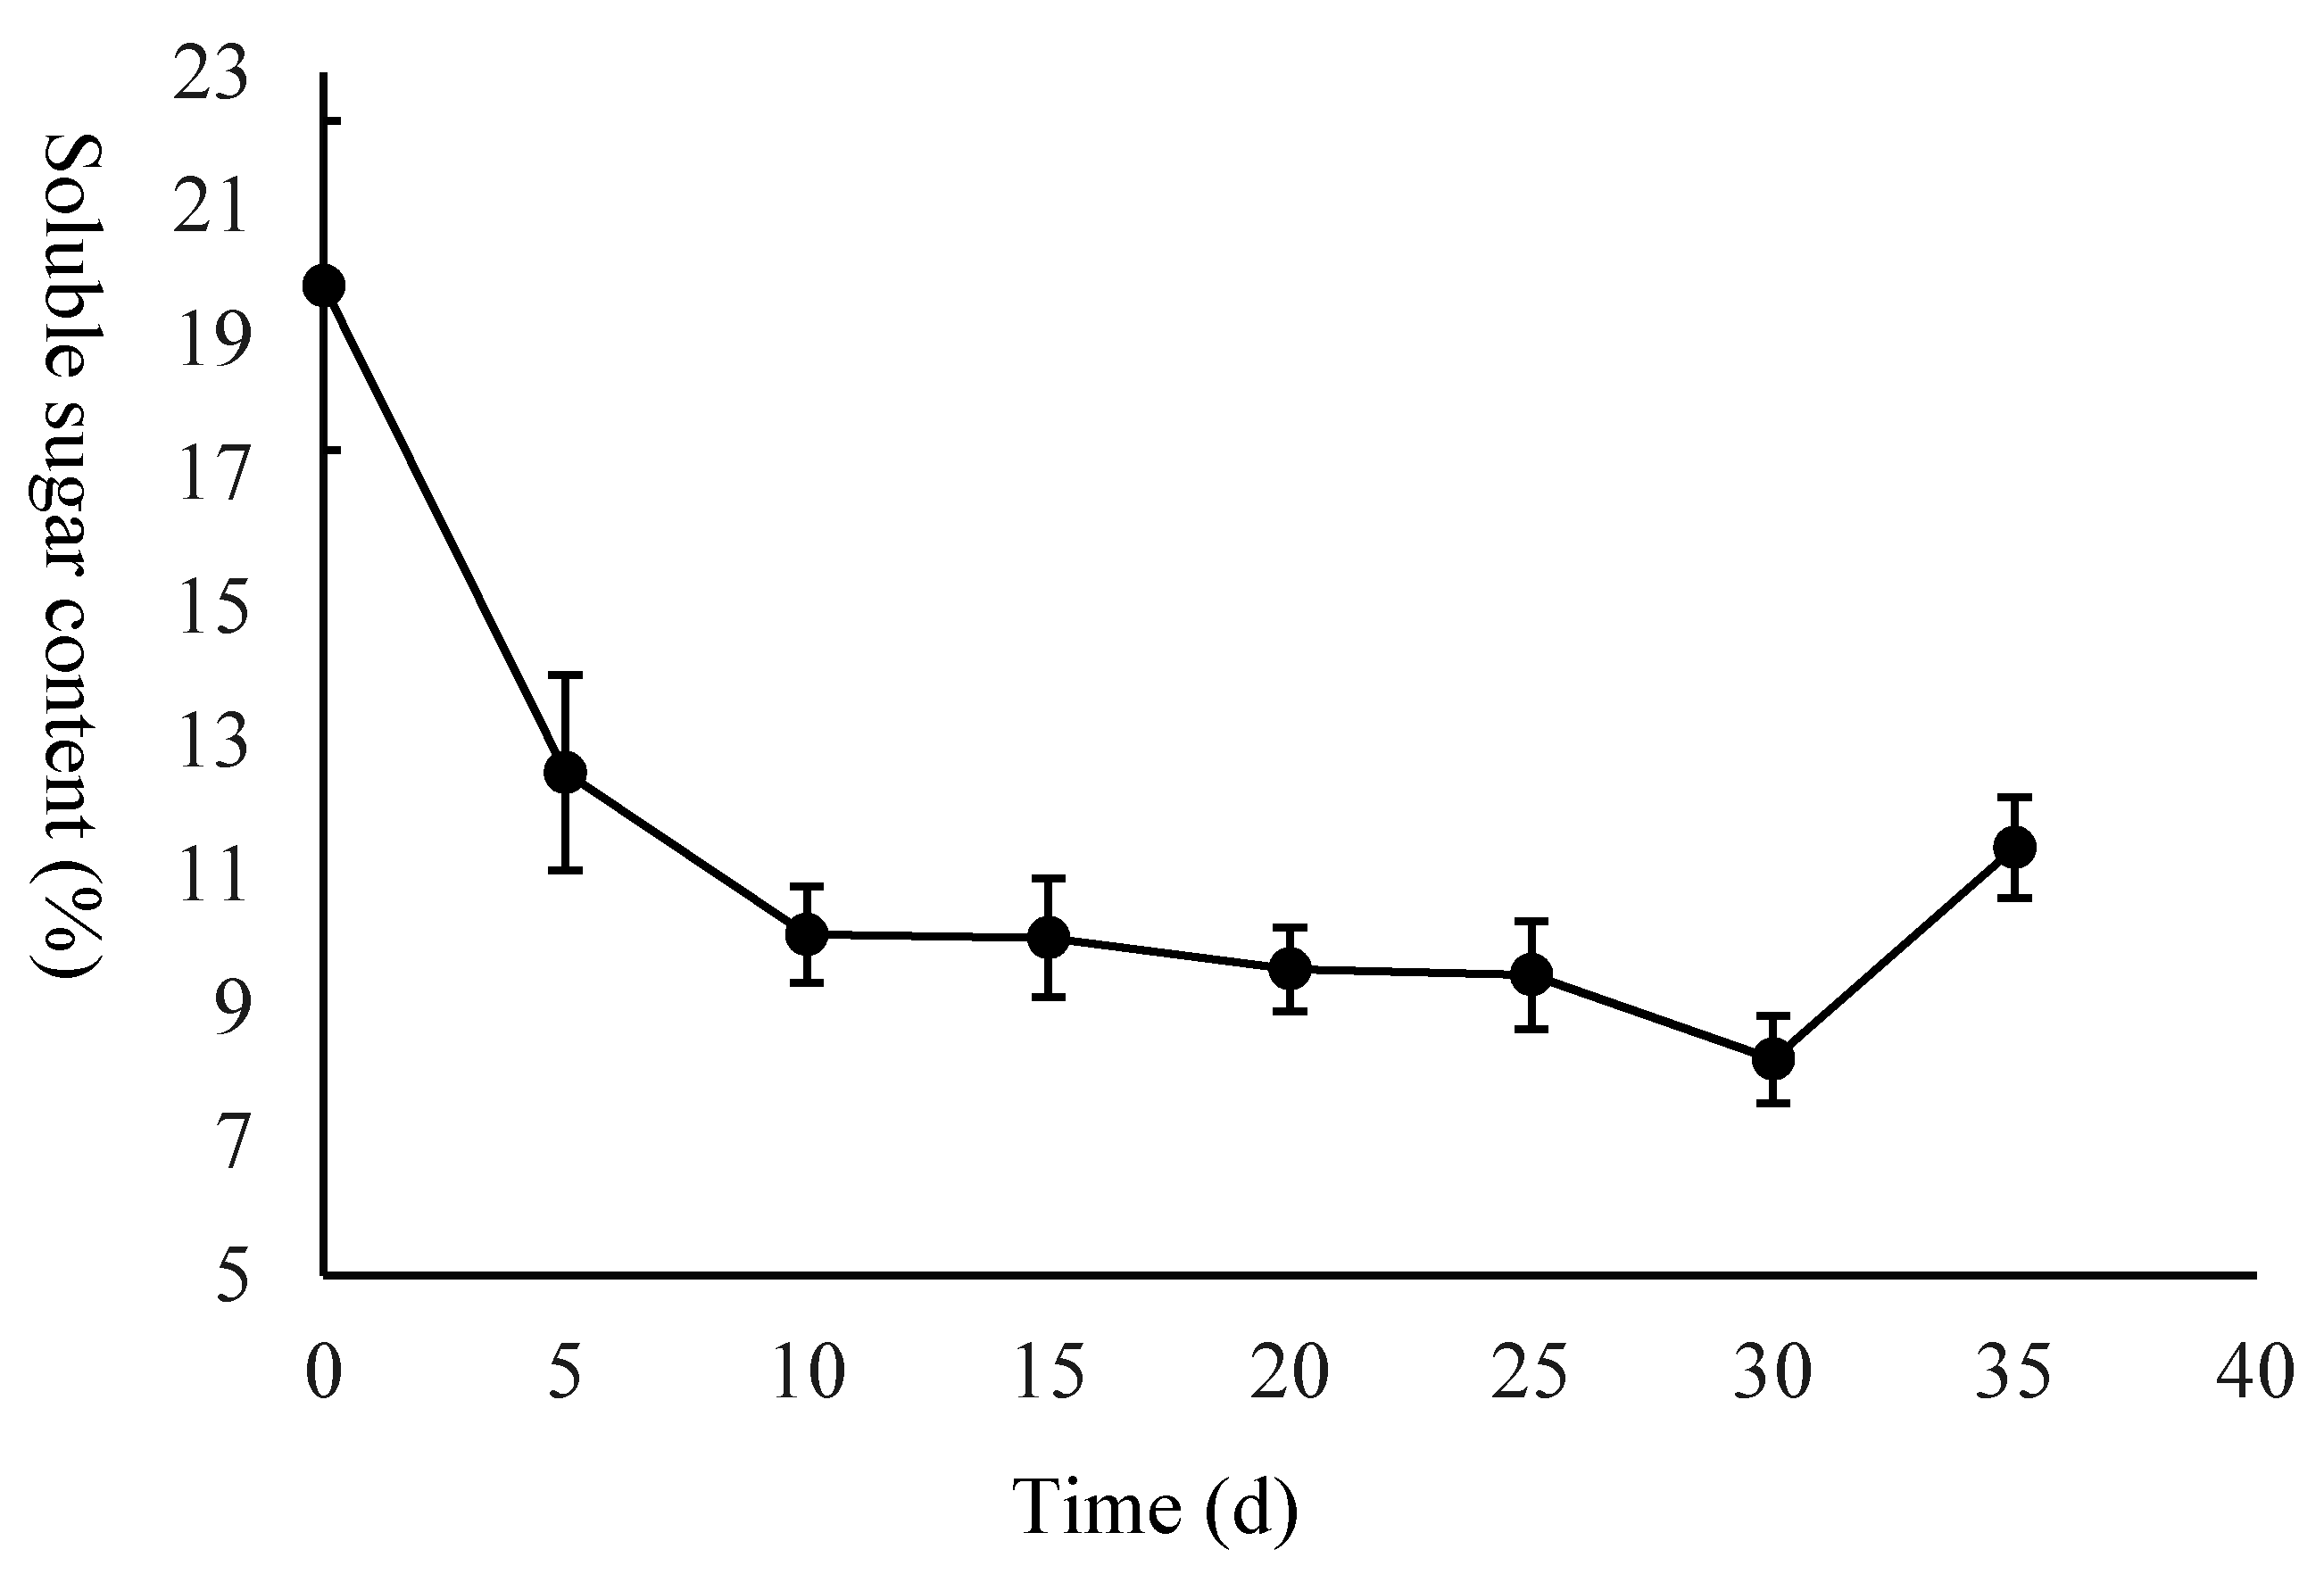
2.1. Morphological Evaluation of the Seed and Starch and Sugar Analysis
2.2. Overview of Transcriptome Sequencing
2.3. Functional Annotation of Genes and Co-Expression Analysis
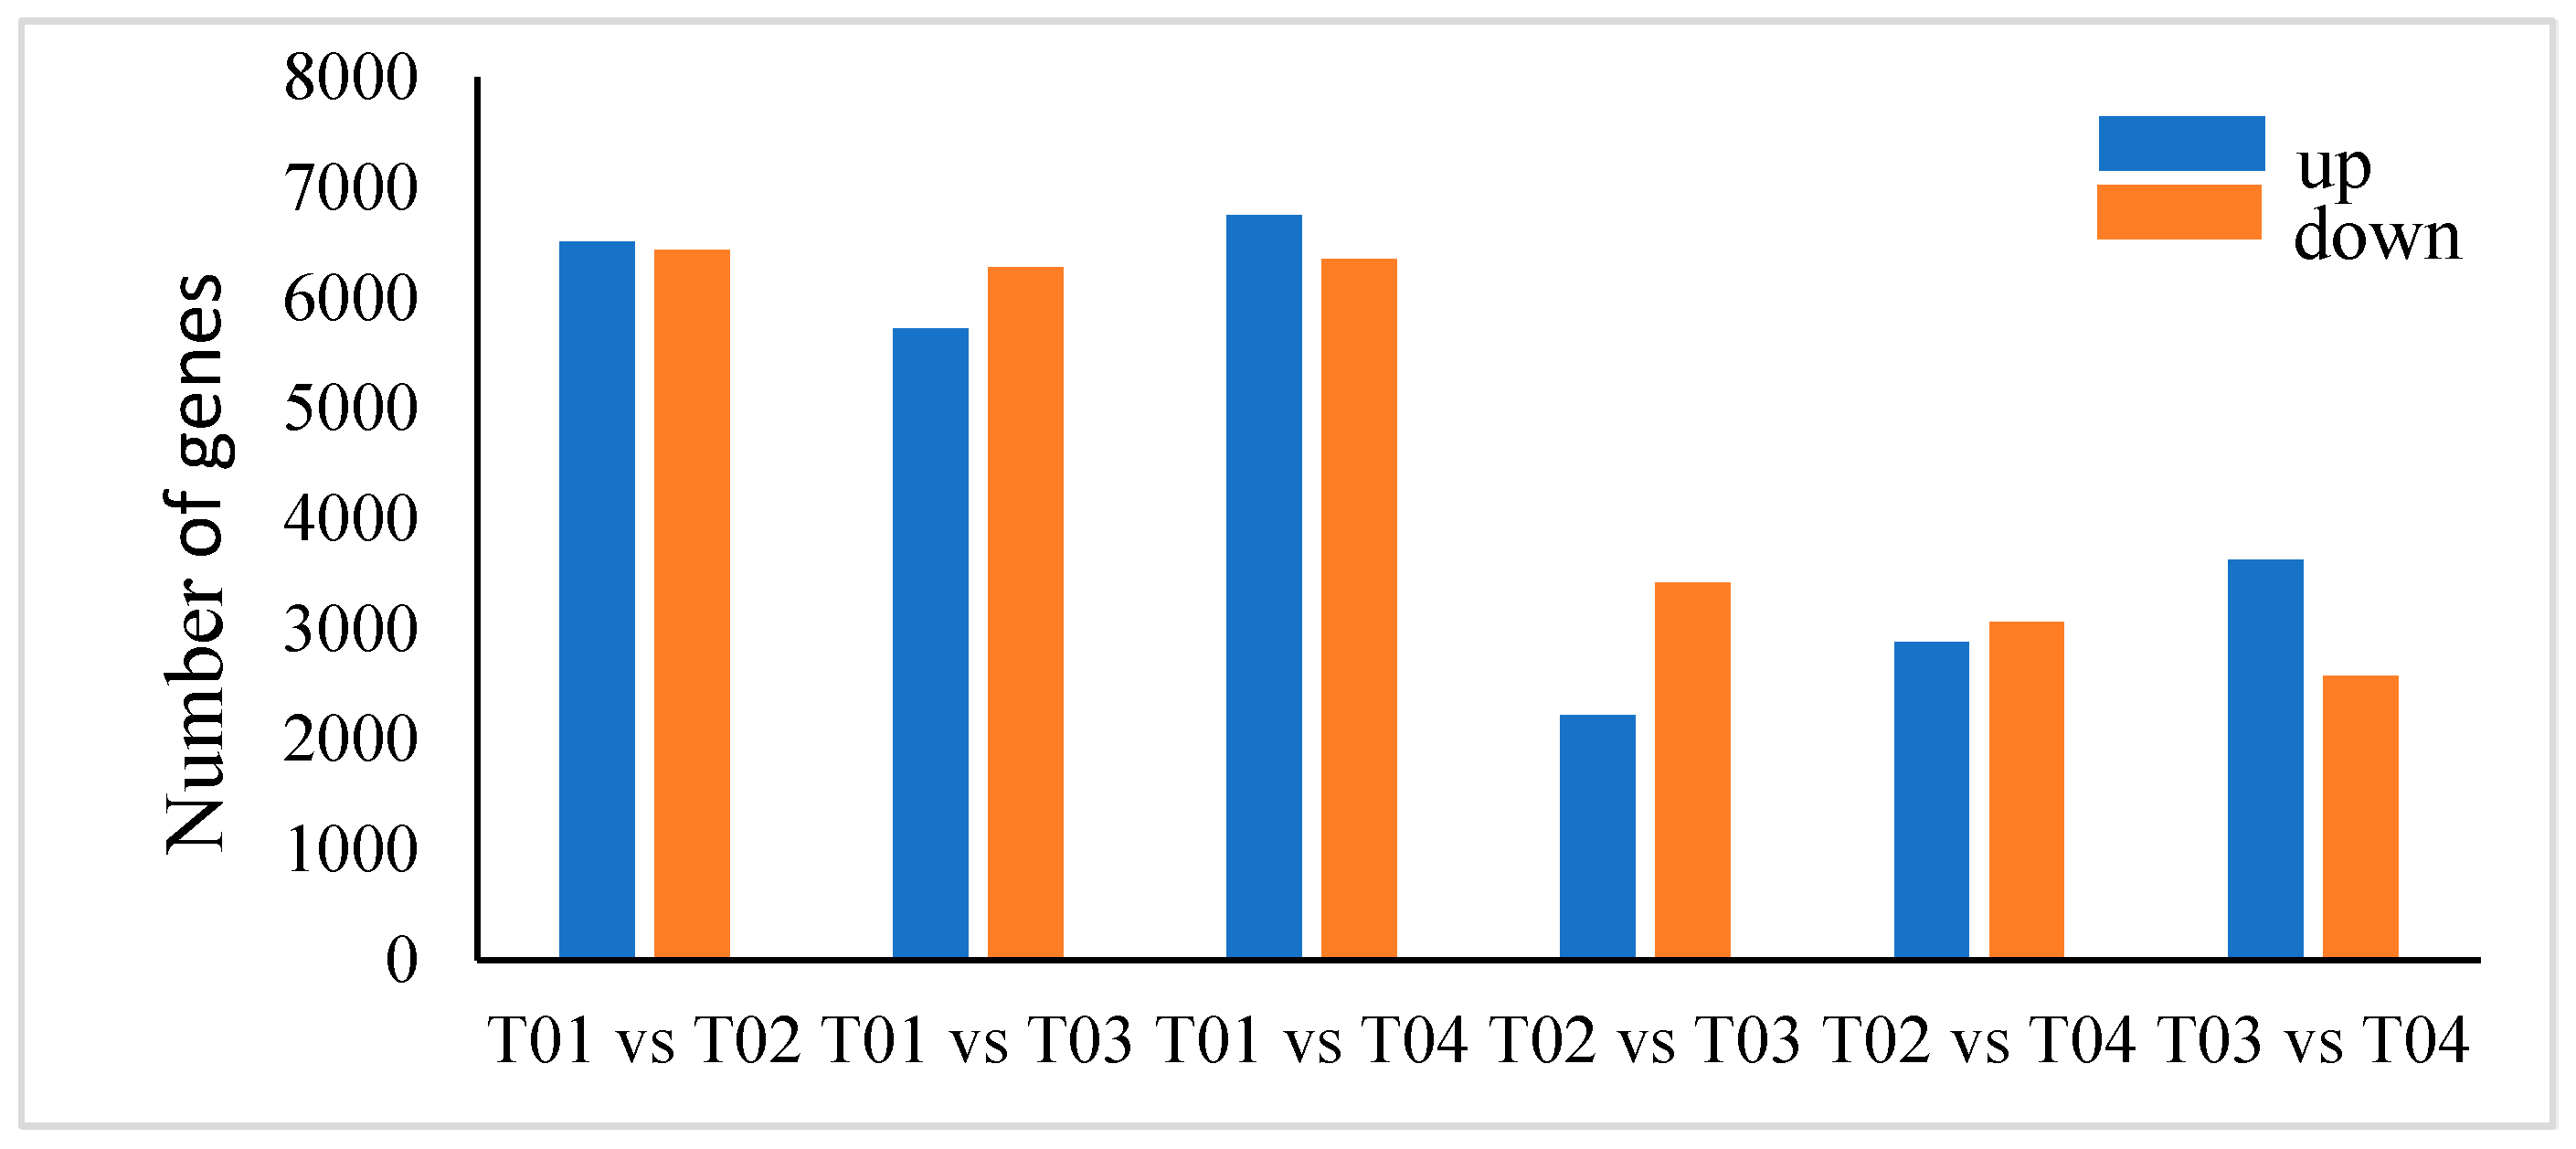
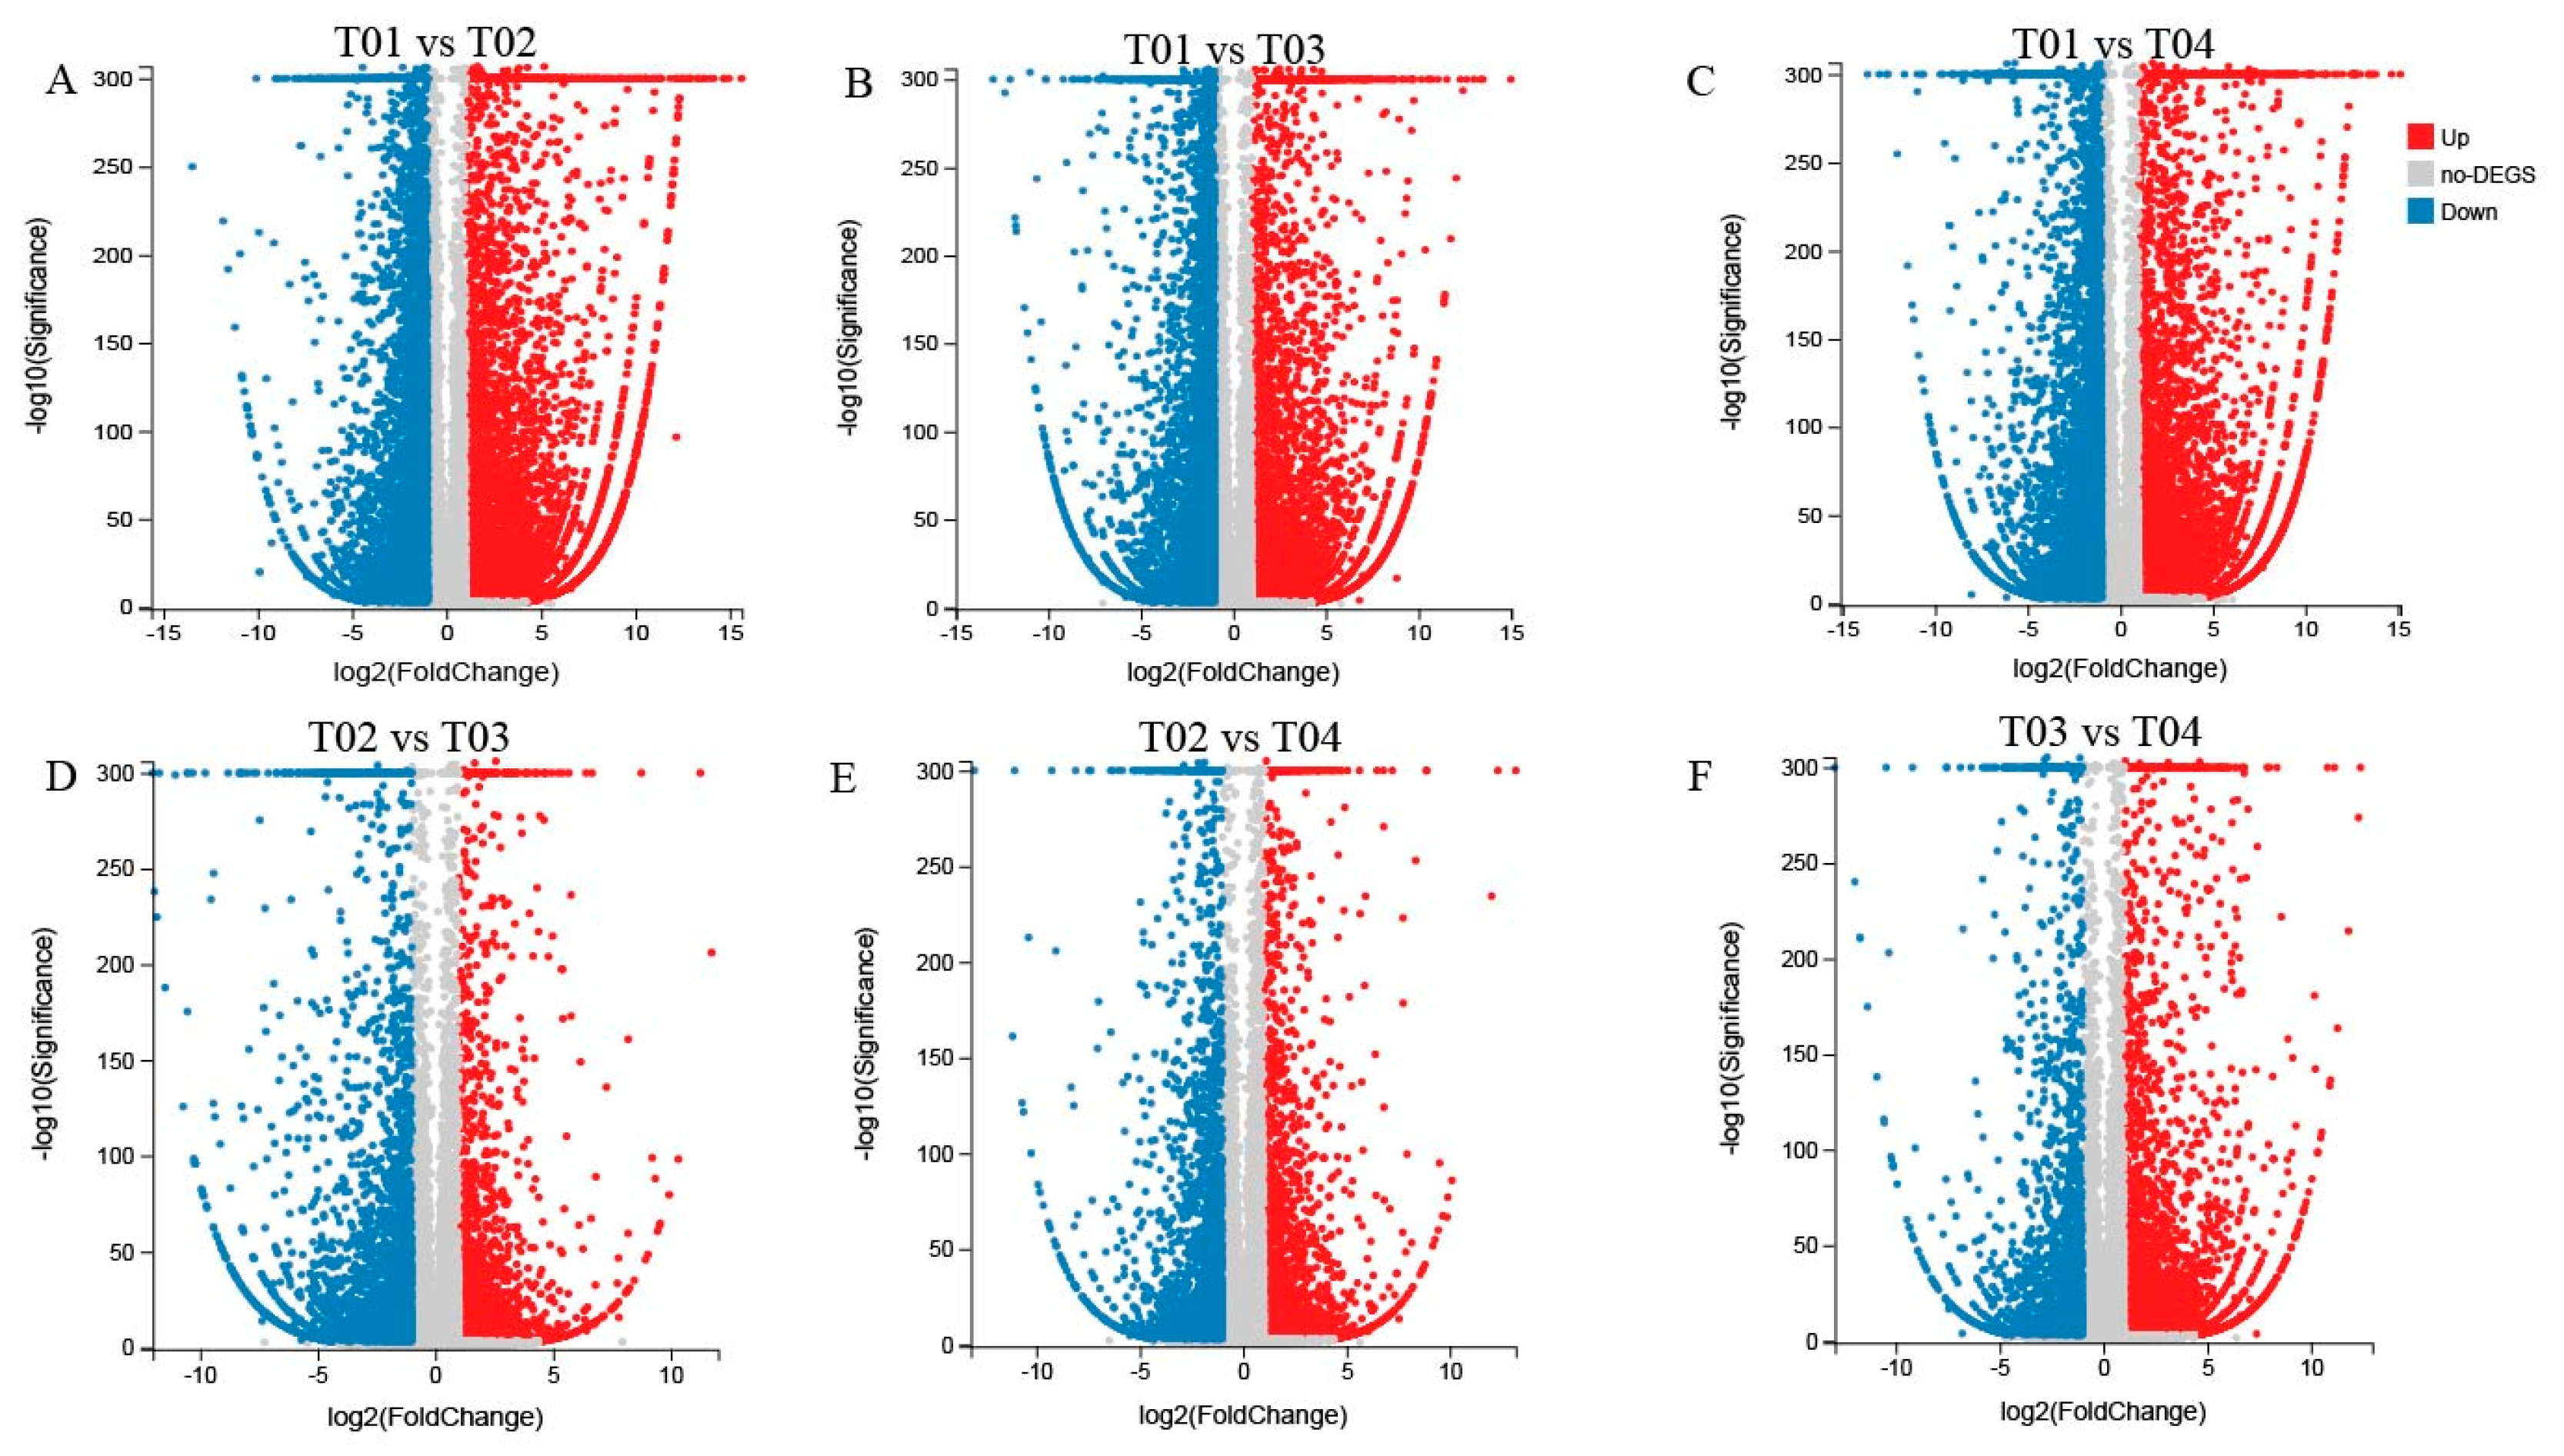
2.4. Identification and Selection of DEGs
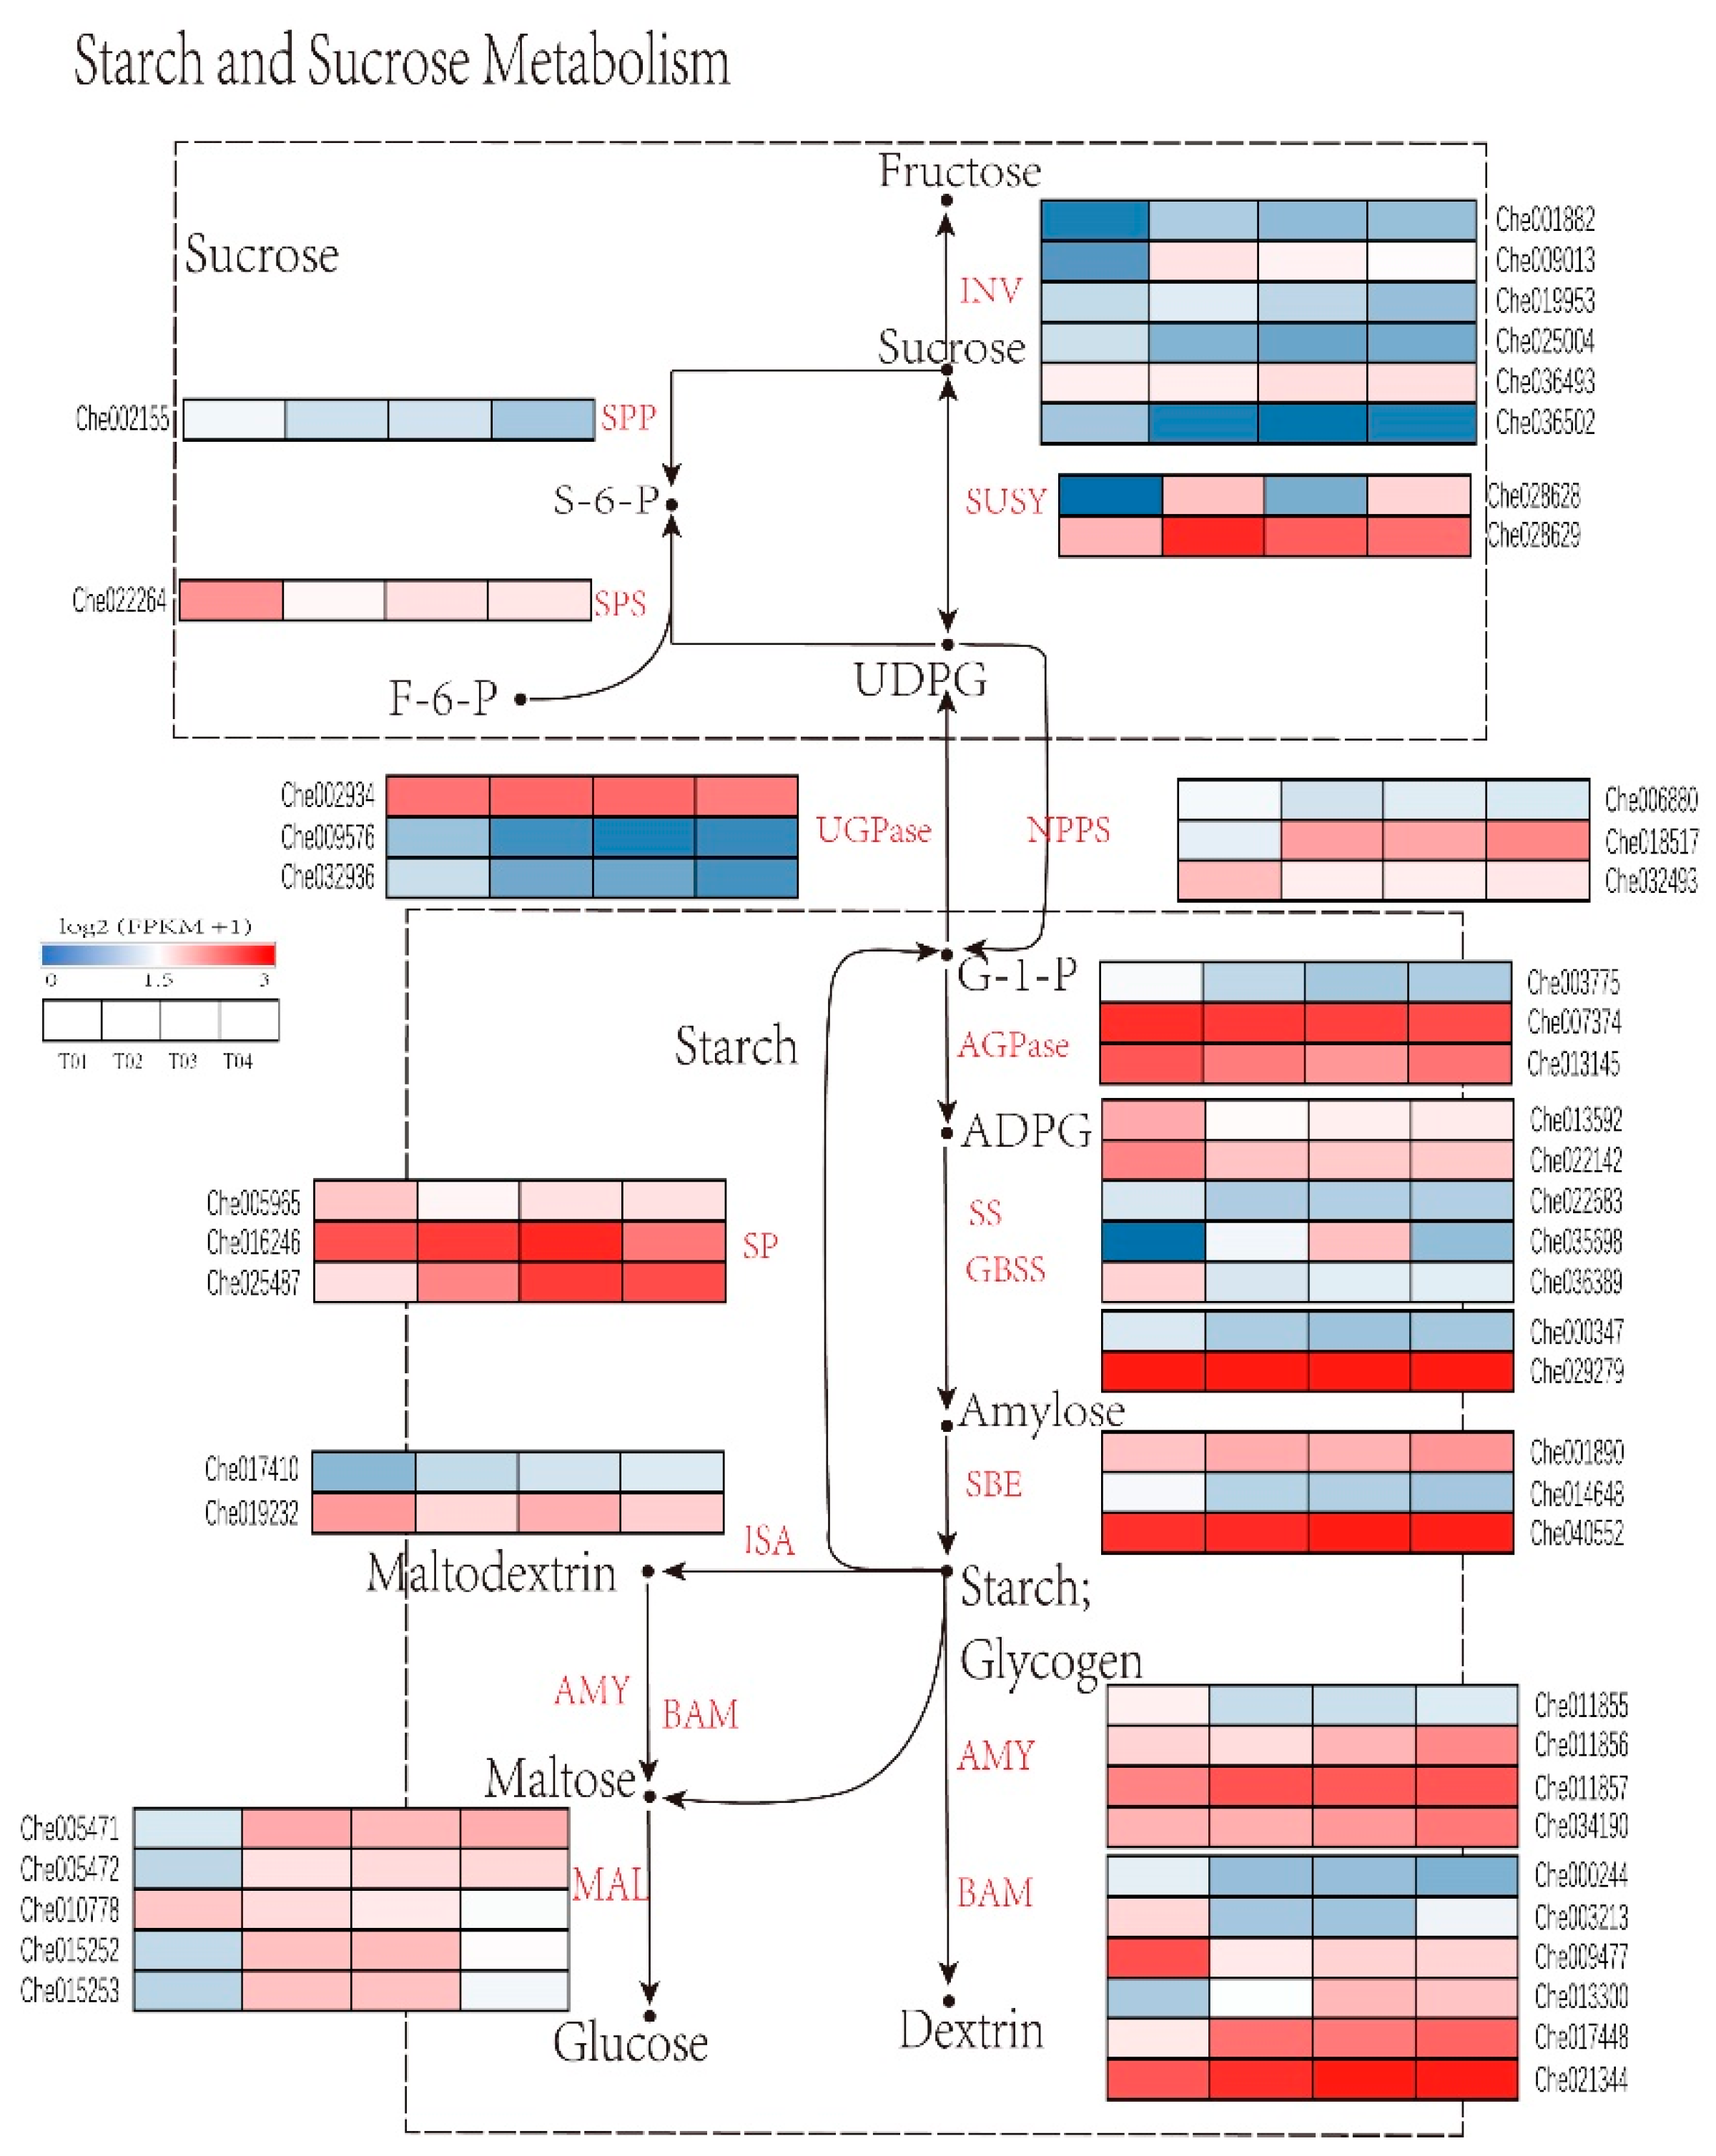
2.5. Identification of Genes Critical for Starch and Sucrose Metabolism in C. henryi Seeds
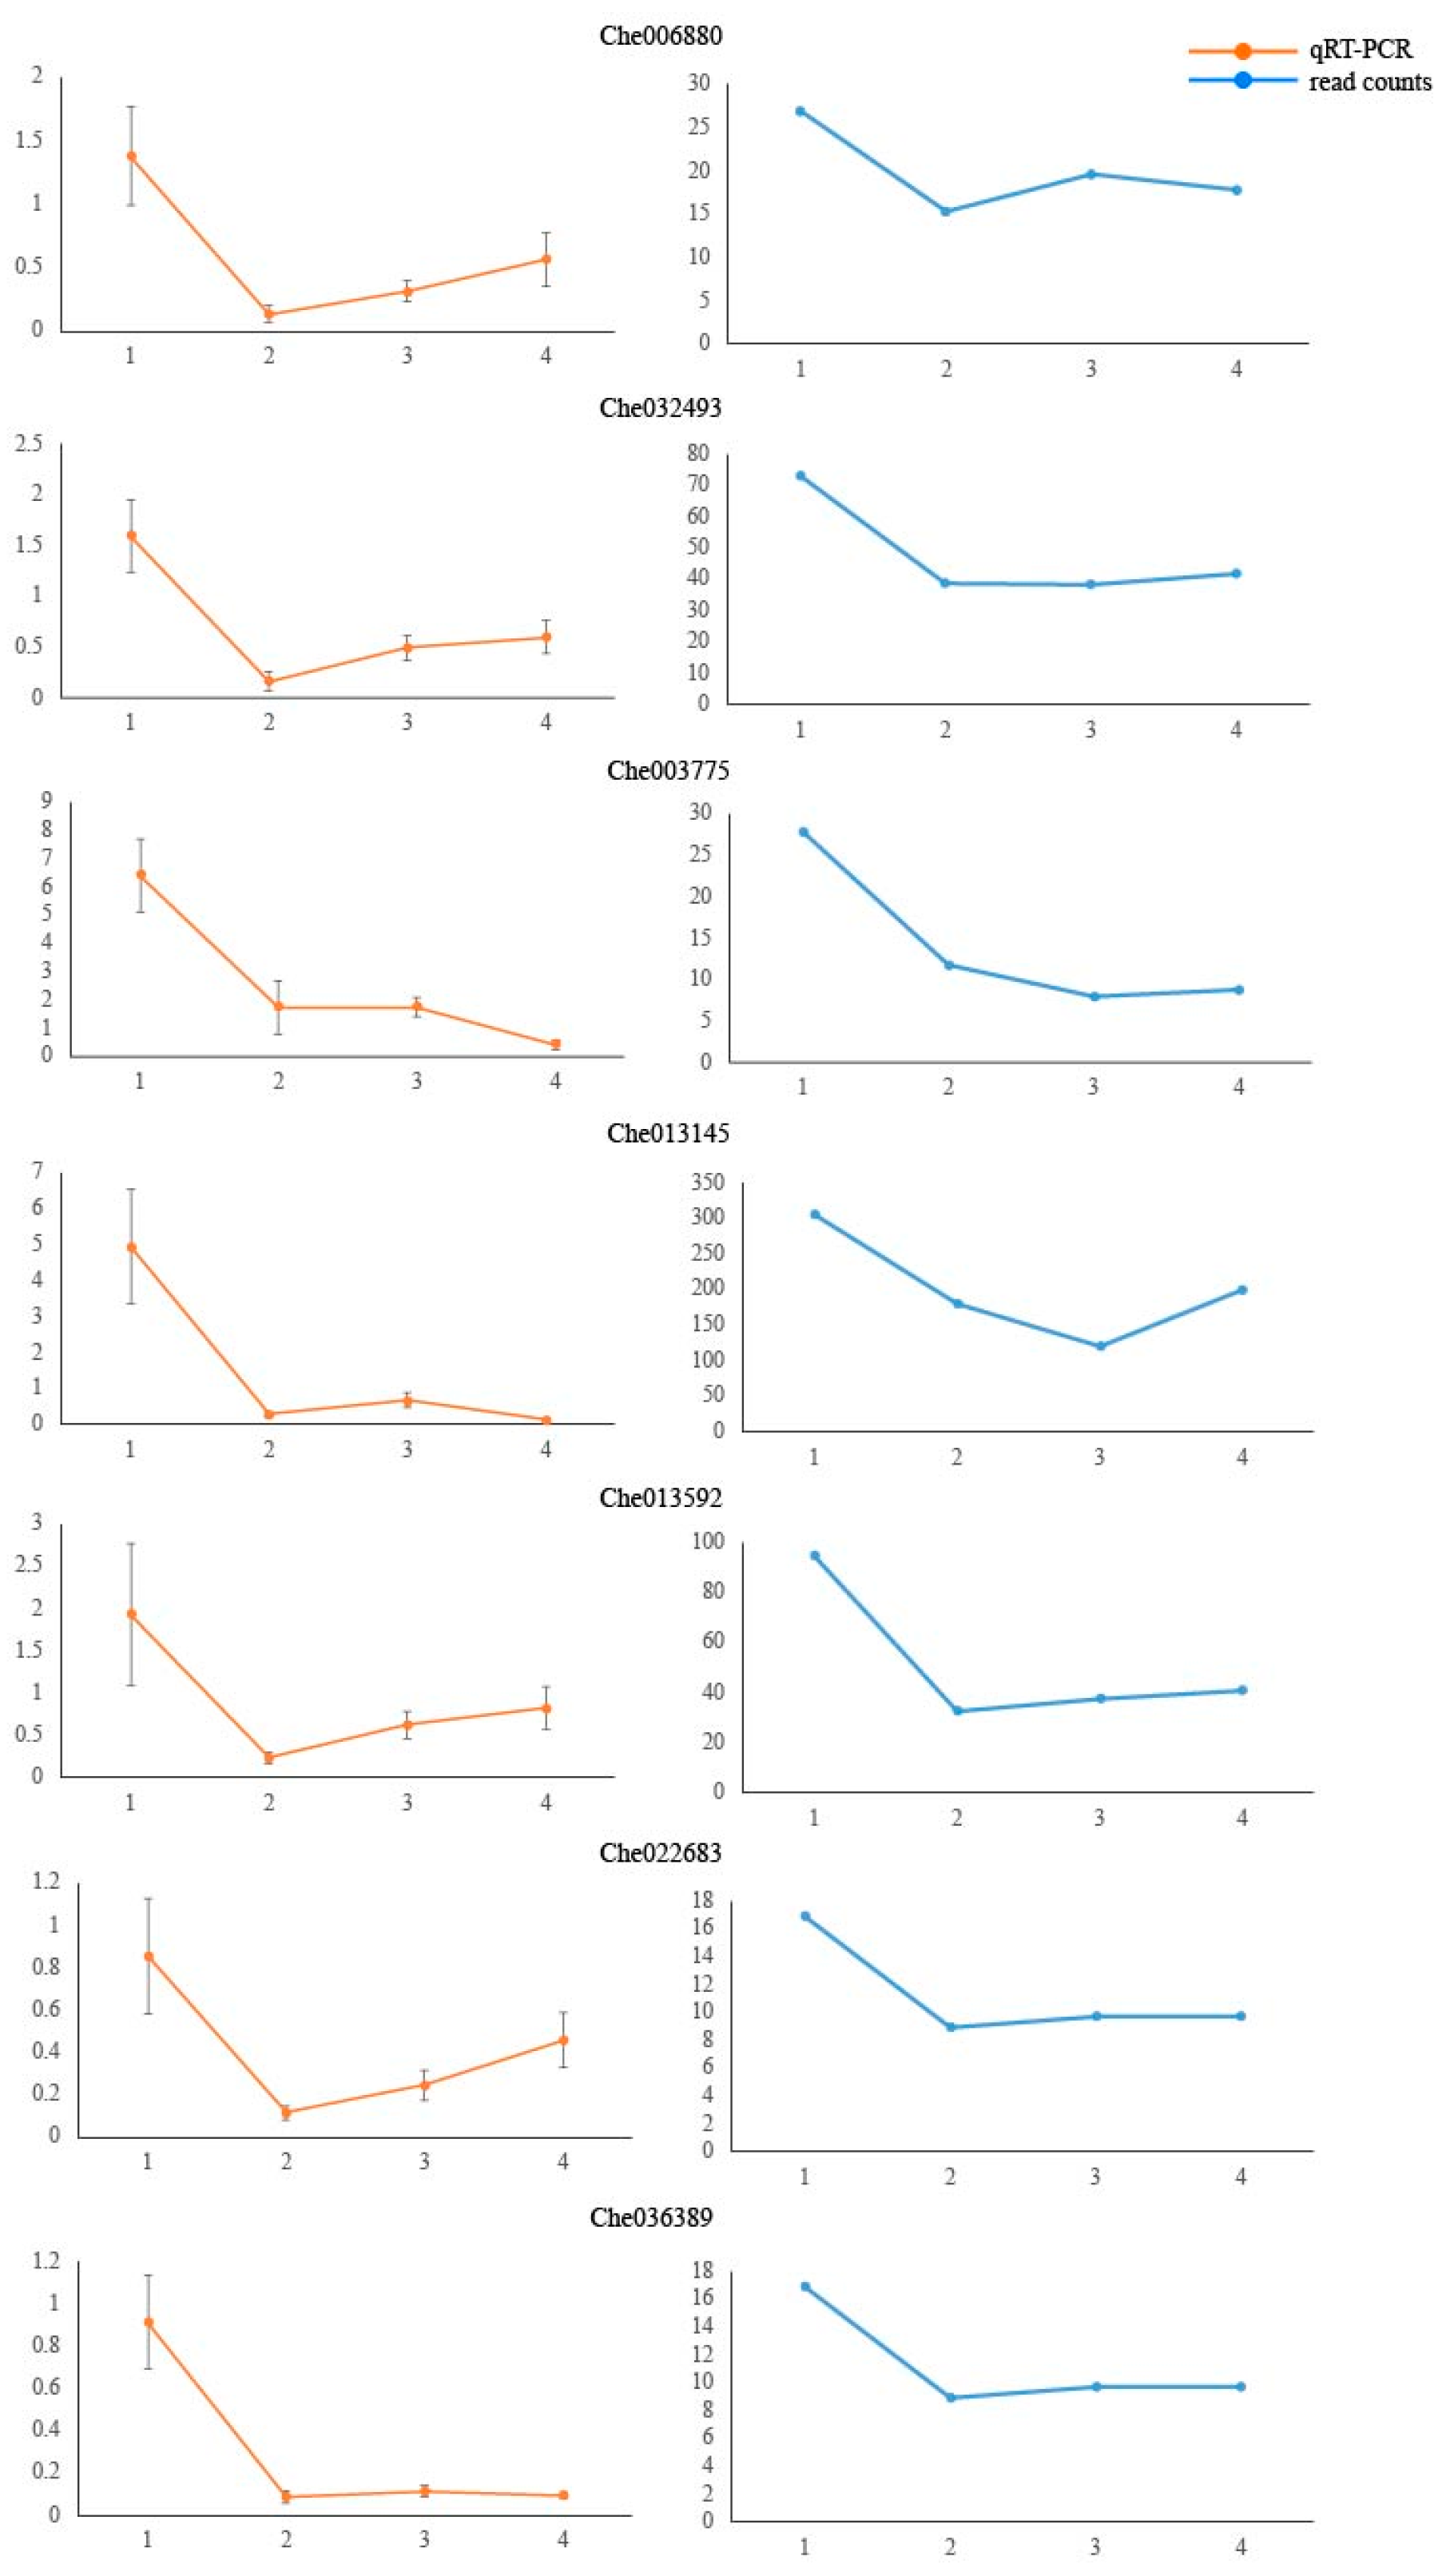
2.6. qRT-PCR Gene Expression Analysis
3. Discussion
4. Materials and Methods
4.1. Plant Materials
4.2. Measurement of Starch and Soluble Sugar Content
4.3. RNA Extraction and High-Throughput Sequencing
4.4. Raw Data Analysis and Alignment of Reads to the Reference Genome
4.5. Identification of Differentially Expressed Genes
4.6. Quantitative Real-Time PCR
5. Conclusions
Supplementary Materials
Author Contributions
Funding
Acknowledgments
Conflicts of Interest
References
- Liu, S.P.; Zhou, Q. Response of respiration during seed germination to environment. Chin. J. Eco Agric. 2009, 17, 1035–1038. [Google Scholar] [CrossRef]
- Li, Z.; Peng, Y.; Zhang, X.Q.; Ma, X.; Huang, L.K.; Yan, Y.H. Exogenous spermidine improves seed germination of white clover under water stress via involvement in starch metabolism, antioxidant defenses and relevant gene expression. Molecules 2014, 19, 18003–18024. [Google Scholar] [CrossRef] [PubMed] [Green Version]
- Bewley, J.D. Seed Germination and Dormancy. Plant Cell. 1997, 9, 1055–1066. [Google Scholar] [CrossRef] [PubMed] [Green Version]
- Zhao, M.; Zhang, H.; Yan, H.; Qiu, L.; Baskin, C.C. Mobilization and role of starch, protein, and fat reserves during seed germination of six wild grassland species. Front. Plant Sci. 2018, 9, 234. [Google Scholar] [CrossRef] [Green Version]
- Zhang, K.; Wu, Z.D.; Tang, D.B.; Luo, K.; Lu, H.X.; Liu, Y.Y.; Dong, J.; Wang, X.; Lv, C.W.; Wang, J.C.; et al. Comparative transcriptome analysis reveals critical function of sucrose metabolism related-enzymes in starch accumulation in the storage root of sweet potato. Front. Plant Sci. 2017, 8, 914. [Google Scholar] [CrossRef]
- Wang, J.C.; Xu, H.; Zhu, Y.; Liu, Q.Q.; Cai, X.L. Osbzip58, a basic leucine zipper transcription factor, regulates starch biosynthesis in rice endosperm. J. Exp. Bot. 2013, 64, 3453–3466. [Google Scholar] [CrossRef]
- Dian, W.; Jiang, H.; Wu, P. Evolution and expression analysis of starch synthase III and IV in rice. J. Exp. Bot. 2005, 56, 623–632. [Google Scholar] [CrossRef] [Green Version]
- Juliano, B.O. Varietal impact on rice quality. Cereal Foods World 1998, 43, 207–211. [Google Scholar]
- Smith, A.M. Making starch. Curr. Opin. Plant Biol. 1999, 2, 223–229. [Google Scholar] [CrossRef]
- Tang, Y.; Zeng, X.Q.; Wang, Y.L.; Bai, L.J.; Xu, Q.J.; Wei, Z.X.; Yuan, H.J.; Nyima, T. Transcriptomics analysis of hulless barley during grain development with a focus on starch biosynthesis. Funct. Integr. Genom. 2017, 17, 107–117. [Google Scholar] [CrossRef] [Green Version]
- Lai, Y.C.; Wang, S.Y.; Gao, H.Y.; Nguyen, K.M.; Nguyen, C.H.; Shih, M.C.; Lin, K.H. Physicochemical properties of starches and expression and activity of starch biosynthesis-related genes in sweet potatoes. Food Chem. 2016, 199, 556–564. [Google Scholar] [CrossRef] [PubMed]
- Bridges, I.G.; Olive, M.; Schuch, W.W. ADP Glucose Pyrophosphorylase. Ph.D. Thesis, Loyola University Chicago, Chicago, IL, USA, 1990. [Google Scholar]
- Hirose, T.; Terao, T. A comprehensive expression analysis of the starch synthase gene family in rice (Oryza satival). Planta 2004, 220, 9–16. [Google Scholar] [CrossRef] [PubMed]
- Preiss, J.; Greenberg, E. Allosteric regulation of uridine diphosphoglucose: d-fructose-6-phosphate-2-glucosyl transferase (e.c.2.4.1.14). Biochem. Biophys. Res. Commun. 1969, 36, 289–295. [Google Scholar] [CrossRef]
- Sclulman, A.H.; Ahokas, H. A novel shrunken endosperm mutant of barley. Physiol. Plant. 1990, 78, 583–589. [Google Scholar] [CrossRef]
- Flipse, E.; Suurs, L.; Keetels, C.J.A.M.; Kossmann, J.; Jacobsen, E.; Visser, R.G.F. Introduction of sense and antisense cdna for branching enzyme in the amylose-free potato mutant leads to physico-chemical changes in the starch. Planta 1996, 198, 340–347. [Google Scholar] [CrossRef]
- Sturm, A. Invertases. Primary structures, functions, and roles in plant development and sucrose partitioning. Plant Physiol. 1999, 121, 1–8. [Google Scholar] [CrossRef] [PubMed] [Green Version]
- Kumar, R.; Mukherjee, S.; Ayele, B.T. Molecular aspects of sucrose transport and its metabolism to starch during seed development in wheat: A comprehensive review. Biotechnol. Adv. 2018, 36, 954. [Google Scholar] [CrossRef]
- James, M.; Myers, A. Seed Starch Synthesis. In Handbook of Maize: Its Biology; Springer: Berlin/Heidelberg, Germany, 2009; pp. 439–456. [Google Scholar]
- Kang, G.Z.; Xu, W.; Liu, G.Q.; Peng, X.Q.; Guo, T.C.; Bell, J. Comprehensive analysis of the transcription of starch synthesis genes and the transcription factor RSR1 in wheat (Triticum aestivum) endosperm. Genome 2013, 56, 115–122. [Google Scholar] [CrossRef]
- Tian, Z.X.; Qian, Q.; Liu, Q.Q.; Yan, M.X.; Liu, X.F.; Yan, C.J.; Liu, G.F.; Gao, Z.Y.; Tang, S.Z.; Zeng, D.L.; et al. Allelic diversities in rice starch biosynthesis lead to a diverse array of rice eating and cooking qualities. Proc. Natl. Acad. Sci. USA 2009, 106, 21760–21765. [Google Scholar] [CrossRef] [Green Version]
- Zeeman, S.C.; Kossmann, J.; Smith, A.M. Starch: Its metabolism, evolution, and biotechnological modification in plants. Annu. Rev. Plant Biol. 2010, 61, 209–234. [Google Scholar] [CrossRef] [Green Version]
- Zhou, Z.K. Fossils of the Fagaceae and their implications in systematics and biogeography. Acta Phytotaxon. Sin. 1999, 37, 369–385. [Google Scholar]
- Zhou, L.; Xu, M.; Yang, C.R.; Zhang, Y.J. The advance of chemical components and bioactivity of fagaceous plants. Nat. Prod. Res. Dev. 2012, 24, 260–273. [Google Scholar]
- Wen, J. Evolution of eastern Asian and eastern North American disjunct distributions in flowering plants. Ann. Rev. Ecol. Syst. 1999, 30, 421–455. [Google Scholar] [CrossRef]
- Wu, B.; Zhang, X.D.; Wu, X.D. New lignan glucosides with tyrosinase inhibitory activities from exocarp of Castanea henryi. Carbohydr. Res. 2012, 355, 45–49. [Google Scholar] [CrossRef]
- Xu, J. The effect of low-temperature storage on the activity of polyphenol oxidase in Castanea henryi chestnuts. Postharvest Biol. Technol. 2005, 38, 91–98. [Google Scholar] [CrossRef]
- Feng, J.L.; Yang, Z.J.; Chen, H. Advances in Castanea henryi. Subtrop. Agric. Res. 2009, 5, 237–241. [Google Scholar]
- Fan, X.M.; Yuan, D.Y.; Tang, J.; Tian, X.M.; Zhang, L.; Zou, F.; Tan, X.F. Sporogenesis and gametogenesis in Chinese chinquapin (Castanea henryi(skam) rehder & wilson) and their systematic implications. Trees 2015, 29, 1713–1723. [Google Scholar]
- Useful Temperate Plants Database. Available online: http://temperate.theferns.info/plant/Castanea+henryi (accessed on 24 August 2019).
- Li, S.Z. Compendium of Material Medica; Liaoning National Publishing House: Shenyang, China, 1999; pp. 1123–1127. [Google Scholar]
- Xie, T.; Kang, L.; Tang, Z.; Yang, C.; Gao, J. Physicochemical properties of enzyme and heat-moisture treated Castanea henryi starches: Nongye Jixie Xuebao/transactions Chin. Soc. Agric. Mach. 2015, 46, 222–227. [Google Scholar]
- Wang, L.K.; Feng, Z.X.; Wang, X.; Wang, X.W.; Zhang, X.G. DEGseq: An R package for identifying differentially expressed genes from RNA-seq data. Bioinformatics 2010, 26, 136–138. [Google Scholar] [CrossRef]
- John, W.; Downton, S.; Hawker, J.S. Enzymes of starch and sucrose metabolism in Zea mays leaves. Phytochemistry 1973, 12, 1551–1556. [Google Scholar] [CrossRef]
- Datta, R.; Chourey, P.S.; Pring, D.R.; Tang, H.V. Gene-expression analysis of sucrose-starch metabolism during pollen maturation in cytoplasmic male-sterile and fertile lines of sorghum. Sex. Plant Reprod. 2001, 14, 127–134. [Google Scholar] [CrossRef]
- Zhang, L.; Fang, X.M.; Lin, Q.; Xiang, H.; Wang, W.; Yuan, D.Y. Transcriptome analysis for developing kernel and expression analysis of starch and sucrose metabolism-related genes in Castanea henryi. J. Plant Genet. Res. 2015, 16, 603–611. [Google Scholar]
- Zhang, L.; Lin, Q.; Feng, Y.; Fan, X.; Zou, F.; Yuan, D.Y.; Zeng, X.; Cao, H. Transcriptomic identification and expression of starch and sucrose metabolism genes in the seeds of Chinese chestnut (Castanea mollissima). J. Agric. Food Chem. 2015, 63, 929–942. [Google Scholar] [CrossRef] [PubMed]
- Rodriguez-Lopez, M.; Baroja-Fernandez, E.; Zandueta-Criado, A.; Pozueta-Romero, J. Adenosine diphosphate glucose pyrophosphatase: A plastidial phosphodiesterase that prevents starch biosynthesis. Proc. Natl. Acad. Sci. USA 2000, 97, 8705–8710. [Google Scholar] [CrossRef] [PubMed] [Green Version]
- Nanjo, Y.; Oka, H.; Ikarashi, N.; Kaneko, K.; Kitajima, A.; Mitsui, T.; Muñoz, F.J.; Rodríguez-López, M.; Baroja-Fernández, E.; Pozueta-Romero, J. Rice plastidial N-glycosylated nucleotide pyrophosphatase/phosphodiesterase is transported from the ER–Golgi to the chloroplast through the secretory pathway. Plant Cell 2006, 18, 2582–2592. [Google Scholar] [CrossRef] [PubMed] [Green Version]
- Kaneko, K.; Yamada, C.; Yanagida, A.; Koshu, T.; Umezawa, Y.; Itoh, K.; Hori, H.; Mitisui, T. Differential localizations and functions of rice nucleotide pyrophosphatase/phosphodiesterase isozymes 1 and 3. Plant Biotechnol. 2011, 28, 69–76. [Google Scholar] [CrossRef] [Green Version]
- Kaneko, K.; Inomata, T.; Masui, T.; Koshu, T.; Umezawa, Y.; Itoh, K. Nucleotide pyrophosphatase/phosphodiesterase 1 exerts a negative effect on starch accumulation and growth in rice seedlings under high temperature and co2 concentration conditions. Plant Cell Physiol. 2014, 55, 320–332. [Google Scholar] [CrossRef] [Green Version]
- Kimura, A.; Robyt, J.F. Reaction of enzymes with starch granules: reaction of isoamylase with native and gelatinized granules. Carbohydr. Res. 1996, 287, 255–261. [Google Scholar] [CrossRef]
- Kainuma, K.; Kobayashi, S.; Harada, T. Action of Pseudomonas isoamylase on various branched oligo and poly-saccharides. Carbohydr. Res. 1978, 61, 345–357. [Google Scholar] [CrossRef]
- Fang, T.Y.; Lin, L.L.; Hsu, W.H. Recovery of isoamylase from Pseudomonas amyloderamosa by adsorption-elution on raw starch. Enzym. Microb. Technol. 1994, 16, 247–252. [Google Scholar] [CrossRef]
- Tagami, T.; Yamashita, K.; Okuyama, M.; Mori, H.; Yao, M.; Kimura, A. Molecular basis for the recognition of long-chain substrates by plant α-glucosidases. J. Biol. Chem. 2013, 288, 19296–19303. [Google Scholar] [CrossRef] [PubMed] [Green Version]
- Agarwal, P.; Gupta, R. Alpha-amylase inhibition can treat diabetes mellitus. Res. Rev. J. Med. Health Sci. 2016, 5, 1–8. [Google Scholar]
- Chourey, P.S.; Taliercio, E.W.; Carlson, S.J.; Ruan, Y.L. Genetic evidence that the two isozymes of sucrose synthase present in developing maize endosperm are critical, one for cell wall integrity and the other for starch biosynthesis. Mol. Gen. Genet. 1998, 259, 88–96. [Google Scholar] [CrossRef] [PubMed]
- Kleczkowski, L.A. Glucose activation and metabolism through udp-glucose pyrophosphorylase in plants. Phytochemistry 1994, 37, 1507–1515. [Google Scholar] [CrossRef]
- Wind, J.; Smeekens, S.; Hanson, J. Sucrose: metabolite and signaling molecule. Phytochemistry 2010, 71, 1610–1614. [Google Scholar] [CrossRef]
- Rausch, T.; Greiner, S. Plant protein inhibitors of invertases. Biochim. Biophys. Acta. 2004, 1696, 253–261. [Google Scholar] [CrossRef]
- Goncalves, B.; Borges, O.; Costa, H.S.; Bennett, R.; Santos, M.; Silva, A.P. Metabolite composition of chestnut (Castanea sativa mill.) upon cooking: proximate analysis, fibre, organic acids and phenolics. Food Chem. 2010, 122, 154–160. [Google Scholar] [CrossRef]
- Botha, F.C.; Potgieter, G.P.; Botha, A.M. Respiratory metabolism and gene expression during seed germination. J. Plant Growth Regul. 1992, 11, 211–224. [Google Scholar] [CrossRef]
- Yatsu, L.Y. Seeds: Physiology of Development and Germination; Bewley, J.D., Black, M., Eds.; Springer: Berlin/Heidelberg, Germany, 1994; p. 74. [Google Scholar]
- Nicolás, G.; Aldasoro, J.J. Activity of the pentose phosphate pathway and changes in nicotinamide nucleotide content during germination of seeds of Cicer arietinum L. J. Exp. Bot. 1979, 30, 1163–1170. [Google Scholar] [CrossRef]
- Salon, C.; Raymond, P.; Pradet, A. Quantification of carbon fluxes through the tricarboxylic acid cycle in early germinating lettuce embryos. J. Biol. Chem. 1988, 263, 12278–12287. [Google Scholar]
- Hu, J. Seed Biology; Higher Education Press: Beijing, China, 2006; pp. 64–66. [Google Scholar]
- Ma, Y.Q.; Han, C.R. Changes of starch in corn during germination. Grain Process. 2007, 32, 42–44. [Google Scholar]
- Yang, R.Q.; Wang, P.; Elbaloula, M.F.; Gu, Z.X. Effect of germination on main physiology and biochemistry metabolism of sorghum seeds. Biosci. J. 2016, 32, 378–383. [Google Scholar] [CrossRef] [Green Version]
- Chen, L.P.; Shen, Y.B. Material metabolism of Pinus tabulaeformis seeds during initial germinating stage. J. Beijing For. Univ. 2010, 32, 69–73. [Google Scholar]
- Zhao, M.; Zhang, H.X.; Yan, H.; Qiu, L. Relationship between seed storage reserve and seed germination. Soil. Crop. 2018, 7, 189–200. [Google Scholar]
- Hildebrand, D.F.; Hymowitz, T. Role of β-amylase in starch metabolism during soybean seed development and germination. Physiol. Plant. 1981, 53, 429–434. [Google Scholar] [CrossRef]
- Guzman, M.K.; Parween, S.; Butardo, V.M.; Alhambra, C.M.; Anacleto, R.; Seiler, C.; Sreenivasulu, N. Investigating glycemic potential of rice by unraveling compositional variations in mature grain and starch mobilization patterns during seed germination. Sci. Rep. 2017, 7, 5854. [Google Scholar] [CrossRef]
- Streb, S.; Zeeman, S.C. Starch Metabolism in Arabidopsis. In The Arabidopsis Book; American Society of Plant Biologists: Rockville, MD, USA, 2012; p. 10. [Google Scholar]
- Schaffer, A.A.; Petreikov, M. Sucrose-to-starch metabolism in tomato fruit undergoing transient starch accumulation. Plant Physiol. 1997, 113, 739–746. [Google Scholar] [CrossRef] [Green Version]
- Hannah, L.C.; James, M. The complexities of starch biosynthesis in cereal endosperms. Curr. Opin. Biotechnol. 2008, 19, 160–165. [Google Scholar] [CrossRef]
- James, M.G.; Denyer, K.; Myers, A.M. Starch synthesis in the cereal endosperm. Curr. Opin. Plant Bio. 2003, l6, 215–222. [Google Scholar] [CrossRef]
- Miao, H.X.; Sun, P.G.; Liu, W.X.; Xu, B.Y.; Jin, Z.Q. Identification of genes encoding granule-bound starch synthase involved in amylose metabolism in banana fruit. PLoS ONE 2014, 9. [Google Scholar] [CrossRef]
- Wang, S.J.; Yeh, K.W.; Tsai, C.Y. Regulation of starch granule-bound starch synthase i gene expression by circadian clock and sucrose in the source tissue of sweet potato. Plant Sci. 2001, 161, 635–644. [Google Scholar] [CrossRef]
- Scheidig, A.; Fröhlich, A.; Schulze, S.; Lloyd, J.R.; Kossmann, J. Downregulation of a chloroplast-targeted beta-amylase leads to a starch-excess phenotype inleaves. Plant J. 2002, 30, 581–591. [Google Scholar] [CrossRef] [PubMed]
- Tetlow, I.J.; Morell, M.K.; Emes, M.J. Recent developments in understanding the regulation of starch metabolism in higner plants. J. Exp. Bot. 2004, 55, 2131–2145. [Google Scholar] [CrossRef] [PubMed] [Green Version]
- Winter, H.; Huber, J.L.; Huber, S.C. Membrane association of sucrose synthase: changes during the graviresponse and possible control by protein phosphorylation. FEBS Lett. 1997, 420, 151–155. [Google Scholar] [CrossRef] [Green Version]
- Xiao, L.T.; Wang, S.G. Experimental Techniques of Plant Physiology; China Agriculture Press: Beijing, China, 2005; pp. 152–156. [Google Scholar]
- Kim, D.; Langmead, B.; Salzberg, S.L. HISAT: A fast spliced aligner with low memory requirements. Nat. Methods 2015, 12, 357–360. [Google Scholar] [CrossRef] [Green Version]
- Li, B.; Dewey, C.N. RSEM: Accurate transcript quantification from RNA-Seq data with or without a reference genome. BMC Bioinform. 2011, 12, 323. [Google Scholar] [CrossRef] [Green Version]
- Altschul, S.F. Gapped BLAST and PSI-BLAST: A new generation of protein detabase search programs. Nucl. Acids Res. 1997, 25, 3389–3402. [Google Scholar] [CrossRef] [Green Version]
- Jin, J.P.; Zhang, H.; Kong, L.; Gao, G.; Luo, J.C. Planttfdb 3.0: A portal for the functional and evolutionary study of plant transcription factors. Nucl. Acids Res. 2014, 42, D1182–D1187. [Google Scholar] [CrossRef] [Green Version]
- Sanseverino, W.; Roma, G.; De Simone, M.; Faino, L.; Melito, S.; Stuoka, E.; Frusciante, L.; Ercolan, M.R. PRGdb: A bioinformatics platform for plant resistance gene analysis. Nucl. Acids Res. 2010, 38, D814–D821. [Google Scholar] [CrossRef] [Green Version]
- Ashburner, M.; Ball, C.A.; Blake, J.A.; Botstein, D.; Butler, H.; Michael Cherry, J.; Davis, A.P.; Dolinski, K.; Dwight, S.S.; Eppig, J.T.; et al. Gene ontology: tool for the unification of biology. Nat. Genet. 2000, 25, 25–29. [Google Scholar] [CrossRef] [Green Version]
- Minoru, K.; Susumu, G. KEGG: Kyoto Encyclopedia of Genes and Genomes. Nucl. Acids Res. 2000, 28, 27–30. [Google Scholar]
- Pruitt, K.D.; Tatusova, T.; Maglott, D.R. NCBI reference sequence (refseq): A curated non-redundant sequence database of genomes, transcripts and proteins. Nucl. Acids Res. 2007, 35, D61–D65. [Google Scholar] [CrossRef] [PubMed] [Green Version]
- Benjamini, Y.; Hochberg, Y. Multiple Hypotheses Testing with Weights. Scandin. J. Stat. 1997, 24, 407–418. [Google Scholar] [CrossRef]
- Storey, J.D.; Tibshirani, R. Statistical significance for genomewide studies. Proc. Nat. Acad. Sci. USA 2003, 100, 9440–9445. [Google Scholar] [CrossRef] [PubMed] [Green Version]


© 2020 by the authors. Licensee MDPI, Basel, Switzerland. This article is an open access article distributed under the terms and conditions of the Creative Commons Attribution (CC BY) license (http://creativecommons.org/licenses/by/4.0/).
Share and Cite
Liu, B.; Lin, R.; Jiang, Y.; Jiang, S.; Xiong, Y.; Lian, H.; Zeng, Q.; Liu, X.; Liu, Z.-J.; Chen, S. Transcriptome Analysis and Identification of Genes Associated with Starch Metabolism in Castanea henryi Seed (Fagaceae). Int. J. Mol. Sci. 2020, 21, 1431. https://doi.org/10.3390/ijms21041431
Liu B, Lin R, Jiang Y, Jiang S, Xiong Y, Lian H, Zeng Q, Liu X, Liu Z-J, Chen S. Transcriptome Analysis and Identification of Genes Associated with Starch Metabolism in Castanea henryi Seed (Fagaceae). International Journal of Molecular Sciences. 2020; 21(4):1431. https://doi.org/10.3390/ijms21041431
Chicago/Turabian StyleLiu, Bin, Ruqiang Lin, Yuting Jiang, Shuzhen Jiang, Yuanfang Xiong, Hui Lian, Qinmeng Zeng, Xuedie Liu, Zhong-Jian Liu, and Shipin Chen. 2020. "Transcriptome Analysis and Identification of Genes Associated with Starch Metabolism in Castanea henryi Seed (Fagaceae)" International Journal of Molecular Sciences 21, no. 4: 1431. https://doi.org/10.3390/ijms21041431