Article

Promising Therapeutic Efficacy of GC1118, an Anti-EGFR Antibody, against KRAS Mutation-Driven Colorectal Cancer Patient-Derived Xenografts

1
Department of Anatomy and Cell Biology, Sungkyunkwan University School of Medicine, Suwon 16149, Korea
2
Single Cell Network Research Center, Sungkyunkwan University, Suwon 16149, Korea
3
Institute for Refractory Cancer Research, Samsung Medical Center, Seoul 06351, Korea
4
Department of Health Science and Technology, Samsung Advanced Institute for Health Science and Technology, Sungkyunkwan University, Seoul 06351, Korea
5
Research Institute for Future Medicine, Samsung Medical Center, Seoul 06351, Korea
6
Translational Research 1 Team, MOGAM Institute for Biomedical Research, Yongin 16924, Korea
7
Department of Neurosurgery, Sungkyunkwan University School of Medicine, Samsung Medical Center, Seoul 06531, Korea
*
Authors to whom correspondence should be addressed.
These authors contributed equally to this work.
Int. J. Mol. Sci. 2019, 20(23), 5894; https://doi.org/10.3390/ijms20235894
Submission received: 9 November 2019 / Accepted: 22 November 2019 / Published: 24 November 2019
(This article belongs to the Section Molecular Pathology, Diagnostics, and Therapeutics)

Abstract

:
Epidermal growth factor receptor (EGFR)-targeted monoclonal antibodies, including cetuximab and panitumumab, are used to treat metastatic colorectal cancer (mCRC). However, this treatment is only effective for a small subset of mCRC patients positive for the wild-type KRAS GTPase. GC1118 is a novel, fully humanized anti-EGFR IgG1 antibody that displays potent inhibitory effects on high-affinity EGFR ligand-induced signaling and enhanced antibody-mediated cytotoxicity. In this study, using 51 CRC patient-derived xenografts (PDXs), we showed that KRAS mutants expressed remarkably elevated autocrine levels of high-affinity EGFR ligands compared with wild-type KRAS. In three KRAS-mutant CRCPDXs, GC1118 was more effective than cetuximab, whereas the two agents demonstrated comparable efficacy against three wild-type KRAS PDXs. Persistent phosphatidylinositol-3-kinase (PI3K)/AKT signaling was thought to underlie resistance to GC1118. In support of these findings, a preliminary improved anti-cancer response was observed in a CRC PDX harboring mutated KRAS with intrinsically high AKT activity using GC1118 combined with the dual PI3K/mammalian target of rapamycin (mTOR)/AKT inhibitor BEZ-235, without observed toxicity. Taken together, the superior antitumor efficacy of GC1118 alone or in combination with PI3K/mTOR/AKT inhibitors shows great therapeutic potential for the treatment of KRAS-mutant mCRC with elevated ratios of high- to low-affinity EGFR ligands and PI3K-AKT pathway activation.

1. Introduction

At initial diagnosis, approximately 20% of colorectal cancer (CRC) patients present with distant dissemination, which is associated with a high mortality rate, highlighting the importance of effective systemic therapeutic strategies [1,2]. Commonly-affected signaling pathways include the Wnt and receptor tyrosine kinase (RTK) pathways, the components of which include epidermal growth factor receptor (EGFR), vascular endothelial growth factor, and insulin-like growth factor 1 receptor (IGF1R) [3]. Currently, only 10 drugs, either administered as a monotherapy or in combination, have been approved for use against metastatic CRC (mCRC) [4]. Although integrated multi-omics approaches have improved our understanding of the underlying molecular pathophysiology of mCRC, there is a need to customize treatment strategies to account for the high inter/intra-tumor heterogeneity and the involvement of diverse drivers of mCRC [3,5].
EGFR-family hetero-dimerization, ligand affinity, and signaling cross-talk influence cellular outcomes [6,7]. For example, different binding affinities of various ligands for EGFR result in different levels of tumor growth in CRC cell lines [8]. Such ligands are classified as high- or low-affinity EGFR ligands. High-affinity ligands include epidermal growth factor (EGF), transforming growth factor α (TGF-α), heparin-binding EGF-like growth factor (HB-EGF), and betacellulin (BTC). Low-affinity ligands include amphiregulin (AREG) and epiregulin (EREG) [6]. The unique effects of anti-EGFR monoclonal antibodies (MoAbs), including cetuximab and panitumumab, on mCRC treatment are increasingly being recognized. MoAbs compete with ligands to block downstream signaling by promoting receptor internalization, antibody-dependent cellular cytotoxicity (ADCC), and endocytosis-mediated cytotoxicity; however, acquired resistance to such MoAbs occurs over time [4,9]. The EGFR signaling cascade leads to the activation of various transcription factors that modulate proliferation, migration, angiogenesis, and metastatic spread in mCRC, via three major pathways, namely rat sarcoma (RAS)–rapidly accelerated fibrosarcoma (RAF)–mitogen-activated protein kinase (MAPK), phosphatidylinositol 3-kinase (PI3K)–AKT–mammalian target of rapamycin (mTOR), and Janus kinase/signal transducers and activators of transcription [10,11]. Notably, these pathways have also been implicated in mechanisms of resistance to antibody-mediated EGFR inhibition [10,11,12]. Interestingly, activating mutations in the KRAS proto-oncogene GTPase (KRAS) are most common among CRCs, comprising approximately 35%–45% of alterations (point mutations in exons 2, 3, and 4) [12,13,14,15], and these predict primary resistance to anti-EGFR MoAbs, such as cetuximab and panitumumab [16,17,18,19]. This is because constitutively activated RAS downstream signaling can activate multiple processes involved in tumor progression without the influence of EGFR and related receptor kinases [5,10]. There is also circumstantial evidence to suggest that an excess of high-affinity ligands drives resistance to cetuximab [6,8,20,21].
GC1118 is a human anti-EGFR IgG1 antibody that differs from existing anti-EGFR MoAbs, such as cetuximab and panitumumab, in its constant region, affinity, mode of action, and efficacy [8,20]. A recent first-in-human phase I study of GC1118 conducted on patients with refractory solid tumors, including gastric cancer and CRC, showed promising clinical antitumor efficacy and tolerability [22]. Notably, GC1118 exhibited superior inhibitory effects on high-affinity ligand-induced signaling in CRC and gastric cancer cells, regardless of KRAS status, triggering more potent antitumor activity than cetuximab and panitumumab [8,20]. However, persistent activation of the phosphatidylinositol-4,5-bisphosphate 3-kinase catalytic subunit alpha (PIK3CA)/phosphatase and tensin homolog (PTEN) pathway, one of the major downstream pathways, might lead to the activation of EGFR-independent downstream signaling pathways [10], suggesting that the combination of PI3K/mTOR/AKT inhibitors with EGFR MoAbs might be efficacious [23].
The translationally-relevant CRC patient-derived xenograft (PDX) platform, which maintains a high degree of genetic and transcriptional fidelity compared to respective parental tumors, coupled with bioinformatics and high-throughput drug screening, is effective to investigate heterogeneous mCRC with the aim of uncovering novel therapeutic agents [24,25,26]. Herein, we investigated the autocrine expression levels of high- and low-affinity EGFR ligands using a large panel of CRC patient-derived xenografts (PDXs). We also evaluated the therapeutic efficacy of GC1118 alone or in combination with the dual PI3K/mTOR inhibitor BEZ-235 [27], while considering the presence of KRAS mutations and the expression pattern of EGFR ligands (Figure 1A). Figure 1B and Figure S1 summarize the clinical and genomic baseline characteristics of 51 stratified CRC patients used to establish a PDX series.

2. Results

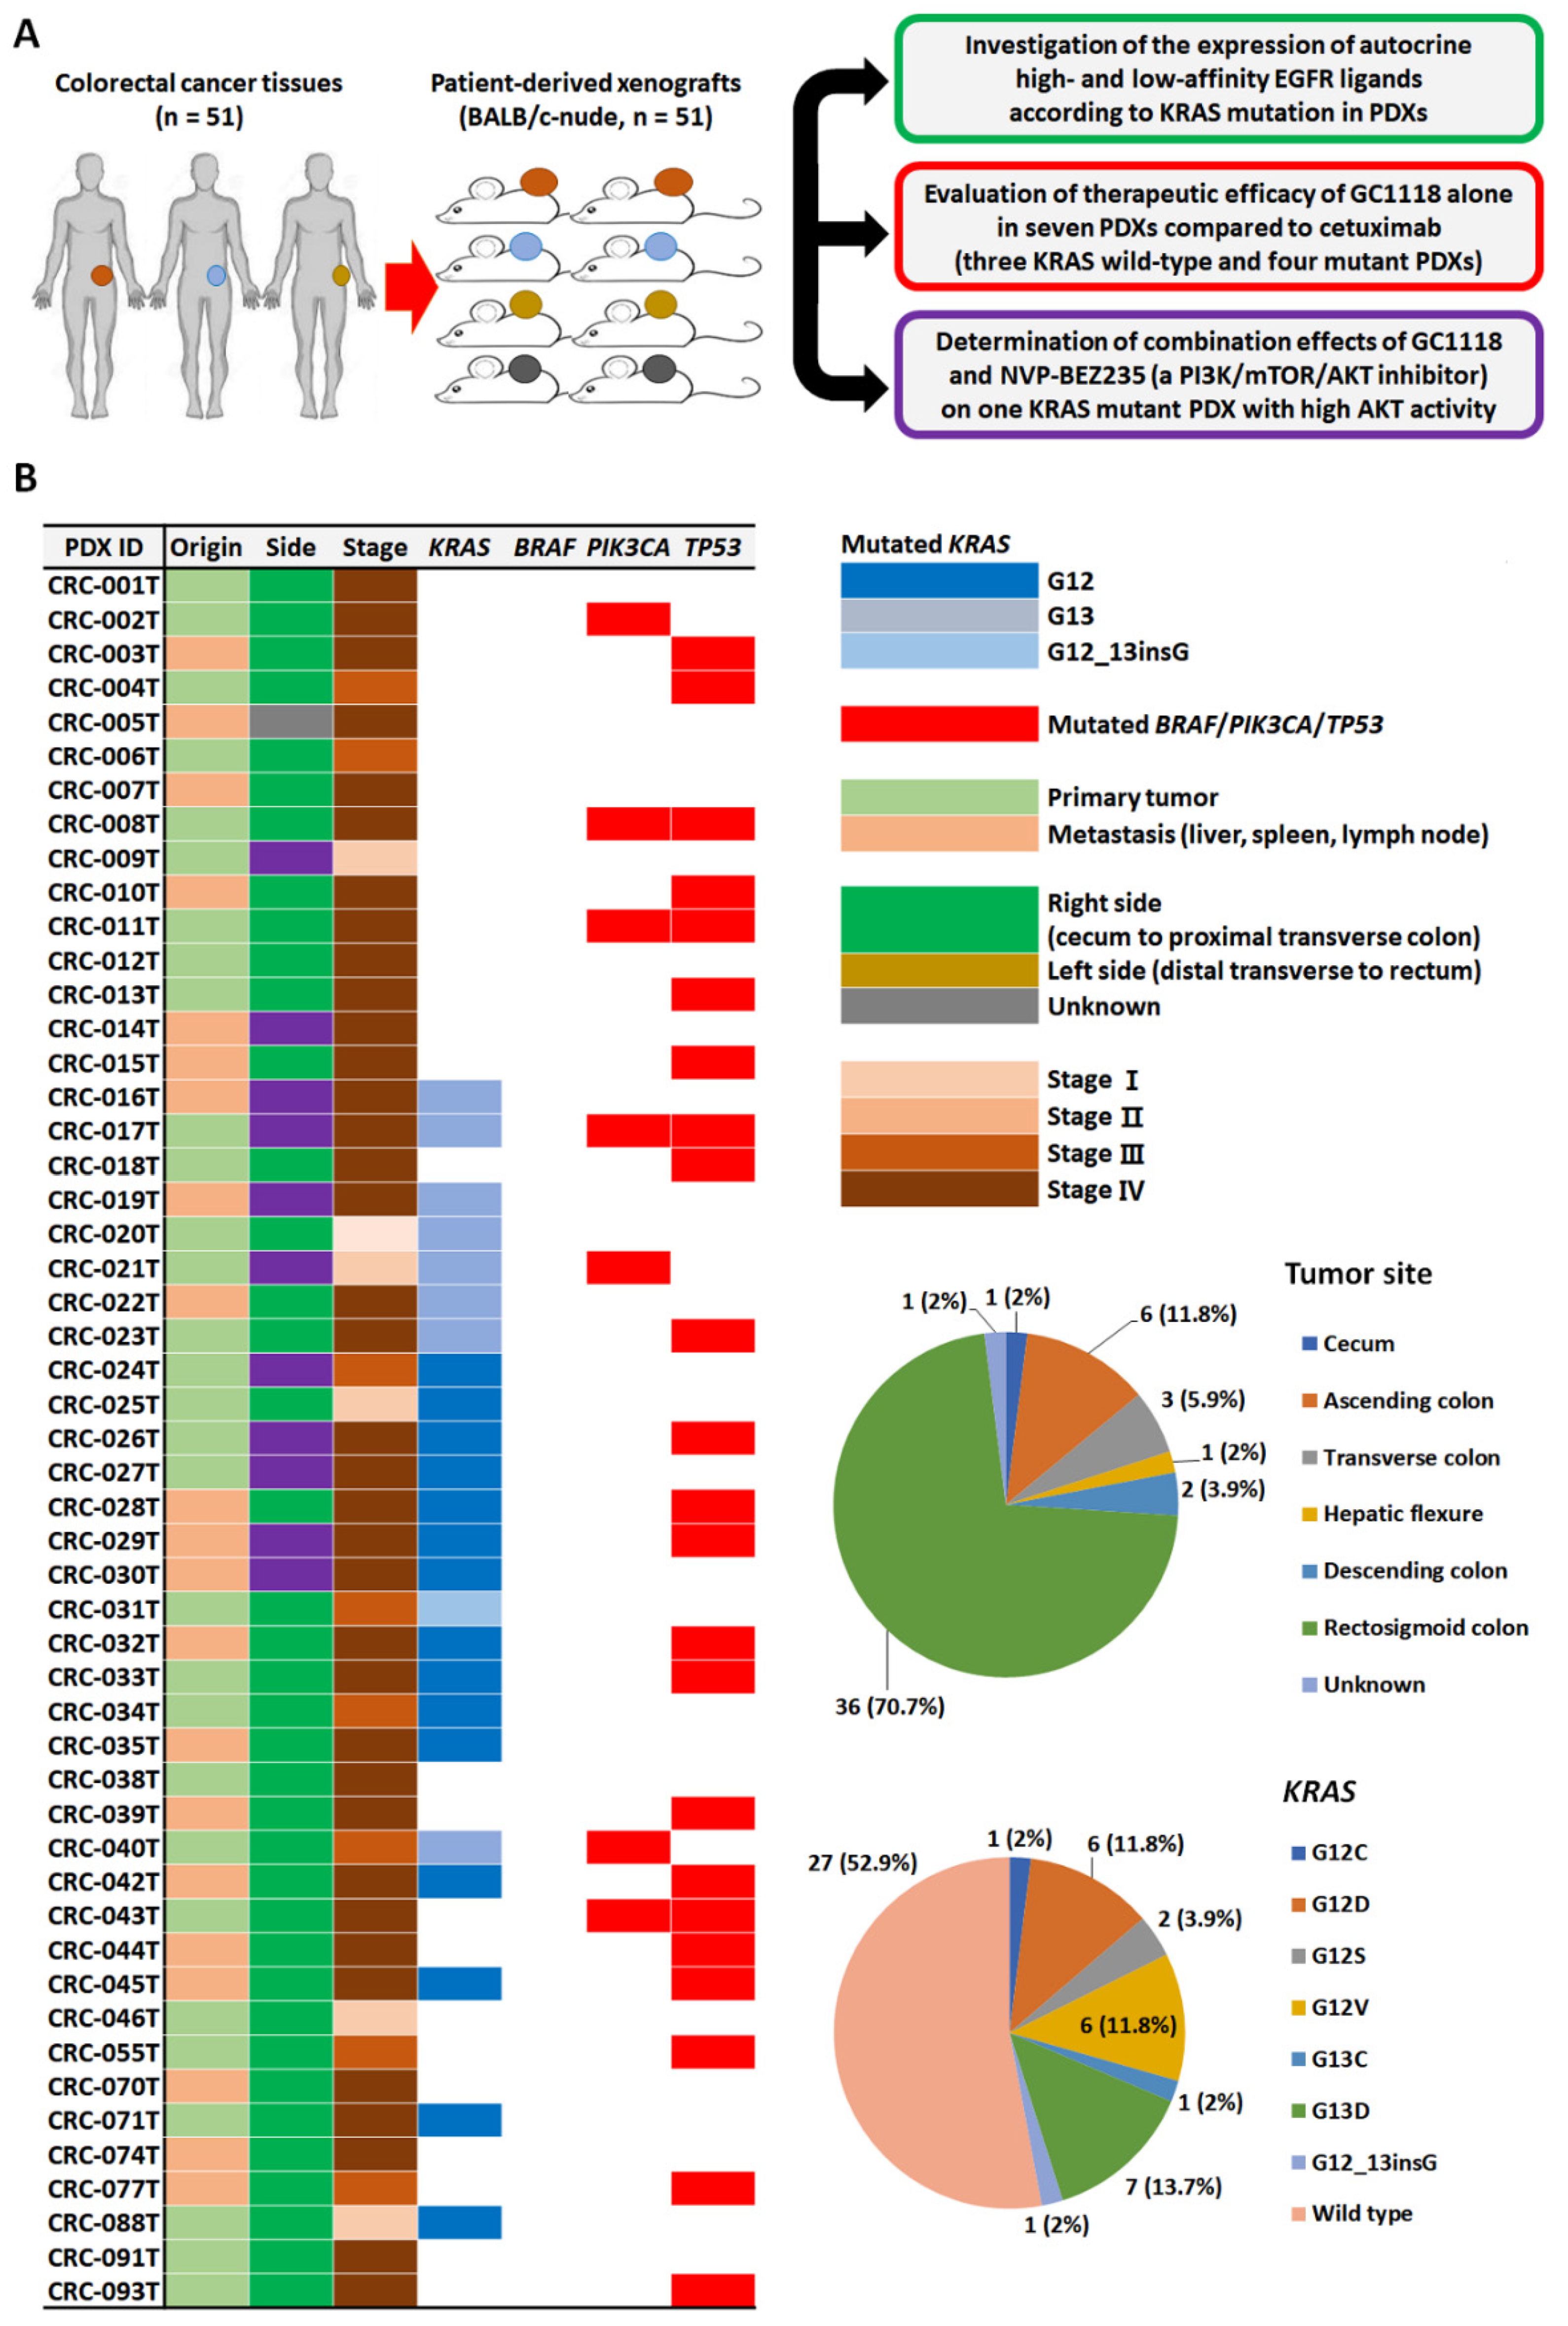
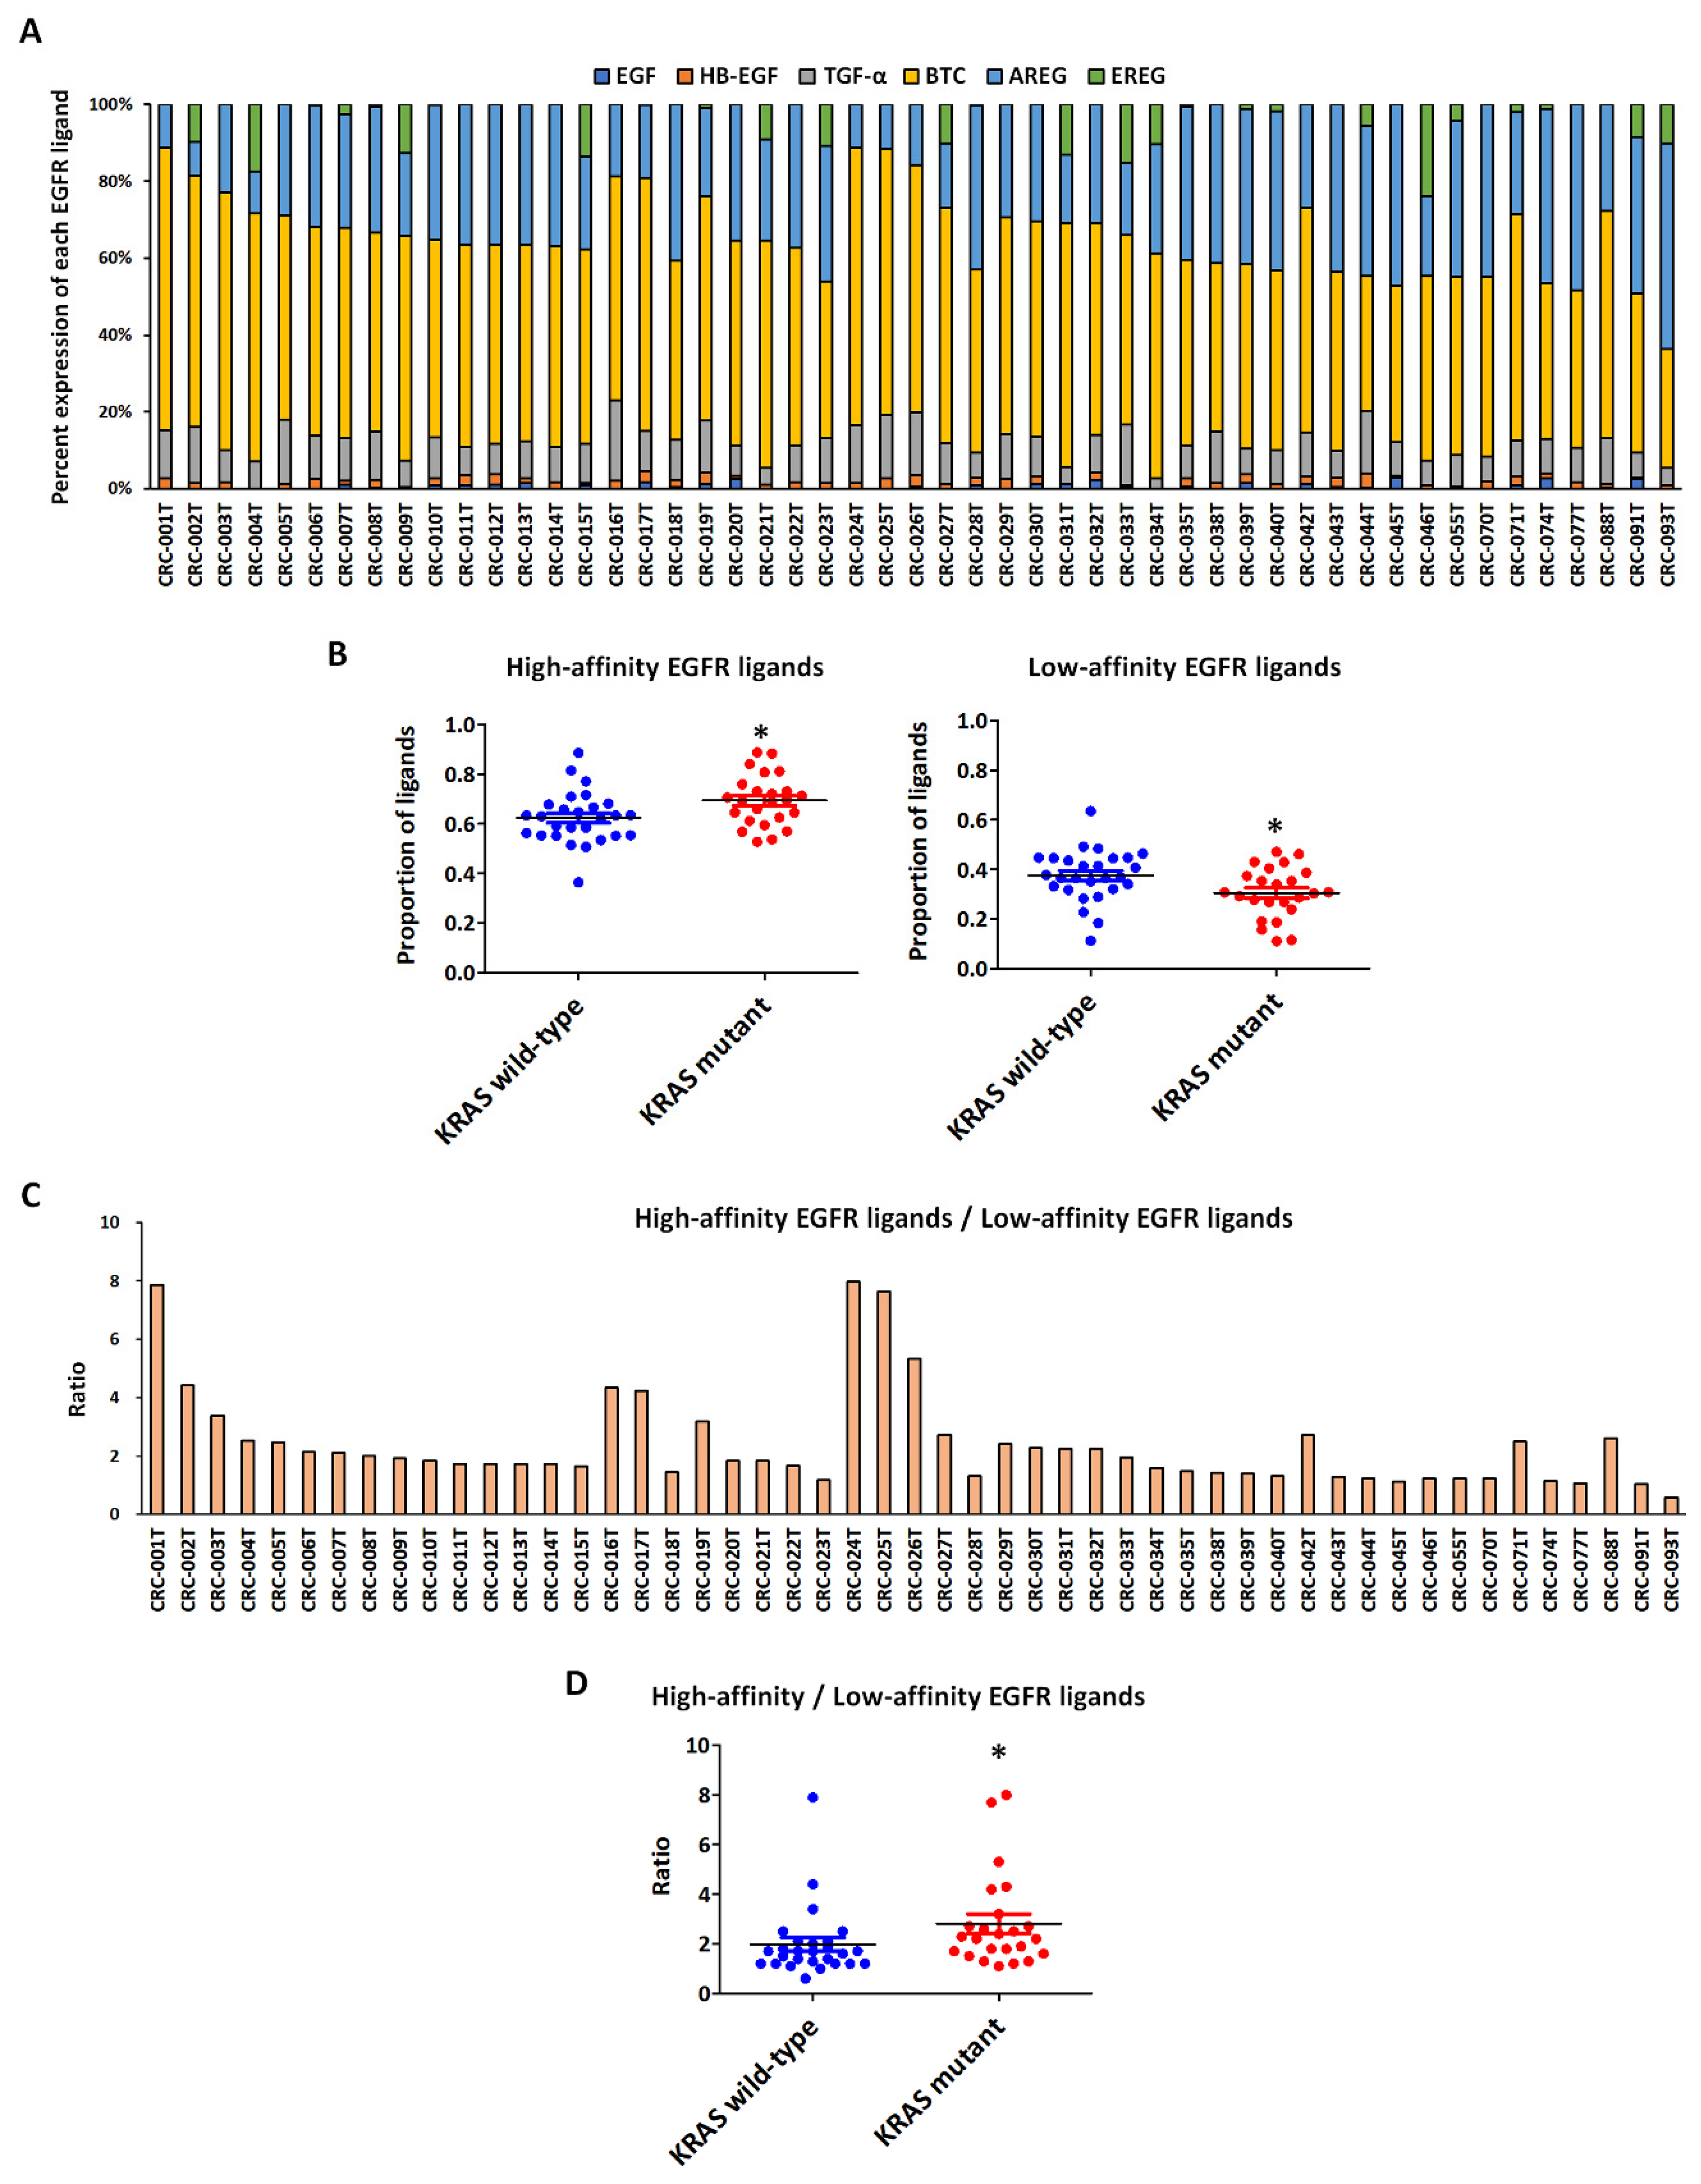
2.1. Genomic Characterization of CRC PDX Models and Expression Levels of High- and Low-Affinity EGFR Ligands According to KRAS Status

All patients underwent excisional biopsy of a primary CRC (n = 30, 58.8%) or metastatic lesions (n = 21, 41.2%) (Figure 1B, left panel). Fourteen (27.5%) and 37 CRC patients (72.5%) were diagnosed with localized (stage I–III) and metastatic disease (stage IV), respectively (Figure 1B, left panel). The primary tumor was in the right colon (cecum to proximal transverse) in 11 cases (21.6%) and the left colon (distal transverse to rectum) in 39 (76.5%) cases. In one case, the location was unknown (n = 1 and 2%) (Figure 1B, upper right panel). In general, KRAS gene mutations are predominant among RAS family gene alterations in mCRC (85%), and approximately 90% of KRAS mutations occur within codons 12 and 13 [28]. Here, KRAS mutations were observed in 24 (42.1%) cases (Figure 1B, lower right panel), whereas no gene alterations were present in B-Raf proto-oncogene serine/threonine kinase (BRAF) (Figure 1B, left panel). PIK3CA and tumor protein P53 (TP53) mutations were also detected in seven (16.4 %) and 23 (45.1%) patients (Figure S1), respectively.
Low-affinity ligands EREG and AREG are predominant in CRC, whereas only a small fraction of high-affinity ligands is expressed [29]. Low expression levels of AREG and EREG associated with KRAS mutations might indicate a tumor that is less dependent on EGFR and is therefore particularly prone to developing resistance to anti-EGFR MoAbs [6,8,10,20,21]. Moreover, the expression levels of AREG and EREG were found to be significantly decreased in mutant-KRAS cases, compared to those in the wild-type cases [30]. Sustained extracellular signal–regulated kinases (ERK) signaling mediated by KRAS mutations was shown to boost secretion of the high-affinity EGFR ligands HB-EGF and TGF-α, which in turn activated EGFR in an autocrine fashion [31]. The total expression level of each EGFR ligand (nM) did not show any significant association with KRAS mutations as evaluated by ELISA (Table S1 and Figure S2). Notably, consistent with previous reports [30,31], we found that KRAS-mutant PDXs tended to show significantly higher fractions of high-affinity EGFR ligands and lower fractions of low-affinity EGFR ligands (Figure 2A,B), in addition to a higher ratio of high- to low-affinity EGFR ligands, than did the KRAS wild-type PDXs (Figure 2C,D). This indicates that the distribution of high- and low-affinity EGFR ligands depends on the presence of a KRAS mutation.

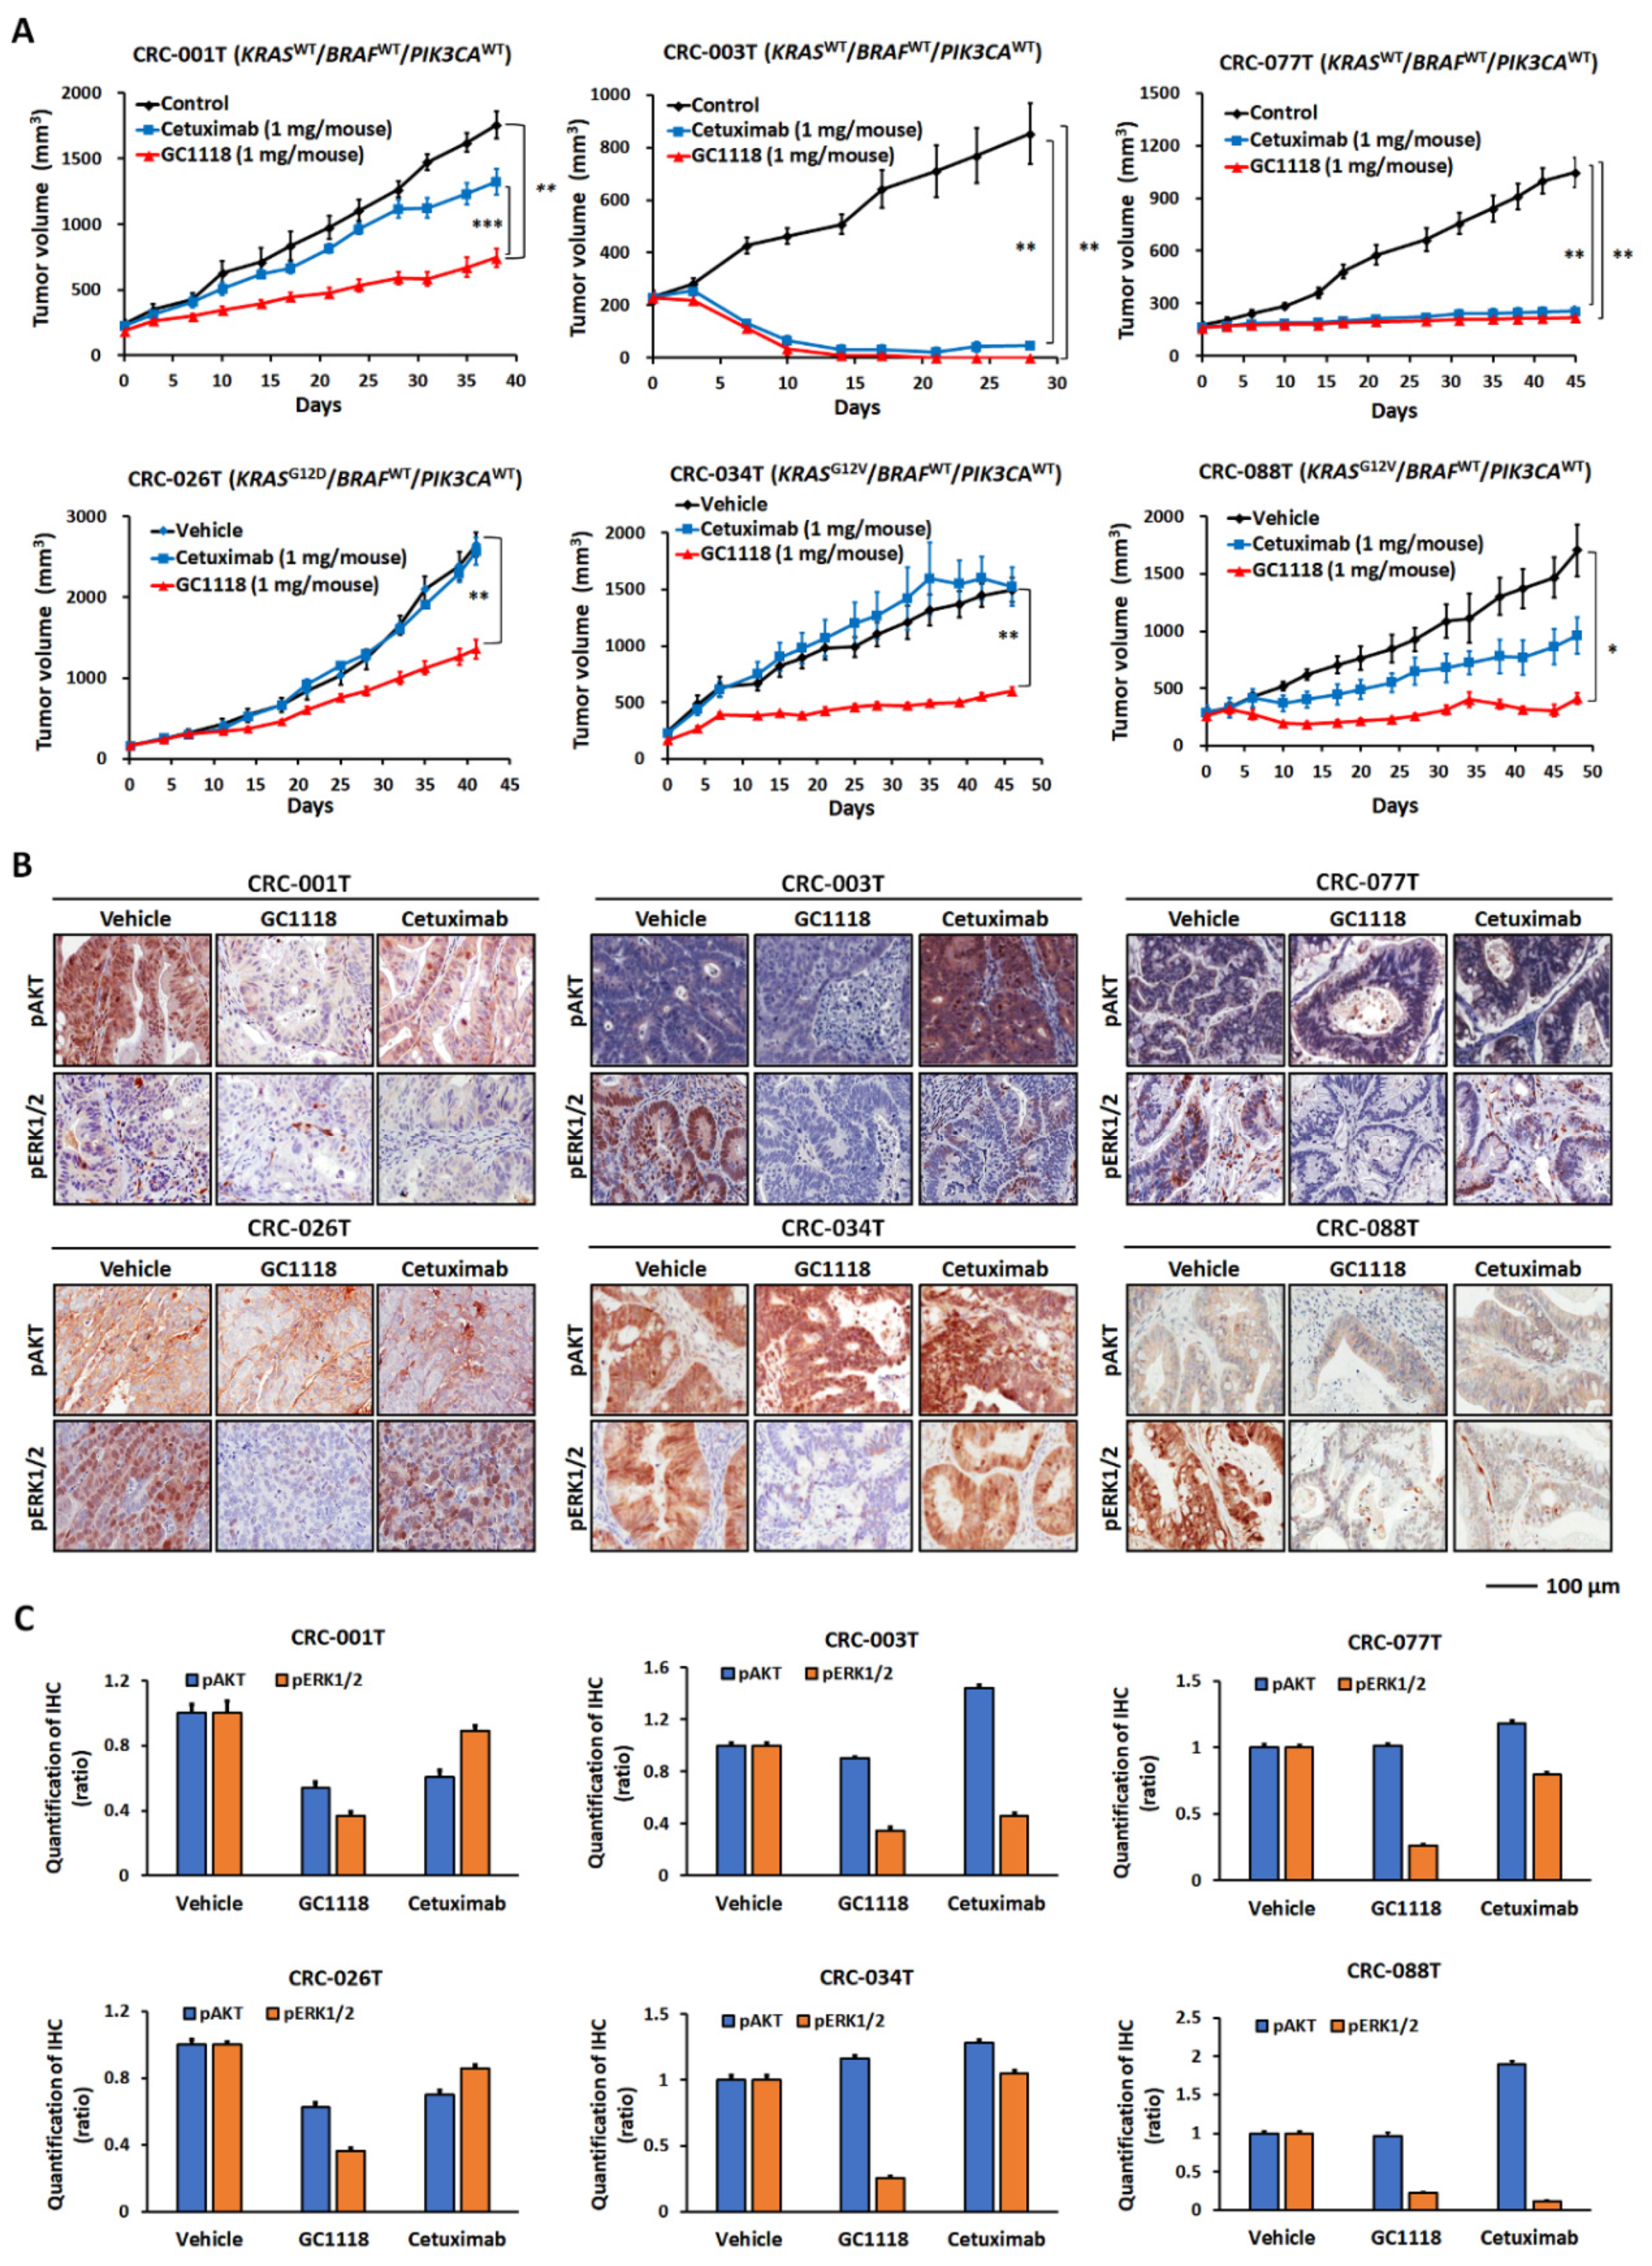
2.2. GC1118 is More Active Than Cetuximab against KRAS-Mutant CRC PDXs

To compare the effectiveness of GC1118 and cetuximab in vivo, 6 CRC PDXs (three KRAS wild-types and three KRAS mutants; all PIK3CA wild-type) were treated with GC1118 for at least 28 days (Figure 3).
To evaluate the effects of GC1118 and cetuximab, tumor growth inhibition index (TGII) values were calculated from the average volume of the treated (Vt) and vehicle control (Vvc) groups using the following equation: TGII (%) = (Vt final -Vt initial)/(Vvc final -Vvc initial) × 100 [32]. For example, if the treatments resulted in no change in growth vs. vehicle-treated controls, TGII (%) = 100. If GC1118 or cetuximab resulted in 70% tumor growth compared to vehicle-treated control tumors, TGII (%) = 300. Both GC1118 (TGII = −36.8%, p = 0.0053) and cetuximab (TGII = −29.4%, p = 0.006) induced complete tumor regression in CRC-003T PDXs (KRAS-wild-type; high-affinity ligand, 77.2%; low-affinity ligand, 22.8%) (GC1118 vs. cetuximab, p = 0.09; Figure 3A, upper panel and Table S2). Similarly, treatment with GC1118 or cetuximab significantly inhibited CRC-077T growth (KRAS-wild-type; high-affinity ligand, 51.6%; low-affinity ligand, 48.4%) with TGII values of 6.8% (p = 0.0016) and 10.4% (p = 0.0015), respectively (Figure 3A, upper panel and Table S2), suggesting comparable antitumor potency of GC1118 to cetuximab in patients harboring wild-type KRAS. Interestingly, GC1118 showed a significantly superior efficacy (TGII: 36.7%, p = 0.006) to cetuximab (TGII: 36.7%, p = 0.006) in CRC-001T PDXs (KRAS-wild-type; high-affinity ligand, 88.7%; low-affinity ligand, 11.3%) (GC1118 vs. cetuximab, p < 0.001; Figure 3A, upper panel and Table S2).
Of note, GC1118 showed a more significant inhibitory effect on tumor growth than did cetuximab in cases of KRAS-mutant CRC (Figure 3A, lower panel and Table S2). In CRC-026T PDXs (KRAS G12D; high-affinity ligand, 84.2%; low-affinity ligand, 15.8%), TGII values for GC1118 and cetuximab were 47.9% (p = 0.006) and 97.5% (p = 0.053), respectively (p = 0.001; Figure 3A, lower panel and Table S2). Further, TGII values for GC1118 and cetuximab in CRC-034T (KRAS G12V; high-affinity ligand expression, 72.2%; low-affinity, 27.8%) were 34.5% (p = 0.023) and 103.6% (p = 0.12), respectively (GC1118 vs. cetuximab, p = 0.019; Figure 3A, lower panel and Table S2). Finally, treating CRC-088T PDXs (KRAS G12V; high-affinity ligand, 61.3%; low-affinity ligand, 38.7%) with GC1118 and cetuximab resulted in TGII values of 10.8% (p = 0.001) and 47.6% (p = 0.91), respectively (GC1118 vs. cetuximab, p = 0.012; Figure 3A, lower panel and Table S2). Overall, no significant differences were observed in the body weights of animals over the course of this study (Figure S3). The potent inhibitory effect of GC1118 on high-affinity EGFR ligand-induced signaling is more pronounced for downstream signaling molecules including AKT and ERK1/2 [8]. GC1118 and cetuximab resulted in variable inhibitory effects on ERK and AKT activation compared to that in the control group according to each PDX, as measured by IHC (Figure 3B,C and Table S3) and immunoblotting (Figure S4). Overall, ERK and AKT signaling activities were significantly suppressed after treatment with GC1118 alone compared to that with cetuximab alone.

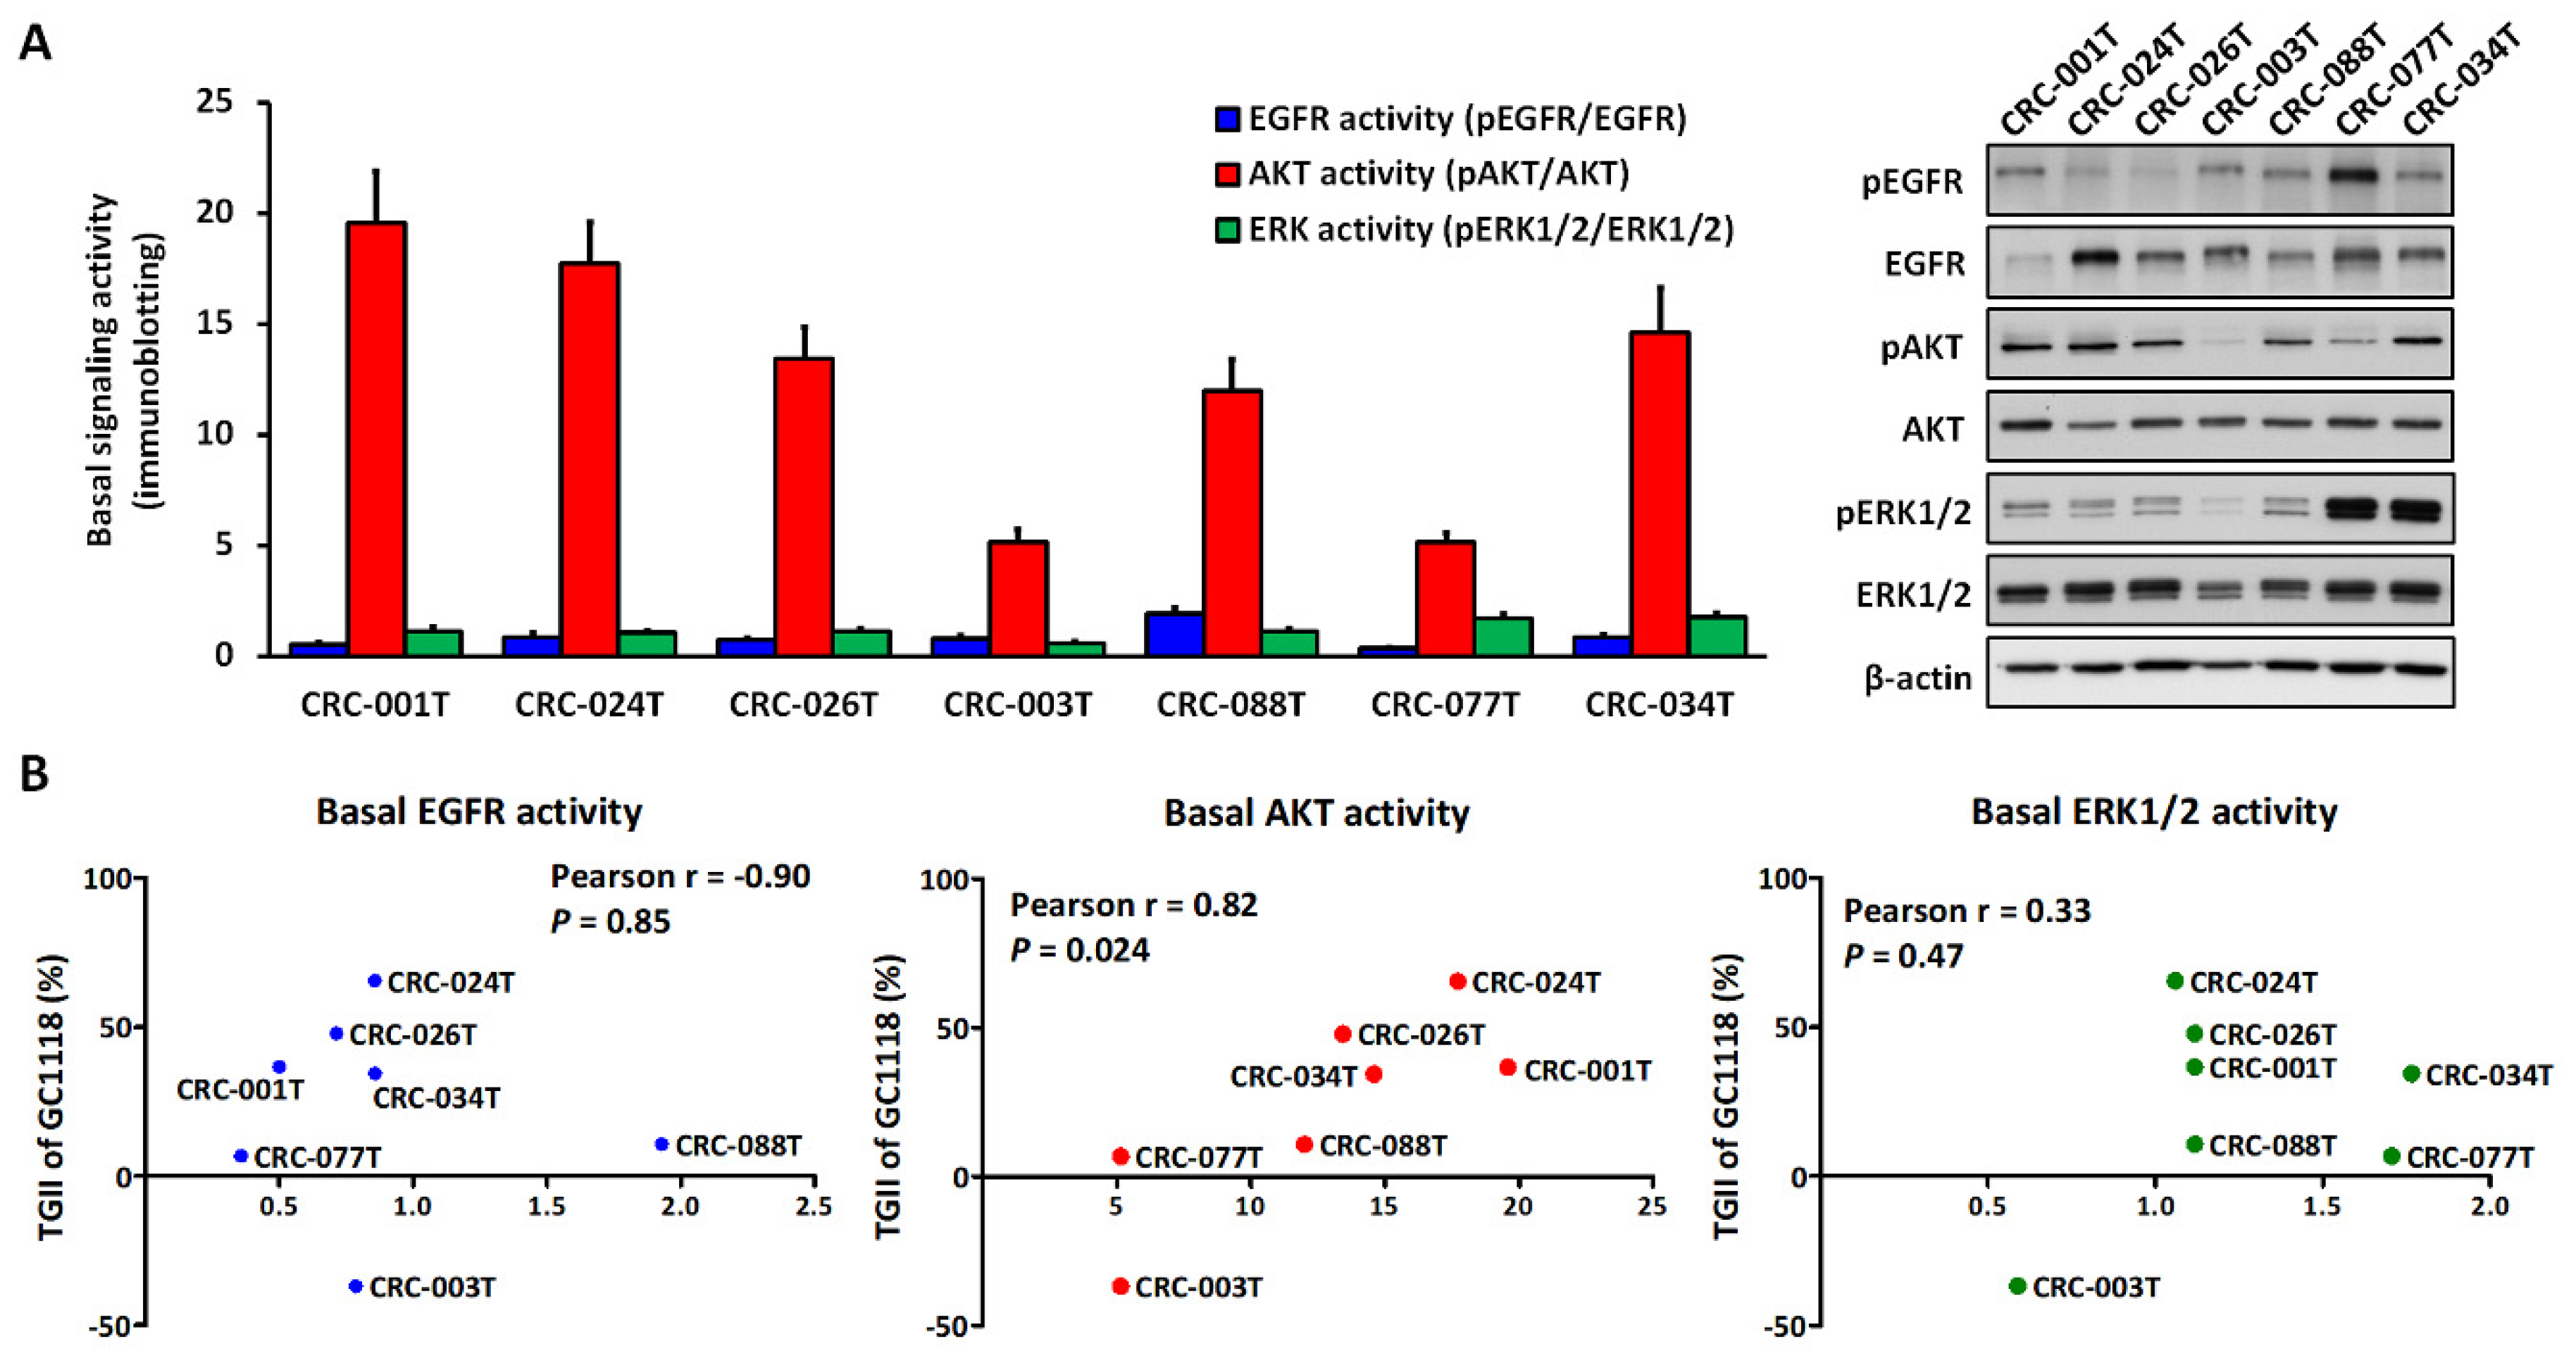
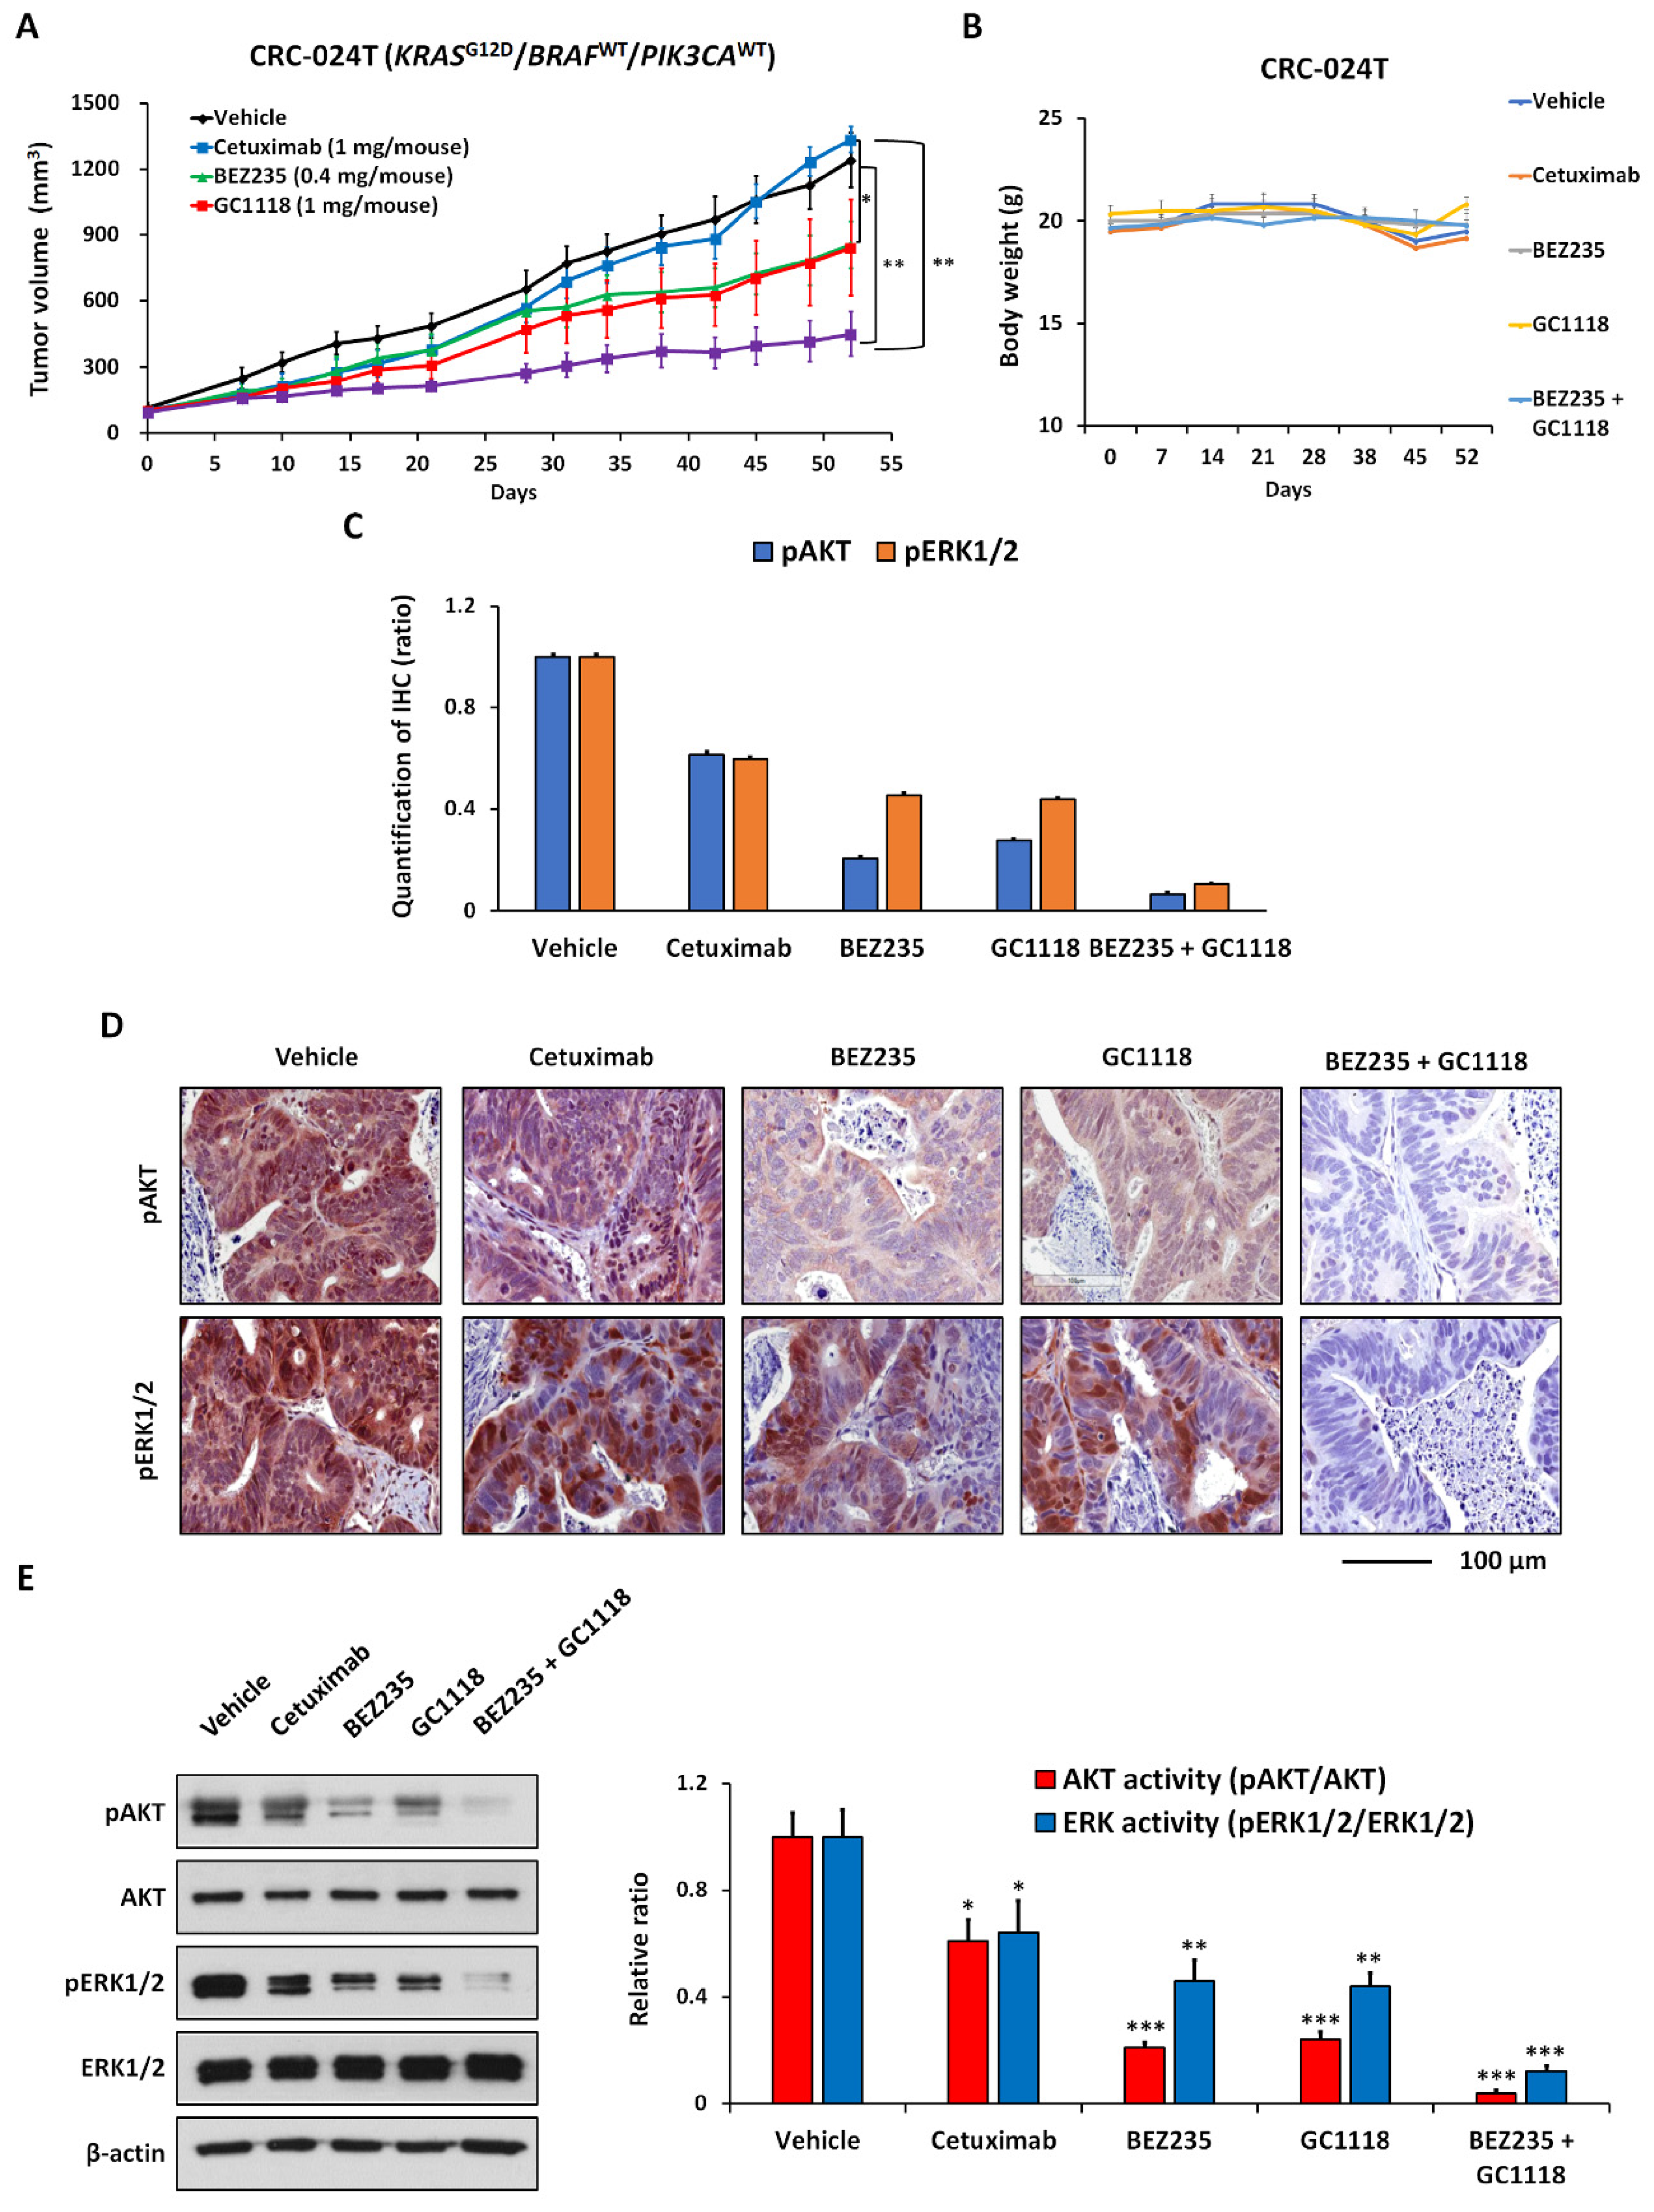
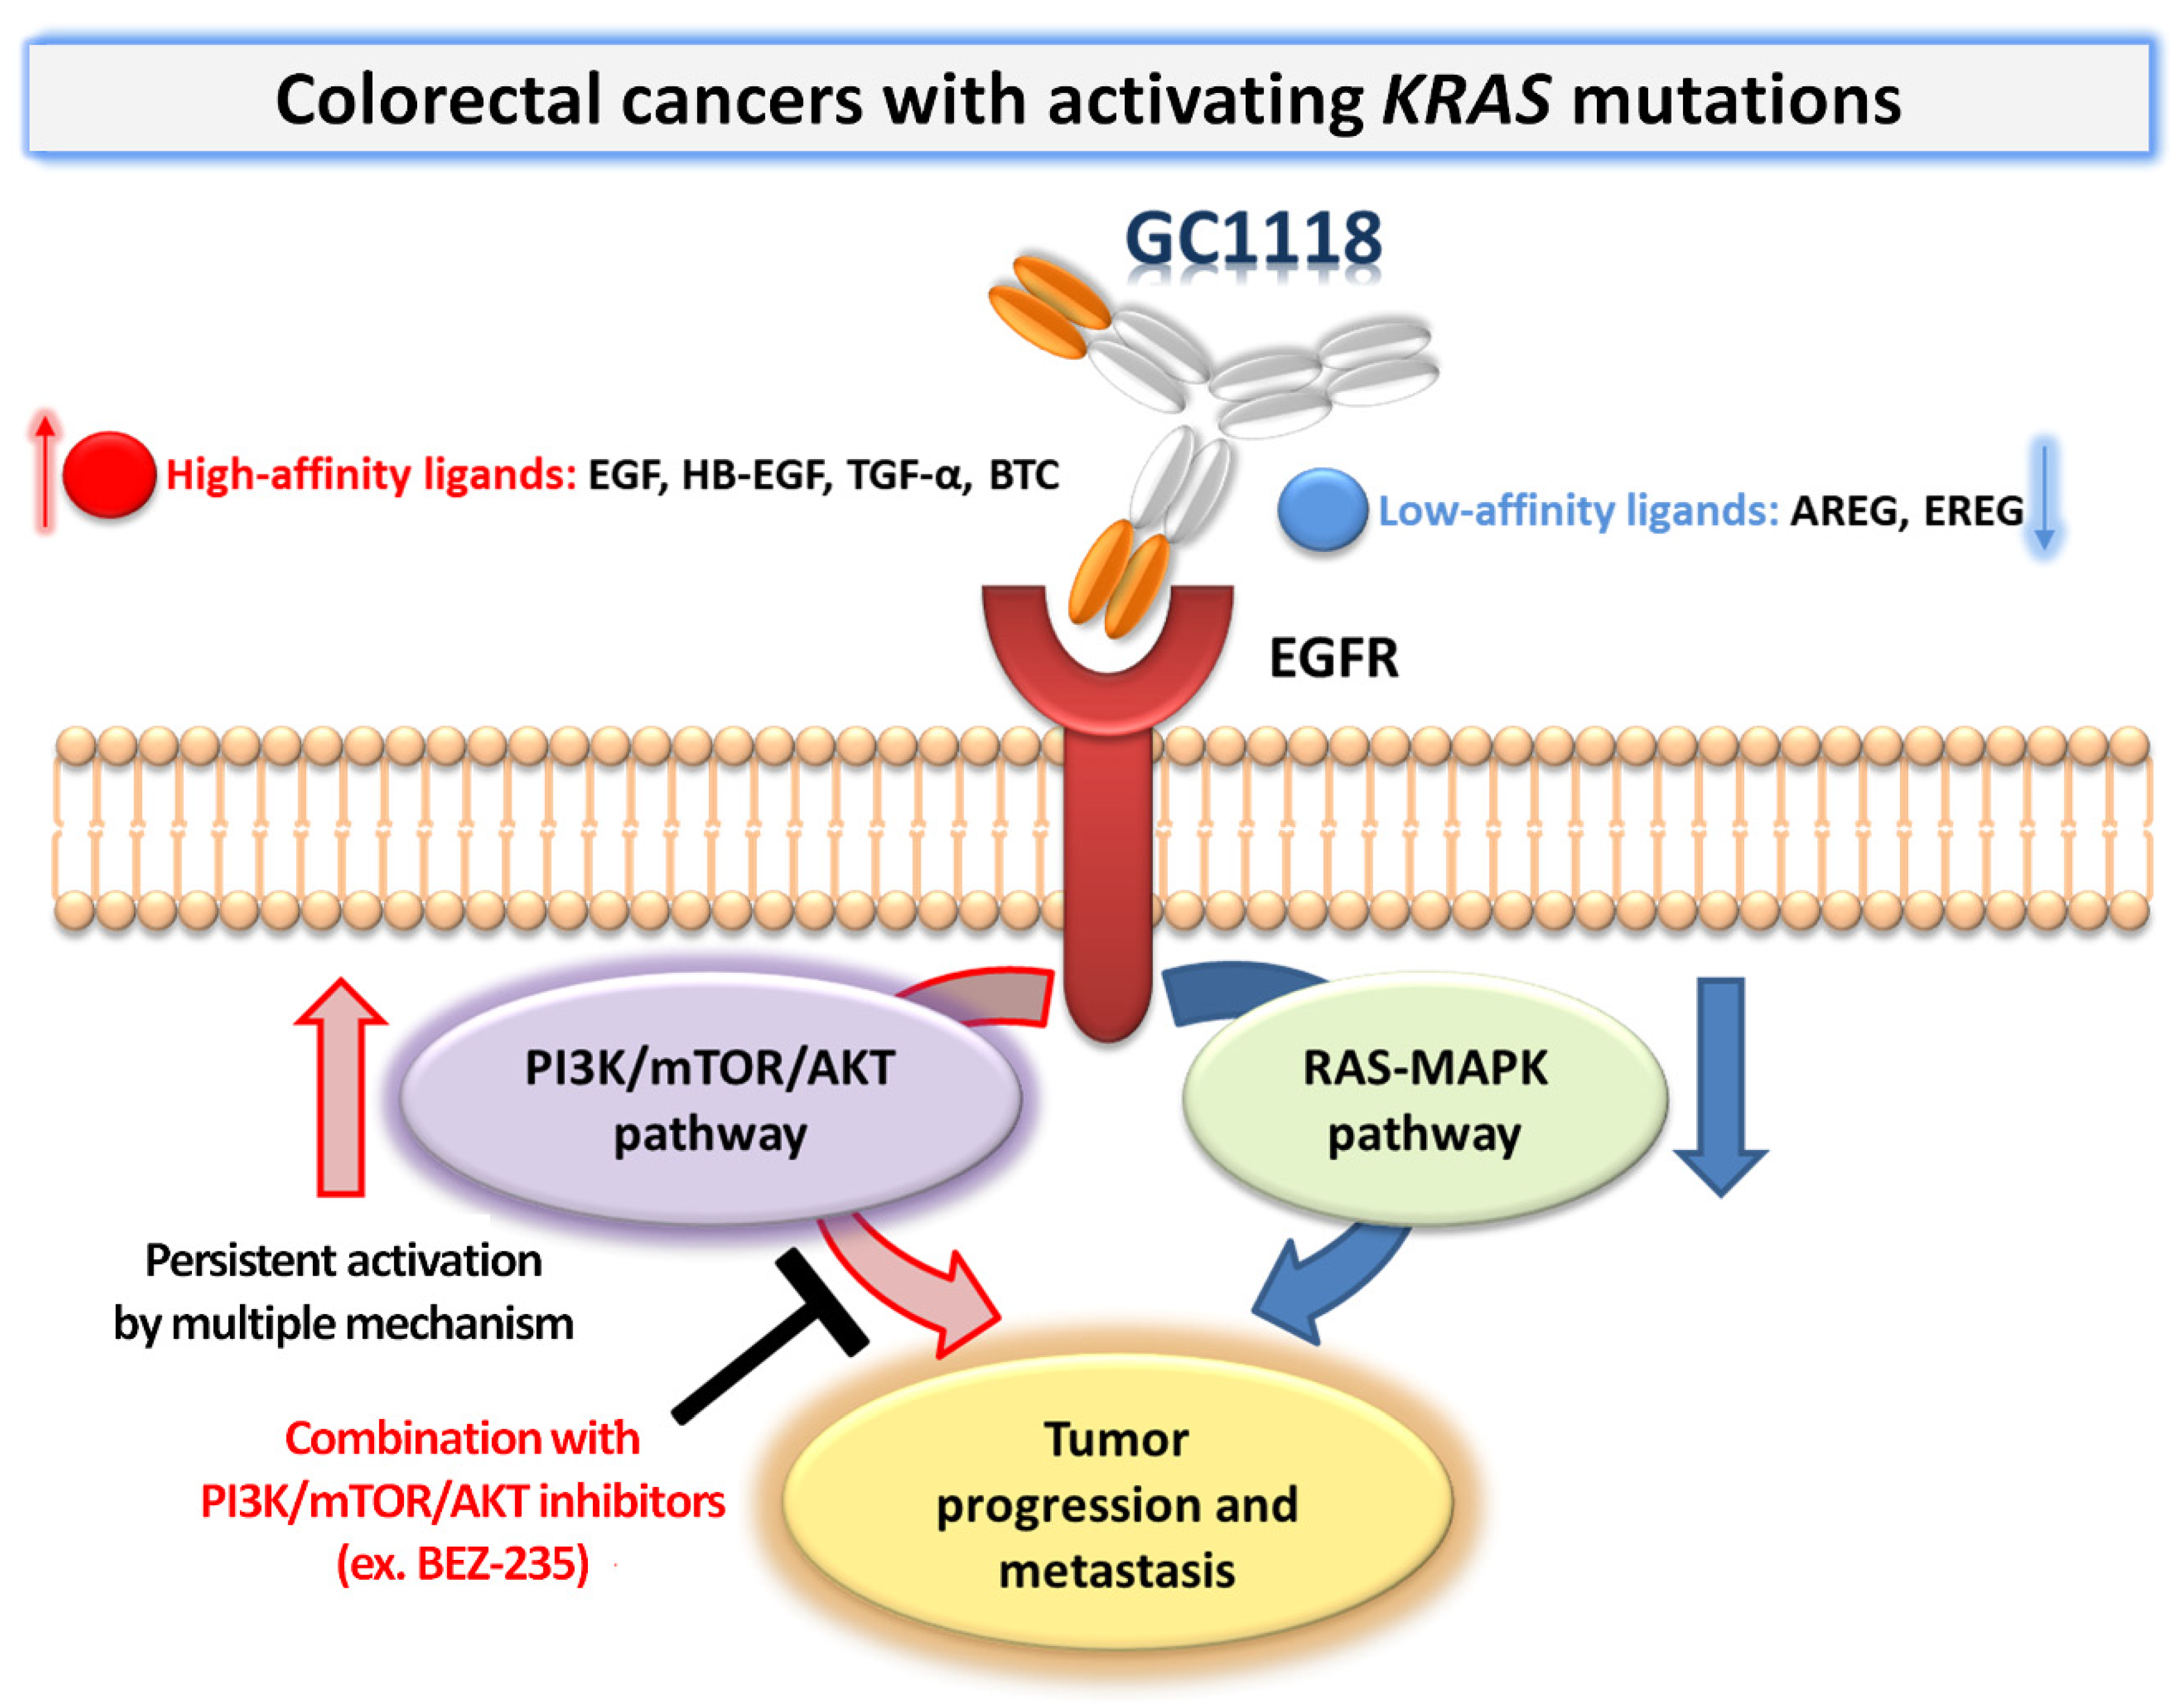
2.3. Activation of AKT Signaling Confers Resistance to GC1118 Monotherapy in KRAS-Mutant CRC PDX Models

The combined TGII from a panel of CRC PDXs revealed that GC1118 treatment inhibited tumor growth significantly better than cetuximab in KRAS-mutants (Figure 3 and Table S2); however, complete tumor regression was not observed. In seven CRC PDXs with varying levels of basal EGFR, AKT, and ERK1/2 activation before GC1118 treatment (Figure 4A), including an additional CRC-024T model (KRAS G12D; high-affinity ligand, 88.8%; low-affinity ligand, 11.2%; high basal AKT activity) with resistance to GC1118 and cetuximab (TGII-GC1118 = 65.6) (Table S2), the efficacy of GC1118 (TGII) showed a significant positive correlation with basal AKT activity only (Pearson’s r = 0.82, p = 0.024) (Figure 4B).
PI3K activity is the main predictor of mitogen-activated protein kinase kinase (MEK)-inhibitor resistance in KRAS-driven CRC [33,34] and thus, the additional use of a PI3K inhibitor could overcome resistance to MEK inhibition [35]. Although KRAS can directly activate PI3K signaling by binding to the p110-PI3K subunit, there is increasing evidence that PI3K activation, following MEK inhibition, is correlated with RTK activity, providing the foundation for the use of RTK inhibitors in KRAS-mutant CRC [36]. Based on these findings, we performed preliminary in vivo experiments, evaluating the combination of GC1118 and the dual PI3K/mTOR inhibitor BEZ-235 [27], in a relatively GC1118-resistant CRC-024T model (KRASG12D showing high basal AKT activity (Figure 5). Here, cetuximab was inactive (TGII = 109.4%, p = 0.600), whereas GC1118 (TGII = 65.6%, p = 0.255) or BEZ-235 (TGII = 67.4%, p = 0.103) alone had moderate antitumor effects (Figure 5A and Table S2). Furthermore, the combination of the two molecules exerted significant inhibitory effects on tumor growth (TGII = 31.6%; p = 0.007; Figure 5A) with no reduction in body weight (Figure 5B) and without any other signs. We also confirmed significant inhibitory effects on AKT and ERK1/2 activity using IHC (Figure 5C,D and Table S4) and immunoblotting (Figure 5E).

3. Discussion

As CRCs differ in clinical presentation, molecular heterogeneity, and the involvement of several molecular pathways and molecular changes [5,37], PDXs represent the fastest and most effective approach to uncover active therapeutic agents for CRC [24,25,26]. In contrast to previous studies, we utilized the PDX platform to evaluate the efficacy of GC1118 and its mechanism of action, as the induction and expression of high-affinity EGFR ligands have been reported to be more prevalent in CRC tumor xenografts than in in vitro cultures [8]. GC1118 is a human anti-EGFR IgG1 antibody that differs from existing anti-EGFR MoAbs, such as cetuximab and panitumumab, in its constant region, affinity, mode of action, and efficacy [8,20], exhibiting superior binding affinity (resulting in ADCC) to both the low- and high-affinity variants of FcγRIIIa compared to cetuximab [8,20]. Moreover, the use of Bagg albino (BALB)/c nude mice with intact innate immune systems could allow for the evaluation of GC1118-mediated ADCC through Fc receptors present on immune effector cells such as macrophages, monocytes, and natural killer cells [8,11,38].
A subset of CRCs lacking KRAS pathway mutations and showing “EGFR addiction” is treatable using two EGFR-targeting MoAbs, namely cetuximab and panitumumab [4,9]. When the oncogenic stimulus occurs downstream, such as in tumors with KRAS mutations, resistance to these therapies arises [4,5,7,12,16,39,40]. KRAS mutations in CRC are associated with a more rapid onset and aggressive metastasis, making it clinically more challenging [16,41,42]. Herein, we showed that efficiently blocking high-affinity EGFR ligands with GC1118 induces superior therapeutic benefits in KRAS mutated CRC PDX platform refractory to cetuximab. In addition, the basal up-regulated AKT pathway was correlated with lower efficacy of GC1118, and our preliminary, promising results indicated that GC1118 combined with the PI3K/mTOR/AKT inhibitor BEZ-235 showed improved antitumor effects on KRAS-mutant tumors with intrinsically high AKT activity with favorable safety, encouraging further studies using novel therapeutic combinations to treat clinically-aggressive KRAS-mutant CRC showing elevated ratios of high- to low-affinity EGFR ligands and PI3K/mTOR/AKT signaling (Figure 6).
Constitutively active MAPK signaling in KRAS-mutated CRC promotes epithelial–mesenchymal transition and cancer stemness, independent of external EGFR stimulation [43,44]. Further, persistent downstream signaling through the RAS axis due to KRAS mutations can activate multiple processes involved in tumor progression and metastasis without the influence of EGFR and other cell surface receptor kinases. Previous studies have reported a significant association between EREG/AREG expression and cetuximab response in KRAS-wild-type patients, but not in KRAS-mutant patients [6,8,9,10,20,21,45,46]. Therefore, there is an unmet need for novel EGFR-targeting therapies as alternative treatment options. Our results showed that CRC PDXs harboring KRAS mutations expressed remarkably higher levels of high-affinity EGFR ligands than KRAS-wild-type tumors, suggesting that the expression levels of EGFR ligands could be used as biomarkers to predict the therapeutic response to EGFR-targeting strategies. Although EREG and AREG are predominant EGFR ligands expressed in CRC, and only a small fraction of high-affinity ligands is expressed [29], upon downstream activation of the EGFR/RAS/MAPK axis owing to a mutated KRAS effector, the expression of AREG and EREG ligands would be biologically irrelevant in terms of any benefit from cetuximab [8,20,21,45]. The observed superior antitumor potency of GC1118 over cetuximab against CRC PDXs harboring activating KRAS mutations could be due to the strong inhibitory activity of the interaction between EGFR and high-affinity EGFR ligands [8,20,21], providing a rationale for clinical application of the expression pattern of EGFR ligands as a novel biomarker predictive of the response to GC1118 in treating patients with refractory mCRC. Supporting our work, increased secretion of the high-affinity EGFR ligands TGF-α and BTC by some KRAS-mutant clones has been suggested to be a paracrine resistance mechanism to anti-EGFR antibodies in CRC models [47,48,49]. Considering the significant roles of high-affinity EGFR ligands in modulating the tumor microenvironment and inducing resistance to various cancer therapeutics, our study suggests potential therapeutic advantages for GC1118 in terms of efficacy and the range of patients for whom it will be beneficial. Genetic and molecular mechanisms determining the ratio of high-affinity/low-affinity EGFR ligands, other than KRAS mutation status, should be elucidated through further comparative analyses of the therapeutic effects of GC1118 on CRC PDXs secreting mainly high- or low-affinity EGFR ligands using a larger panel of heterogenous CRC PDXs.
Here, importantly, we found that resistance to GC1118 was associated with increased activation of AKT signaling, suggesting that persistent activation of the PI3K/AKT/mTOR signaling axis by high-affinity EGFR ligands could be a potential feedback and resistance mechanism inducing EGFR inhibition. Although we focused on CRC PDX cases harboring only KRAS mutations to validate the potential of combined PI3K/mTOR/AKT and EGFR inhibition in KRAS-mutant CRC cells with high AKT activity due to several mechanisms such as the ratio of high- to low-affinity EGFR ligands, further investigations on CRC PDXs harboring concurrent mutations in both KRAS and the genes activating PI3K/mTOR/AKT pathway (e.g., PIK3CA) are required to strengthen the importance of PI3K/mTOR/AKT pathway in the resistance to GC-1118. Genetic mutations in the PI3K and MAPK pathways are frequently implicated in CRC [10,11,12]. CRC patients with PIK3CA and KRAS mutations are unlikely to respond to the inhibition of the MEK pathway alone or the PI3K pathway alone but will require effective inhibition of both MEK and PI3K/AKT signaling pathways [12,13,16,34,39,50,51,52,53,54,55]. For example, BEZ-235, in combination with EGFR inhibitors, is more effective for less mTOR inhibitor-sensitive and EGFR inhibitor-resistant CRC cell lines, especially HCT116 (which harbors KRAS and PIK3CA mutations), as shown in a recent study [39]. Previous findings suggest that acquired resistance to anti-EGFR MoAbs biochemically converges on RAS/RAF/MEK/ERK and PI3K/mTOR/AKT pathways, coupled with cross-talk mechanisms between other members of the EGFR family, such as HER2 and HER3, as well as IGF1R [39,55,56,57,58,59]. Additionally, it is well established that autophagy is associated with resistance to anti-EGFR MoAb therapy because EGFR stimulates multiple downstream signaling pathways that affect autophagy, including the PI3K–AKT–mTOR axis [7,60]. Combination therapy comprising anti-EGFR MoAbs together with autophagy-inducing PI3K/mTOR inhibitors could be used to develop an active therapeutic strategy for mCRC patients by inducing autophagic cell death [61,62].
Activating mutations in PIK3CA (phosphatidylinositol-4,5-bisphosphate 3-kinase, catalytic subunit alpha) are present in 15%–20% of CRCs, and the prevalence of PIK3CA exon 9 and/or exon 20 hotspot mutations increases continuously from rectal (10%) to cecal (25%) cancers, supporting the colorectal continuum paradigm [13,14,55,63,64,65,66,67,68,69,70,71,72,73]. Coexisting PIK3CA and KRAS mutations, which occur in approximately 8%–9% of CRC cases [55,66,67,68,73,74,75,76,77,78], predict resistance to anti-EGFR therapy, as well as worse prognosis, in CRC [16,39,52,55,66,68,76,79,80,81,82,83,84,85,86]. Interestingly, mutations in PIK3CA exon 9 (and to a lesser extent exon 20) are associated with features of the traditional serrated pathway (CpG island methylator phenotype-low (CIMP-low)/KRAS mutation) of tumorigenesis [66,68,76,78]. Insight into KRAS-driven CRCs will stimulate new research to find the best approach to treat this aggressive type of cancer, encouraging further evaluations of novel combination strategies including PI3K/mTOR/AKT inhibitors [39,56,87]. Although only one case was tested in the present study, our data highlight the potential of combined PI3K/mTOR and EGFR inhibition for KRAS-mutant CRC cells with relatively high levels of high-affinity EGFR ligands, although further investigation on the therapeutic efficacy, mode of action, and tolerability of this combination based on additional KRAS-mutant PDX models concurrently harboring other genetic alterations (with different genetic backgrounds) is required. In fact, there were three cases with mutations in both KRAS and PIK3CA among our panel (CRC-017T: KRAS G13D, PIK3A Q546K, TP53 R81X and P27R; CRC-021T: KRAS G13D); however, they could not be used for in vivo validation due to the difficulty in obtaining sufficient PDX cells for in vivo combination efficacy test. The verification of the synergy of GC1118 and BEZ-235 in several KRAS-mutant CRC PDX cases less susceptible to GC1118 by high AKT activity is essential to provide clinical reliability and strong support for our hypothesis, highlighting the potential of combined PI3K/mTOR and EGFR inhibition in KRAS-mutant CRC cells with relative high levels of high-affinity EGFR ligands. Our data highlight the potential of combined PI3K/mTOR/AKT and EGFR inhibition in KRAS-mutant CRC cells with relatively high levels of high-affinity EGFR ligands, with a need for further investigations on the therapeutic efficacy, mode of action, and tolerability for optimizing this combination in additional KRAS-mutant PDX models concurrently harboring other genetic alterations. As the low frequency of these double-mutant cases underscores the need for collaborative international efforts to undertake such drug combination studies, optimizing the design of such clinical trials for CRC requires a detailed knowledge of the prevalence of these respective mutant genotypes.
In summary, the superior inhibitory activity of GC1118 on high-affinity EGFR ligands, for which current clinical antibodies show restricted inhibitory activity, reflects the potential therapeutic advantage of this drug for the treatment of cancer in which high-affinity EGFR ligands are implicated in tumor progression, metastasis, and resistance to current cancer therapeutics. Although future work should focus on the development of predictive biomarkers and hypothesis-driven rational combinations, GC1118 might be of therapeutic benefit, alone or in combination with other agents, for KRAS-mutant mCRCs with elevated ratios of high- to low-affinity EGFR ligands and intrinsic PI3K–AKT pathway activation. Further validation based on mouse trials is required based on an expanded CRC PDX panel to overcome the heterogeneity encountered in the clinic and optimize clinical trial designs and further define a patient enrichment strategy.

4. Materials and Methods

4.1. CRC Patient Clinical Information

All CRC patients provided informed consent for the use of their tissues in this study, in accordance with protocols approved by the Samsung Medical Center (Seoul, Korea) Institutional Review Boards (IRB 2010-04-004). Sequencing analysis (after polymerase chain reaction (PCR) amplification) was performed on 51 patient-derived tissues to confirm the presence of KRAS, BRAF, PIK3CA, and TP53 mutations. Clinical information derived from histological examination and diagnosis based on biopsies from 51 patients with CRC was provided by the Samsung Medical Center. PCRs were carried out in a 20 μL reaction volume containing 100 ng genomic DNA, 10 pmol of each primer, and Maxime PCR premix (iNtRON Biotechnology, Seongnam, Korea). Bidirectional sequencing was performed using a BigDye Terminator v1.1 kit (Applied Biosystems, Foster City, CA, USA) on an ABI 3130XL Genetic Analyzer (Applied Biosystems). Sequence analysis was performed using the software package Sequencher 4.10.1 (Gene Codes Corporation, Ann Arbor, MI, USA).

4.2. Establishment of CRC PDXs and Analysis of EGFR Ligand Expression

To evaluate autocrine-derived EGFR ligands (and not paracrine ligands produced by stromal cells in the tumor microenvironment), we implanted CRC tumor fragments obtained from 51 patients into the subcutaneous layer of immunodeficient BALB/c nude mice, generating PDXs, as described previously [88]. Animal experiments were conducted in accordance with the Institute for Laboratory Animal Research Guide for the Care and Use of Laboratory Animals, and all protocols were approved by the Samsung Medical Center. Tumors that reached a volume of 1000 mm3 were considered tumorigenic. Tumor tissues were isolated from subcutaneous CRC PDXs when the tumor volume reached approximately 200 mm3. The tumors were homogenized, extracted in 1 mL lysis buffer (Cell Signaling Technology, Danvers, MA, USA), and centrifuged to remove tissue residue. The supernatant components were measured using multiplex ELISA arrays. Human EGF/HB-EGF/TGF-α/BTC/AREG ELISA kits (Ray Biotech, Norcross, GA, USA) and human EREG ELISA kits (USCN Life Science Inc., Houston, TX, USA) were used according to the manufacturers’ protocols to quantify the expression level of each EGFR ligand.

4.3. In Vivo Therapeutic Efficacy Evaluation Using a Panel of CRC PDX Models

All in vivo experiments were conducted according to the guidelines of the Association for Assessment and Accreditation of Laboratory Animal Care, from the Samsung Medical Center Animal Use and Care Committee (Approval No. 20151209001) and the National Institute of Health (NIH; Bethesda, MD, USA) Guide for the Care and Use of Laboratory Animals (NIH publication 80-23). We propagated CRC PDXs to evaluate the therapeutic efficacy of cetuximab, GC1118, and BEZ-235 by implanting PDX tumors into the flanks of 6–8-week-old female BALB/c nude mice purchased from Orient Bio Inc. (Seongnam, Korea). Tumors were harvested when they reached approximately 500 mm3, and dissociated single cells were isolated, added to Hank’s Buffered Salt Solution medium and Matrigel Basement Membrane Matrix mixture (1:1), and subcutaneously injected into the flanks of 6–8-week-old female BALB/c-nude mice.
When tumors reached approximately 200–250 mm3, the animals were randomized into groups based on tumor volume to minimize intragroup and intergroup variation (n = 3–7 mice/group). The start of dosing was defined as day 1, and tumor volumes and body weights were measured twice per week for 28–52 days, depending on the growth of each PDX. Tumor volume was calculated as (length × width2) × 0.52 [32]. Relative tumor volume was normalized to the initial tumor volume on day 1. GC1118 or cetuximab was administered at 50 mg/kg (1 mg/mouse) [8,20]. A vehicle was administered intraperitoneally twice per week, and BEZ-235 was administered at 20 mg/kg (0.4 mg/mouse) orally five times per week [89]. TGII values was used for antitumor efficacy [32]. Mice were monitored daily for signs of toxicity. After sacrificing each mouse, tumor tissue was harvested and divided into two parts, one for IHC examination and the other for protein extraction.

4.4. IHC

At the indicated post-treatment times, additional tumor-bearing mice were sacrificed and tumors were harvested to generate formalin-fixed paraffin-embedded (FFPE) specimens. FFPE samples were processed according to conventional experimental protocols for IHC analysis. Specimens were fixed with 4% paraformaldehyde in phosphate-buffered saline (PBS; Gibco), embedded in paraffin, and cut into sections that were blocked and permeabilized with 0.3% triton X-100 (Sigma-Aldrich, St. Louis, MO, USA) and 10% horse serum in PBS. Deparaffinization and antigen retrieval were followed by primary antibody staining and hematoxylin counterstaining. Primary antibodies used to label proteins were as follows: anti-phospho-AKT (Ser473; 1:50) and anti-phospho-ERK1/2 (Thr202/Tyr204; 1:100) (Cell Signaling Technology). These were labeled with secondary antibodies, as previously described [90]. To quantify AKT and ERK activity based on IHC, images were captured with an automatic histologic imaging system (TissueFAXS, TissueGnostics GmbH, Vienna, Austria). The expression of anti-phospho-AKT and anti-phospho-ERK1/2 was quantified by HistoQuest Analysis Software using TissueFAXS system (TissueGnostics) after defining regions of interest. Several parameters, such as nuclei size and intensity of staining, were adjusted to achieve optimal cell detection. Cells were plotted to scattergrams according to human-specific marker signals. Cutoff thresholds were determined using signal intensity of the secondary antibody alone as a negative control. Positive cell counts from images of immune-histolabeled sections were measured by two independent observers blinded to the experimental conditions. Mean values for positive cells counted in five locations were evaluated.

4.5. Immunoblotting Analysis

The tissues of tumor-bearing mice treated with GC1118, cetuximab, or BEZ-235 were prepared for western blotting. All tissues were lysed in NP40 buffer (50 mM Tris, pH 7.4, 250 mM NaCl, 5 mM EDTA, 50 mM NaF, 1 mM Na3VO4, 1% Nonidet P-40, 0.02% NaN3) with additional protease inhibitor cocktail tablets (Sigma-Aldrich, St. Louis, MO, USA) and phenylmethanesulfonyl fluoride (Sigma-Aldrich). Equal amounts of protein were subjected to SDS-PAGE and transferred to polyvinylidene difluoride membranes (Millipore). After blocking nonspecific binding with 5% skimmed milk or 5% bovine serum albumin (BSA)(Sigma-Aldrich) for 2 h at room temperature, the membranes were incubated with the indicated primary antibodies overnight at 4 °C and then with the appropriate secondary antibodies for 1 h at room temperature. EGFR-mediated downstream pathway proteins were confirmed using rabbit monoclonal antibodies, including anti-phospho-EGFR, anti-EGFR, anti-phospho-AKT(Ser473), anti-AKT, anti-phospho-ERK1/2 (Thr202/Tyr204), anti-ERK1/2 (Cell Signaling Technology Danvers, MA, USA), and anti-β-actin (Abcam, Cambridge, MA, USA) antibodies, with the Amersham ECL Prime western blotting detection reagent (GE Healthcare, Anaheim, CA, USA). For quantification, images were acquired and the signal intensity of each protein band was quantified using ImageJ software (NIH, Bethesda, MD, USA) and normalized to β-actin. The activities of EGFR, AKT, and ERK1/2 were determined by normalization with their total pairs, namely pEGFR/EGFR, pAKT/AKT, and pERK1/2/ERK1/2, respectively [91].

4.6. Statistics

Results were analyzed for statistical significance using GraphPad Prism V5.04 software and SPSS v.16 (SPSS Inc., Chicago, IL, USA). All data are expressed as the mean ± standard error of the mean (SEM) from at least three independent experiments. Two-tailed t-tests and one-way analysis of covariance were used to assess the differences between two groups of continuous variables, and p values < 0.05 were considered significant. Pearson’s correlation coefficients and two-tailed significance were calculated for each case. An unpaired t-test was used to compare TGIIs between different treatments. We used a key to indicate levels of significance as follows: * p < 0.05, ** p < 0.01, and *** p < 0.001.

Supplementary Materials

Supplementary materials can be found at https://www.mdpi.com/1422-0067/20/23/5894/s1.

Author Contributions

H.W.L., E.S., and K.L. are co-first authors; H.W.L., D.K., and D.-H.N. designed the study and supervised the entire project; H.W.L., E.S., K.L., Y.L. (Yeri Lee), Y.K., J.-C.L., Y.L. (Yangmi Lim), M.H., and D.K. performed the majority of the experiments and interpreted the data; H.W.L., E.S., K.L., D.K., and D.-H.N. wrote the manuscript and organized the figures.

Funding

This research was partially funded by grants from the Bio & Medical Technology Development Program of the National Research Foundation (NRF), funded by the National Research Foundation of Korea (NRF), funded by the Ministry of Education, Republic of Korea (NRF-2017R1A2B4011780 to H.W.L.), and the Korean government (MSIP) (NRF-2016R1A5A2945889 to H.W.L) and the Korea Health Technology R&D Project through the Korea Health Industry Development Institute (KHIDI), funded by the Ministry of Health & Welfare, Republic of Korea (HI14C3418 to D.-H.N).

Conflicts of Interest

The authors have no potential conflicts of interest to disclose.

Abbreviations

EGFRepidermal growth factor receptor
mCRCmetastatic colorectal cancer
PDXspatient-derived xenografts
PI3Kphosphatidylinositol-3-kinase
mTORmammalian target of rapamycin
CRCcolorectal cancer
RTKreceptor tyrosine kinase
IGF1Rinsulin like growth factor 1 receptor
TGF-αtransforming growth factor α
HB-EGFheparin-binding EGF-like growth factor
BTCbetacellulin
AREGamphiregulin
EREGEpiregulin
RASrat sarcoma
RAFrapidly accelerated fibrosarcoma
ADCCantibody-dependent cellular cytotoxicity
MAPKmitogen-activated protein kinase
KRASKRAS proto-oncogene GTPase
PIK3CAphosphatidylinositol-4,5-bisphosphate 3-kinase catalytic subunit alpha
PTENphosphatase and tensin homolog
TP53Tumor Protein P53
MEKmitogen-activated protein kinase kinase
BALBBagg albino
BSAbovine serum albumin

References

  1. Riihimaki, M.; Hemminki, A.; Sundquist, J.; Hemminki, K. Patterns of metastasis in colon and rectal cancer. Sci. Rep. 2016, 6, 29765. [Google Scholar] [PubMed]
  2. Siegel, R.L.; Miller, K.D.; Jemal, A. Cancer Statistics, 2017. CA Cancer J. Clin. 2017, 67, 7–30. [Google Scholar] [CrossRef] [PubMed]
  3. Palma, S.; Zwenger, A.O.; Croce, M.V.; Abba, M.C.; Lacunza, E. From Molecular Biology to Clinical Trials: Toward Personalized Colorectal Cancer Therapy. Clin. Colorectal Cancer 2016, 15, 104–115. [Google Scholar] [PubMed]
  4. De Mattia, E.; Cecchin, E.; Toffoli, G. Pharmacogenomics of intrinsic and acquired pharmacoresistance in colorectal cancer: Toward targeted personalized therapy. Drug Resist. Updates 2015, 20, 39–70. [Google Scholar] [CrossRef] [PubMed]
  5. Aziz, M.A.; Yousef, Z.; Saleh, A.M.; Mohammad, S.; Al Knawy, B. Towards personalized medicine of colorectal cancer. Crit. Rev. Oncol. Hematol. 2017, 118, 70–78. [Google Scholar] [PubMed]
  6. Mitchell, R.A.; Luwor, R.B.; Burgess, A.W. Epidermal growth factor receptor: Structure-function informing the design of anticancer therapeutics. Exp. Cell Res. 2018, 371, 1–19. [Google Scholar] [CrossRef] [PubMed]
  7. Koustas, E.; Karamouzis, M.V.; Mihailidou, C.; Schizas, D.; Papavassiliou, A.G. Co-targeting of EGFR and autophagy signaling is an emerging treatment strategy in metastatic colorectal cancer. Cancer Lett. 2017, 396, 94–102. [Google Scholar] [CrossRef]
  8. Lim, Y.; Yoo, J.; Kim, M.S.; Hur, M.; Lee, E.H.; Hur, H.S.; Lee, J.C.; Lee, S.N.; Park, T.W.; Lee, K.; et al. GC1118, an Anti-EGFR Antibody with a Distinct Binding Epitope and Superior Inhibitory Activity against High-Affinity EGFR Ligands. Mol. Cancer Ther. 2016, 15, 251–263. [Google Scholar]
  9. Bronte, G.; Silvestris, N.; Castiglia, M.; Galvano, A.; Passiglia, F.; Sortino, G.; Cicero, G.; Rolfo, C.; Peeters, M.; Bazan, V.; et al. New findings on primary and acquired resistance to anti-EGFR therapy in metastatic colorectal cancer: Do all roads lead to RAS? Oncotarget 2015, 6, 24780–24796. [Google Scholar] [CrossRef]
  10. Zhao, B.; Wang, L.; Qiu, H.; Zhang, M.; Sun, L.; Peng, P.; Yu, Q.; Yuan, X. Mechanisms of resistance to anti-EGFR therapy in colorectal cancer. Oncotarget 2017, 8, 3980–4000. [Google Scholar] [CrossRef]
  11. Agustoni, F.; Suda, K.; Yu, H.; Ren, S.; Rivard, C.J.; Ellison, K.; Caldwell, C., Jr.; Rozeboom, L.; Brovsky, K.; Hirsch, F.R. EGFR-directed monoclonal antibodies in combination with chemotherapy for treatment of non-small-cell lung cancer: An updated review of clinical trials and new perspectives in biomarkers analysis. Cancer Treat. Rev. 2019, 72, 15–27. [Google Scholar] [CrossRef] [PubMed]
  12. Temraz, S.; Mukherji, D.; Shamseddine, A. Dual Inhibition of MEK and PI3K Pathway in KRAS and BRAF Mutated Colorectal Cancers. Int. J. Mol. Sci. 2015, 16, 22976–22988. [Google Scholar] [CrossRef] [PubMed]
  13. De Roock, W.; De Vriendt, V.; Normanno, N.; Ciardiello, F.; Tejpar, S. KRAS, BRAF, PIK3CA, and PTEN mutations: Implications for targeted therapies in metastatic colorectal cancer. Lancet Oncol. 2011, 12, 594–603. [Google Scholar] [CrossRef]
  14. Laurent-Puig, P.; Cayre, A.; Manceau, G.; Buc, E.; Bachet, J.B.; Lecomte, T.; Rougier, P.; Lievre, A.; Landi, B.; Boige, V.; et al. Analysis of PTEN, BRAF, and EGFR status in determining benefit from cetuximab therapy in wild-type KRAS metastatic colon cancer. J. Clin. Oncol. 2009, 27, 5924–5930. [Google Scholar] [CrossRef] [PubMed]
  15. Misale, S.; Di Nicolantonio, F.; Sartore-Bianchi, A.; Siena, S.; Bardelli, A. Resistance to anti-EGFR therapy in colorectal cancer: From heterogeneity to convergent evolution. Cancer Discov. 2014, 4, 1269–1280. [Google Scholar] [CrossRef] [PubMed]
  16. Schirripa, M.; Procaccio, L.; Lonardi, S.; Loupakis, F. The role of pharmacogenetics in the new ESMO colorectal cancer guidelines. Pharmacogenomics 2017, 18, 197–200. [Google Scholar] [CrossRef]
  17. Janakiraman, M.; Vakiani, E.; Zeng, Z.; Pratilas, C.A.; Taylor, B.S.; Chitale, D.; Halilovic, E.; Wilson, M.; Huberman, K.; Ricarte Filho, J.C.; et al. Genomic and biological characterization of exon 4 KRAS mutations in human cancer. Cancer Res. 2010, 70, 5901–5911. [Google Scholar] [CrossRef]
  18. Morris, V.K.; Lucas, F.A.; Overman, M.J.; Eng, C.; Morelli, M.P.; Jiang, Z.Q.; Luthra, R.; Meric-Bernstam, F.; Maru, D.; Scheet, P.; et al. Clinicopathologic characteristics and gene expression analyses of non-KRAS 12/13, RAS-mutated metastatic colorectal cancer. Ann. Oncol. 2014, 25, 2008–2014. [Google Scholar] [CrossRef]
  19. Loupakis, F.; Ruzzo, A.; Cremolini, C.; Vincenzi, B.; Salvatore, L.; Santini, D.; Masi, G.; Stasi, I.; Canestrari, E.; Rulli, E.; et al. KRAS codon 61, 146 and BRAF mutations predict resistance to cetuximab plus irinotecan in KRAS codon 12 and 13 wild-type metastatic colorectal cancer. Br. J. Cancer 2009, 101, 715–721. [Google Scholar] [CrossRef]
  20. Park, J.E.; Jin, M.H.; Hur, M.; Nam, A.R.; Bang, J.H.; Won, J.; Oh, D.Y.; Bang, Y.J. GC1118, a novel anti-EGFR antibody, has potent KRAS mutation-independent antitumor activity compared with cetuximab in gastric cancer. Gastric Cancer 2019, 22, 932–940. [Google Scholar] [CrossRef]
  21. Seligmann, J.F.; Elliott, F.; Richman, S.D.; Jacobs, B.; Hemmings, G.; Brown, S.; Barrett, J.H.; Tejpar, S.; Quirke, P.; Seymour, M.T. Combined Epiregulin and Amphiregulin Expression Levels as a Predictive Biomarker for Panitumumab Therapy Benefit or Lack of Benefit in Patients With RAS Wild-Type Advanced Colorectal Cancer. JAMA Oncol. 2016, 2, 633–642. [Google Scholar] [CrossRef] [PubMed]
  22. Oh, D.Y.; Lee, K.W.; Han, S.W.; Kim, J.W.; Shin, J.W.; Jo, S.J.; Won, J.; Hahn, S.; Lee, H.; Kim, W.H.; et al. A First-in-Human Phase I Study of GC1118, a Novel Anti-Epidermal Growth Factor Receptor Antibody, in Patients with Advanced Solid Tumors. Oncologist 2019, 24, 1037-e636. [Google Scholar] [CrossRef] [PubMed]
  23. Swick, A.D.; Prabakaran, P.J.; Miller, M.C.; Javaid, A.M.; Fisher, M.M.; Sampene, E.; Ong, I.M.; Hu, R.; Iida, M.; Nickel, K.P.; et al. Cotargeting mTORC and EGFR Signaling as a Therapeutic Strategy in HNSCC. Mol. Cancer Ther. 2017, 16, 1257–1268. [Google Scholar] [CrossRef] [PubMed]
  24. Nunes, M.; Vrignaud, P.; Vacher, S.; Richon, S.; Lievre, A.; Cacheux, W.; Weiswald, L.B.; Massonnet, G.; Chateau-Joubert, S.; Nicolas, A.; et al. Evaluating patient-derived colorectal cancer xenografts as preclinical models by comparison with patient clinical data. Cancer Res. 2015, 75, 1560–1566. [Google Scholar] [CrossRef] [PubMed]
  25. Katsiampoura, A.; Raghav, K.; Jiang, Z.Q.; Menter, D.G.; Varkaris, A.; Morelli, M.P.; Manuel, S.; Wu, J.; Sorokin, A.V.; Rizi, B.S.; et al. Modeling of Patient-Derived Xenografts in Colorectal Cancer. Mol. Cancer Ther. 2017, 16, 1435–1442. [Google Scholar] [CrossRef] [PubMed]
  26. Maekawa, H.; Miyoshi, H.; Yamaura, T.; Itatani, Y.; Kawada, K.; Sakai, Y.; Taketo, M.M. A Chemosensitivity Study of Colorectal Cancer Using Xenografts of Patient-Derived Tumor-Initiating Cells. Mol. Cancer Ther. 2018, 17, 2187–2196. [Google Scholar] [CrossRef]
  27. Rodrik-Outmezguine, V.S.; Chandarlapaty, S.; Pagano, N.C.; Poulikakos, P.I.; Scaltriti, M.; Moskatel, E.; Baselga, J.; Guichard, S.; Rosen, N. mTOR kinase inhibition causes feedback-dependent biphasic regulation of AKT signaling. Cancer Discov. 2011, 1, 248–259. [Google Scholar] [CrossRef]
  28. Patel, J.N.; Fong, M.K.; Jagosky, M. Colorectal Cancer Biomarkers in the Era of Personalized Medicine. J. Pers Med. 2019, 9, 3. [Google Scholar] [CrossRef]
  29. Khambata-Ford, S.; Garrett, C.R.; Meropol, N.J.; Basik, M.; Harbison, C.T.; Wu, S.; Wong, T.W.; Huang, X.; Takimoto, C.H.; Godwin, A.K.; et al. Expression of epiregulin and amphiregulin and K-ras mutation status predict disease control in metastatic colorectal cancer patients treated with cetuximab. J. Clin. Oncol. 2007, 25, 3230–3237. [Google Scholar] [CrossRef]
  30. Nagaoka, T.; Kitaura, K.; Miyata, Y.; Kumagai, K.; Kaneda, G.; Kanazawa, H.; Suzuki, S.; Hamada, Y.; Suzuki, R. Downregulation of epidermal growth factor receptor family receptors and ligands in a mutant K-ras group of patients with colorectal cancer. Mol. Med. Rep. 2016, 13, 3514–3520. [Google Scholar] [CrossRef]
  31. Schulze, A.; Lehmann, K.; Jefferies, H.B.; McMahon, M.; Downward, J. Analysis of the transcriptional program induced by Raf in epithelial cells. Genes Dev. 2001, 15, 981–994. [Google Scholar] [CrossRef] [PubMed]
  32. Klauck, P.J.; Bagby, S.M.; Capasso, A.; Bradshaw-Pierce, E.L.; Selby, H.M.; Spreafico, A.; Tentler, J.J.; Tan, A.C.; Kim, J.; Arcaroli, J.J.; et al. Antitumor activity of the polo-like kinase inhibitor, TAK-960, against preclinical models of colorectal cancer. BMC Cancer 2018, 18, 136. [Google Scholar] [CrossRef] [PubMed] [Green Version]
  33. Balmanno, K.; Chell, S.D.; Gillings, A.S.; Hayat, S.; Cook, S.J. Intrinsic resistance to the MEK1/2 inhibitor AZD6244 (ARRY-142886) is associated with weak ERK1/2 signalling and/or strong PI3K signalling in colorectal cancer cell lines. Int. J. Cancer 2009, 125, 2332–2341. [Google Scholar] [CrossRef] [PubMed]
  34. Wee, S.; Jagani, Z.; Xiang, K.X.; Loo, A.; Dorsch, M.; Yao, Y.M.; Sellers, W.R.; Lengauer, C.; Stegmeier, F. PI3K pathway activation mediates resistance to MEK inhibitors in KRAS mutant cancers. Cancer Res. 2009, 69, 4286–4293. [Google Scholar] [CrossRef]
  35. Martinelli, E.; Troiani, T.; D’Aiuto, E.; Morgillo, F.; Vitagliano, D.; Capasso, A.; Costantino, S.; Ciuffreda, L.P.; Merolla, F.; Vecchione, L.; et al. Antitumor activity of pimasertib, a selective MEK 1/2 inhibitor, in combination with PI3K/mTOR inhibitors or with multi-targeted kinase inhibitors in pimasertib-resistant human lung and colorectal cancer cells. Int. J. Cancer 2013, 133, 2089–2101. [Google Scholar] [CrossRef]
  36. Ebi, H.; Corcoran, R.B.; Singh, A.; Chen, Z.; Song, Y.; Lifshits, E.; Ryan, D.P.; Meyerhardt, J.A.; Benes, C.; Settleman, J.; et al. Receptor tyrosine kinases exert dominant control over PI3K signaling in human KRAS mutant colorectal cancers. J. Clin. Investig. 2011, 121, 4311–4321. [Google Scholar] [CrossRef]
  37. Linnekamp, J.F.; Wang, X.; Medema, J.P.; Vermeulen, L. Colorectal cancer heterogeneity and targeted therapy: A case for molecular disease subtypes. Cancer Res. 2015, 75, 245–249. [Google Scholar] [CrossRef] [Green Version]
  38. Nehls, M.; Pfeifer, D.; Schorpp, M.; Hedrich, H.; Boehm, T. New member of the winged-helix protein family disrupted in mouse and rat nude mutations. Nature 1994, 372, 103–107. [Google Scholar] [CrossRef]
  39. Jifu, E.; Xing, J.; Gong, H.; He, J.; Zhang, W. Combine MEK inhibition with PI3K/mTOR inhibition exert inhibitory tumor growth effect on KRAS and PIK3CA mutation CRC xenografts due to reduced expression of VEGF and matrix metallopeptidase-9. Tumour Biol. 2015, 36, 1091–1097. [Google Scholar]
  40. Temraz, S.; Mukherji, D.; Shamseddine, A. Sequencing of treatment in metastatic colorectal cancer: Where to fit the target. World J. Gastroenterol. 2014, 20, 1993–2004. [Google Scholar] [CrossRef]
  41. Yaeger, R.; Cowell, E.; Chou, J.F.; Gewirtz, A.N.; Borsu, L.; Vakiani, E.; Solit, D.B.; Rosen, N.; Capanu, M.; Ladanyi, M.; et al. RAS mutations affect pattern of metastatic spread and increase propensity for brain metastasis in colorectal cancer. Cancer 2015, 121, 1195–1203. [Google Scholar] [CrossRef] [PubMed] [Green Version]
  42. Huang, D.; Sun, W.; Zhou, Y.; Li, P.; Chen, F.; Chen, H.; Xia, D.; Xu, E.; Lai, M.; Wu, Y.; et al. Mutations of key driver genes in colorectal cancer progression and metastasis. Cancer Metastasis Rev. 2018, 37, 173–187. [Google Scholar] [CrossRef] [PubMed]
  43. Blaj, C.; Schmidt, E.M.; Lamprecht, S.; Hermeking, H.; Jung, A.; Kirchner, T.; Horst, D. Oncogenic Effects of High MAPK Activity in Colorectal Cancer Mark Progenitor Cells and Persist Irrespective of RAS Mutations. Cancer Res. 2017, 77, 1763–1774. [Google Scholar] [CrossRef]
  44. Dienstmann, R.; Salazar, R.; Tabernero, J. Overcoming Resistance to Anti-EGFR Therapy in Colorectal Cancer. Am. Soc. Clin. Oncol. Educ. Book 2015, 35, e149–e156. [Google Scholar] [CrossRef] [Green Version]
  45. Pentheroudakis, G.; Kotoula, V.; De Roock, W.; Kouvatseas, G.; Papakostas, P.; Makatsoris, T.; Papamichael, D.; Xanthakis, I.; Sgouros, J.; Televantou, D.; et al. Biomarkers of benefit from cetuximab-based therapy in metastatic colorectal cancer: Interaction of EGFR ligand expression with RAS/RAF, PIK3CA genotypes. BMC Cancer 2013, 13, 49. [Google Scholar] [CrossRef] [Green Version]
  46. Dienstmann, R.; Vilar, E.; Tabernero, J. Molecular predictors of response to chemotherapy in colorectal cancer. Cancer J. 2011, 17, 114–126. [Google Scholar] [CrossRef]
  47. Khelwatty, S.; Essapen, S.; Bagwan, I.; Green, M.; Seddon, A.; Modjtahedi, H. The impact of co-expression of wild-type EGFR and its ligands determined by immunohistochemistry for response to treatment with cetuximab in patients with metastatic colorectal cancer. Oncotarget 2017, 8, 7666–7677. [Google Scholar] [CrossRef] [Green Version]
  48. Hobor, S.; Van Emburgh, B.O.; Crowley, E.; Misale, S.; Di Nicolantonio, F.; Bardelli, A. TGFalpha and amphiregulin paracrine network promotes resistance to EGFR blockade in colorectal cancer cells. Clin. Cancer Res. 2014, 20, 6429–6438. [Google Scholar] [CrossRef]
  49. Troiani, T.; Martinelli, E.; Napolitano, S.; Vitagliano, D.; Ciuffreda, L.P.; Costantino, S.; Morgillo, F.; Capasso, A.; Sforza, V.; Nappi, A.; et al. Increased TGF-alpha as a mechanism of acquired resistance to the anti-EGFR inhibitor cetuximab through EGFR-MET interaction and activation of MET signaling in colon cancer cells. Clin. Cancer Res. 2013, 19, 6751–6765. [Google Scholar] [CrossRef]
  50. Ihle, N.T.; Lemos, R., Jr.; Wipf, P.; Yacoub, A.; Mitchell, C.; Siwak, D.; Mills, G.B.; Dent, P.; Kirkpatrick, D.L.; Powis, G. Mutations in the phosphatidylinositol-3-kinase pathway predict for antitumor activity of the inhibitor PX-866 whereas oncogenic Ras is a dominant predictor for resistance. Cancer Res. 2009, 69, 143–150. [Google Scholar] [CrossRef] [Green Version]
  51. Sos, M.L.; Fischer, S.; Ullrich, R.; Peifer, M.; Heuckmann, J.M.; Koker, M.; Heynck, S.; Stuckrath, I.; Weiss, J.; Fischer, F.; et al. Identifying genotype-dependent efficacy of single and combined PI3K- and MAPK-pathway inhibition in cancer. Proc. Natl. Acad. Sci. USA 2009, 106, 18351–18356. [Google Scholar] [CrossRef] [PubMed] [Green Version]
  52. Halilovic, E.; She, Q.B.; Ye, Q.; Pagliarini, R.; Sellers, W.R.; Solit, D.B.; Rosen, N. PIK3CA mutation uncouples tumor growth and cyclin D1 regulation from MEK/ERK and mutant KRAS signaling. Cancer Res. 2010, 70, 6804–6814. [Google Scholar] [CrossRef] [PubMed]
  53. Janku, F.; Tsimberidou, A.M.; Garrido-Laguna, I.; Wang, X.; Luthra, R.; Hong, D.S.; Naing, A.; Falchook, G.S.; Moroney, J.W.; Piha-Paul, S.A.; et al. PIK3CA mutations in patients with advanced cancers treated with PI3K/AKT/mTOR axis inhibitors. Mol. Cancer Ther. 2011, 10, 558–565. [Google Scholar] [CrossRef] [PubMed] [Green Version]
  54. Haagensen, E.J.; Kyle, S.; Beale, G.S.; Maxwell, R.J.; Newell, D.R. The synergistic interaction of MEK and PI3K inhibitors is modulated by mTOR inhibition. Br. J. Cancer 2012, 106, 1386–1394. [Google Scholar] [CrossRef] [Green Version]
  55. Patel, G.S.; Karapetis, C.S. Personalized treatment for advanced colorectal cancer: KRAS and beyond. Cancer Manag. Res. 2013, 5, 387–400. [Google Scholar]
  56. Vitiello, P.P.; Cardone, C.; Martini, G.; Ciardiello, D.; Belli, V.; Matrone, N.; Barra, G.; Napolitano, S.; Della Corte, C.; Turano, M.; et al. Receptor tyrosine kinase-dependent PI3K activation is an escape mechanism to vertical suppression of the EGFR/RAS/MAPK pathway in KRAS-mutated human colorectal cancer cell lines. J. Exp. Clin. Cancer Res. 2019, 38, 41. [Google Scholar] [CrossRef]
  57. D’Amato, V.; Rosa, R.; D’Amato, C.; Formisano, L.; Marciano, R.; Nappi, L.; Raimondo, L.; Di Mauro, C.; Servetto, A.; Fusciello, C.; et al. The dual PI3K/mTOR inhibitor PKI-587 enhances sensitivity to cetuximab in EGFR-resistant human head and neck cancer models. Br. J. Cancer 2014, 110, 2887–2895. [Google Scholar] [CrossRef] [Green Version]
  58. Li, B.; Gao, S.; Wei, F.; Bellail, A.C.; Hao, C.; Liu, T. Simultaneous targeting of EGFR and mTOR inhibits the growth of colorectal carcinoma cells. Oncol. Rep. 2012, 28, 15–20. [Google Scholar]
  59. Belmont, P.J.; Jiang, P.; McKee, T.D.; Xie, T.; Isaacson, J.; Baryla, N.E.; Roper, J.; Sinnamon, M.J.; Lee, N.V.; Kan, J.L.; et al. Resistance to dual blockade of the kinases PI3K and mTOR in KRAS-mutant colorectal cancer models results in combined sensitivity to inhibition of the receptor tyrosine kinase EGFR. Sci. Signal. 2014, 7, ra107. [Google Scholar] [CrossRef]
  60. Jutten, B.; Rouschop, K.M. EGFR signaling and autophagy dependence for growth, survival, and therapy resistance. Cell Cycle 2014, 13, 42–51. [Google Scholar] [CrossRef] [Green Version]
  61. Kucharewicz, K.; Dudkowska, M.; Zawadzka, A.; Ogrodnik, M.; Szczepankiewicz, A.A.; Czarnocki, Z.; Sikora, E. Simultaneous induction and blockade of autophagy by a single agent. Cell Death Dis. 2018, 9, 353. [Google Scholar] [CrossRef] [PubMed] [Green Version]
  62. Lin, L.; Baehrecke, E.H. Autophagy, cell death, and cancer. Mol. Cell. Oncol. 2015, 2, e985913. [Google Scholar] [CrossRef] [PubMed] [Green Version]
  63. Ogino, S.; Lochhead, P.; Giovannucci, E.; Meyerhardt, J.A.; Fuchs, C.S.; Chan, A.T. Discovery of colorectal cancer PIK3CA mutation as potential predictive biomarker: Power and promise of molecular pathological epidemiology. Oncogene 2014, 33, 2949–2955. [Google Scholar] [CrossRef] [PubMed] [Green Version]
  64. Yamauchi, M.; Morikawa, T.; Kuchiba, A.; Imamura, Y.; Qian, Z.R.; Nishihara, R.; Liao, X.; Waldron, L.; Hoshida, Y.; Huttenhower, C.; et al. Assessment of colorectal cancer molecular features along bowel subsites challenges the conception of distinct dichotomy of proximal versus distal colorectum. Gut 2012, 61, 847–854. [Google Scholar] [CrossRef] [PubMed]
  65. Yamauchi, M.; Lochhead, P.; Morikawa, T.; Huttenhower, C.; Chan, A.T.; Giovannucci, E.; Fuchs, C.; Ogino, S. Colorectal cancer: A tale of two sides or a continuum? Gut 2012, 61, 794–797. [Google Scholar] [CrossRef] [PubMed] [Green Version]
  66. Liao, X.; Morikawa, T.; Lochhead, P.; Imamura, Y.; Kuchiba, A.; Yamauchi, M.; Nosho, K.; Qian, Z.R.; Nishihara, R.; Meyerhardt, J.A.; et al. Prognostic role of PIK3CA mutation in colorectal cancer: Cohort study and literature review. Clin. Cancer Res. 2012, 18, 2257–2268. [Google Scholar] [CrossRef] [Green Version]
  67. Barault, L.; Veyrie, N.; Jooste, V.; Lecorre, D.; Chapusot, C.; Ferraz, J.M.; Lievre, A.; Cortet, M.; Bouvier, A.M.; Rat, P.; et al. Mutations in the RAS-MAPK, PI(3)K (phosphatidylinositol-3-OH kinase) signaling network correlate with poor survival in a population-based series of colon cancers. Int. J. Cancer 2008, 122, 2255–2259. [Google Scholar] [CrossRef]
  68. De Roock, W.; Claes, B.; Bernasconi, D.; De Schutter, J.; Biesmans, B.; Fountzilas, G.; Kalogeras, K.T.; Kotoula, V.; Papamichael, D.; Laurent-Puig, P.; et al. Effects of KRAS, BRAF, NRAS, and PIK3CA mutations on the efficacy of cetuximab plus chemotherapy in chemotherapy-refractory metastatic colorectal cancer: A retrospective consortium analysis. Lancet Oncol. 2010, 11, 753–762. [Google Scholar] [CrossRef]
  69. Tol, J.; Dijkstra, J.R.; Klomp, M.; Teerenstra, S.; Dommerholt, M.; Vink-Borger, M.E.; van Cleef, P.H.; van Krieken, J.H.; Punt, C.J.; Nagtegaal, I.D. Markers for EGFR pathway activation as predictor of outcome in metastatic colorectal cancer patients treated with or without cetuximab. Eur. J. Cancer 2010, 46, 1997–2009. [Google Scholar] [CrossRef]
  70. Gavin, P.G.; Colangelo, L.H.; Fumagalli, D.; Tanaka, N.; Remillard, M.Y.; Yothers, G.; Kim, C.; Taniyama, Y.; Kim, S.I.; Choi, H.J.; et al. Mutation profiling and microsatellite instability in stage II and III colon cancer: An assessment of their prognostic and oxaliplatin predictive value. Clin. Cancer Res. 2012, 18, 6531–6541. [Google Scholar] [CrossRef]
  71. Wu, S.; Gan, Y.; Wang, X.; Liu, J.; Li, M.; Tang, Y. PIK3CA mutation is associated with poor survival among patients with metastatic colorectal cancer following anti-EGFR monoclonal antibody therapy: A meta-analysis. J. Cancer Res. Clin. Oncol. 2013, 139, 891–900. [Google Scholar] [CrossRef] [PubMed]
  72. Abubaker, J.; Bavi, P.; Al-Harbi, S.; Ibrahim, M.; Siraj, A.K.; Al-Sanea, N.; Abduljabbar, A.; Ashari, L.H.; Alhomoud, S.; Al-Dayel, F.; et al. Clinicopathological analysis of colorectal cancers with PIK3CA mutations in Middle Eastern population. Oncogene 2008, 27, 3539–3545. [Google Scholar] [CrossRef] [PubMed] [Green Version]
  73. Nosho, K.; Kawasaki, T.; Ohnishi, M.; Suemoto, Y.; Kirkner, G.J.; Zepf, D.; Yan, L.; Longtine, J.A.; Fuchs, C.S.; Ogino, S. PIK3CA mutation in colorectal cancer: Relationship with genetic and epigenetic alterations. Neoplasia 2008, 10, 534–541. [Google Scholar] [CrossRef] [PubMed] [Green Version]
  74. Velho, S.; Oliveira, C.; Ferreira, A.; Ferreira, A.C.; Suriano, G.; Schwartz, S., Jr.; Duval, A.; Carneiro, F.; Machado, J.C.; Hamelin, R.; et al. The prevalence of PIK3CA mutations in gastric and colon cancer. Eur. J. Cancer 2005, 41, 1649–1654. [Google Scholar] [CrossRef]
  75. Imamura, Y.; Morikawa, T.; Liao, X.; Lochhead, P.; Kuchiba, A.; Yamauchi, M.; Qian, Z.R.; Nishihara, R.; Meyerhardt, J.A.; Haigis, K.M.; et al. Specific mutations in KRAS codons 12 and 13, and patient prognosis in 1075 BRAF wild-type colorectal cancers. Clin. Cancer Res. 2012, 18, 4753–4763. [Google Scholar] [CrossRef] [Green Version]
  76. Day, F.L.; Jorissen, R.N.; Lipton, L.; Mouradov, D.; Sakthianandeswaren, A.; Christie, M.; Li, S.; Tsui, C.; Tie, J.; Desai, J.; et al. PIK3CA and PTEN gene and exon mutation-specific clinicopathologic and molecular associations in colorectal cancer. Clin. Cancer Res. 2013, 19, 3285–3296. [Google Scholar] [CrossRef] [Green Version]
  77. Simi, L.; Pratesi, N.; Vignoli, M.; Sestini, R.; Cianchi, F.; Valanzano, R.; Nobili, S.; Mini, E.; Pazzagli, M.; Orlando, C. High-resolution melting analysis for rapid detection of KRAS, BRAF, and PIK3CA gene mutations in colorectal cancer. Am. J. Clin. Pathol. 2008, 130, 247–253. [Google Scholar] [CrossRef] [Green Version]
  78. Whitehall, V.L.; Rickman, C.; Bond, C.E.; Ramsnes, I.; Greco, S.A.; Umapathy, A.; McKeone, D.; Faleiro, R.J.; Buttenshaw, R.L.; Worthley, D.L.; et al. Oncogenic PIK3CA mutations in colorectal cancers and polyps. Int. J. Cancer 2012, 131, 813–820. [Google Scholar] [CrossRef]
  79. Rosty, C.; Young, J.P.; Walsh, M.D.; Clendenning, M.; Sanderson, K.; Walters, R.J.; Parry, S.; Jenkins, M.A.; Win, A.K.; Southey, M.C.; et al. PIK3CA activating mutation in colorectal carcinoma: Associations with molecular features and survival. PLoS ONE 2013, 8, e65479. [Google Scholar] [CrossRef] [Green Version]
  80. Jing, J.; Greshock, J.; Holbrook, J.D.; Gilmartin, A.; Zhang, X.; McNeil, E.; Conway, T.; Moy, C.; Laquerre, S.; Bachman, K.; et al. Comprehensive predictive biomarker analysis for MEK inhibitor GSK1120212. Mol. Cancer Ther. 2012, 11, 720–729. [Google Scholar] [CrossRef] [Green Version]
  81. Tian, S.; Simon, I.; Moreno, V.; Roepman, P.; Tabernero, J.; Snel, M.; van’t Veer, L.; Salazar, R.; Bernards, R.; Capella, G. A combined oncogenic pathway signature of BRAF, KRAS and PI3KCA mutation improves colorectal cancer classification and cetuximab treatment prediction. Gut 2013, 62, 540–549. [Google Scholar] [CrossRef] [PubMed]
  82. Sartore-Bianchi, A.; Martini, M.; Molinari, F.; Veronese, S.; Nichelatti, M.; Artale, S.; Di Nicolantonio, F.; Saletti, P.; De Dosso, S.; Mazzucchelli, L.; et al. PIK3CA mutations in colorectal cancer are associated with clinical resistance to EGFR-targeted monoclonal antibodies. Cancer Res. 2009, 69, 1851–1857. [Google Scholar] [CrossRef] [PubMed] [Green Version]
  83. Prenen, H.; De Schutter, J.; Jacobs, B.; De Roock, W.; Biesmans, B.; Claes, B.; Lambrechts, D.; Van Cutsem, E.; Tejpar, S. PIK3CA mutations are not a major determinant of resistance to the epidermal growth factor receptor inhibitor cetuximab in metastatic colorectal cancer. Clin. Cancer Res. 2009, 15, 3184–3188. [Google Scholar] [CrossRef] [PubMed] [Green Version]
  84. Jhawer, M.; Goel, S.; Wilson, A.J.; Montagna, C.; Ling, Y.H.; Byun, D.S.; Nasser, S.; Arango, D.; Shin, J.; Klampfer, L.; et al. PIK3CA mutation/PTEN expression status predicts response of colon cancer cells to the epidermal growth factor receptor inhibitor cetuximab. Cancer Res. 2008, 68, 1953–1961. [Google Scholar] [CrossRef]
  85. Perrone, F.; Lampis, A.; Orsenigo, M.; Di Bartolomeo, M.; Gevorgyan, A.; Losa, M.; Frattini, M.; Riva, C.; Andreola, S.; Bajetta, E.; et al. PI3KCA/PTEN deregulation contributes to impaired responses to cetuximab in metastatic colorectal cancer patients. Ann. Oncol. 2009, 20, 84–90. [Google Scholar] [CrossRef]
  86. Ogino, S.; Nosho, K.; Kirkner, G.J.; Shima, K.; Irahara, N.; Kure, S.; Chan, A.T.; Engelman, J.A.; Kraft, P.; Cantley, L.C.; et al. PIK3CA mutation is associated with poor prognosis among patients with curatively resected colon cancer. J. Clin. Oncol. 2009, 27, 1477–1484. [Google Scholar] [CrossRef]
  87. Burgenske, D.M.; Monsma, D.J.; Dylewski, D.; Scott, S.B.; Sayfie, A.D.; Kim, D.G.; Luchtefeld, M.; Martin, K.R.; Stephenson, P.; Hostetter, G.; et al. Establishment of genetically diverse patient-derived xenografts of colorectal cancer. Am. J. Cancer Res. 2014, 4, 824–837. [Google Scholar]
  88. Oh, B.Y.; Lee, W.Y.; Jung, S.; Hong, H.K.; Nam, D.H.; Park, Y.A.; Huh, J.W.; Yun, S.H.; Kim, H.C.; Chun, H.K.; et al. Correlation between tumor engraftment in patient-derived xenograft models and clinical outcomes in colorectal cancer patients. Oncotarget 2015, 6, 16059–16068. [Google Scholar] [CrossRef] [Green Version]
  89. Penna, I.; Molla, A.; Grazia, G.; Cleris, L.; Nicolini, G.; Perrone, F.; Picciani, B.; Del Vecchio, M.; de Braud, F.; Mortarini, R.; et al. Primary cross-resistance to BRAFV600E-, MEK1/2- and PI3K/mTOR-specific inhibitors in BRAF-mutant melanoma cells counteracted by dual pathway blockade. Oncotarget 2016, 7, 3947–3965. [Google Scholar] [CrossRef] [Green Version]
  90. Kaletsch, A.; Pinkerneil, M.; Hoffmann, M.J.; Jaguva Vasudevan, A.A.; Wang, C.; Hansen, F.K.; Wiek, C.; Hanenberg, H.; Gertzen, C.; Gohlke, H.; et al. Effects of novel HDAC inhibitors on urothelial carcinoma cells. Clin. Epigenetics 2018, 10, 100. [Google Scholar] [CrossRef] [Green Version]
  91. Qian, Y.; Peng, K.; Qiu, C.; Skibba, M.; Huang, Y.; Xu, Z.; Zhang, Y.; Hu, J.; Liang, D.; Zou, C.; et al. Novel Epidermal Growth Factor Receptor Inhibitor Attenuates Angiotensin II-Induced Kidney Fibrosis. J. Pharmacol. Exp. Ther. 2016, 356, 32–42. [Google Scholar] [CrossRef] [PubMed] [Green Version]
Figure 1. Genomic characterization of colorectal cancer (CRC) patient-derived xenografts (PDXs) and expression of epidermal growth factor receptor (EGFR) ligands. (A) Schematic overview of the analytical workflow used in the study to evaluate therapeutic efficacy. (B) A characteristic profile of the associated clinical information and genetic abnormalities of 51 patients with CRC (left panel) and distribution of cases according to the tumor site (right panel, upper) and prevalence of KRAS proto-oncogene GTPase (KRAS) mutations (right panel, lower) in our CRC PDX panel.
Ijms 20 05894 g001
Figure 2. Percent distribution of ligand expression levels in 51 colorectal cancer (CRC) patient-derived xenografts (PDXs). (A) Percent ligand expression levels for EGF, HB-EGF, TGF-α, BTC, AREG epidermal growth factor (EGF), heparin-binding EGF-like growth factor (HB-EGF), transforming growth factor α (TGF-α), betacellulin (BTC), amphiregulin (AREG) and epiregulin (EREG) in 51 individual CRC PDXs as determined by ELISA. (B) Proportion of high- and low-affinity EGFR ligands in CRC PDX models according to their KRAS status. The graph shows the mean and standard error of the mean (SEM). * p < 0.05. (C) High/low-affinity ligand expression ratios in 51 individual CRC PDX models. (D) High/low-affinity ligand ratio in CRC PDX models according to their KRAS status. The graph shows the mean and SEM. * p < 0.05.
Ijms 20 05894 g002
Figure 3. Antitumor activity of GC1118 against both KRAS-wild-type and mutant colorectal cancer (CRC) patient-derived xenografts (PDXs). (A) Tumor growth after GC1118 or cetuximab treatment in six individual CRC PDXs. * p < 0.05, ** p < 0.01, *** p < 0.001. (B) Representative images of immunohistochemistry (IHC) detection of AKT and ERK signaling activity in six individual CRC PDXs. (C) Quantification of AKT and ERK activity, as measured by IHC. The results in the bar graph are shown as the means and standard error of means (SEM). Statistical significance is summarized in Table S3.
Ijms 20 05894 g003
Figure 4. Correlation analysis of the inhibitory effects of GC1118 and basal signaling activity level in a colorectal cancer (CRC) patient-derived xenograft (PDX) model. (A) Basal activity levels of EGFR, AKT, and ERK1/2 pathways based on western blotting using tumor xenografts from each CRC PDX model. The tumor samples were isolated when the tumor xenografts reached 200 mm3. For quantification, images were acquired and signal intensity of each protein band was quantified using the ImageJ software (NIH, Bethesda, MD, USA) and normalized to β-actin. The activities of EGFR, AKT, and ERK1/2 were determined by normalization with their total pairs, namely pEGFR/EGFR, pAKT/AKT, and pERK1/2/ERK1/2, respectively (B) Pearson’s correlation analysis was performed to analyze the correlation between EGFR, AKT, and ERK1/2 activities (X-axis) and the tumor growth inhibition index (TGII, Y-axis) in six CRC PDXs.
Ijms 20 05894 g004
Figure 5. Antitumor activity of GC1118 and BEZ-235 in the colorectal cancer (CRC)-024T patient-derived xenograft (PDX) model. (A) Tumor growth after individual or combined GC1118 and BEZ-235 treatment in the CRC-024T PDX model. The results in the graph are shown as means and standard errors of means (SEM). * p < 0.05, ** p < 0.01. (B) Mouse body weight during the course of the in vivo study at indicated time points. Error bars represent SEM. (C) Analysis of signaling pathways based on immunohistochemistry (IHC) detection of AKT and ERK1/2 signaling activities in the CRC-024T PDX model after treatment with GC1118 and BEZ-235. The results in the graph are shown as the mean and SEM. The values indicating the statistical significance between each group based on a T-test were described in Table S4. (D) Representative IHC images of AKT and ERK1/2 signaling activities in the CRC-024T PDX model treated with GC1118 and BEZ-235. (E) Analysis of signaling pathways by immunoblotting for AKT and ERK1/2 signaling activities in the CRC-024T PDX model treated with GC1118 and BEZ-235. For quantification, images were acquired and signal intensity of each protein band was quantified using the ImageJ software (NIH, Bethesda, MD, USA) and normalized to β-actin. The activities of EGFR, AKT, and ERK1/2 were determined by normalization with their total pairs, namely phospho-EGFR/EGFR, phospho-AKT/AKT, and phospho-ERK1/2/ERK1/2, respectively. The results in the graph are shown as SEM. The significant difference between vehicle and each treatment group is indicated. * p < 0.05, ** p < 0.01, *** p < 0.001.
Ijms 20 05894 g005
Figure 6. Our hypothesis of the mechanisms underlying the inhibitory effects of GC1118 on colorectal cancer (CRC) with KRAS mutations and circumventing resistance to GC1118 by combining this drug with PI3K/mTOR/AKT inhibitors (BEZ-235 in this study) in KRAS-mutated CRCs with persistently activated PI3K/mTOR/AKT signaling.
Ijms 20 05894 g006

