Article

RNA-Seq-Based Comparative Transcriptome Analysis Highlights New Features of the Heat-Stress Response in the Extremophilic Bacterium Deinococcus radiodurans

1
Biotechnology Research Institute, Chinese Academy of Agricultural Sciences, Beijing 100081, China
2
Microbial Processes and Interactions (MiPI), TERRA Teaching and Research Centre, Gembloux Agro-Bio Tech, University of Liège, 5030 Gembloux, Belgium
3
School of Food and Pharmaceutical Engineering, Nanjing Normal University, Nanjing 210023, China
4
Department of Plant Science, School of Agriculture and Biology, Shanghai Jiao Tong University, Shanghai 200240, China
5
College of Life Science and Engineering, Southwest University of Science and Technology, Mianyang 621000, China
*
Authors to whom correspondence should be addressed.
Int. J. Mol. Sci. 2019, 20(22), 5603; https://doi.org/10.3390/ijms20225603
Submission received: 5 September 2019 / Revised: 31 October 2019 / Accepted: 7 November 2019 / Published: 9 November 2019
(This article belongs to the Section Molecular Microbiology)

Abstract

:
Deinococcus radiodurans is best known for its extraordinary resistance to diverse environmental stress factors, such as ionizing radiation, ultraviolet (UV) irradiation, desiccation, oxidation, and high temperatures. The heat response of this bacterium is considered to be due to a classical, stress-induced regulatory system that is characterized by extensive transcriptional reprogramming. In this study, we investigated the key functional genes involved in heat stress that were expressed and accumulated in cells (R48) following heat treatment at 48 °C for 2 h. Considering that protein degradation is a time-consuming bioprocess, we predicted that to maintain cellular homeostasis, the expression of the key functional proteins would be significantly decreased in cells (RH) that had partly recovered from heat stress relative to their expression in cells (R30) grown under control conditions. Comparative transcriptomics identified 15 genes that were significantly downregulated in RH relative to R30, seven of which had previously been characterized to be heat shock proteins. Among these genes, three hypothetical genes (dr_0127, dr_1083, and dr_1325) are highly likely to be involved in response to heat stress. Survival analysis of mutant strains lacking DR_0127 (a DNA-binding protein), DR_1325 (an endopeptidase-like protein), and DR_1083 (a hypothetical protein) showed a reduction in heat tolerance compared to the wild-type strain. These results suggest that DR_0127, DR_1083, and DR_1325 might play roles in the heat stress response. Overall, the results of this study provide deeper insights into the transcriptional regulation of the heat response in D. radiodurans.

1. Introduction

Deinococcus radiodurans (D. radiodurans) is a nonmotile, pink-pigmented, Gram-positive bacterium belonging to the Deinococcus-Thermus phylum. This bacterium was first isolated from gamma-irradiated canned meat and is best known for its extraordinary resistance to ionizing and ultraviolet (UV) irradiation [1,2]. Previous studies have reported that this species presents a rapid response and adaptation to a wide variety of extreme environments and stresses, such as desiccation [3], hydrogen peroxide [4], heat [5], and other abiotic stresses. The rapid adaption of D. radiodurans is accompanied by a powerful DNA repair ability and extreme stress resistance. Hence, this species has become an ideal model organism for studying bacterial tolerance mechanisms under various extreme stress conditions [6,7].
One of the earliest studies conducted on heat stress in D. radiodurans suggested that proteins synthesized de novo during the incubation interval were involved in either the appearance of thermotolerance or in the recovery from injury induced by heating at 52 °C for 30 min [8]. In a later work, sigma factors (sig1 and sig2) were identified as being involved in the active response of D. radiodurans to high-temperature stress. The sig1 gene was identified as essential for the induction of the heat shock proteins GroESL and DnaKJ, whereas a sig2 mutant exhibited only modest deficiencies in DnaKJ production [9,10]. The global negative regulator encoded by dr_0934 (HspR) binds to HspR-associated inverted repeat (HAIR) sites in close proximity to promoter regions, thereby directly inhibiting the expression of regulated genes encoding chaperone proteins and protease [11]. 2D-PAGE and global whole-cell Fourier transform ion cyclotron resonance mass spectrometric (FTICR-MS) proteomics have been widely employed to identify the molecular mechanisms underlying the heat tolerance of D. radiodurans at the proteomics level. The majority of the highly-induced heat shock proteins were identified by matrix-assisted laser sesorption/ionization mass spectrometry (MALDI-MS) [12,13]. The results of a more recent report investigating the DNA repair capacity and membrane integrity of D. radiodurans under dry and wet heat suggest that DNA damage repair (e.g., DNA double-strand breaks by recA and pprA) is essential after treatment with wet or dry heat [14]. Two small heat shock proteins (sHsps) identified in Escherichia coil, IbpA and IbpB, were analyzed in D. radiodurans, with subsequent analyses showing that these two proteins were very different in their quaternary structures and chaperone properties and were considered to represent a second type of bacterial two-component sHsp system [15]. Recently, DdrI (encoded by dr_0997) has been reported to be involved in the heat shock response [16].
Heat treatment has been reported to result in protein unfolding and aggregation in microbes [17,18,19]. Accordingly, microorganisms have evolved complex molecular mechanisms to mitigate heat stress [17,18,20,21]. Previous studies have shown that bacteria display both common and unique changes in their gene expression profiles in response to temperature fluctuations in their surrounding microenvironments [22,23,24]. Most heat stress-induced genes encode molecular chaperones or proteases that either protect proteins/enzymes from misfolding or accelerate the degradation of damaged proteins. These processes lead to changes in the cell wall/membrane composition, protein synthesis rates, energy metabolism, and other biological processes, thereby maintaining internal cell homeostasis [18,19,21,25,26,27]. The use of RNA sequencing (RNA-Seq) allowed Chan et al. (2016) and Gomide et al. (2018) to identify many unanticipated genes associated with heat tolerance in Pseudomonas aeruginosa and Corynebacterium pseudotuberculosis following heat shock [28,29].
Although much effort has been put into elucidating the molecular mechanisms underlying the response of D. radiodurans to heat stress, gene expression in D. radiodurans during heat stress is complex and not fully understood. However, due to the rapid development of sequencing technologies and bioinformatic analysis, many novel functional genes have been identified in D. radiodurans under a variety of stresses [30,31,32]. RNA-Seq has been successfully used to determine the deep transcriptional profiles of a complete genome in specific environments [33,34,35]. In this study, we utilized an RNA-Seq-based technique to examine the changes in the transcriptome of D. radiodurans in response to heat stress. Under heat stress, heat-related proteins are highly expressed to cope with cell metabolism and protein changes. When the external environment is restored to conditions that suitable for growth, a large amount of heat stress-related proteins will accumulate. Considering that degradation of these protein is a time-consuming bioprocess, we predicted that to maintain cellular homeostasis, the expression of key functional proteins would be significantly decreased in cells (RH) that had partly recovered from heat stress relative to their expression in cells (R30) grown under control conditions. Through this analysis, we identified many of the classical heat shock genes, the expressions of which were significantly increased in response to elevated temperature. In addition, our results show that three hypothetical genes (dr_0127, dr_1083, and dr_1325) might play important roles in the heat stress adaptation through mechanisms that require future study. The results of this study provide insight into the transcriptional regulation of the heat tolerance in D. radiodurans.

2. Results

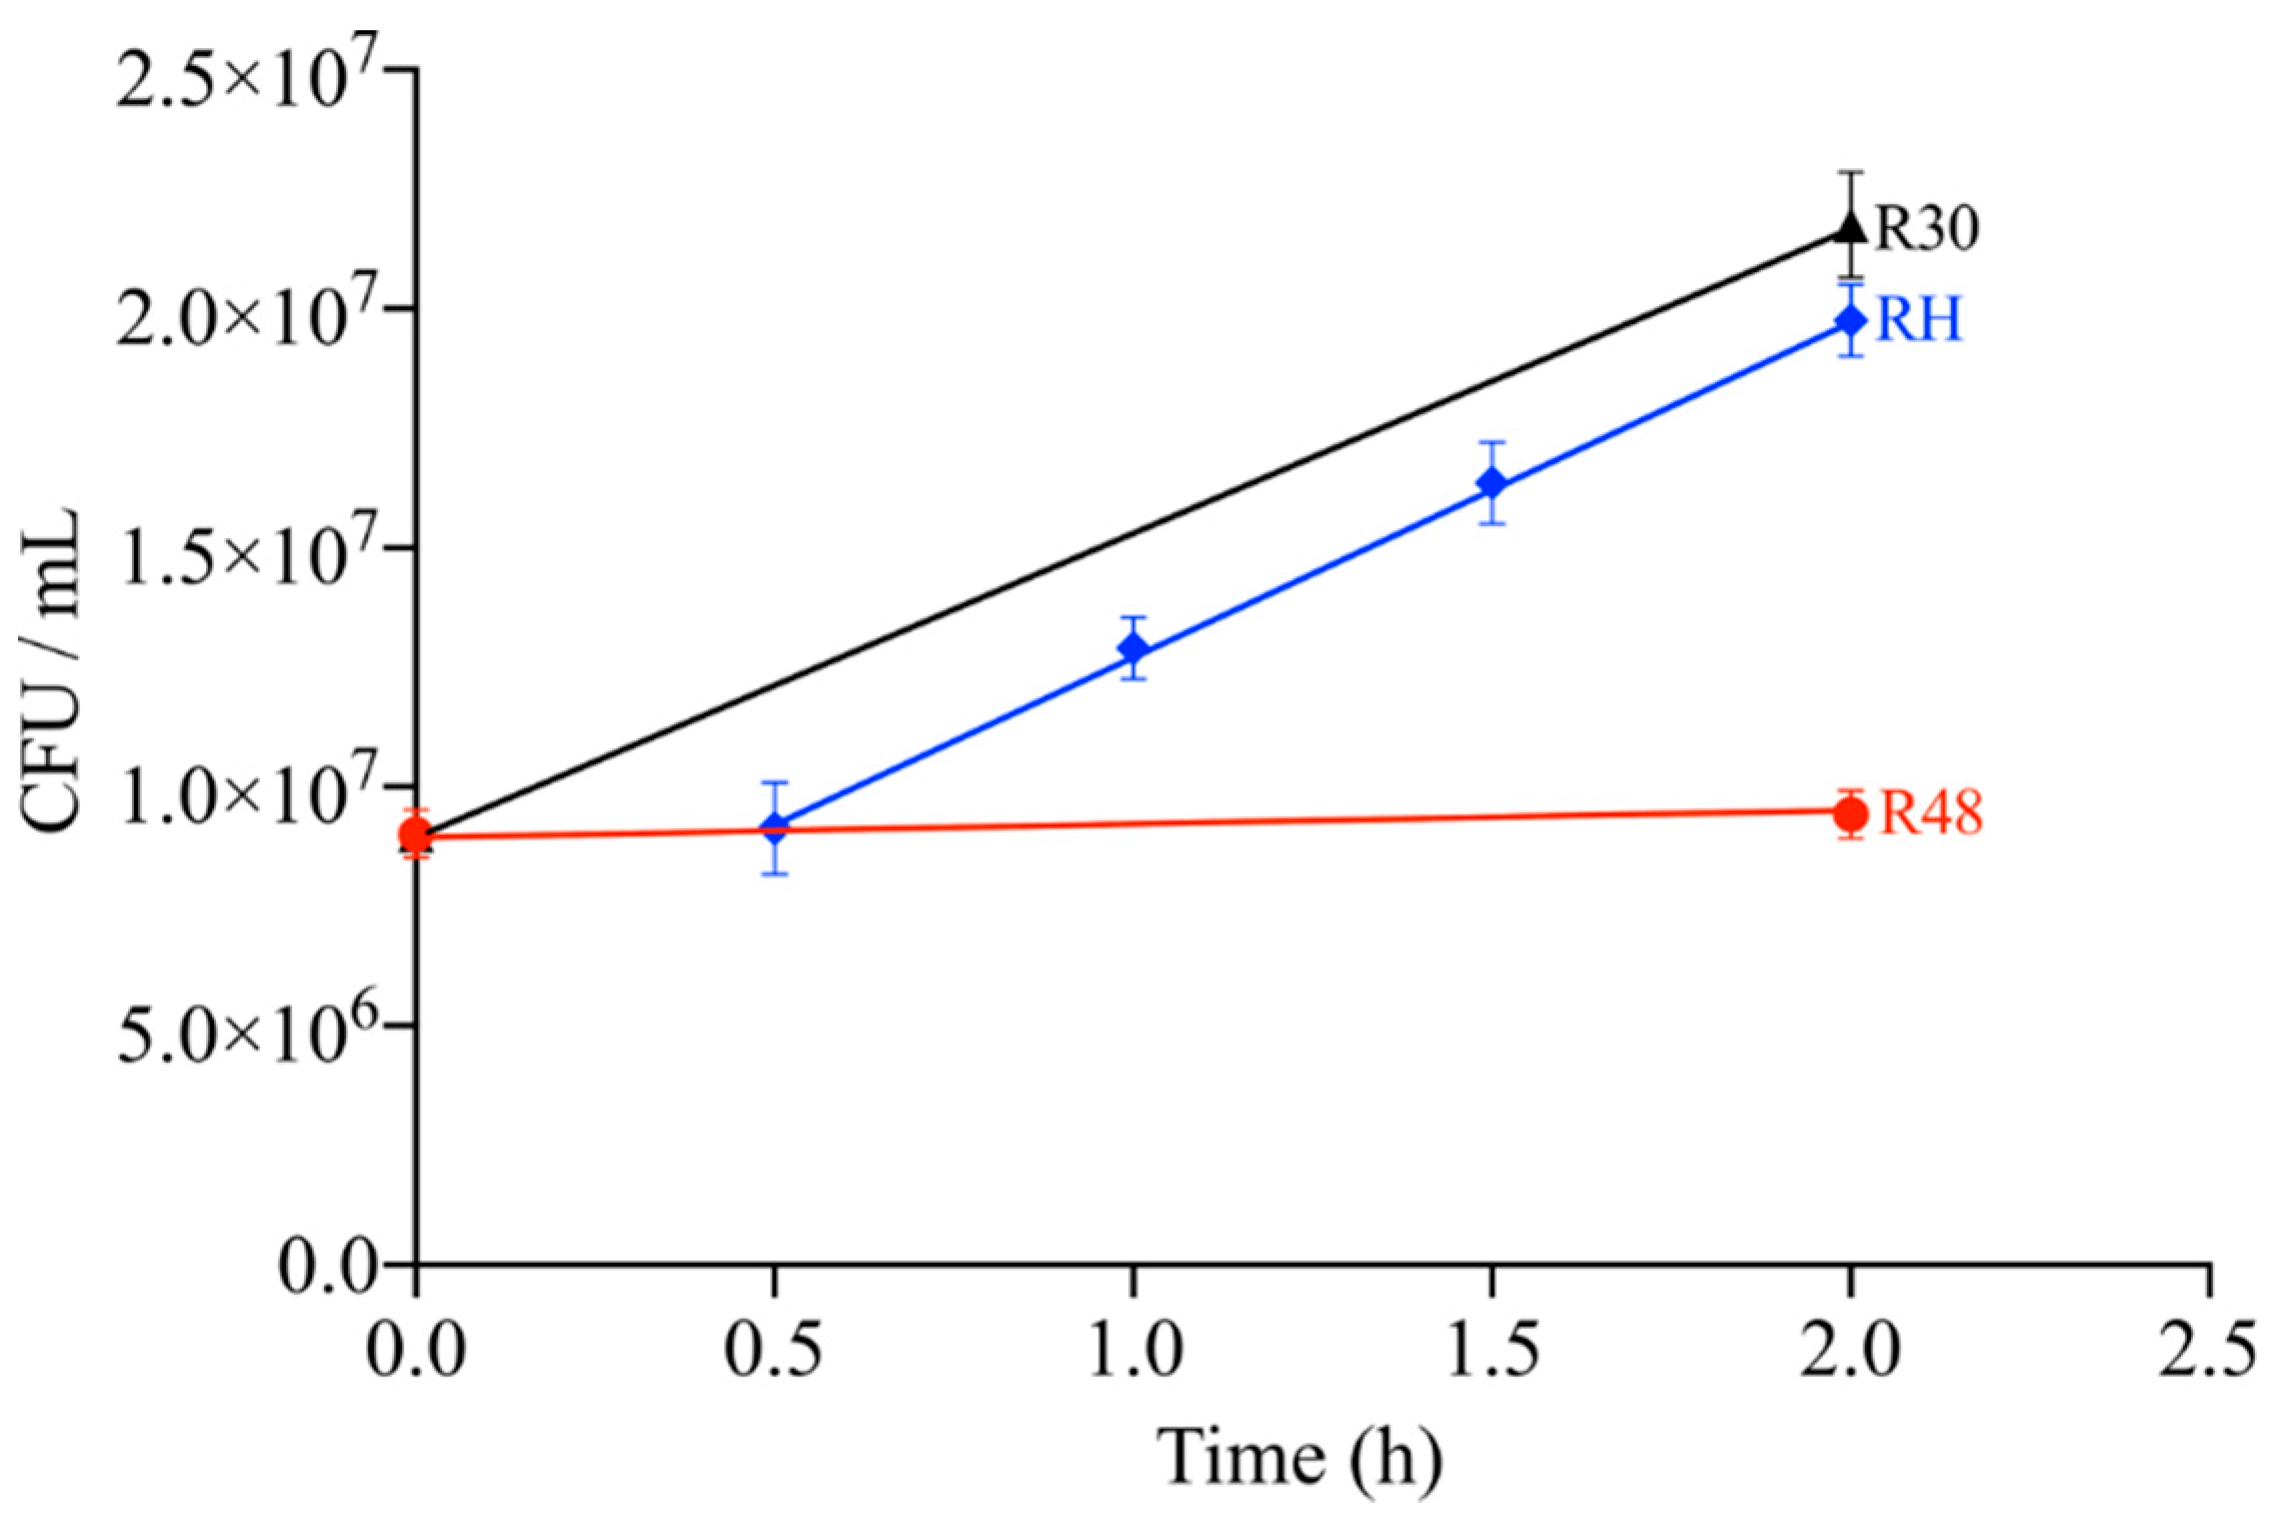
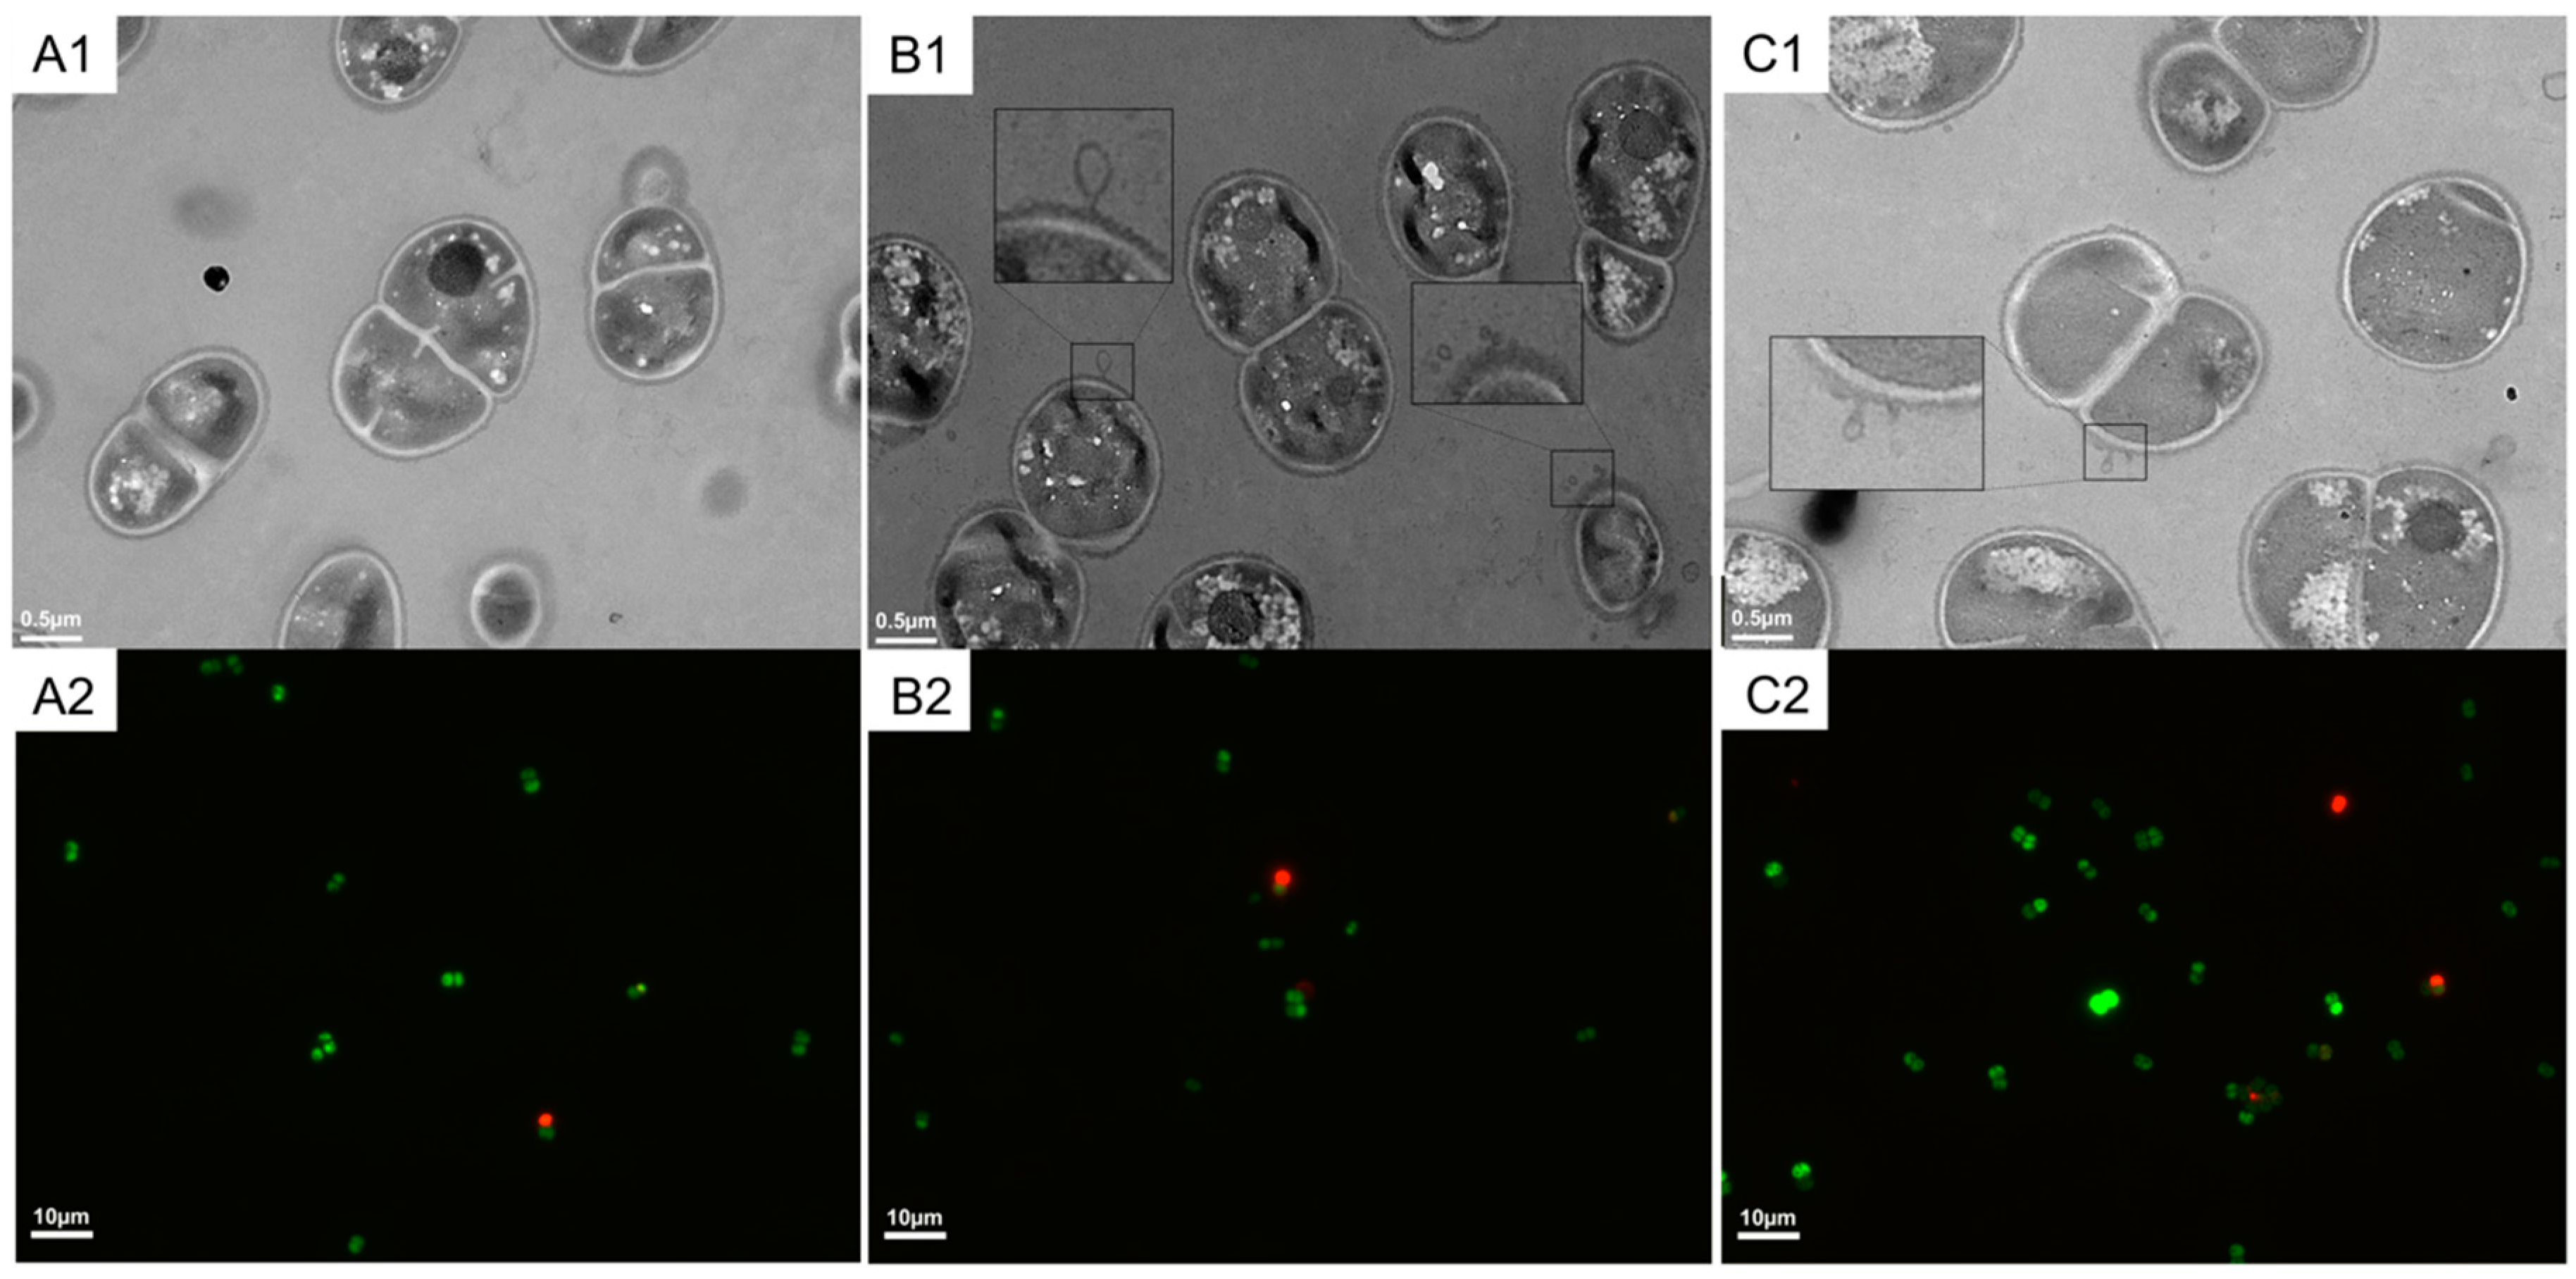
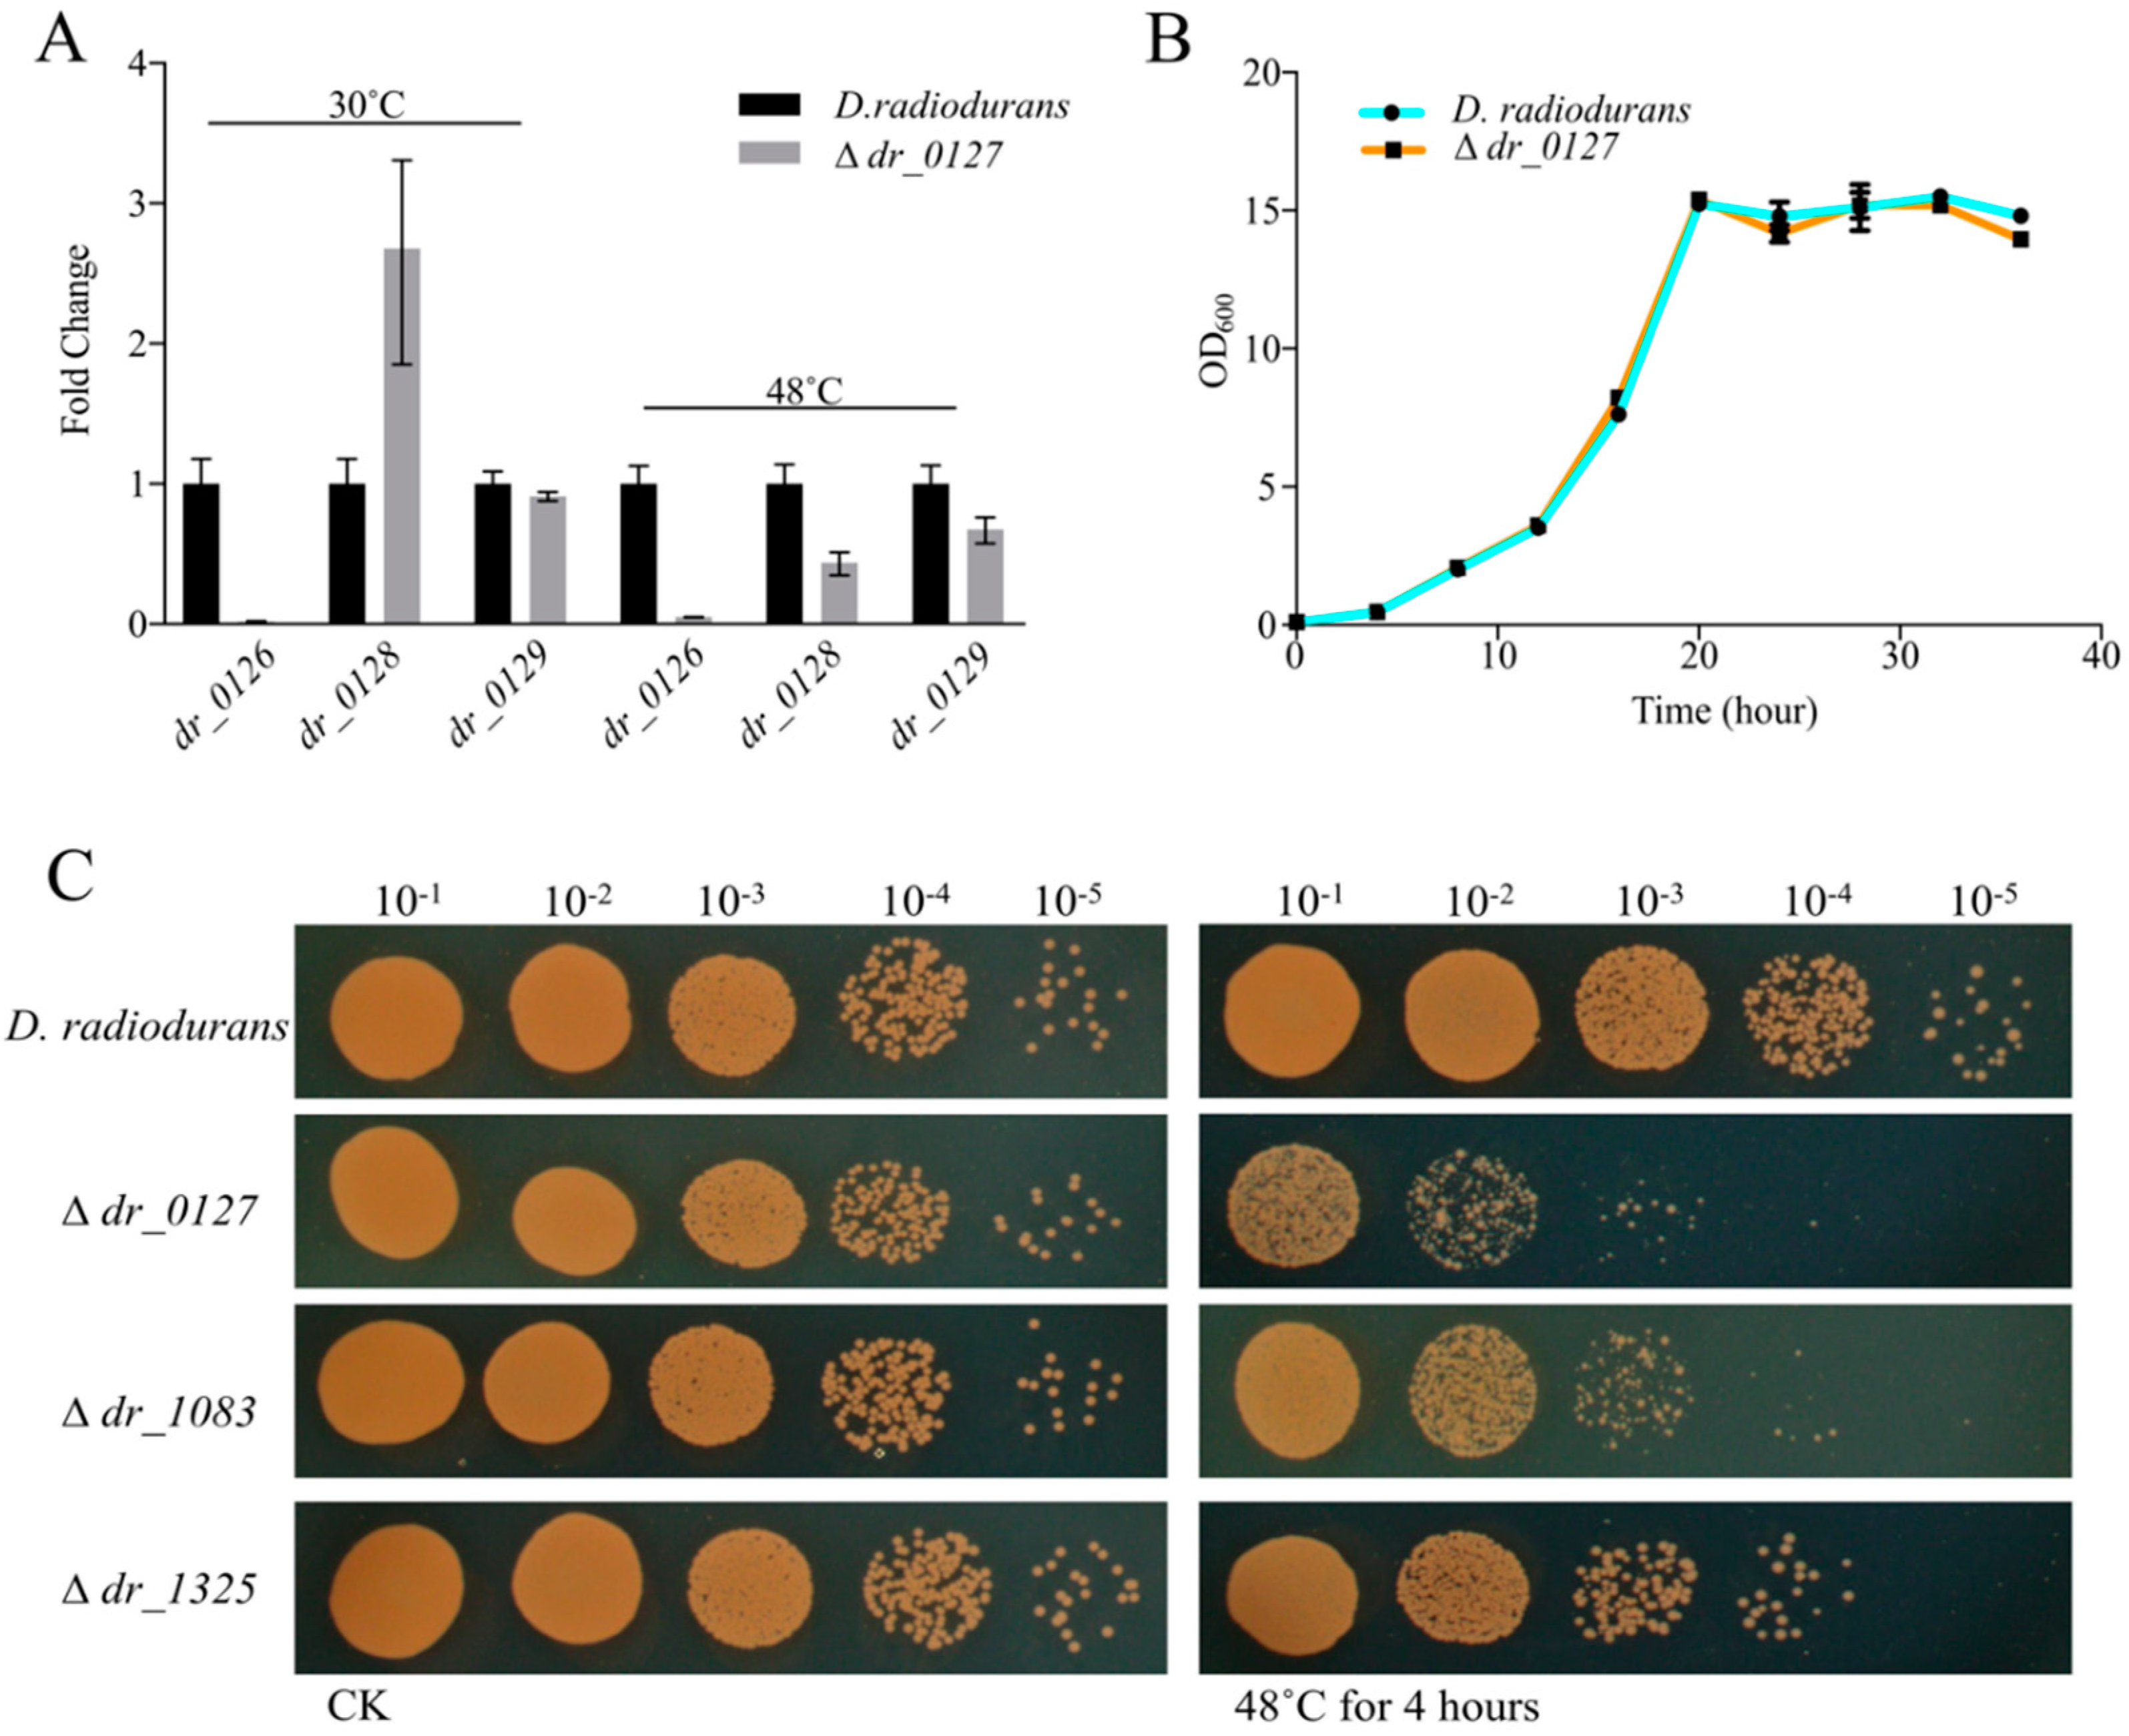
2.1. Cell Growth State and Viability of D. radiodurans under Heat Stress

In order to investigat the mechanism of adaptation to heat stress of D. radiodurans, we used a series of recovery times (0, 0.5, 1, 1.5, and 2 h) for growth at 30 °C following incubation at 48 °C. This series allowed us to determine the time necessary for the cells to return to their initial growth state after the heat stress treatment. We found that after 2 h of cell recovery, the growth viability according to the cell number was essentially the same as that of R30 subjected to continuous culture for 2 h (Figure 1).
Because heat stress may affect the integrity of D. radiodurans, we used transmission electron microscopy (TEM) to observe the morphology of D. radiodurans cells. As shown in Figure 2A1,B1, the ultrastructure of cells incubated at 48 °C (R48) was different compared to R30, and R48 exhibited some visible damages in some parts of the envelope. After a further culture at 30 °C for 2 h, the cell envelope remained slightly damaged (Figure 2C1), but to a lower extent that before recovery, indicating that D. radiodurans cells underwent some efficient repair mechanisms. These results show that heat stress may affects the structure of the bacterial cell wall but it is rather limited, having no significant effect on cell death, as revealed by fluorescence microscopy (Figure 2A2,B2,C2) showing that almost all cells remained alive.

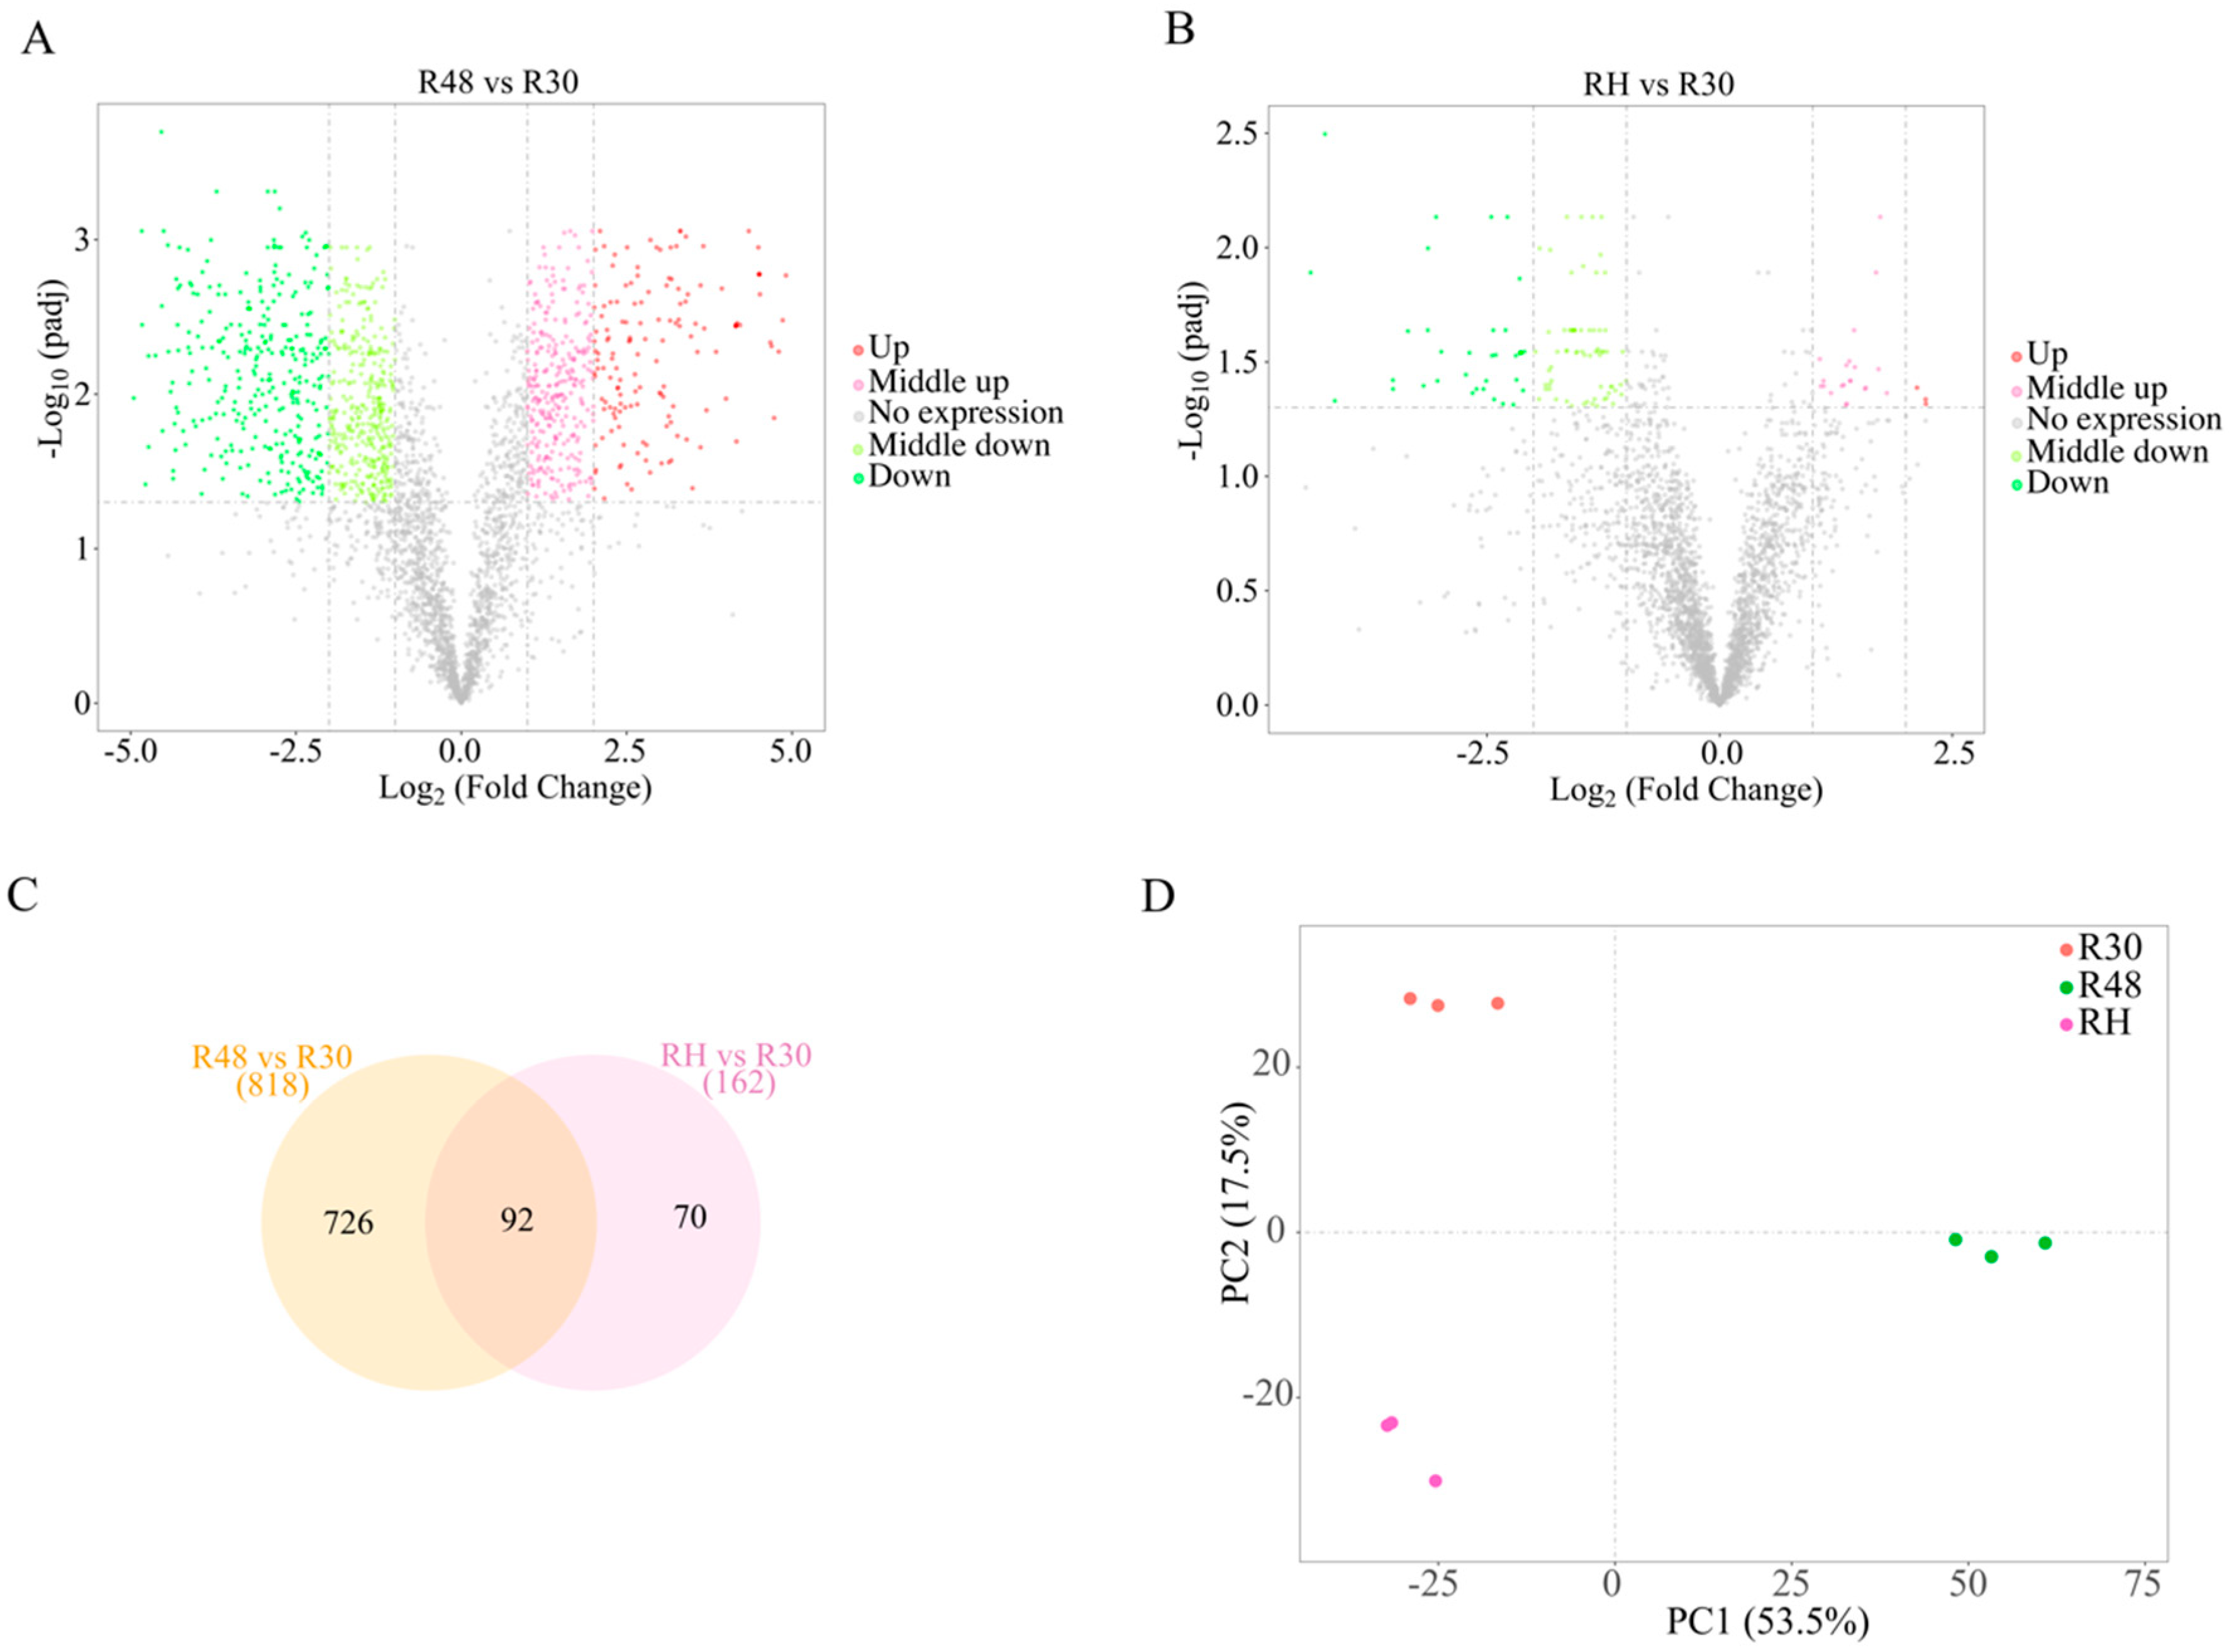
2.2. Qualitative and Quantitative Analyses of the Differentially Expressed Genes (DEGs) in the Three Groups under Heat Stress

The phenotypic results presented above showed that the growth state of heat-treated cells almost reached that of the untreated cells after recovery for 2 h. We expected that a transcriptional analysis of these samples would provide a deeper understanding of the mechanisms responsible for adaptation of D. radiodurans to high temperature. Several DEGs representing different functional categories were selected for quantitative real-time PCR (qRT-PCR) analysis (Supplementary Figure S1). The expression profiles of the selected genes showed the same tendencies as those detected by RNA-Seq, indicating the good quality of the sequencing data.
DEG analysis after fragments per kilobase of transcript per million mapped reads (FPKM) normalization yielded 818 and 162 genes with significantly different expression levels (FDR-corrected p < 0.05, ≥ 1.5 log2-fold change) in the pairwise comparisons of R48 versus R30 and RH versus R30 (Figure 3A,B; Supplementary Table S1). Among these genes, 316 were upregulated and 502 were downregulated (R48 versus R30) and 28 were upregulated and 134 were downregulated (RH versus R30). As shown in the Venn diagram (Figure 3C), 124 and 23 DEGs were unique to the pairwise comparisons of R48 versus R30 and RH versus R30. While investigating the gene expression of D. radiodurans, three replicates of R30, R48, and RH were used to create three distinct clusters via principal component analysis of the samples (Figure 3D). These data indicate that the DEGs have a very consistent and unique expression profile.
Regarding these significantly DEGs in response to heat stress, Table 1 presents a list of the top 30 most significantly up and downregulated-genes (R48 versus R30). Interestingly, we identified highly expressed genes (dr_A0075-A0087) with unknown functions. These genes are transcribed in the same transcription direction, and we hypothesized that they may be in the same operon and work together to cope with heat stress. In addition, some heat-induced genes that were reported in previous studies were also identified in our study (Table 1). We also identified many previously unreported genes that may be involved in this heat stress adaptation and wanted to further investigate the roles of these genes in the heat shock response.

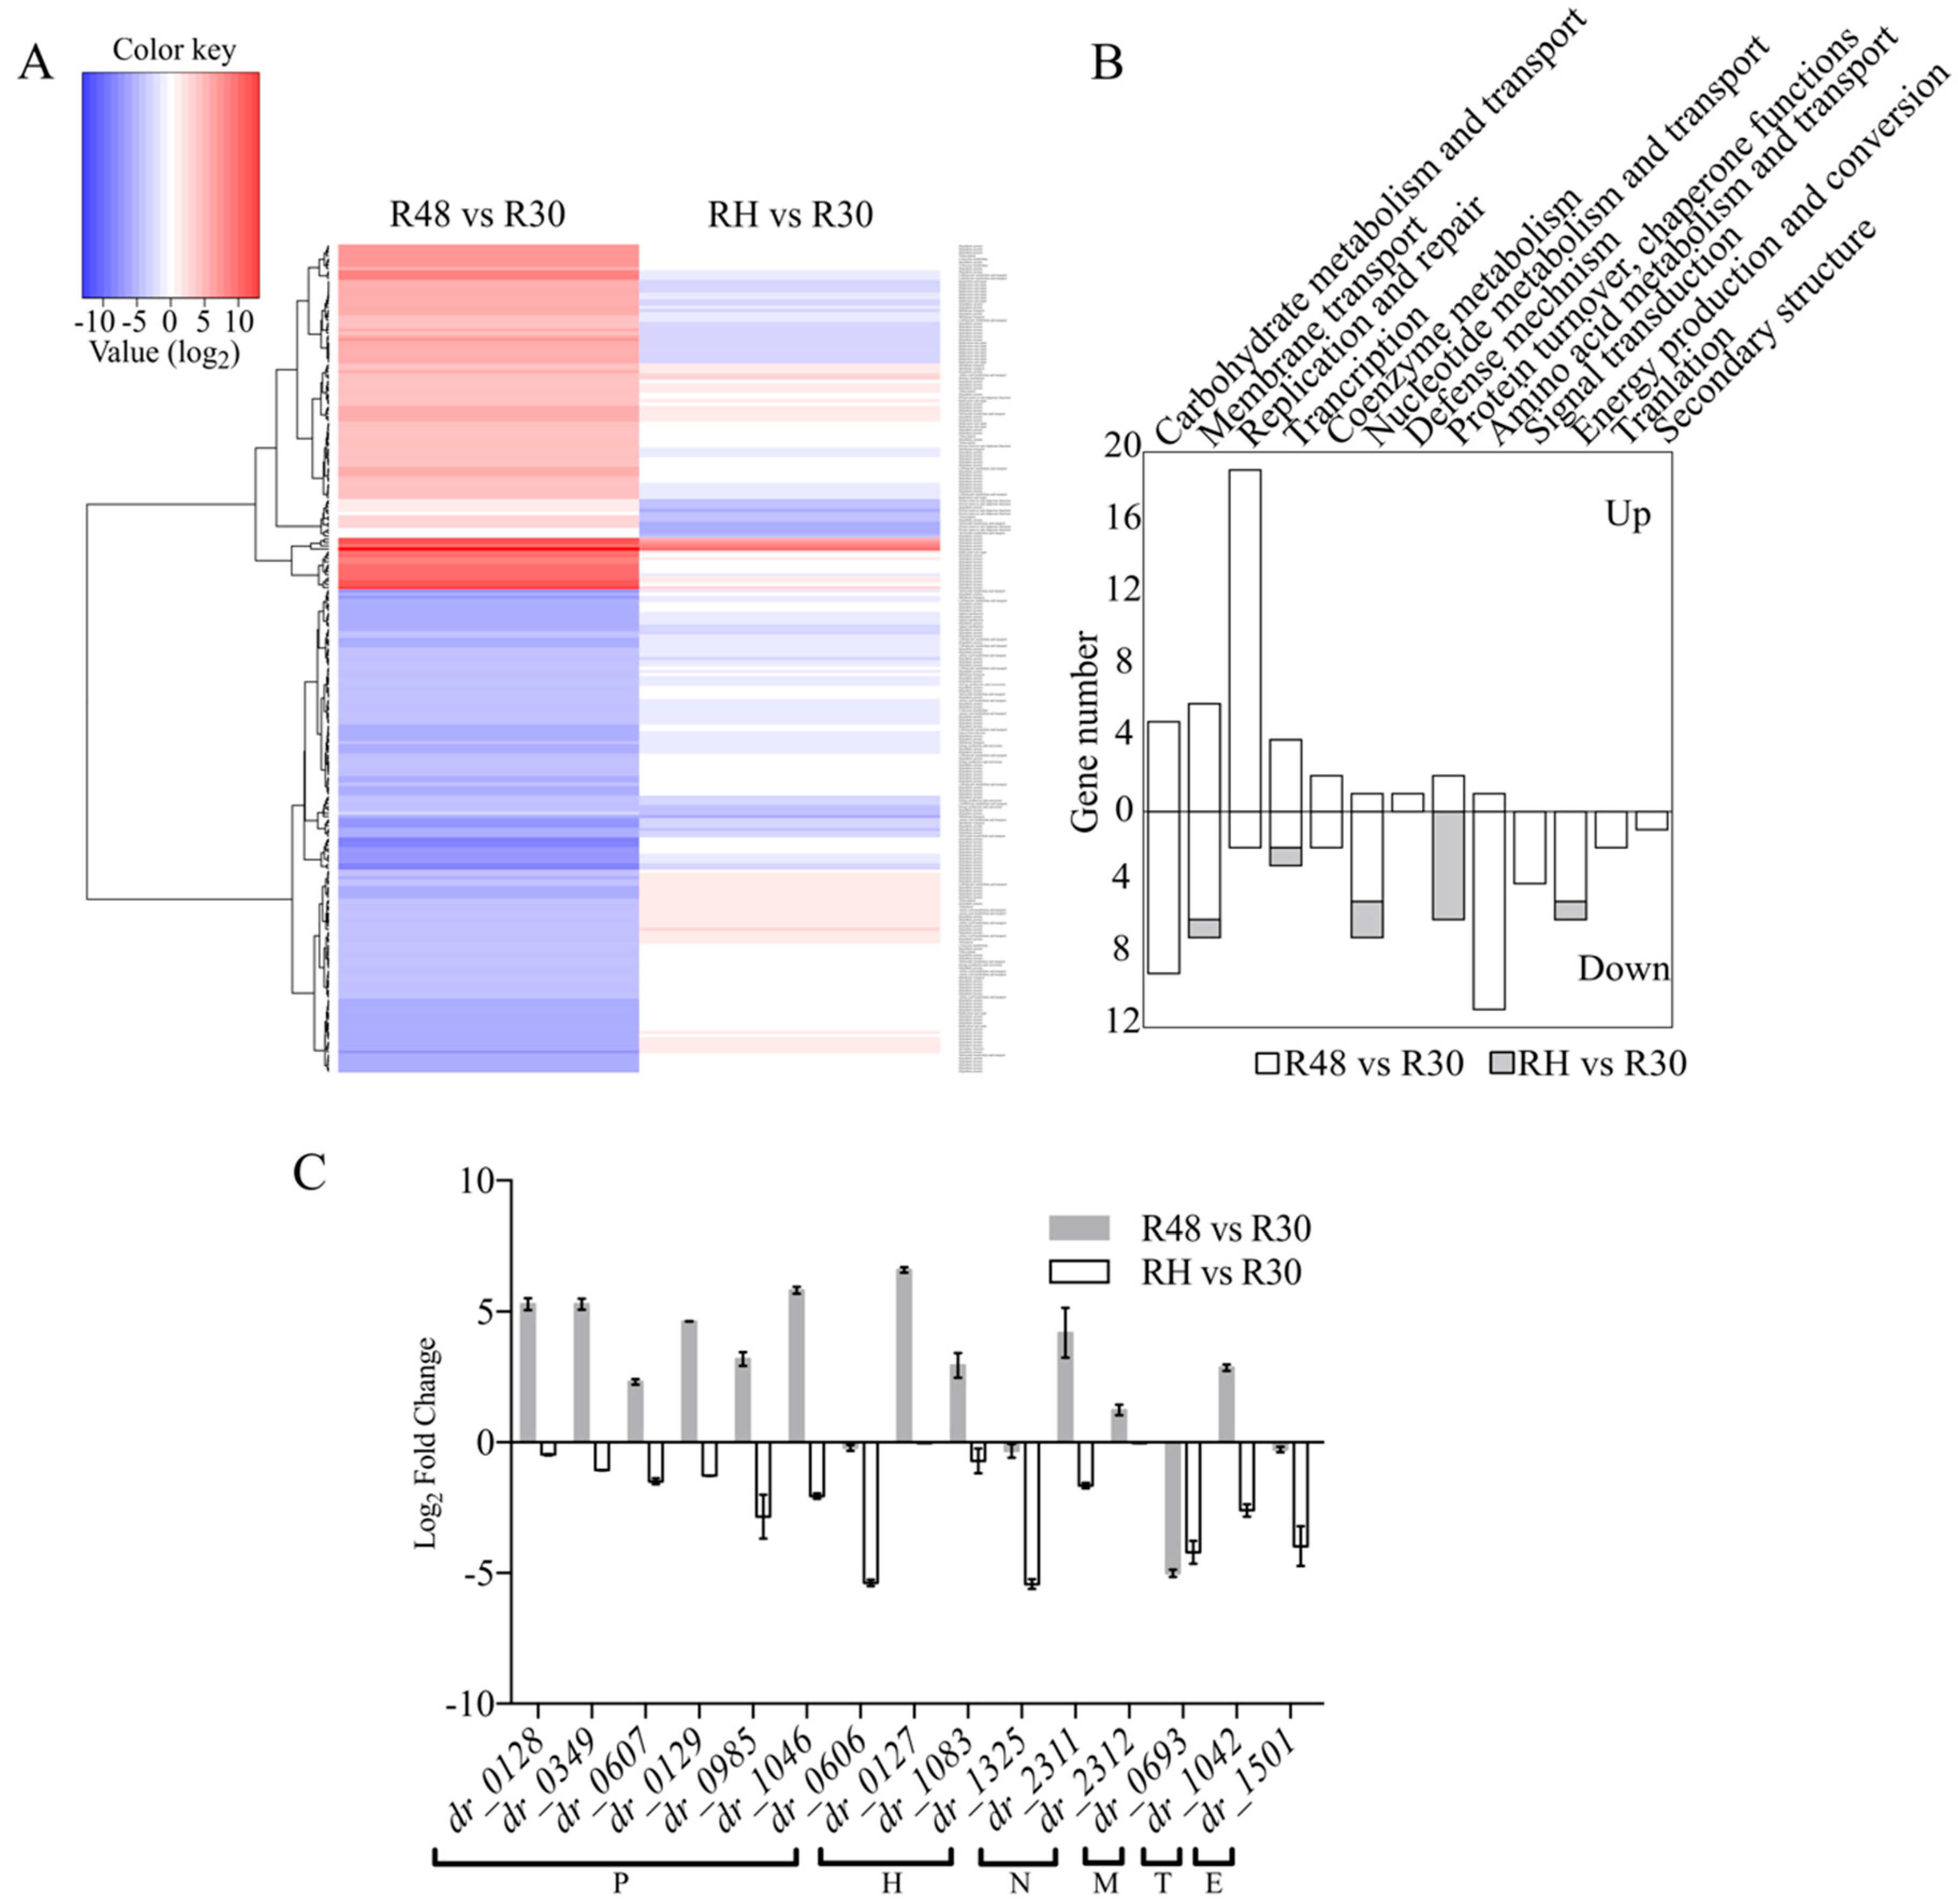
2.3. Gene Ontology (GO) and Kyoto Encyclopedia of Gene and Genomes (KEGG) Analyses of the DEGs

To determine the functions of the DEGs, all of the DEGs were annotated to terms in the GO database. The most dominant subcategories were “oxidation-reduction process,” “cell,” “peptidase activity,” “cell part,” and “oxidoreductase activity” (Supplementary Figure S2; Supplementary Table S2). The top 20 most significantly enriched KEGG pathways identified via KEGG analysis are shown in Supplementary Figure S3. Several key molecular mechanisms are represented, including nitrogen metabolism, pyruvate metabolism, glycolysis, ribosome, oxidative phosphorylation, and propanoate metabolism. These results reveal that cells utilize numerous repair processes in response to high temperature.

2.4. Analysis of Heat-Related Genes with over Eight-Fold Higher Expressions in Response to Heat Stress

Comparisons among R30, R48, and RH revealed a total of 257 significantly regulated genes that exhibited at least an eight-fold difference in expression (Figure 4A). To obtain an overview of the functions that are altered during heat treatment and the recovery stage, 100 response genes (excluding hypothetical genes) were annotated with KEGG functional groups. Figure 4B presents the distributions within each category. A total of 19 genes were assigned to “Replication and repair.” The expressions of genes associated with “carbohydrate metabolism and transport” and “amino acid metabolism and transport” were greatly reduced at high temperature.

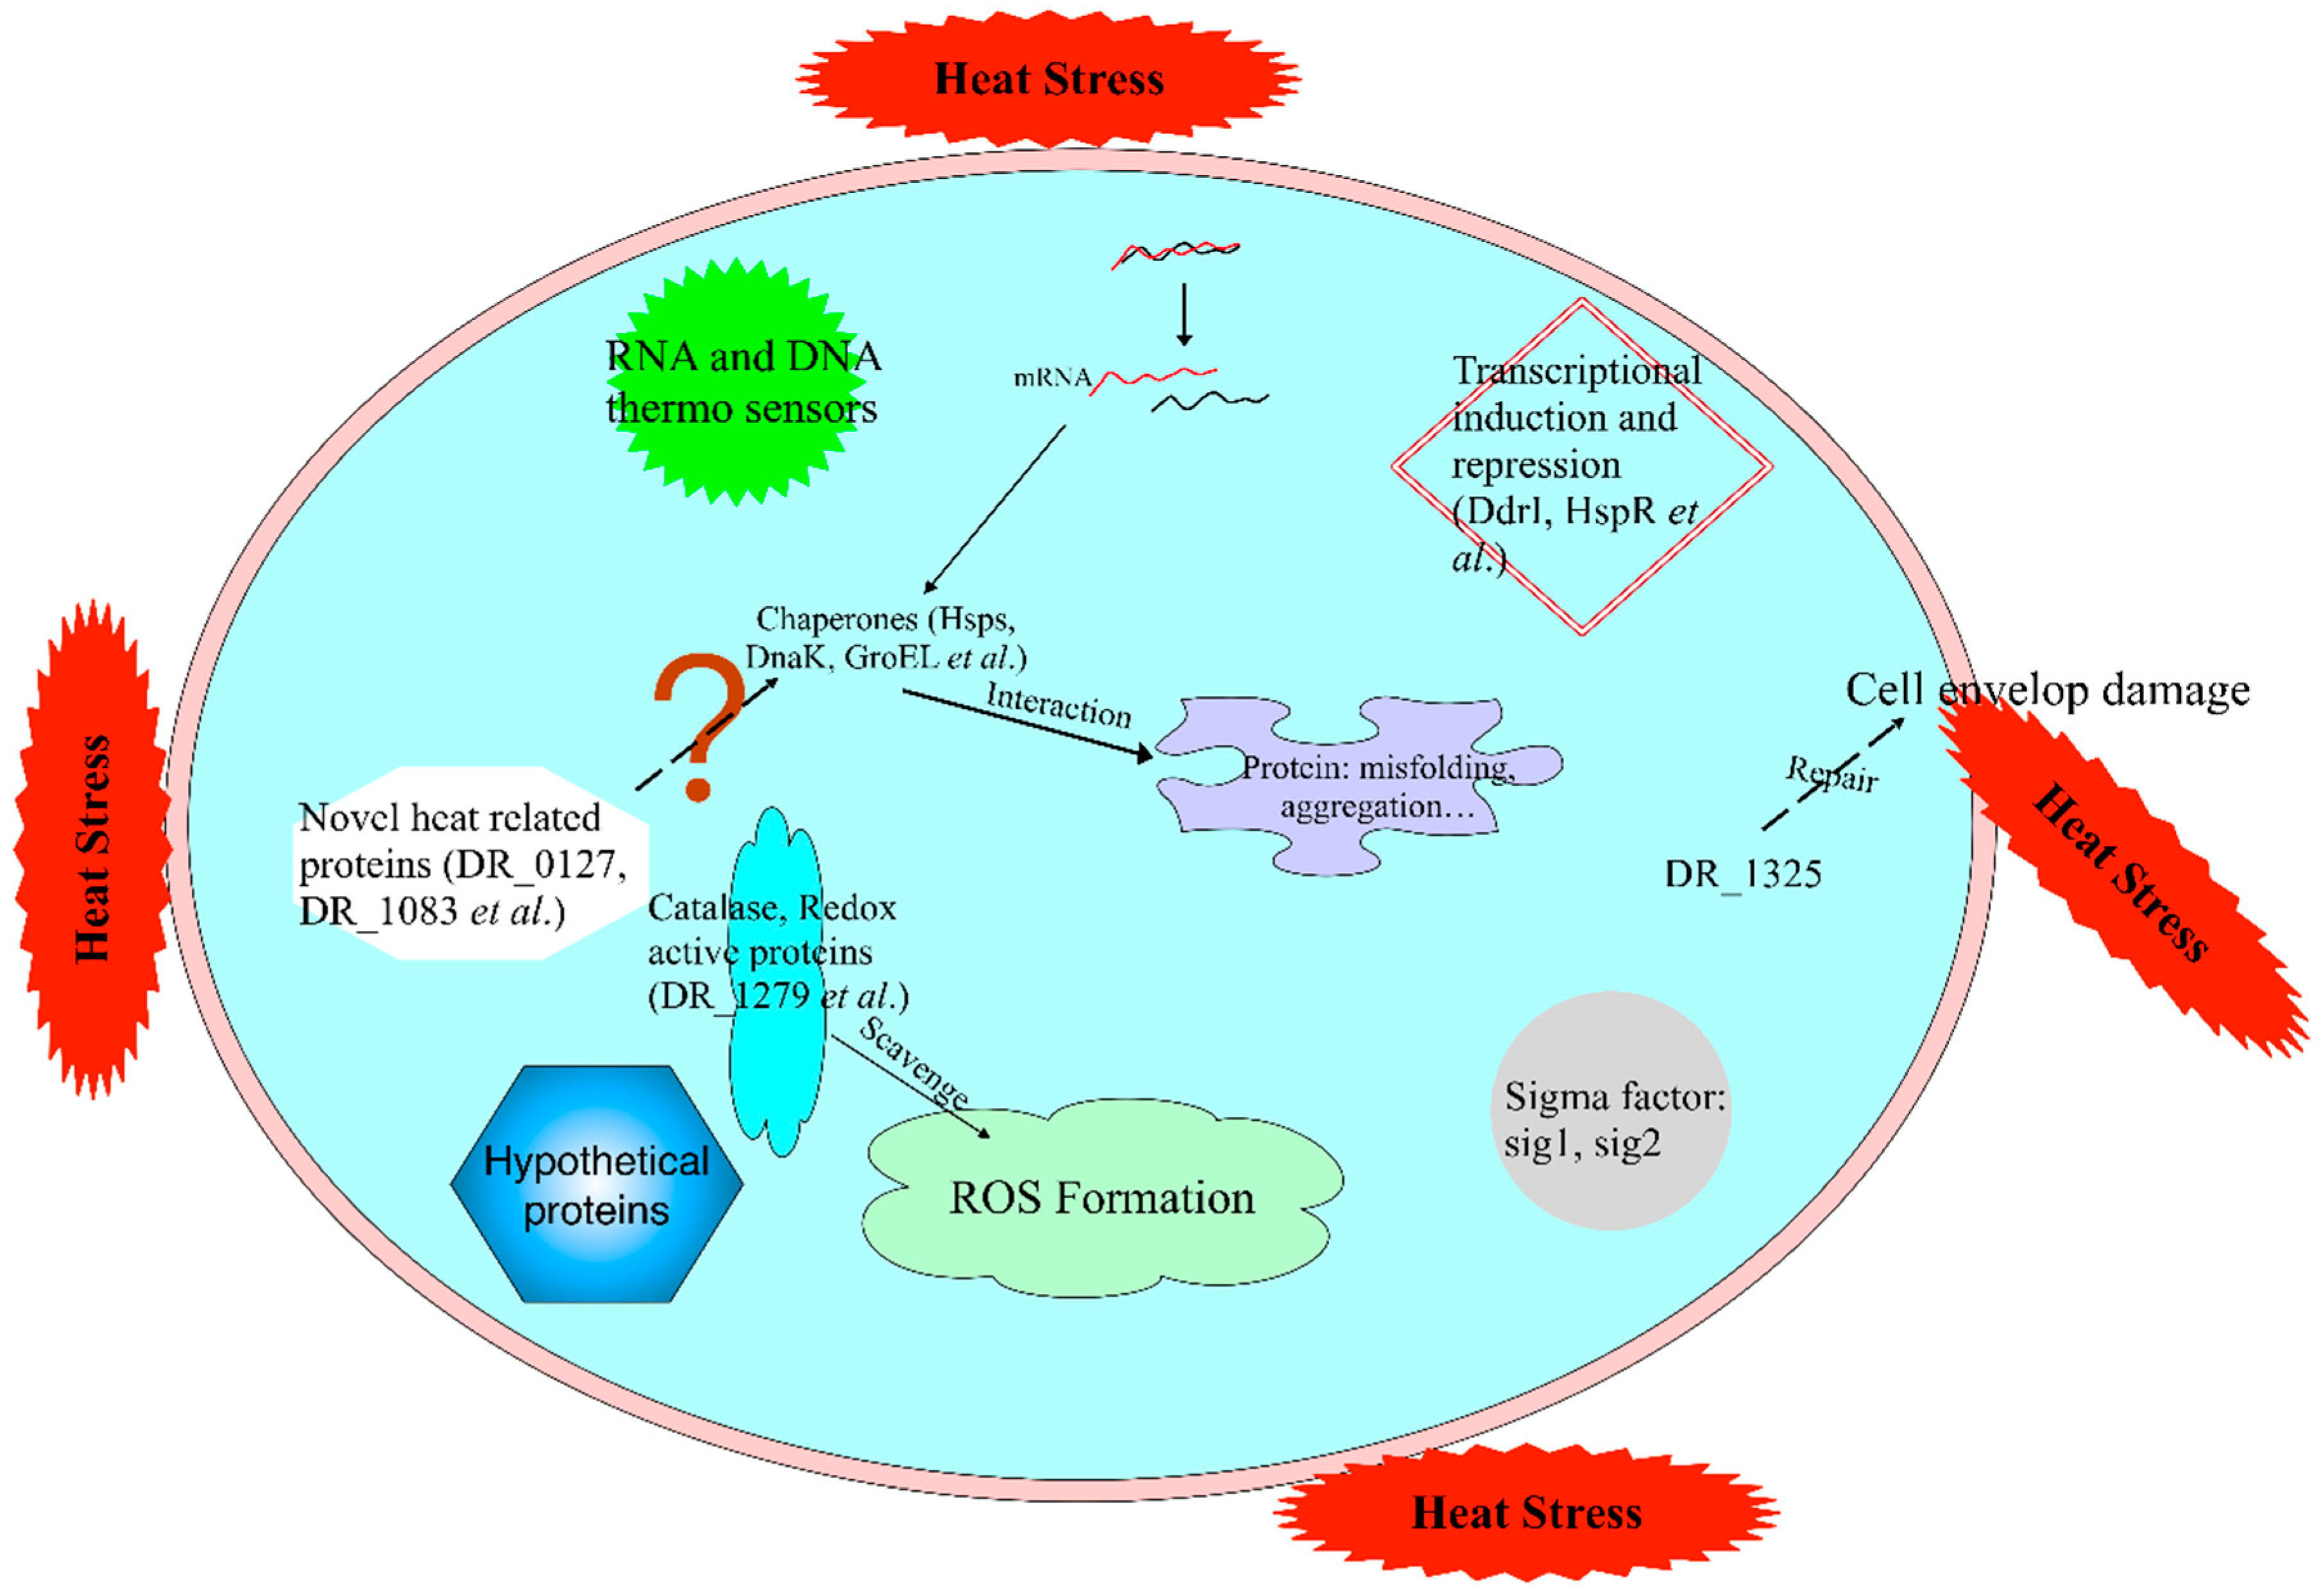
2.5. Function Analysis of the Novel, Potentially Heat-Related Genes

A total of 16 genes were differentially expressed (over eight-fold) in RH versus R30. Of these 16 genes, only one was upregulated, whereas 15 were downregulated (Table 2). These 15 genes showed at least an eight-fold downregulation in RH and were divided into the following categories: protein turnover and chaperone function (seven genes), hypothetical proteins (three genes), nucleotide metabolism and transport function (two genes), membrane transport (one gene), transcription (one gene), and energy production and conversion (one gene) (Figure 4C).
Three hypothetical genes (dr_1325, dr_0127, and dr_1083) were selected for further study. According to BLASTp, these three genes encode, respectively, for a predicted LysM peptidoglycan-binding protein (DR_1325), a predicted DNA-binding protein (DR_0127), and a hypothetical protein (DR_1083). Two of these genes, dr_1325 and dr_0127, may be, respectively, involved in adaptation to heat stress through cell wall biogenesis and a DNA-binding protein, although their specific functions remain to be elucidated.
In order to further investigate the roles of those three genes dr_0127, dr_1325, and dr_1083, significantly upregulated in response to heat stress, disruption mutant strains were constructed and the insertion of the spectinomycin gene into each gene was confirmed by genomic PCR and sequencing (Supplementary Figure S4). To examine whether the dr_0127 gene deletion had an effect on the expression of its flanking genes, we compared the expressions of dr_0126, dr_0128, and dr_0129 in D. radiodurans wild type and Δ dr_0127 by qRT-PCR. Figure 5A shows that the deletion of dr_0127 caused a sharp decrease in the expression of dr_0126, increased the expression of dr_0128 two-fold, and had no effect on dr_0129 expression. At 48 °C, the deletion of dr_0127 resulted in a decrease in the expression levels of these three genes. These results suggested that this deletion somehow affected the expression of the flanking genes expression under both normal and heat stress conditions, possibly because these genes work together in response to heat stress. In addition, the strain with the deletion of dr_0127 showed no significant growth difference compared to the wild type under standard conditions (Figure 5B). A test for growth potential on TGY plate assays at a high temperature (48 °C) showed that the three mutant strains were more susceptible than the D. radiodurans wild-type, strongly suggesting that dr_0127, dr_1083, and dr_1325 play key roles in the tolerance to heat stress (Figure 5C). Particular attention was devoted to dr_0127 because the cognate mutant was the most severely impacted in terms of tolerance to heat shock (Figure 5C) and because it was the most differentially up-regulated upon heat stress (Figure 4C) among the 15 genes tested.

3. Discussion

In this study, we used RNA-Seq to investigate the mechanism of adaptation of D. radiodurans to heat stress. A sublethal high temperature is the best way to study heat stress genes [36]. Previous data have shown that 48 °C is the optimal temperature to study heat stress in D. radiodurans [9]. After the heat treatment, a large number of genes were differentially expressed to allow D. radiodurans to adapt to the external environment. Fluorescence electron microscopy showed that the heat treatment for 2 h did not cause death of D. radiodurans (Figure 2). This is consistent with previously reported results showing that almost all of the cells remained alive after 2 h of heat treatment [10]. To analyze the heat-related genes in detail, we performed recovery growth after the heat treatment. Our data show that after 2 h of recovery at 30 °C, the cells recovered normal life activities (Figure 1). Interestingly, the growth rate of D. radiodurans is approximately 2 h for one generation, a duration equivalent to our recovery time. We hypothesize that when D. radiodurans cells undergo self-repair after sublethal stress, it may take one generation for them to recover to prestress levels. The transcriptome data showed that most of the gene expression in RH was equivalent to that in R30, which confirmed that the 2 h of recovery allowed the intracellular homeostasis of the previous stage to be restored.
The cell wall is crucial for cellular function, especially for protecting cell physiological activity, as it separates the internal environment from the external environment. However, TEM showed that the D. radiodurans cell wall was slightly damaged after treatment at 48 °C treatment for 2 h (Figure 2B1). Although most of the cells remained alive (Figure 2B2), the high temperature damaged the integrity of the cell wall. Similarly, Stéphane Guyot et.al (2010) and Bożena Bruhn-Olszewska et al. (2018) reported that high temperatures can destroy the integrity of the cell wall in E. coli [37,38]. In this study, the TEM data showed that after the cells had recovered at 30 °C for 2 h, their cell walls showed partial repair (Figure 2C1). Complete cell wall repair would likely require additional time after the heat stress.
Chaperones and proteases function by preventing protein aggregation and facilitating the degradation of improperly folded proteins under heat stress conditions [39,40]. In the present study, heat-induced genes (including groEL, lon1, lon2, dnaK, and hsp20) were highly expressed in R48, with these genes having been well characterized in many organisms [20,41]. In E. coli, the aggregation of abnormal proteins stimulates the transcription of Lon protease to degrade damaged proteins [42]. There are two Lon homologs in D. radiodurans (DR_0349 and DR_1974), and deletion of these factors was observed to increase cell sensitivity to puromycin, indicating a reduced capacity to degrade abnormal proteins [43]. There are two sHSP members (IbpA and IbpB) in E. coli. These proteins were reported to be involved in the aggregation of proteins after heat stress [44,45]. Bepperling et al. reported that D. radiodurans also harbors IbpA (Hsp20) and IbpB (DR_1691), which can work in parallel and independently of each other to combat protein aggregation during stress [15]. In addition, hsp20 was reported to confer tolerance to hydrogen peroxide [46]. These previous results and those of our transcriptomic analysis suggest that these proteases and chaperones likely play important roles in D. radiodurans during heat stress. Further analyses are needed to clarify the roles of chaperones and proteases in the heat tolerance of D. radiodurans.
The heat shock response of D. radiodurans illustrates the extensive diversity of gene regulation in this species. We identified genes with more than eight-fold differential expression between groups, with 15 genes in RH being downregulated by more than eight-fold relative to the expression observed in R30 (Figure 4). A subsequent investigation revealed that almost all these genes are involved in heat stress and that most are involved in protein turnover and chaperone function. Moreover, three of these genes are hypothetical genes (dr_0127, dr_1083, and dr_1325), among which one (dr_0127) was substantially upregulated in R48 (Figure 4). Annotation revealed that DR_0127 was predicted to be a DNA-binding protein. Genomic DNA packaging is mediated by a set of DNA-binding proteins that have major impacts on gene transcription and DNA replication [47,48,49]. The nucleoid of a bacterium is organized by DNA-binding proteins, especially under stress conditions; these proteins also protect the bacterial genome and regulate transcription to promote survival under stress conditions. Through alignment analyses, we observed that DR_0127 is highly conserved in other Deinococcus species, such as D. wulumuqiensis, D. gobiensis, D. soli, and D. actinosclerus. More interestingly, the upstream and downstream genes encode DnaJ, GrpE, and DnaK. The qRT-PCR data showed that deletion of dr_0127 drastically decreased the expression of the downstream gene dr_0126 (which encodes a DNA binding protein). Through the genome analysis, we predicted that these genes may share the same operon. In addition, we believe that the reduction in tolerance to heat stress may not only be due to the absence of dr_0127 but also due to the dramatic downregulation of dr_0126 expression. In future work, we will further clarify the exact relationship between dr_0126 and dr_0127 in response to heat stress by performing insertional mutagenesis. Deletion of dr_0127 resulted in decreased expression of dr_0126 (dnaJ), dr_0128 (grpE), and dr_0129 (dnaK) relative to the wild-type strain under heat stress. DR_1027 is predicted to be a genus-specific DNA binding protein that we hypothesize may work together with DnaJ, GrpE, and DnaK in response to heat stress, although their mechanisms of action require further study. DR_1325 is predicted to be a protein containing a LysM peptidoglycan-binding domain, which may be involved in cell wall biogenesis. In addition, our phenotype experiments showed that deletion of DR_1325 resulted in sensitivity to heat stress compared to the wild type strain. dr_1325 appears to be the first gene of the operon (dr_1325-27), and deletion of dr_1325 also caused the upregulation of dr_1326 and dr_1327 (Supplementary Figure S5). The phenotype of the mutant strain resulting from the lack of the dr_1325 may be caused by the changes of the transcription of the affected genes. Our results also show that heat stress damages the cell wall of D. radiodurans (Figure 2). We speculate that DR_1325 may regulate the response of the heat stress mechanism by participating in cell wall repair. That idea requires experimental support from further studies.
Taken together, the results of this study reveal a highly complex gene-expression response to heat stress in D. radiodurans that involves numerous key genes related to various cell processes. Chief among these genes are those encoding chaperones, heat shock proteins, proteases, and posttranscriptional regulatory proteins (Figure 6). Our study also revealed novel, potentially important features exhibited by D. radiodurans in response to heat stress, such as the substantial recovery of RH cells compared with R30 cells, confirming that D. radiodurans also has a strong self-repair ability under heat stress. By analyzing the transcriptome data of the three groups, some new heat-related genes were discovered and verified, which expand the heat stress-related gene family in D. radiodurans. Further metabolome analyses and gene knockout experiments, particularly those targeting the novel genes, will enhance our understanding of the molecular mechanisms underlying heat stress in this species.

4. Materials and Methods

4.1. Strain and Growth Conditions

D. radiodurans was obtained from the China General Microbiological Culture Collection Center (CGMCC 1.633, Beijing, China). D. radiodurans was cultured at 30 °C in TGY medium (1% tryptone, 0.5% yeast extract, and 0.1% glucose) with shaking at 220 rpm/min.

4.2. Heat Stress Treatment of D. radiodurans and Recovery Conditions

Bacterial cells were pre-cultured in TGY to an OD600 = 2, were harvested by centrifugation at 7000× g for 3 min, washed twice in sterile phosphate-buffered saline (PBS, 0.02% KH2PO4, 0.29% Na2HPO4·12H2O, 0.8% NaCl, 0.02% KCl, pH 7.5), and resuspended in fresh TGY broth to the same cell density. For heat stress, cells were incubated at 48 °C for 2 h. They were then collected by centrifugation and resuspended to the same OD in TGY pre-conditioned at 30 °C. Bacteria were transferred to a second incubator pre-set at 30 °C and grown as a recovery culture for 0.5, 1, 1.5, or 2 h. A total of 100 μL was collected for dilution and plating onto solid TGY medium to calculate the number of colony-forming units (CFU). Cells that did not receive the heat treatment (2 h of growth at 30 °C) served as controls.
For transcriptomics, cells were treated at 48 °C for 2 h and then divided into two samples (1 and 2). Cells from sample 1 that were harvested by centrifugation at 12,000× g for 3 min and stored at −80 °C served as heat-treated group (R48). Cells from sample 2 that were centrifuged at 7000× g for 3 min, washed twice in PBS, and transferred to fresh TGY medium for recovery growth at 30 °C for 2 h served as the recovery group (RH). The restored cells were harvested by centrifugation at 12,000× g for 3 min and stored at −80 °C. Untreated D. radiodurans bacteria were used as the control (R30). All assays were performed in triplicate.

4.3. TEM and Fluorescence Assay

For TEM analysis, cells grown to OD600 = 2.0 were washed twice with PBS. The cells in the three treatment groups were collected and fixed overnight with 2.5% glutaraldehyde at 4 °C and then embedded in 2% agarose after centrifugation at 3000× g. Thin sections of the samples were stained with uranyl acetate for 15 min and observed using a Hitachi H-7650 transmission electron microscope (Hitach, Tokyo, Japan).
Cell viability after heat treatment was studied by staining with specific fluorochromes followed by epifluorescence microscopy. Cells were stained using a BacLightTM RedoxSensorTM Green Vitality Kit (ThermoFisher, MA, USA) containing PI and RSG. D. radiodurans cells were washed with PBS. This kit is convenient and easy-to-use for monitoring the viability of bacterial populations as a function of cell membrane integrity. Cells with a compromised membrane, which are considered dead or dying, stain red (PI), whereas cells with an intact membrane stain green (RSG). A fluorescence assay was performed using a 100× oil immersion lens with a Nikon Ti2 inverted fluorescence microscope and processed with the NIS-Elements (Nikon, Tokyo, Japan).

4.4. Total RNA Extraction, complementary DNA (cDNA) Library Preparation, and Sequencing

Total cellular RNA was extracted from D. radiodurans using TRIzol reagent (Invitrogen, Thermo Fisher, MA, USA), Lysing Matrix Tubes (MP Bio, CA, USA), and the PureLink RNA Mini Kit (Invitrogen, Thermo Fisher, MA, USA) following the manufacturer’s instructions. RNA purity was assessed using a NanoDrop® spectrophotometer (Thermo Fisher, MA, USA). The RNA concentration was measured using a Qubit® RNA Assay Kit and a Qubit® 3.0 Fluorometer (Life Technologies, CA, USA). RNA integrity (RIN) was assessed using an RNA Nano 6000 Assay Kit and the Bioanalyzer 2100 system (Agilent Technologies, CA, USA), RIN > 9.5.
A total of 1 μg of high-quality RNA per sample was used as the input material for library preparation. Sequencing libraries were generated using a VAHTS Total RNA-Seq Library Prep Kit for Illumina® (Vazyme, NR603), following the manufacturer’s recommendations. Following purification, the RNA was fragmented into small pieces using divalent cations under an elevated temperature. The cleaved RNA fragments were copied into first-strand cDNA using reverse transcriptase and random primers. Strand specificity was achieved by replacing dTTP with dUTP in 2nd strand marking buffer, followed by second-strand cDNA synthesis using DNA Polymerase I and RNase H. Then, the cDNA fragments were end-repaired with the addition of a single “A” base at the 3′-end of each strand and subsequently ligated to special sequencing adapters (Vazyme, N803). PCR was performed, and the products were purified. The library concentration was measured using a Qubit® RNA Assay Kit in Qubit® 3.0 for preliminary quantification. The sizes of the inserted fragments were assessed using the Agilent Bioanalyzer 2100 system, and high-quality insert fragments were accurately amplified using qPCR with the StepOne Plus Real-Time PCR system (ABI, USA). Clustering of the index-coded samples was performed on the cBot Cluster Generation System (Illumina, USA) according to the manufacturer’s instructions. Then the well-prepared library was sequenced using the Illumina HiSeq X Ten platform with a 150-bp paired-end module. All samples were sequenced three times.

4.5. Assembly and Functional Enrichment Analyses of DEGs

Clean reads with an average length of 150 bp were achieved after removing contaminated, poly-N and low-quality sequences from the raw reads. On average, 30.6 million transcripts were mapped to the reference genome with sample sizes ranging between 28.3 and 40.2 million reads (Supplementary Table S3). Pearson correlation analysis showed that the overall expression levels among the three biological replicates of each group were highly similar (R2 > 0.92; Supplementary Figures S6 and S7), indicating that the RNA-Seq data were suitable for pairwise statistical comparisons. The reference genome and gene model annotation files of D. radiodurans were directly collected from the genome website (https://www.ncbi.nlm.nih.gov/genome/1020?genome_assembly_id=300483). The reference genome index was built using Bowtie2 (v2.2.9) [50], and paired-end clean reads were aligned to the reference genome using TopHat (v2.1.1) [51]. The mapped reads of each sample were assembled using Cufflinks (v2.2.1) [52] with a reference-based approach. Cufflinks uses a probabilistic model to simultaneously assemble and quantify the expression levels of a minimal set of isoforms, which provides a maximum likelihood explanation of the expression data for a given locus. Cuffdiff (v1.3.0) [52] was used to calculate the FPKMs of the coding genes in each sample. The gene FPKMs were computed by summing the FPKMs of the transcripts in each gene group. Cuffdiff (v2.2.1) [52] provides statistical routines for determining differential expression in a digital transcript or gene expression dataset using a model based on a negative binomial distribution. Genes with corrected p-values less than 0.05 and absolute log2 values (fold changes) >1.5 were considered significant DEGs.

4.6. GO and KEGG Enrichment Analysis

GO is a standardized system for classifying gene functionality and provides a dynamically-updated controlled vocabulary for fully characterizing gene properties and products in organisms. GO analysis is classified into three domains: biological processes, cellular components, and molecular functions of gene products. GO enrichment analysis of the DEGs was performed with the Perl module (GO::TermFinder) [53]. GO terms with a corrected p-values less than 0.05 were considered to be significantly enriched among the DEGs. In vivo, different genes coordinate with each other to perform their biological functions, and pathway-based analysis is helpful to understand the biological functions of gene interactions in various pathways. KEGG is a major public database containing manually-drawn pathway maps representing knowledge of molecular interactions and reaction networks. R functions (phyper and q-value) were used to test for the statistical enrichment of the DEGs among the KEGG pathways. KEGG pathways with corrected p-values less than 0.05 were considered to be significantly enriched for the DEGs.

4.7. qRT-PCR Validation

We randomly selected several genes with or without detectably differential expression for subsequent qRT-PCR analysis to verify the quality of the sequencing data. Total RNA was extracted as described for the cDNA library preparation, and RNA was used for cDNA synthesis using a PrimeScriptTMRT reagent kit with gDNA Eraser (TaKaRa) as described in the manufacturer’s protocol. Subsequently, qRT-PCR was performed using ChamQ SYBR qPCR Master Mix (Vazyme Biotech Co., Ltd., China) on a 7500 Fast Real-time PCR System (Applied Biosystems, USA). The primers are listed in Supplementary Table S4. The 16S rRNA gene was used as the endogenous reference control to normalize differences in total RNA quantity, and relative gene expression was quantified by the 2−ΔΔCT method. Three biological replicates for each condition were conducted.

4.8. Construction of Gene Deletion Mutant Strains and Heat Stress Phenotype Assays

Mutant strains lacking dr_0127, dr_1325, and dr_1083 were constructed by fusion PCR recombination of a spectinomycin resistance cassette into the genome as previously described [54]. Briefly, fusion PCR products for the dr_0127, dr_1325, and dr_1083 deletions were constructed in two steps. In the first step, three different PCRs were used to generate fragments complementary to the spectinomycin-resistance gene from the plasmid pKatAAD2 (896 bp) and the upstream and downstream regions (500 bp each) of the dr_0127, dr_1325, and dr_1083 sequences using the appropriate primer pairs (Supplementary Table S4). In the second step, the upstream, spectinomycin-resistance gene and downstream fragments were annealed at their overlapping regions and PCR amplified as a single fragment using the outer primers (1896 bp). The resulting PCR fragment was directly transformed into D. radiodurans. Colonies resistant to spectinomycin (340 μg/mL) were selected, and these mutants were subsequently verified by PCR and DNA sequencing, and named Δ dr_0127, Δ dr_1325, and Δ dr_1083.
Cells were grown in TGY medium with the appropriate antibiotics to OD600 = 2 at 30 °C and were then shifted to 48 °C for 4 h. Subsequently, 100 μL of the cell suspension was aliquoted into 900 μL of PBS, after which 10-fold serial dilutions were made for all the strains, and 8 µL of each dilution was spotted onto TGY agar plates. These plates were incubated at 30 °C for 3 days before colony growth was observed and calculated. All assays were performed in triplicate.

4.9. Statistical Analysis

All experiments were repeated at least three times with identical or similar results. The mean values from the individual experiments were expressed as averages ± standard deviations (SD). A p-value < 0.05 was considered to be significant. R studio and GraphPad Prism 7.0 software were used for the analysis.
Data Accessibility: The sequences were uploaded and deposited in the National Center for Biotechnology Information (NCBI) Sequence Read Archive (SRA) under the accession numbers SRR9851810 to SRR9851818.

Supplementary Materials

Supplementary materials can be found at https://www.mdpi.com/1422-0067/20/22/5603/s1.

Author Contributions

Conceptualization, D.X., M.L., and J.W.; methodology, D.X. and W.L.; validation, D.X., Y.C., and J.L.; formal analysis, D.X. and W.L.; investigation, D.X.; writing—original draft preparation, D.X.; writing—review and editing, D.X., W.L., Y.C., Y.L., J.H., X.G., J.L., S.J., Z.Z., W.Z., M.C., M.L., M.O., and J.W.; supervision, J.W. and M.O.

Funding

This study was supported by Key Research and Development Projects (numbers 2018YFA0901000 and 2018YFA0901003), the Ministry of Agriculture Transgenic Program (number 2016ZX08009003-002), and the National Natural Science Foundation of China (numbers 31800061, 31570080, and 31500063). We also appreciate the support of the Agricultural Science and Technology Innovation Program of CAAS.

Conflicts of Interest

The authors declare no conflicts of interest.

References

  1. Battista, J.R. Against all odds: the survival strategies of Deinococcus radiodurans. Annu. Rev. Microbiol. 1997, 51, 203–224. [Google Scholar] [CrossRef] [PubMed]
  2. White, O.; Eisen, J.A.; Heidelberg, J.F.; Hickey, E.K.; Peterson, J.D.; Dodson, R.J.; Haft, D.H.; Gwinn, M.L.; Nelson, W.C.; Richardson, D.L.; et al. Genome sequence of the radioresistant bacterium Deinococcus radiodurans R1. Science 1999, 286, 1571–1577. [Google Scholar] [CrossRef] [PubMed]
  3. Mattimore, V.; Battista, J.R. Radioresistance of Deinococcus radiodurans: Functions necessary to survive ionizing radiation are also necessary to survive prolonged desiccation. J. Bacteriol. 1996, 178, 633–637. [Google Scholar] [CrossRef] [PubMed]
  4. Wang, P.; Schellhorn, H.E. Induction of resistance to hydrogen peroxide and radiation in Deinococcus radiodurans. Can. J. Microbiol. 1995, 41, 170–176. [Google Scholar] [CrossRef] [PubMed]
  5. Bauermeister, A.; Moeller, R.; Reitz, G.; Sommer, S.; Rettberg, P. Effect of relative humidity on Deinococcus radiodurans’ resistance to prolonged desiccation, heat, ionizing, germicidal, and environmentally relevant UV radiation. Microb. Ecol. 2011, 61, 715–722. [Google Scholar] [CrossRef]
  6. Slade, D.; Radman, M. Oxidative stress resistance in Deinococcus radiodurans. Microbiol. Mol. Biol. Rev. 2011, 75, 133–191. [Google Scholar] [CrossRef]
  7. Blasius, M.; Sommer, S.; Hübscher, U. Deinococcus radiodurans: What belongs to the survival kit? Crit. Rev. Biochem. Mol. Biol. 2008, 43, 221–238. [Google Scholar] [CrossRef]
  8. Harada, K.; Oda, S. Induction of thermotolerance by split-dose hyperthermia at 52 °C in Deinococcus radiodurans. Agric. Biol. Chem. 1988, 52, 2391–2396. [Google Scholar]
  9. Schmid, A.K.; Lidstrom, M.E. Involvement of two putative alternative sigma factors in stress response of the radioresistant bacterium Deinococcus radiodurans. J. Bacteriol. 2002, 184, 6182–6189. [Google Scholar] [CrossRef]
  10. Schmid, A.K.; Howell, H.A.; Battista, J.R.; Peterson, S.N.; Lidstrom, M.E. Global transcriptional and proteomic analysis of the Sig1 heat shock regulon of Deinococcus radiodurans. J. Bacteriol. 2005, 187, 3339–3351. [Google Scholar] [CrossRef]
  11. Schmid, A.K.; Howell, H.A.; Battista, J.R.; Peterson, S.N.; Lidstrom, M.E. HspR is a global negative regulator of heat shock gene expression in Deinococcus radiodurans. Mol. Microbiol. 2005, 55, 1579–1590. [Google Scholar] [CrossRef] [PubMed]
  12. Airo, A.; Chan, S.L.; Martinez, Z.; Platt, M.O.; Trent, J.D. Heat shock and cold shock in Deinococcus radiodurans. Cell Biochem. Biophys. 2004, 40, 277–288. [Google Scholar] [CrossRef]
  13. Schmid, A.K.; Lipton, M.S.; Mottaz, H.; Monroe, M.E.; Smith, R.D.; Lidstrom, M.E. Global whole-cell FTICR mass spectrometric proteomics analysis of the heat shock response in the radioresistant bacterium Deinococcus radiodurans. J. Proteome Res. 2005, 4, 709–718. [Google Scholar] [CrossRef] [PubMed]
  14. Bauermeister, A.; Hahn, C.; Rettberg, P.; Reitz, G.; Moeller, R. Roles of DNA repair and membrane integrity in heat resistance of Deinococcus radiodurans. Arch. Microbiol. 2012, 194, 959–966. [Google Scholar] [CrossRef]
  15. Bepperling, A.; Alte, F.; Kriehuber, T.; Braun, N.; Weinkauf, S.; Groll, M.; Haslbeck, M.; Buchner, J. Alternative bacterial two-component small heat shock protein systems. Proc. Natl. Acad. Sci. USA 2012, 109, 20407–20412. [Google Scholar] [CrossRef] [Green Version]
  16. Meyer, L.; Coste, G.; Sommer, S.; Oberto, J.; Confalonieri, F.; Servant, P.; Pasternak, C. DdrI, a cAMP receptor protein family member, acts as a major regulator for adaptation of Deinococcus radiodurans to various stresses. J. Bacteriol. 2018, 13, e00129-18. [Google Scholar] [CrossRef]
  17. Lesley, S.A.; Graziano, J.; Cho, C.Y.; Knuth, M.W.; Klock, H.E. Gene expression response to misfolded protein as a screen for soluble recombinant protein. Protein Eng. 2002, 15, 153–160. [Google Scholar] [CrossRef]
  18. Lim, B.; Gross, C.A. Cellular response to heat shock and cold shock. In Bacterial Stress Responses; ASM Press: Washington, DC, USA, 2011; pp. 93–114. [Google Scholar]
  19. Ventura, M.; Canchaya, C.; Zhang, Z.; Bernini, V.; Fitzgerald, G.F.; Van Sinderen, D. How high G+C Gram-positive bacteria and in particular bifidobacteria cope with heat stress: Protein players and regulators. FEMS Microbiol. Rev. 2006, 30, 734–759. [Google Scholar] [CrossRef]
  20. Arsène, F.; Tomoyasu, T. The heat shock response of Escherichia coli. Int. J. Food 2000, 55, 3–9. [Google Scholar] [CrossRef]
  21. Chastanet, A.; Fert, J.; Msadek, T. Comparative genomics reveal novel heat shock regulatory mechanisms in Staphylococcus aureus and other Gram-positive bacteria. Mol. Microbiol. 2003, 47, 1061–1073. [Google Scholar] [CrossRef]
  22. Wick, L.M.; Egli, T. Molecular components of physiological stress responses in Escherichia coli. Adv. Biochem. Eng. Biotechnol. 2004, 89, 1–45. [Google Scholar] [PubMed]
  23. Gunasekera, T.S.; Csonka, L.N.; Paliy, O. Genome-wide transcriptional responses of Escherichia coli K-12 to continuous osmotic and heat stresses. J. Bacteriol. 2008, 190, 3712–3720. [Google Scholar] [CrossRef] [PubMed]
  24. Anderson, K.L.; Roberts, C.; Disz, T.; Vonstein, V.; Hwang, K.; Overbeek, R.; Olson, P.D.; Projan, S.J.; Dunman, P.M. Characterization of the Staphylococcus aureus heat shock, cold shock, stringent, and SOS responses and their effects on log-phase mRNA turnover. J. Bacteriol. 2006, 188, 6739–6756. [Google Scholar] [CrossRef] [PubMed]
  25. Ma, D.K.; Li, Z.; Lu, A.Y.; Sun, F.; Chen, S.; Rothe, M.; Menzel, R.; Sun, F.; Horvitz, H.R. Acyl-CoA dehydrogenase drives heat adaptation by sequestering fatty acids. Cell 2015, 161, 1152–1163. [Google Scholar] [CrossRef] [PubMed]
  26. Ye, Y.; Zhang, L.; Hao, F.; Zhang, J.; Wang, Y.; Tang, H. Global metabolomic responses of Escherichia coli to heat stress. J. Proteome Res. 2012, 11, 2559–2566. [Google Scholar] [CrossRef] [PubMed]
  27. Chowdhury Paul, S.; Jain, P.; Mitra, J.; Dutta, S.; Bhattacharya, P.; Bal, B.; Bhattacharyya, D.; Das Gupta, S.; Pal, S. Induction of Cr(VI) reduction activity in an Anoxybacillus strain under heat stress: A biochemical and proteomic study. FEMS Microbiol. Lett. 2012, 331, 70–80. [Google Scholar] [CrossRef] [PubMed]
  28. Chan, K.-G.; Priya, K.; Chang, C.-Y.; Abdul Rahman, A.Y.; Tee, K.K.; Yin, W.-F. Transcriptome analysis of Pseudomonas aeruginosa PAO1 grown at both body and elevated temperatures. PeerJ 2016, 4, e2223. [Google Scholar] [CrossRef]
  29. Gomide, A.C.P.; de Sá, P.G.; Cavalcante, A.L.Q.; de Jesus Sousa, T.; Gomes, L.G.R.; Ramos, R.T.J.; Azevedo, V.; Silva, A.; Folador, A.R.C. Heat shock stress: Profile of differential expression in Corynebacterium pseudotuberculosis biovar Equi. Gene 2018, 645, 124–130. [Google Scholar] [CrossRef]
  30. Tsai, C.-H.; Liao, R.; Chou, B.; Contreras, L.M. Transcriptional analysis of Deinococcus radiodurans reveals novel small RNAs that are differentially expressed under ionizing radiation. Appl. Environ. Microbiol. 2015, 81, 1754–1764. [Google Scholar] [CrossRef]
  31. Tanaka, M.; Earl, A.M.; Howell, H.A.; Park, M.J.; Eisen, J.A.; Peterson, S.N.; Battista, J.R. Analysis of Deinococcus radiodurans’s transcriptional response to ionizing radiation and desiccation reveals novel proteins that contribute to extreme radioresistance. Genetics 2004, 168, 21–33. [Google Scholar] [CrossRef]
  32. Liu, Y.; Zhou, J.; Omelchenko, M.V.; Beliaev, A.S.; Venkateswaran, A.; Stair, J.; Wu, L.; Thompson, D.K.; Xu, D.; Rogozin, I.B.; et al. Transcriptome dynamics of Deinococcus radiodurans recovering from ionizing radiation. Proc. Natl. Acad. Sci. USA 2003, 100, 4191–4196. [Google Scholar] [CrossRef] [PubMed]
  33. Wang, Z.; Gerstein, M.; Snyder, M. RNA-Seq: A revolutionary tool for transcriptomics. Nat. Rev. Genet. 2009, 10, 57–63. [Google Scholar] [CrossRef] [PubMed]
  34. López-Leal, G.; Tabche, M.L.; Castillo-Ramírez, S.; Mendoza-Vargas, A.; Ramírez-Romero, M.A.; Dávila, G. RNA-Seq analysis of the multipartite genome of Rhizobium etli CE3 shows different replicon contributions under heat and saline shock. BMC Genom. 2014, 15, 770. [Google Scholar] [CrossRef] [PubMed]
  35. Wang, J.; Chen, L.; Huang, S.; Liu, J.; Ren, X.; Tian, X.; Qiao, J.; Zhang, W. RNA-seq based identification and mutant validation of gene targets related to ethanol resistance in cyanobacterial Synechocystis sp. PCC 6803. Biotechnol. Biofuels 2012, 5, 89. [Google Scholar] [CrossRef] [PubMed]
  36. Lindquist, S. The heat-shock response. Annu. Rev. Biochem. 1986, 55, 1151–1191. [Google Scholar] [CrossRef] [PubMed]
  37. Guyot, S.; Pottier, L.; Ferret, E.; Gal, L.; Gervais, P. Physiological responses of Escherichia coli exposed to different heat-stress kinetics. Arch. Microbiol. 2010, 8, 651–661. [Google Scholar] [CrossRef]
  38. Bruhn-Olszewska, B.; Szczepaniak, P.; Matuszewska, E.; Kuczyńska-Wiśnik, D.; Stojowska-Swędrzyńska, K.; Moruno Algara, M.; Laskowska, E. Physiologically distinct subpopulations formed in Escherichia coli cultures in response to heat shock. Microbiol. Res. 2018, 209, 33–42. [Google Scholar] [CrossRef]
  39. Baneyx, F.; Mujacic, M. Recombinant protein folding and misfolding in Escherichia coli. Nat. Biotechnol. 2004, 11, 1399. [Google Scholar] [CrossRef]
  40. Parsell, D.A.; Lindquist, S. The function of heat-Shock proteins in stress tolerance: degradation and reactivation of damaged proteins. Annu. Rev. Genet. 1993, 1, 437–496. [Google Scholar] [CrossRef]
  41. Schumann, W. Regulation of bacterial heat shock stimulons. Cell Stress Chaperones 2016, 21, 959–968. [Google Scholar] [CrossRef] [Green Version]
  42. Kuroda, A.; Nomura, K.; Ohtomo, R.; Kato, J.; Ikeda, T.; Takiguchi, N.; Ohtake, H.; Kornberg, A. Role of inorganic polyphosphate in promoting ribosomal protein degradation by the Lon protease in E. coli. Science 2001, 293, 705–708. [Google Scholar] [CrossRef] [PubMed]
  43. Servant, P.; Jolivet, E.; Bentchikou, E.; Mennecier, S.; Bailone, A.; Sommer, S. The ClpPX protease is required for radioresistance and regulates cell division after γ-irradiation in Deinococcus radiodurans. Mol. Microbiol. 2007, 66, 1231–1239. [Google Scholar] [CrossRef] [PubMed]
  44. Matuszewska, M.; Kuczyńska-Wiśnik, D.; Laskowska, E.; Liberek, K. The small heat shock protein IbpA of Escherichia coli cooperates with IbpB in stabilization of thermally aggregated proteins in a disaggregation competent state. J. Biol. Chem. 2005, 280, 12292–12298. [Google Scholar] [CrossRef] [PubMed]
  45. Kuczyńska-Wiśnik, D.; Kȩdzierska, S.; Matuszewska, E.; Lund, P.; Taylor, A.; Lipińska, B.; Laskowska, E. The Escherichia coli small heat-shock proteins IbpA and IbpB prevent the aggregation of endogenous proteins denatured in vivo during extreme heat shock. Microbiology 2002, 148, 1757–1765. [Google Scholar] [CrossRef] [PubMed]
  46. Singh, H.; Appukuttan, D.; Lim, S. Hsp20, a small heat shock protein of Deinococcus radiodurans, confers tolerance to hydrogen peroxide in Escherichia coli. J. Microbiol. Biotechnol. 2014, 24, 1118–1122. [Google Scholar] [CrossRef]
  47. Azam, T.A.; Ishihama, A. Twelve species of the nucleoid-associated protein from Escherichia coli. Sequence recognition specificity and DNA binding affinity. J. Biol. Chem. 1999, 274, 33105–33113. [Google Scholar] [CrossRef]
  48. Dillon, S.C.; Dorman, C.J. Bacterial nucleoid-associated proteins, nucleoid structure and gene expression. Nat. Rev. Microbiol. 2010, 8, 185–195. [Google Scholar] [CrossRef]
  49. Browning, D.F.; Grainger, D.C.; Busby, S.J.W. Effects of nucleoid-associated proteins on bacterial chromosome structure and gene expression. Curr. Opin. Microbiol. 2010, 13, 773–780. [Google Scholar] [CrossRef]
  50. Langmead, B.; Salzberg, S.L. Fast gapped-read alignment with Bowtie 2. Nat. Methods 2012, 4, 357–359. [Google Scholar] [CrossRef]
  51. Kim, D.; Pertea, G.; Trapnell, C.; Pimentel, H.; Kelley, R.; Salzberg, S.L. TopHat2: accurate alignment of transcriptomes in the presence of insertions, deletions and gene fusions. Genome Biol. 2013, 14, R36. [Google Scholar] [CrossRef]
  52. Trapnell, C.; Roberts, A.; Goff, L.; Pertea, G.; Kim, D.; Kelley, D.R.; Pimentel, H.; Salzberg, S.L.; Rinn, J.L.; Pachter, L. Differential gene and transcript expression analysis of RNA-seq experiments with TopHat and Cufflinks. Nat. Protoc. 2012, 7, 562–578. [Google Scholar] [CrossRef] [PubMed] [Green Version]
  53. Boyle, E.I.; Weng, S.; Gollub, J.; Jin, H.; Botstein, D.; Cherry, J.M.; Sherlock, G. GO::TermFinder—Open source software for accessing Gene Ontology information and finding significantly enriched Gene Ontology terms associated with a list of genes. Bioinformatics 2004, 20, 3710–3715. [Google Scholar] [CrossRef] [PubMed]
  54. Sheng, D.; Gao, G.; Tian, B.; Xu, Z.; Zheng, Z.; Hua, Y. RecX is involved in antioxidant mechanisms of the radioresistant bacterium Deinococcus radiodurans. FEMS Microbiol. Lett. 2005, 244, 251–257. [Google Scholar] [CrossRef] [PubMed]
Figure 1. Correlation analysis of the cell viability and the different treatments using three biological replicates. The triangle symbol with the black line represents the untreated group (R30), the circles with the red line represent the heat treatment group (R48), and the diamond dots with the blue line represent the recovery treatment group at various incubation periods (RH). Error bars represent the SD calculated from three sets of independent experiments.
Ijms 20 05603 g001
Figure 2. TEM and fluorescence images of the heat-induced lesions on Deinococcus radiodurans cells following exposure to 48 °C for 2 h. (A1,B1,C1) represent the TEM results; (A2,B2,C2) represent the fluorescence analysis results. (A1,A2) D. radiodurans cells at 30 °C (control samples), (B1,B2) D. radiodurans cells at 48 °C (heat-treated samples), and (C1,C2) D. radiodurans cells recovered at 30 °C after the heat treatment (recovery samples). The inset diagram (B1,C1) show an amplified region of the cell envelope. Living cells were stained by Redox Sensor Green (RSG) (green), and dead cells were stained by propidium iodide (PI) (red). The scale bars indicate the corresponding lengths.
Ijms 20 05603 g002
Figure 3. Differential expression levels among the three treatment groups. Each point represents a unigene. The x-axis represents the log10 values of the normalized expression level (FPKM) of the unigenes in each group. The red and green points indicate significant changes in the absolute value of log2 (the FPKM ratio in two groups) ≥ 1.5 and FDR ≤ 0.05, respectively; i.e., the red points indicate upregulated unigenes, and the green points indicate downregulated unigenes in the two groups, with the differential expression levels presented along the X-axis. The gray points indicate nonsignificant, differentially expressed unigenes. (A) R48 versus R30; (B) RH versus R30. (C) Venn diagram showing significant gene expression changes in response to heat. (D) Principal component analysis based on the FPKM expression values among the three treatment groups.
Ijms 20 05603 g003
Figure 4. (A) Heatmap of the log2-fold changes (LFCs) among R30, R48, and RH. Included are 257 genes with fold changes >8. The dendrogram represents hierarchical clustering of the LFCs. (B) Likert chart of the KEGG functional categorizations of the differentially expressed genes between R48 versus R30 and RH versus R30. (C) qRT-PCR analysis of the high differentially expressed genes; P: protein turnover and chaperone functions, H: hypothetical protein, N: nucleotide metabolism and transport, M: membrane transport, T: transcription, E: energy production and conversion.
Ijms 20 05603 g004
Figure 5. The effect of the dr_0127 deletion on the expression of its flanking genes and survival phenotype plate assay upon heat stress. (A) The effect of the dr_0127 deletion on the expression of its flanking genes (dr_0126, dr_0128, and dr_0129) under normal growth and heat stress conditions. The relative levels of transcripts are presented as the mean values ± standard deviations, calculated from three sets of independent experiments and normalized to levels in the wild-type strain. (B) Growth curves in TGY broth of wild type and ∆ dr_0127. The error bars represent the standard deviations of the measurements of three biological replicates. (C) Serial, 10-fold dilutions of OD-standardized D. radiodurans and three mutants (∆dr_0127, ∆dr_1083, and ∆dr_1325) spotted on TGY plates after exposure to 48 °C. CK, untreated culture control. All experiments were performed three times.
Ijms 20 05603 g005
Figure 6. Molecular response of D. radiodurans under high temperature conditions. Chaperones, RNA and DNA thermosensors, transcription induction and repression, sigma factors, catalase and redox active proteins, and hypothetical proteins regulate the molecular mechanism of the heat stress response in cells. Chaperones mediate the correct folding of other polypeptides, such as hsp20 and DnaK; RNA and DNA thermosensors sense the temperature change; transcription induction and repression is involved in heat stress regulation, such as by HspR; sigma factors (sig1 and sig 2) that control heat-shock regulons have evolved to respond to protein misfolding; and catalase and redox active proteins scavenge the ROS caused by high temperature. Solid arrows and dashed lines represent the known and unknown mechanisms, respectively.
Ijms 20 05603 g006
Table 1. The top 30 most upregulated and downregulated genes when exposed to heat stress (R48 versus R30).
Gene IDLog2 (Fold Change)p ValueFunction DescriptionReferences
DR_A008113.05480.02115134Hypothetical protein
DR_A00789.32310.01952321Hypothetical protein
DR_23078.52431.16 × 10−5Multidrug-efflux transporter, putative[10]
DR_05188.38530.00804687Hypothetical protein
DR_05248.18270.00604411Hypothetical protein
DR_A00827.85810.02528407Hypothetical protein
DR_A00797.7450.0212175Hypothetical protein
DR_A00807.67590.0183724Hypothetical protein
DR_A00837.45290.02027402Hypothetical protein
DR_A00867.37630.01788636Hypothetical protein
DR_05197.34050.00011836Hypothetical protein
DR_A01017.28570.0161855Hypothetical protein
DR_A00777.13260.01621666Hypothetical protein
DR_A00756.97080.04170709Transposase, putative
DR_A00876.55680.01613077Hypothetical protein
DR_B00726.08395.39 × 10−6Salicylate monooxygenase-related protein
DR_B00746.01647.87 × 10−71-Phosphofructokinase
DR_B00735.83931.1 × 10−5PTS system, fructose-specific IIBC component
DR_A00855.8330.02305785Hypothetical protein
DR_A02115.52364.38 × 10−6Transcriptional regulator, GntR family
DR_C00235.18832.24 × 10−5Hypothetical protein
DR_A00765.10690.02545438ATP-dependent target DNA activator
DR_B01415.05169 × 10−5HicB-related protein
DR_B01424.90775.11 × 10−5Hypothetical protein
DR_04224.85920.00024562Trans-aconitate 2-methyltransferase
DR_A01824.7990.00068635Hypothetical protein[13]
DR_05164.72890.00382339Hypothetical protein
DR_23744.68970.0005564Ribonucleoside-diphosphate reductase-related protein[13]
DR_05324.67350.00051046Hypothetical protein
DR_04234.51520.00011999Hypothetical protein
DR_A0364−4.30965.93 × 10−5Oxidoreductase, short-chain dehydrogenase/reductase family[13]
DR_0201−4.3210.00785386Hypothetical protein
DR_0392−4.33420.00434331Hypothetical protein[10]
DR_0334−4.35720.01241591Lipase, putative
DR_B0038−4.35730.01463299Hypothetical protein
DR_A0352−4.36620.00155047Methyl-accepting chemotaxis protein
DR_2240−4.39420.00195473Hypothetical protein
DR_2527−4.42730.00068251Hypothetical protein[10]
DR_A0233−4.43611.05 × 10−5Oxidoreductase, iron-sulfur subunit[13]
DR_1987−4.49983.18 × 10−6Hypothetical protein
DR_A0231−4.51690.00510755Oxidoreductase[13]
DR_1778−4.52770.000165053-Isopropylmalate dehydratase, large subunit
DR_2263−4.53386.47 × 10−8DNA-binding stress response protein, Dps family[10]
DR_2563−4.62470.00080366Hypothetical protein
DR_1712−4.72840.00739225Extracellular solute-binding protein, family 5[13]
DR_A0232−4.72890.00081206Oxidoreductase
DR_1277−4.77540.01673083ABC transporter, periplasmic substrate-binding protein, putative
DR_1711−4.82640.00028517N-Acyl-L-amino acid amidohydrolase
DR_1067−4.83055.2 × 10−6Hypothetical protein
DR_0791−4.95220.00226901Chloride peroxidase, putative
DR_0644−5.42710.00078552Hypothetical protein
DR_2560−5.45660.0002672Hypothetical protein
DR_1315−5.47430.00327873Hypothetical protein[10,13]
DR_0105−5.48931.54 × 10−6Hypothetical protein
DR_1066−5.67130.02719424Hypothetical protein
DR_1483−5.80090.00071264Hypothetical protein
DR_1790−5.82181.62 × 10−6Yellow-related protein
DR_0465−5.83420.00052829Conserved hypothetical protein
DR_1314−6.17490.00281391Conserved hypothetical protein[10]
DR_0891−6.46350.00113242DNA-binding response regulator
Note: the previously reported genes involved in heat stress are indicated in bold font.
Table 2. Descriptions of the 16 genes with altered expression in cells recovered from heat stress compared with non-stressed cells (RH versus R30).
Gene IDGene NameFunctionsLog2(Fold Change)p Value
DR_A0101 Hypothetical protein6.78070.00190534
DR_0128grpEProtein turnover and chaperone function−3.18120.00160996
DR_0349lonProtein turnover and chaperone function−3.50870.00188947
DR_0607groELProtein turnover and chaperone function−3.51020.00128474
DR_0129dnaKProtein turnover and chaperone function−3.91690.04542787
DR_0985 Protein turnover and chaperone function−4.13460.00249103
DR_1046clpBProtein turnover and chaperone function−4.44670.01832036
DR_0606groESProtein turnover and chaperone function−3.34890.00035202
DR_0127 DNA-binding protein−3.03220.00135957
DR_1083 Hypothetical protein−3.13334.23 × 10−5
DR_1325 LysM peptidoglycan-binding protein−3.36230.00886153
DR_2311 Nucleotide metabolism and transport function−4.39499.48 × 10−5
DR_2312 Nucleotide metabolism and transport function−4.24041.03 × 10−6
DR_1501 Energy production and conversion−3.13520.00033852
DR_0693 Membrane transport−3.72090.00754623
DR_1042padRTranscription−3.04671.6 × 10−5

