Involvement of Progranulin and Granulin Expression in Inflammatory Responses after Cerebral Ischemia

 and
and 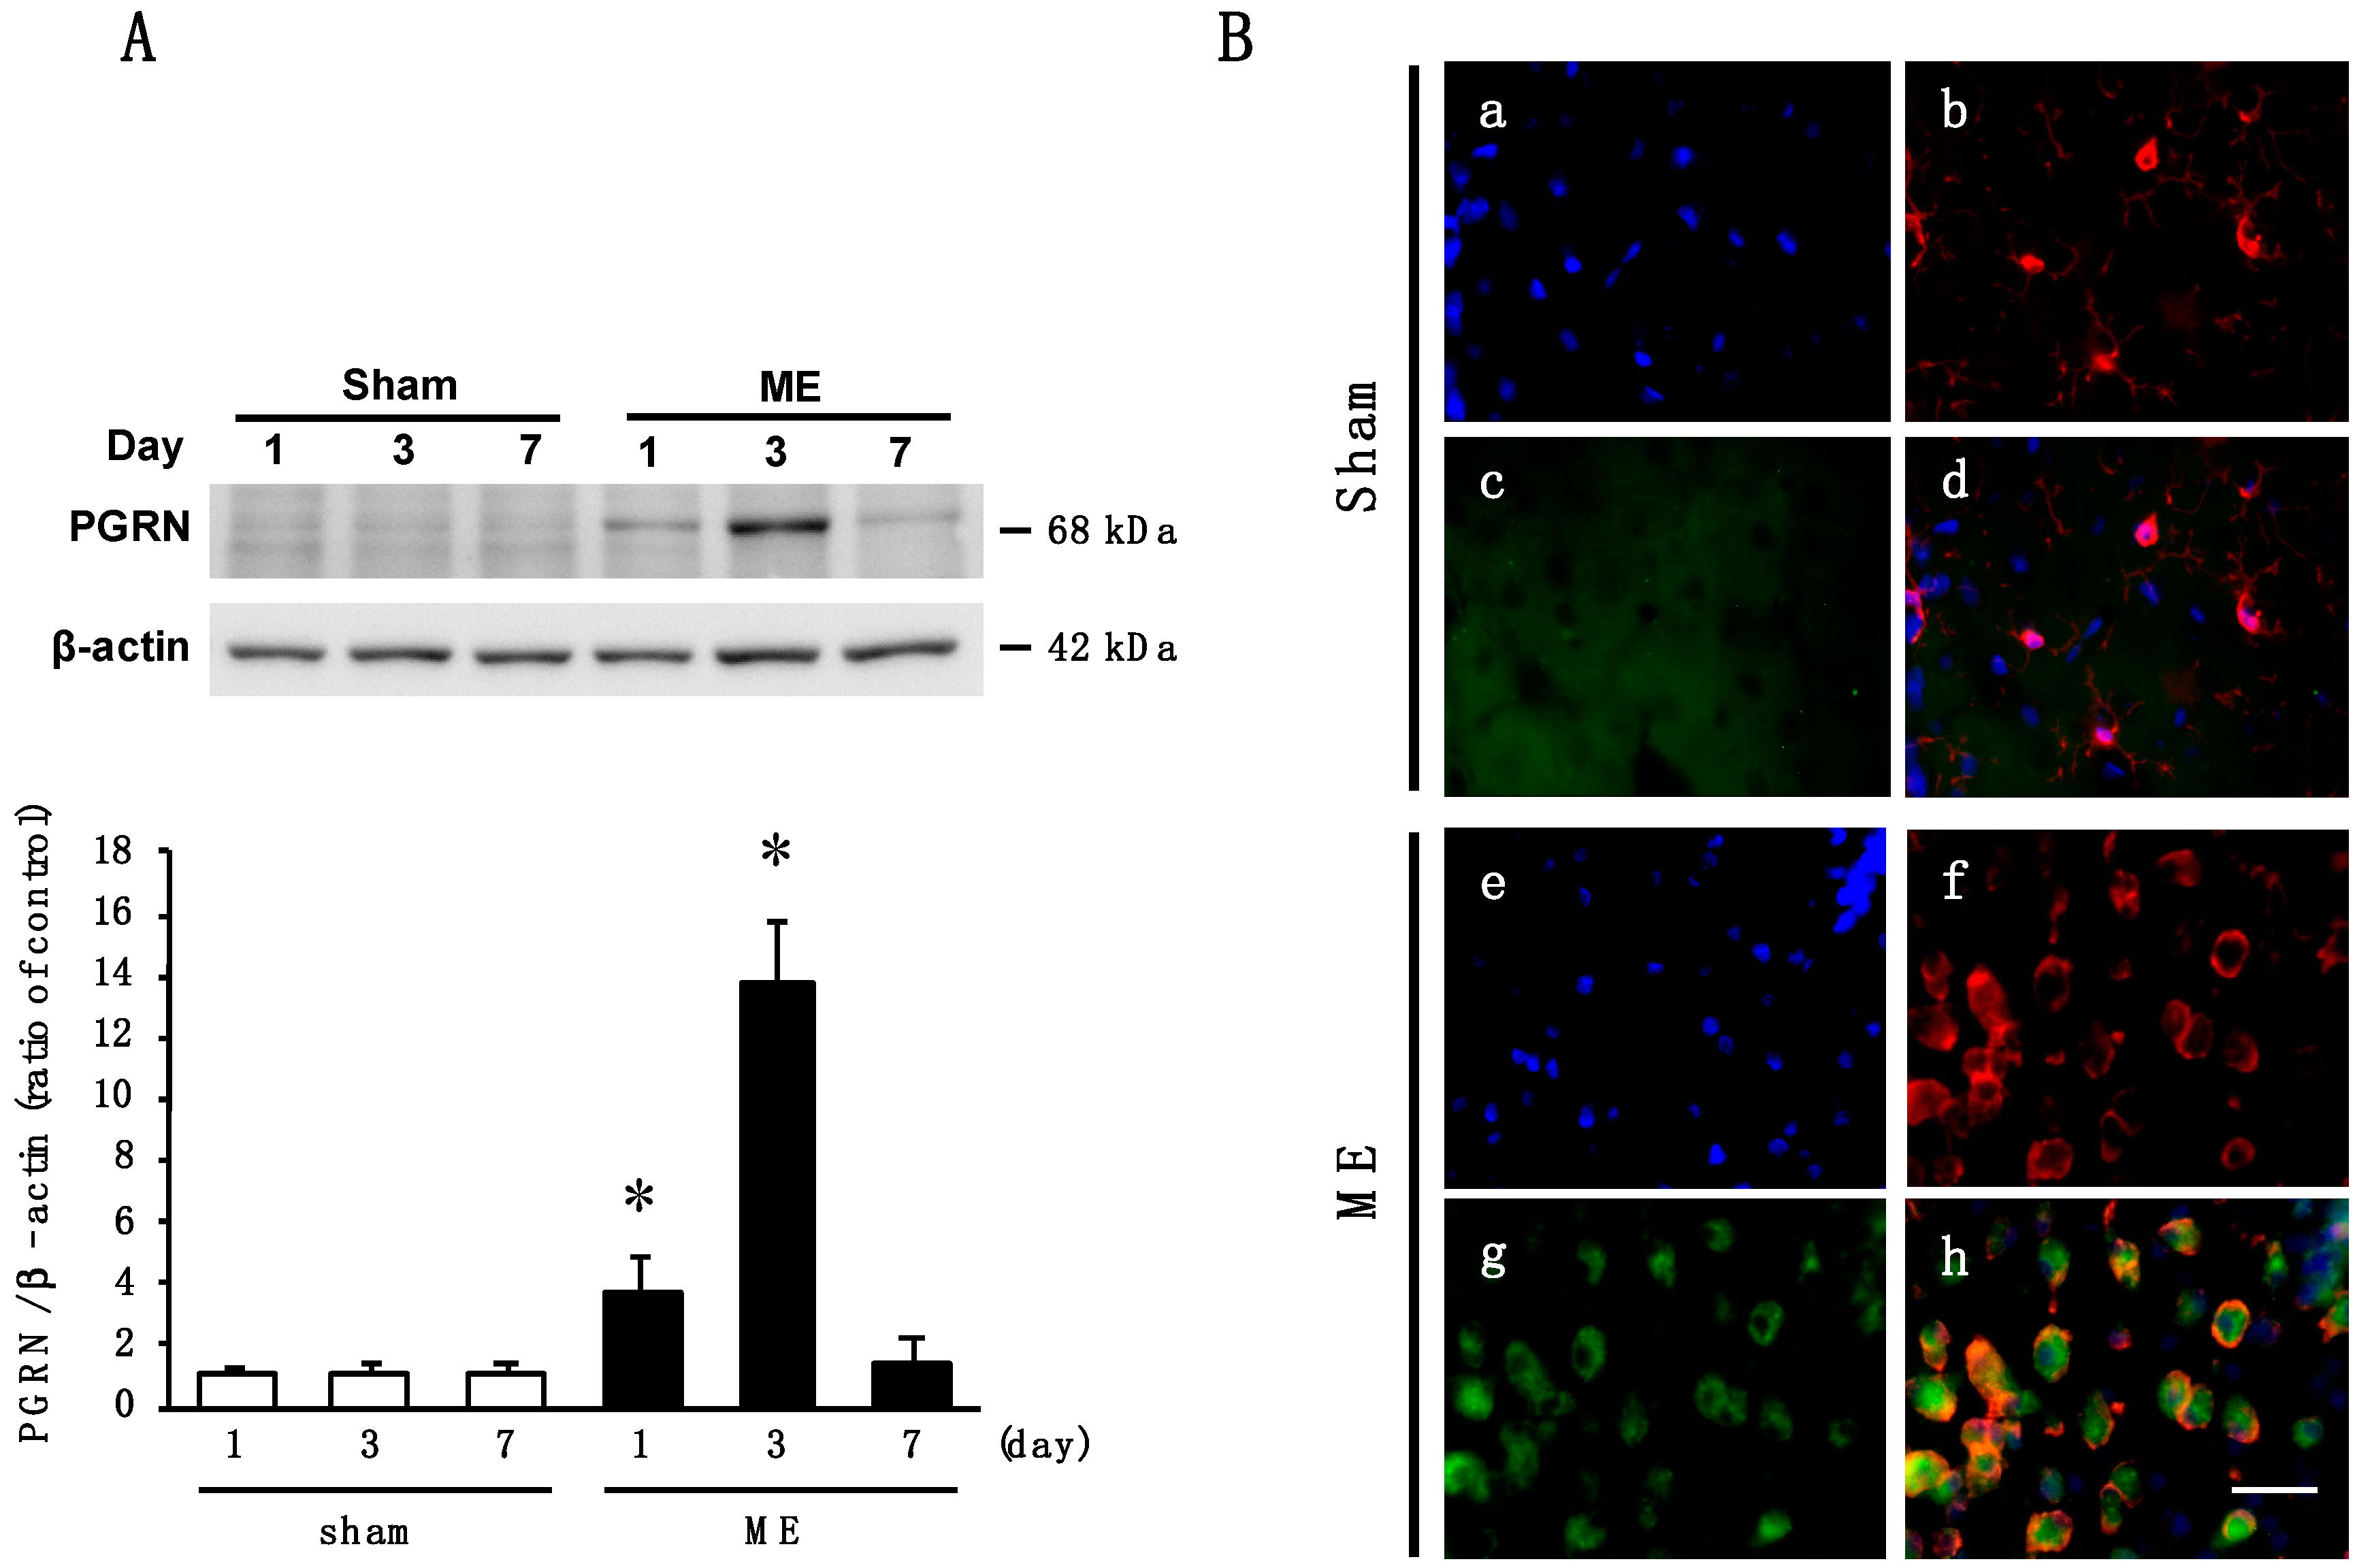
Abstract
:1. Introduction
2. Results
2.1. Time Course of Changes in the Level and Cellular Source of PGRN after Cerebral Ischemia
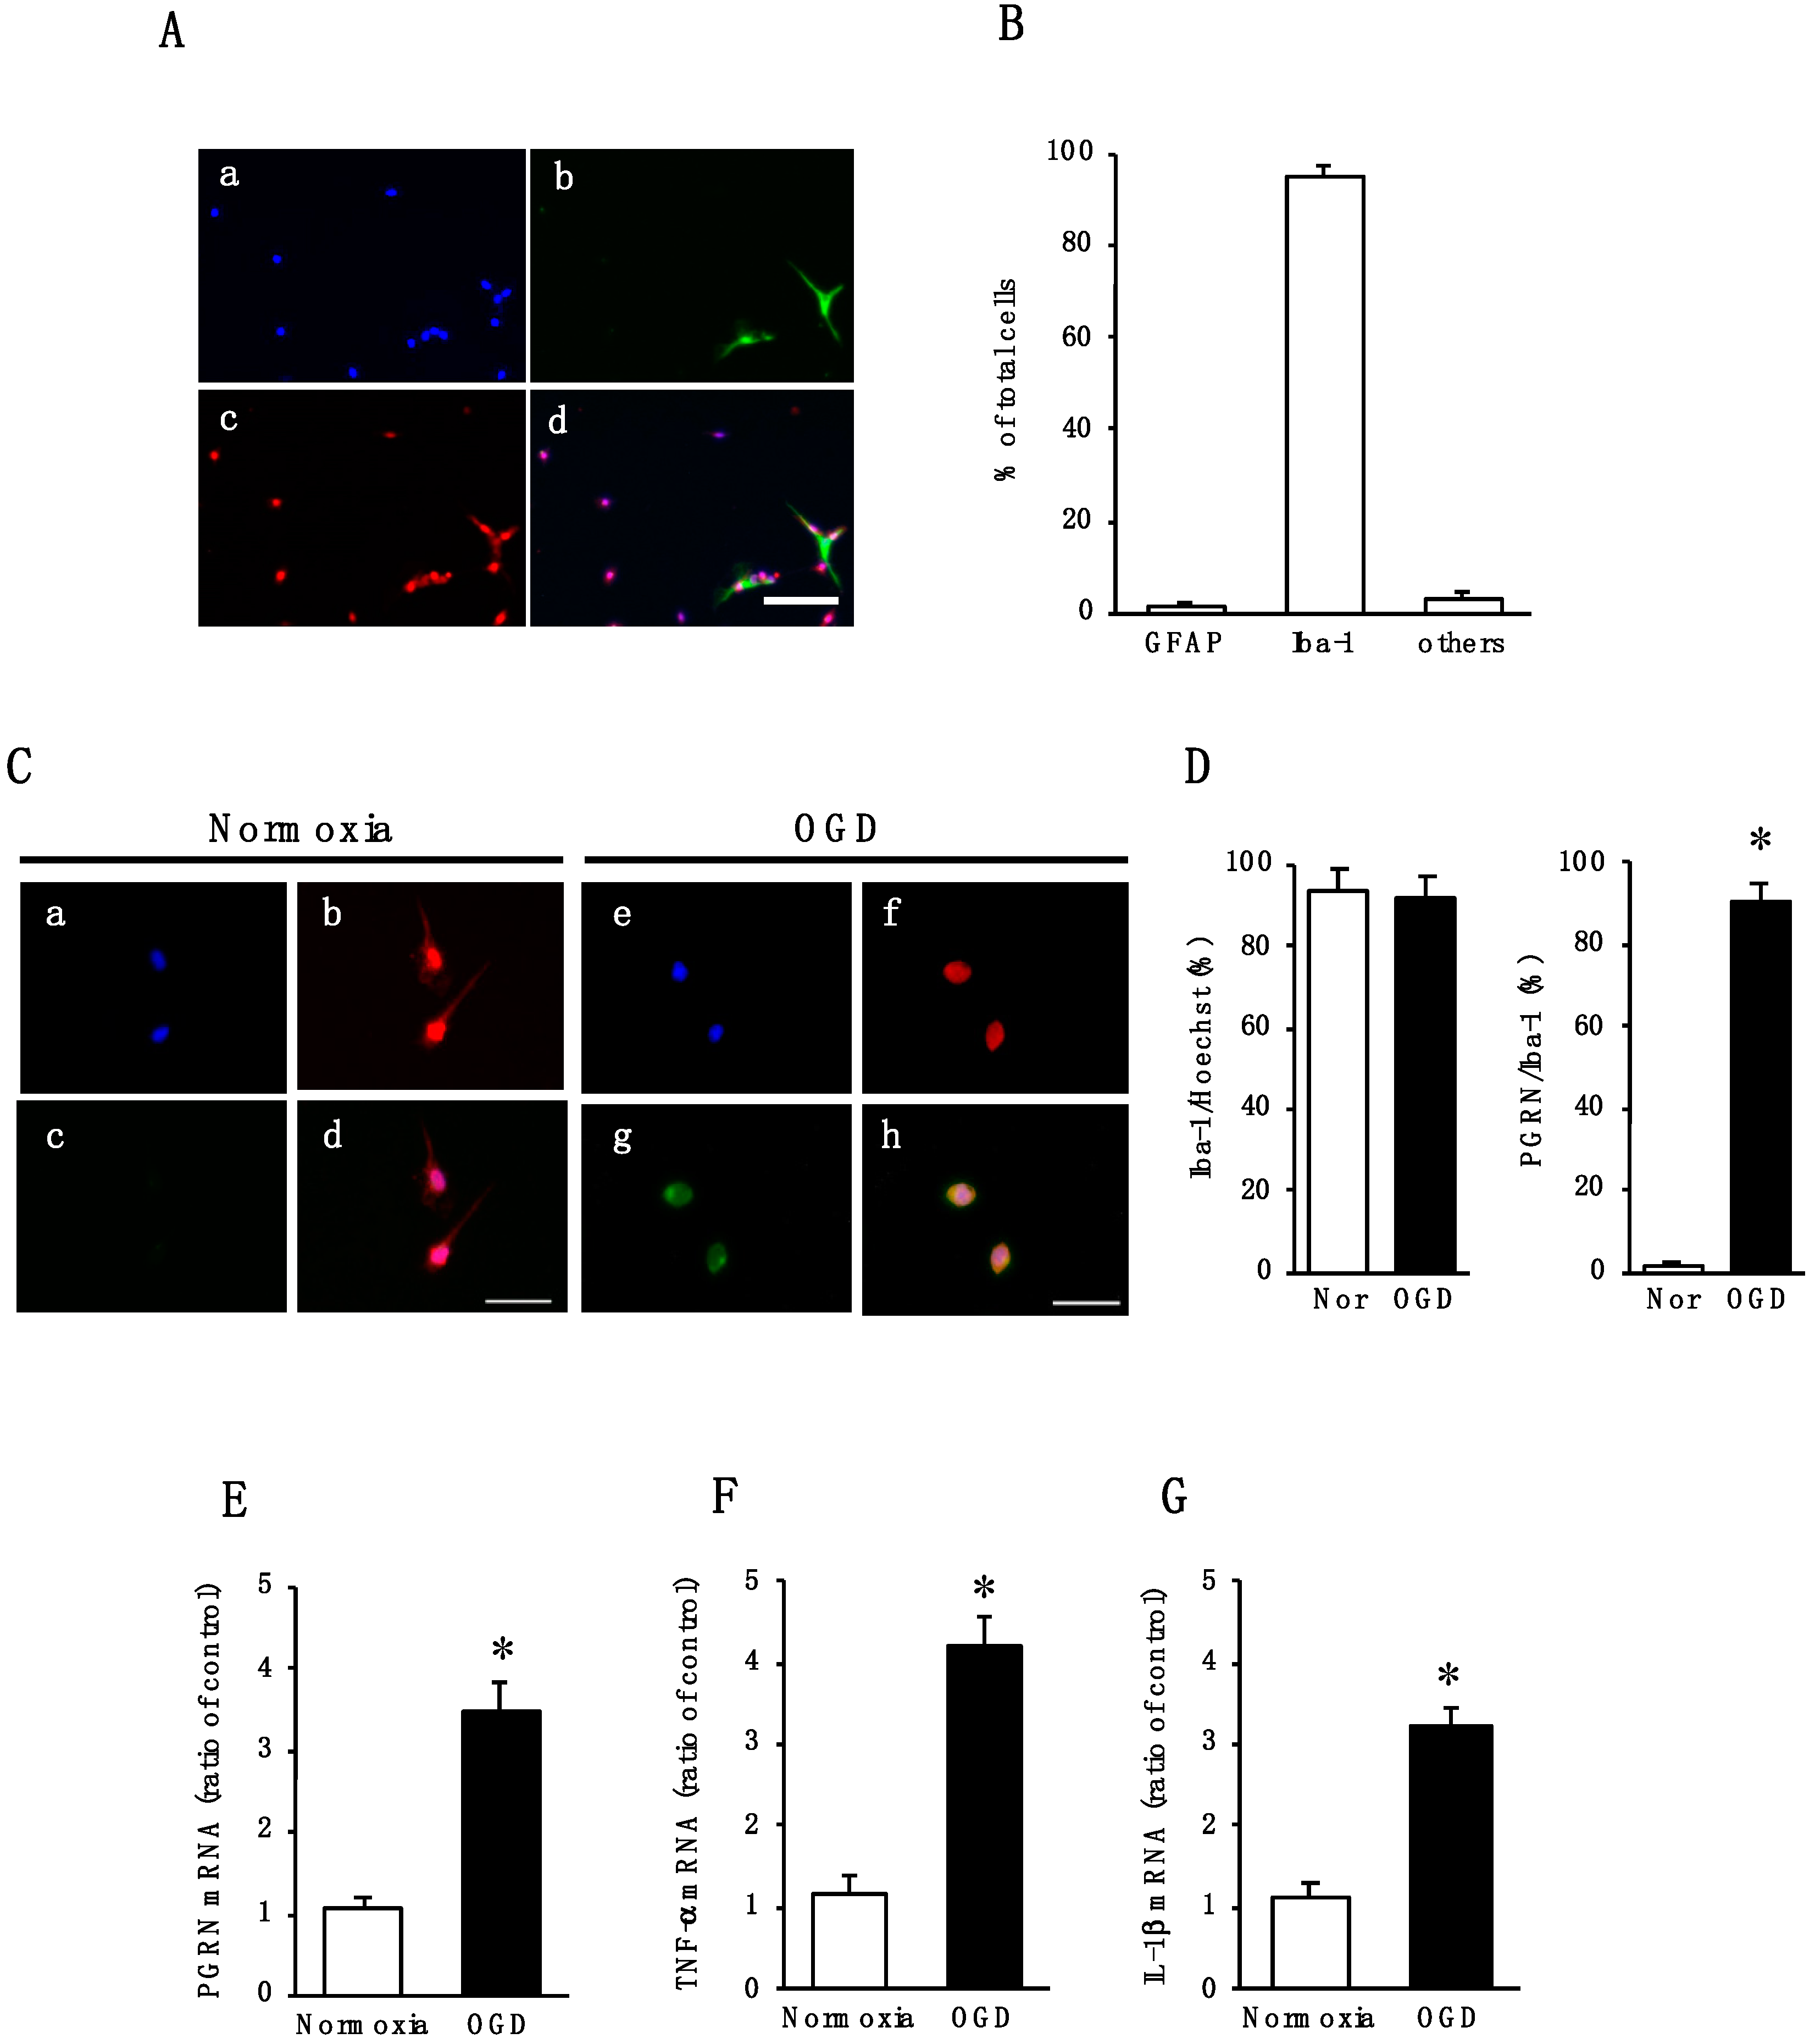
2.2. Effect of Oxygen/Glucose Deprivation (OGD) on mRNA Levels of PGRN, TNF-α, and IL-1β in Cultured Microglia
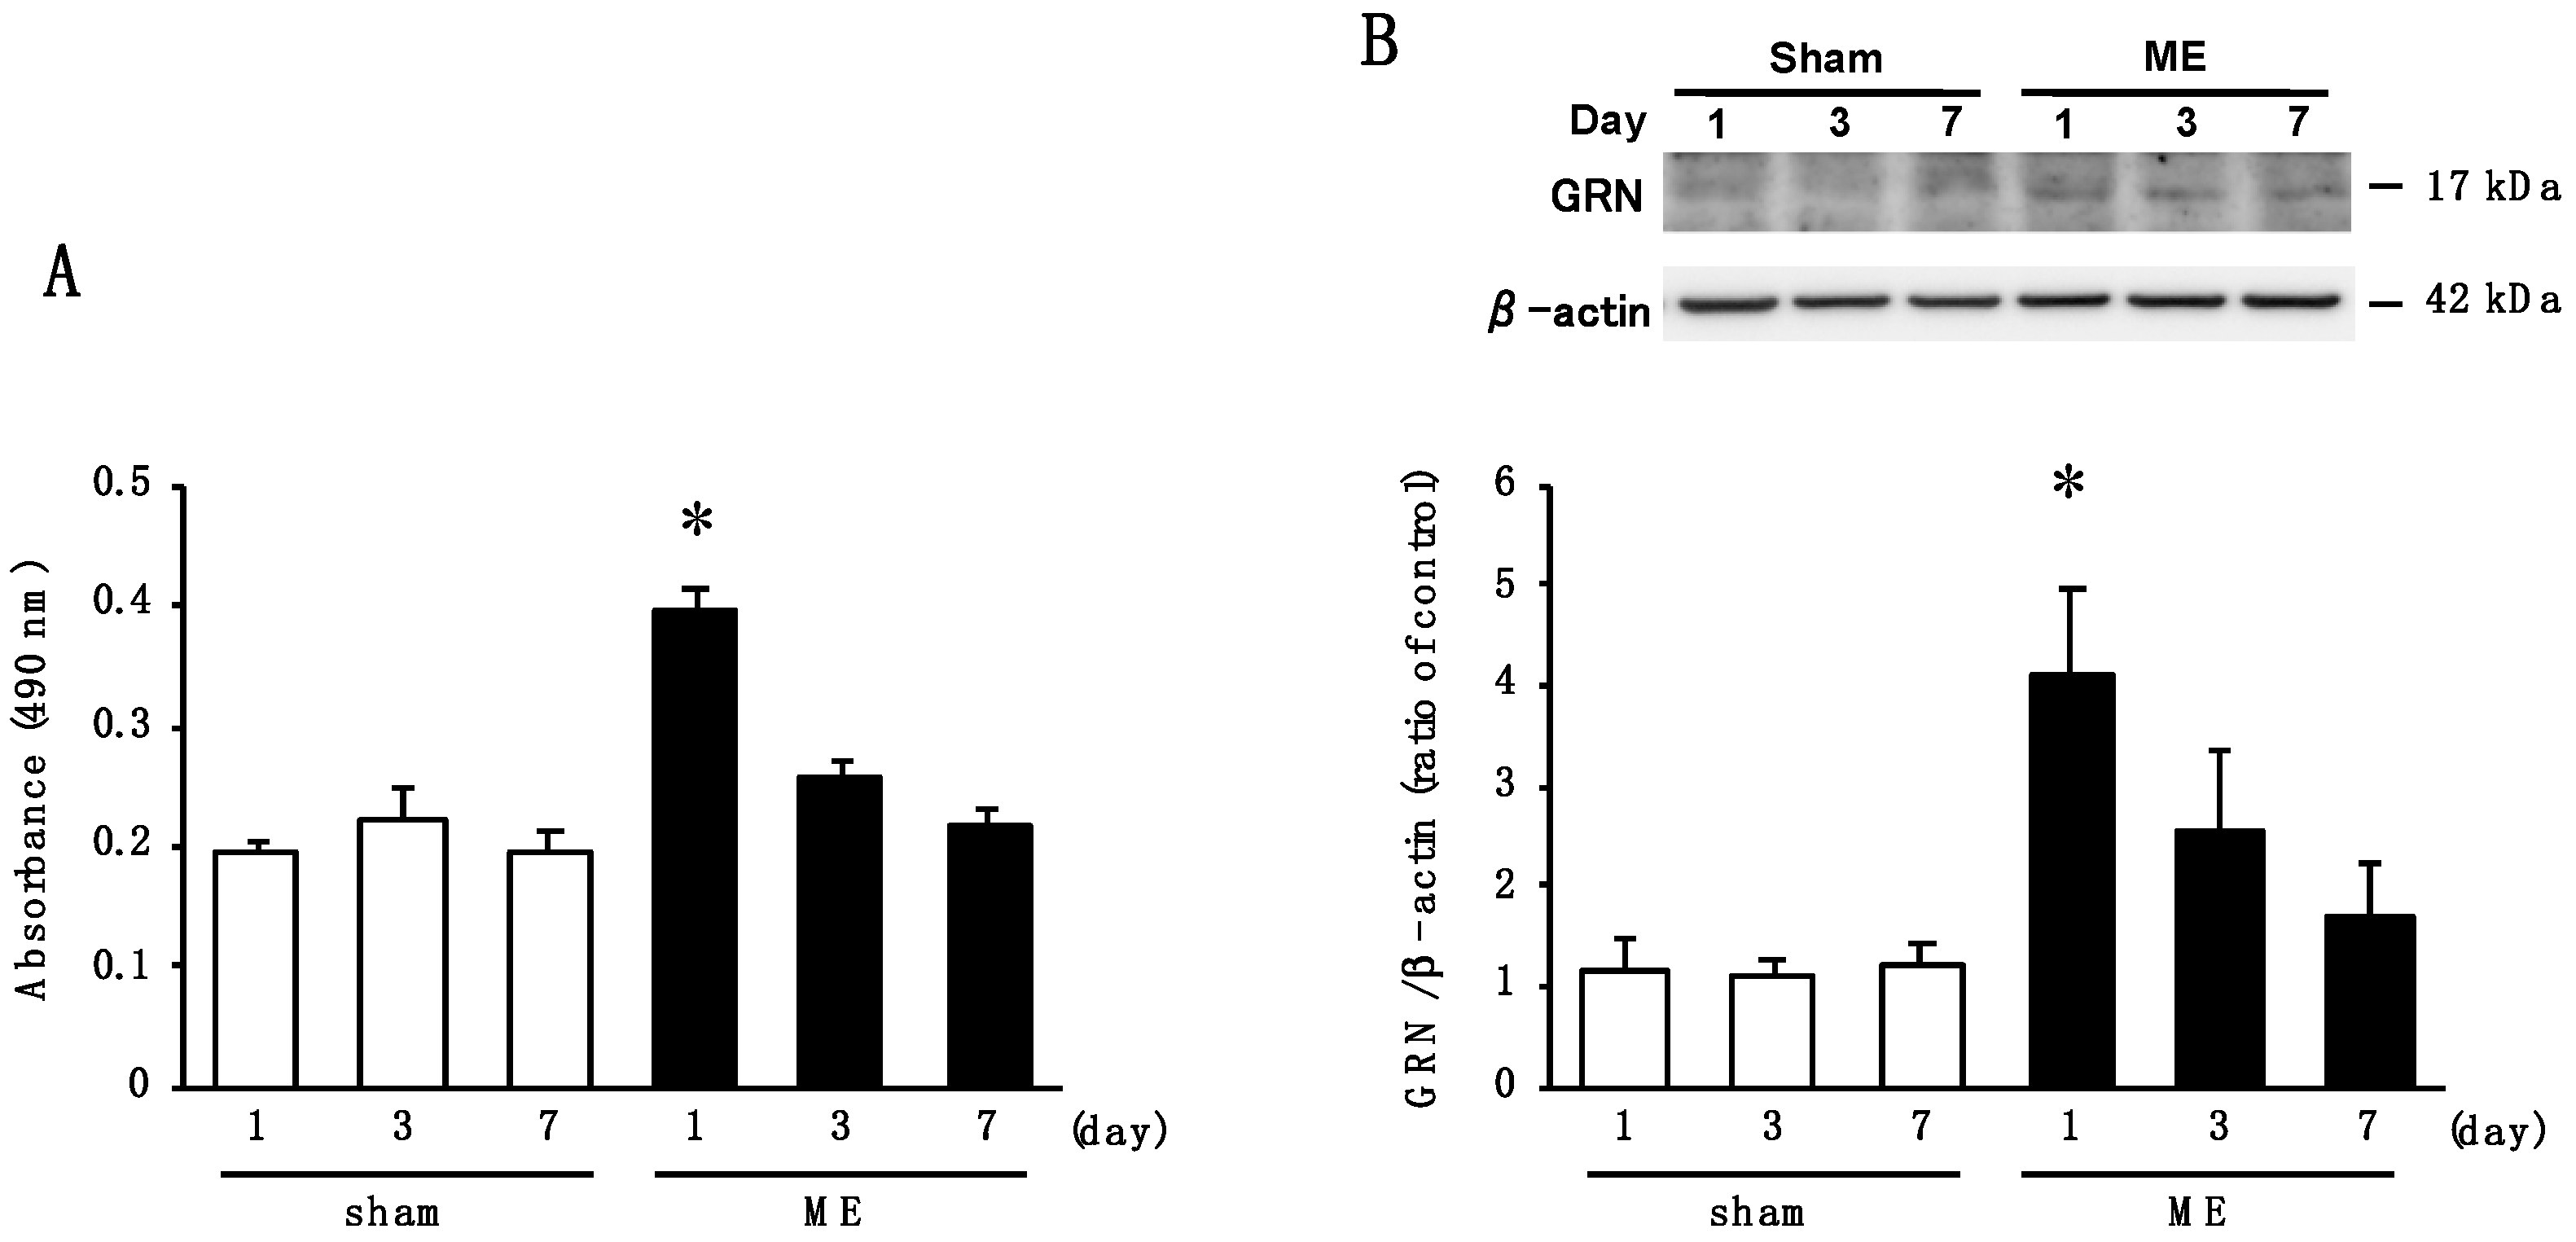
2.3. Time Course of Changes in Activity of Elastase and the Level of GRN after Cerebral Ischemia
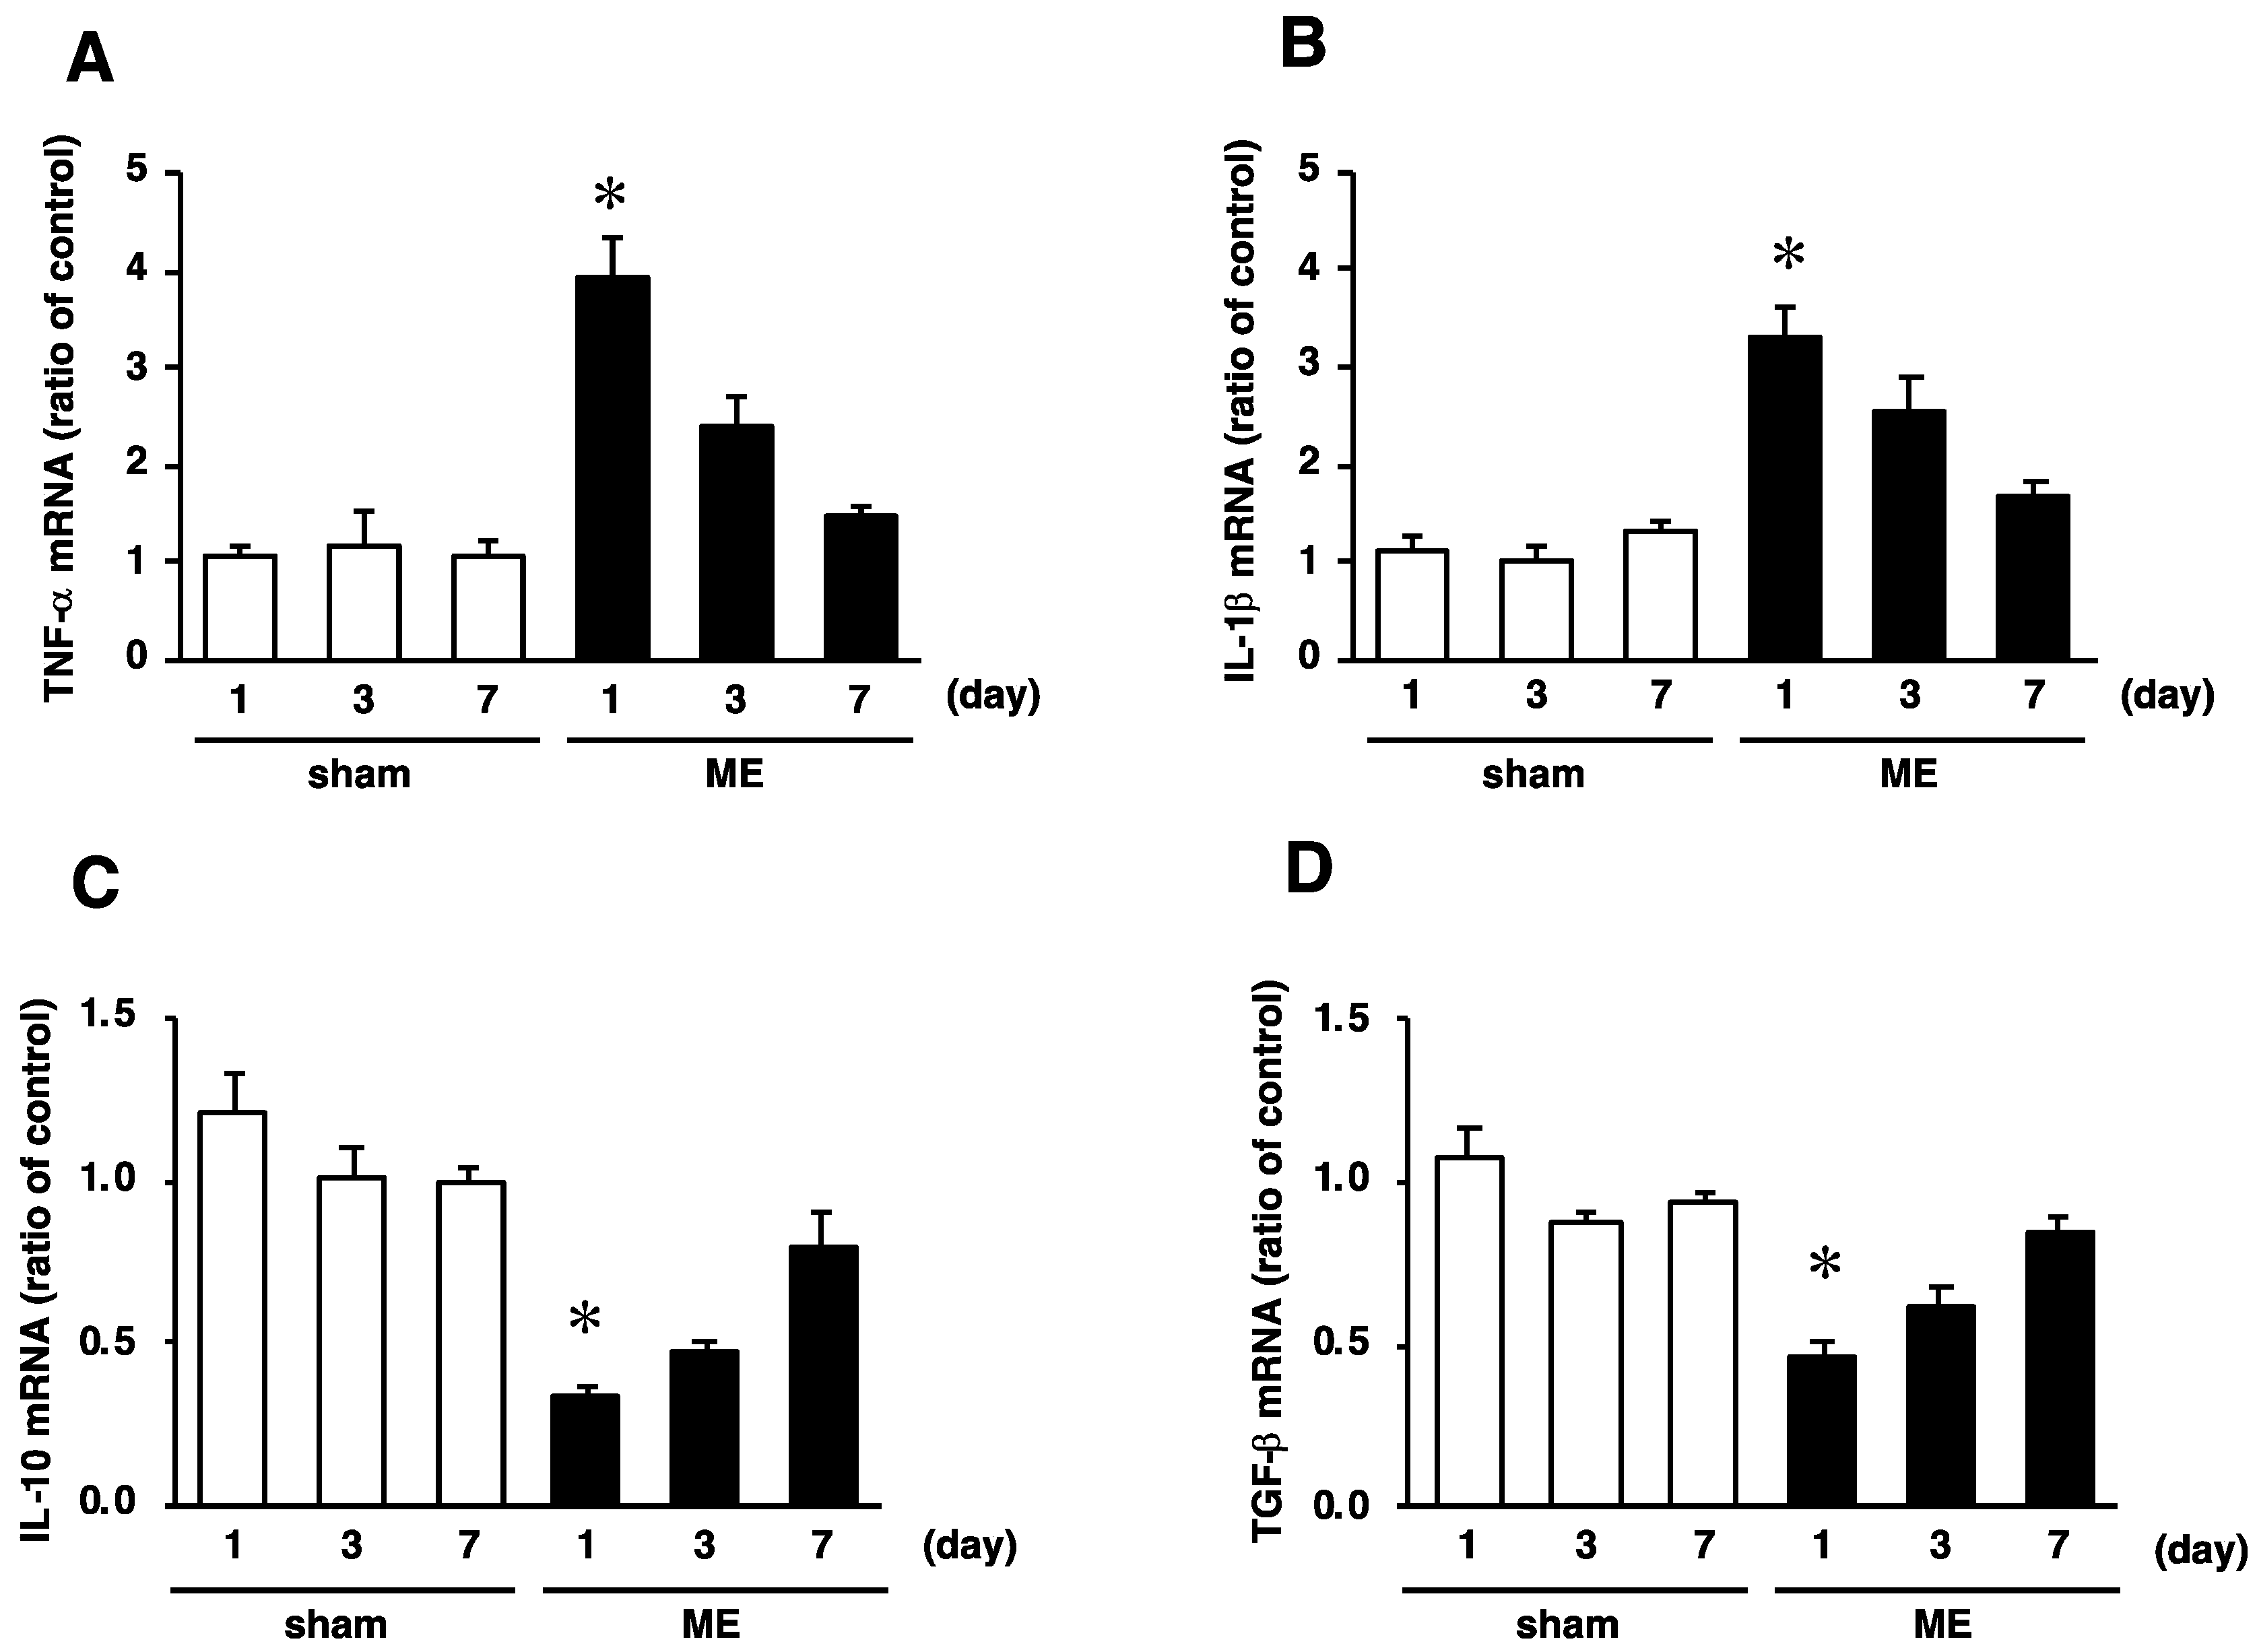
2.4. Time Course of Changes in mRNA Levels of TNF−α, IL-1β, IL-10, and TGF-β after Cerebral Ischemia
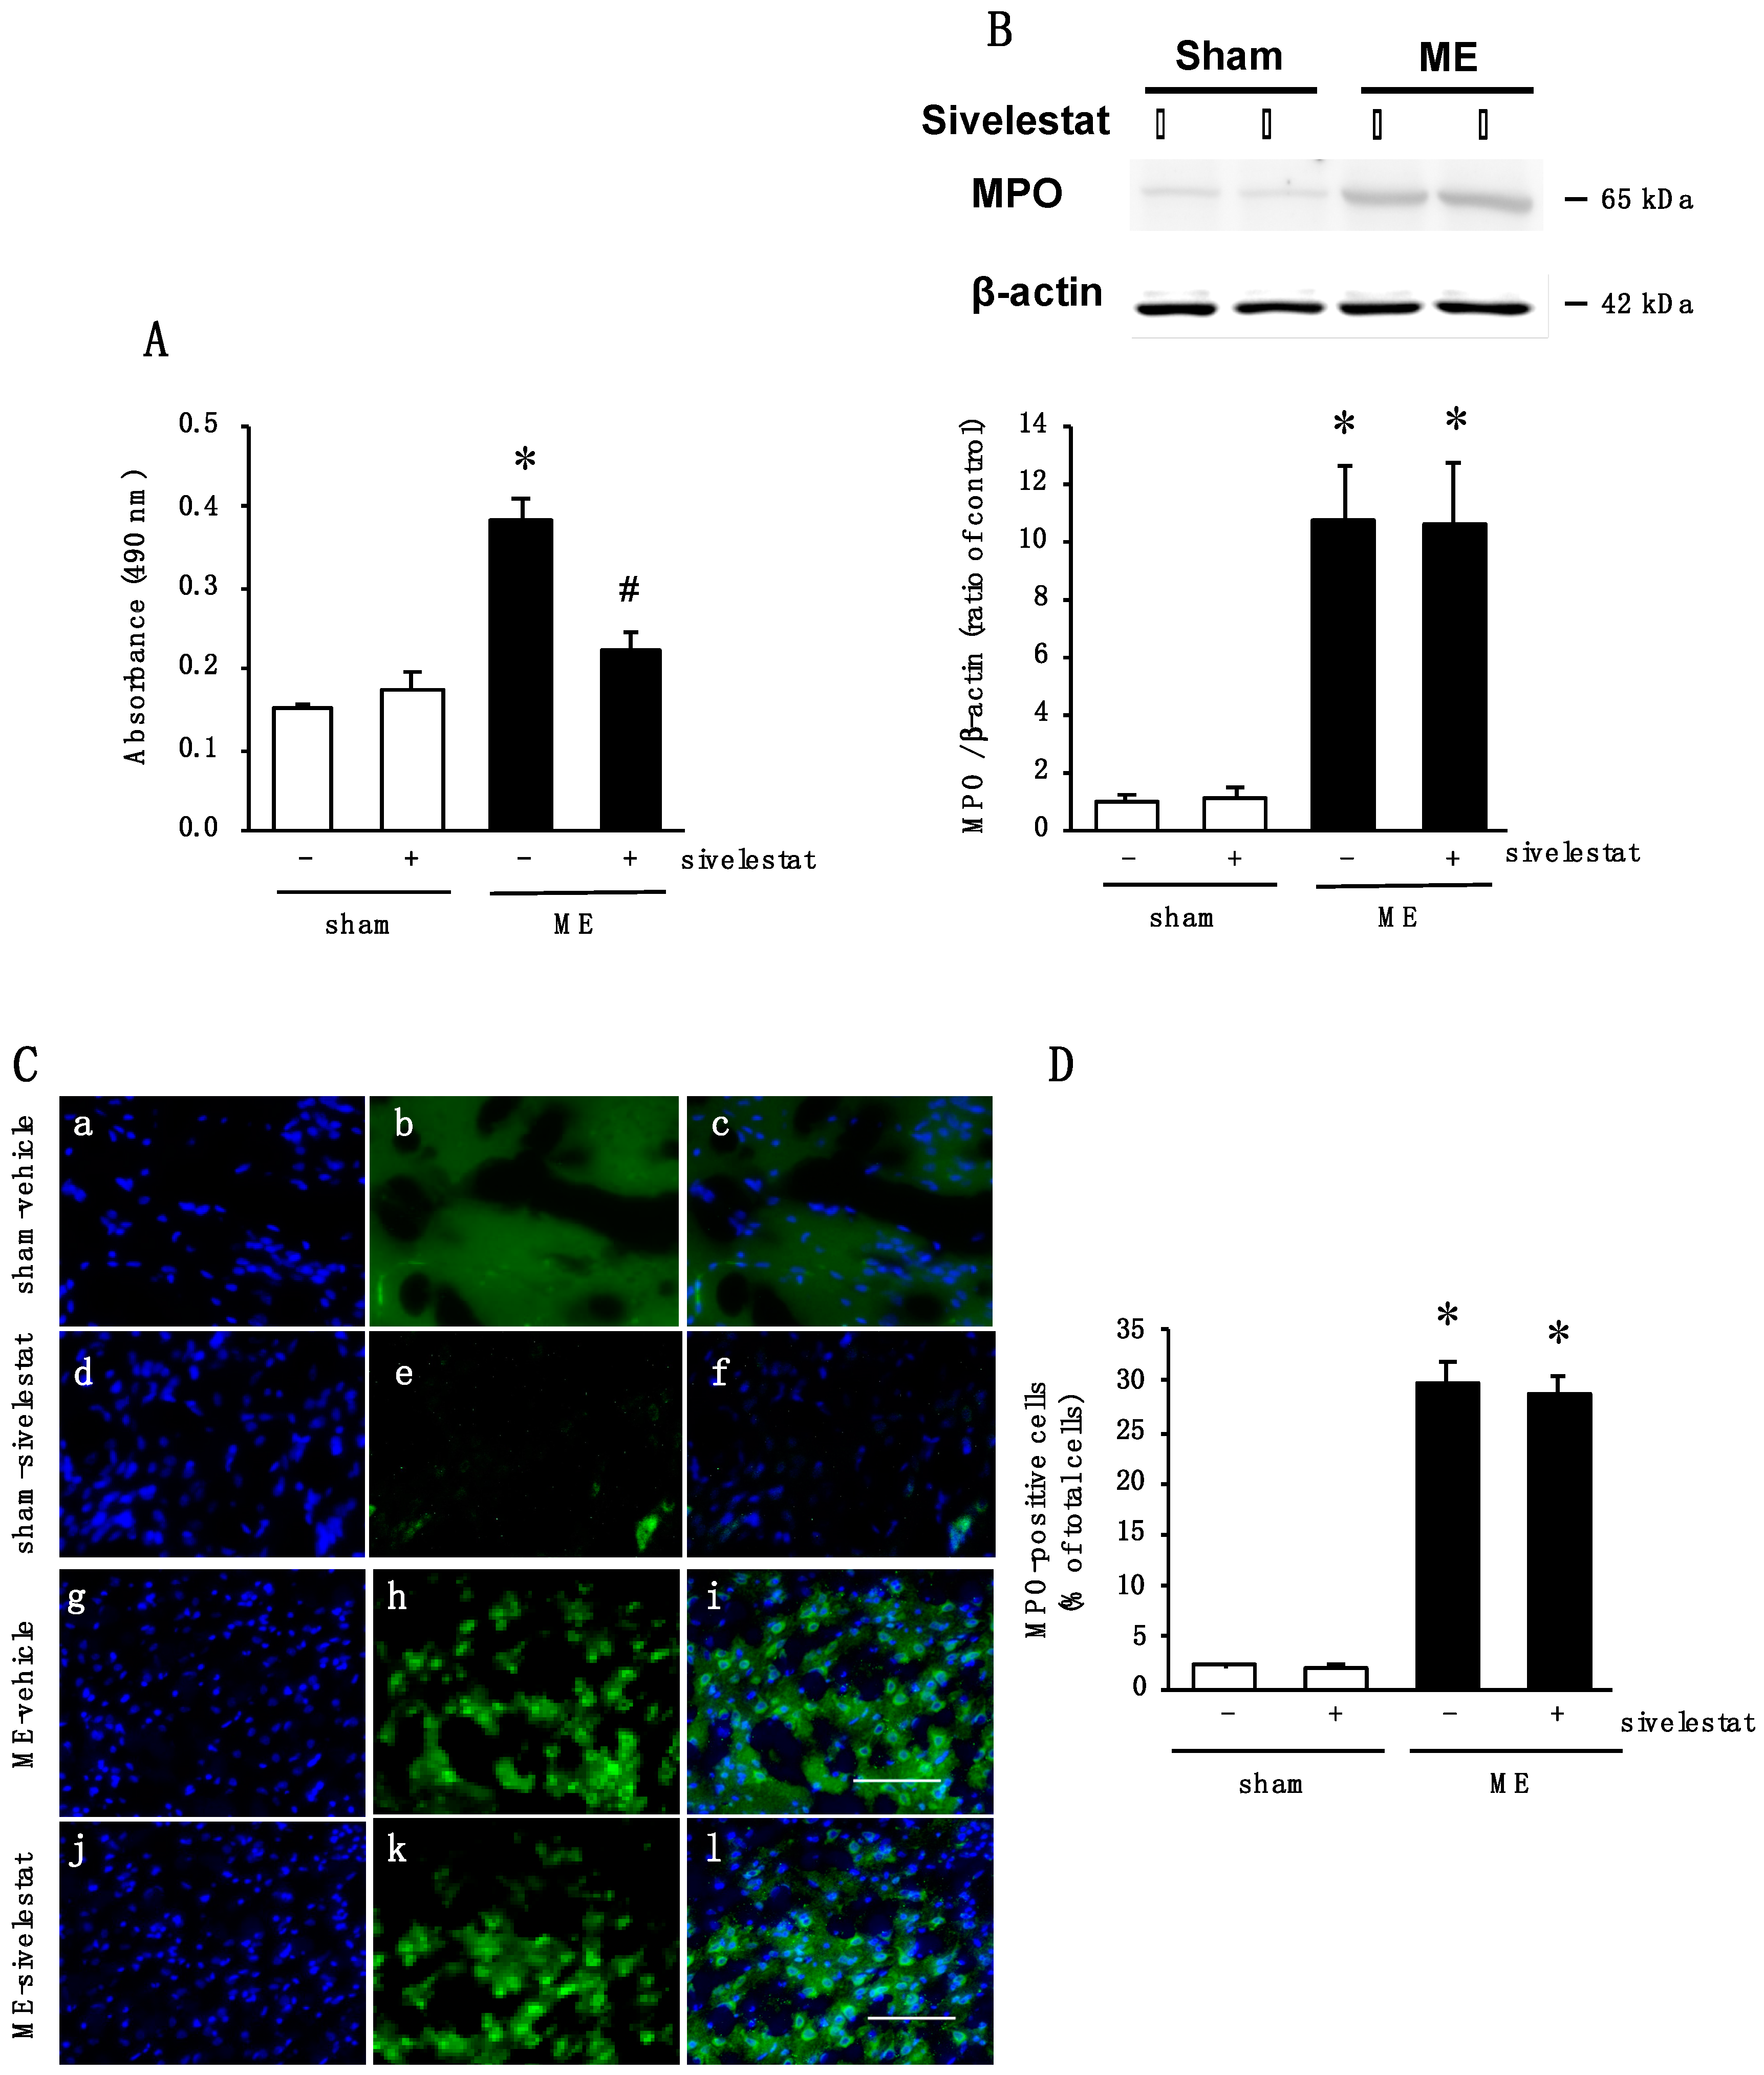
2.5. Effect of Elastase Inhibitor on Elastase Activity and on Neutrophil Infiltration after Cerebral Ischemia
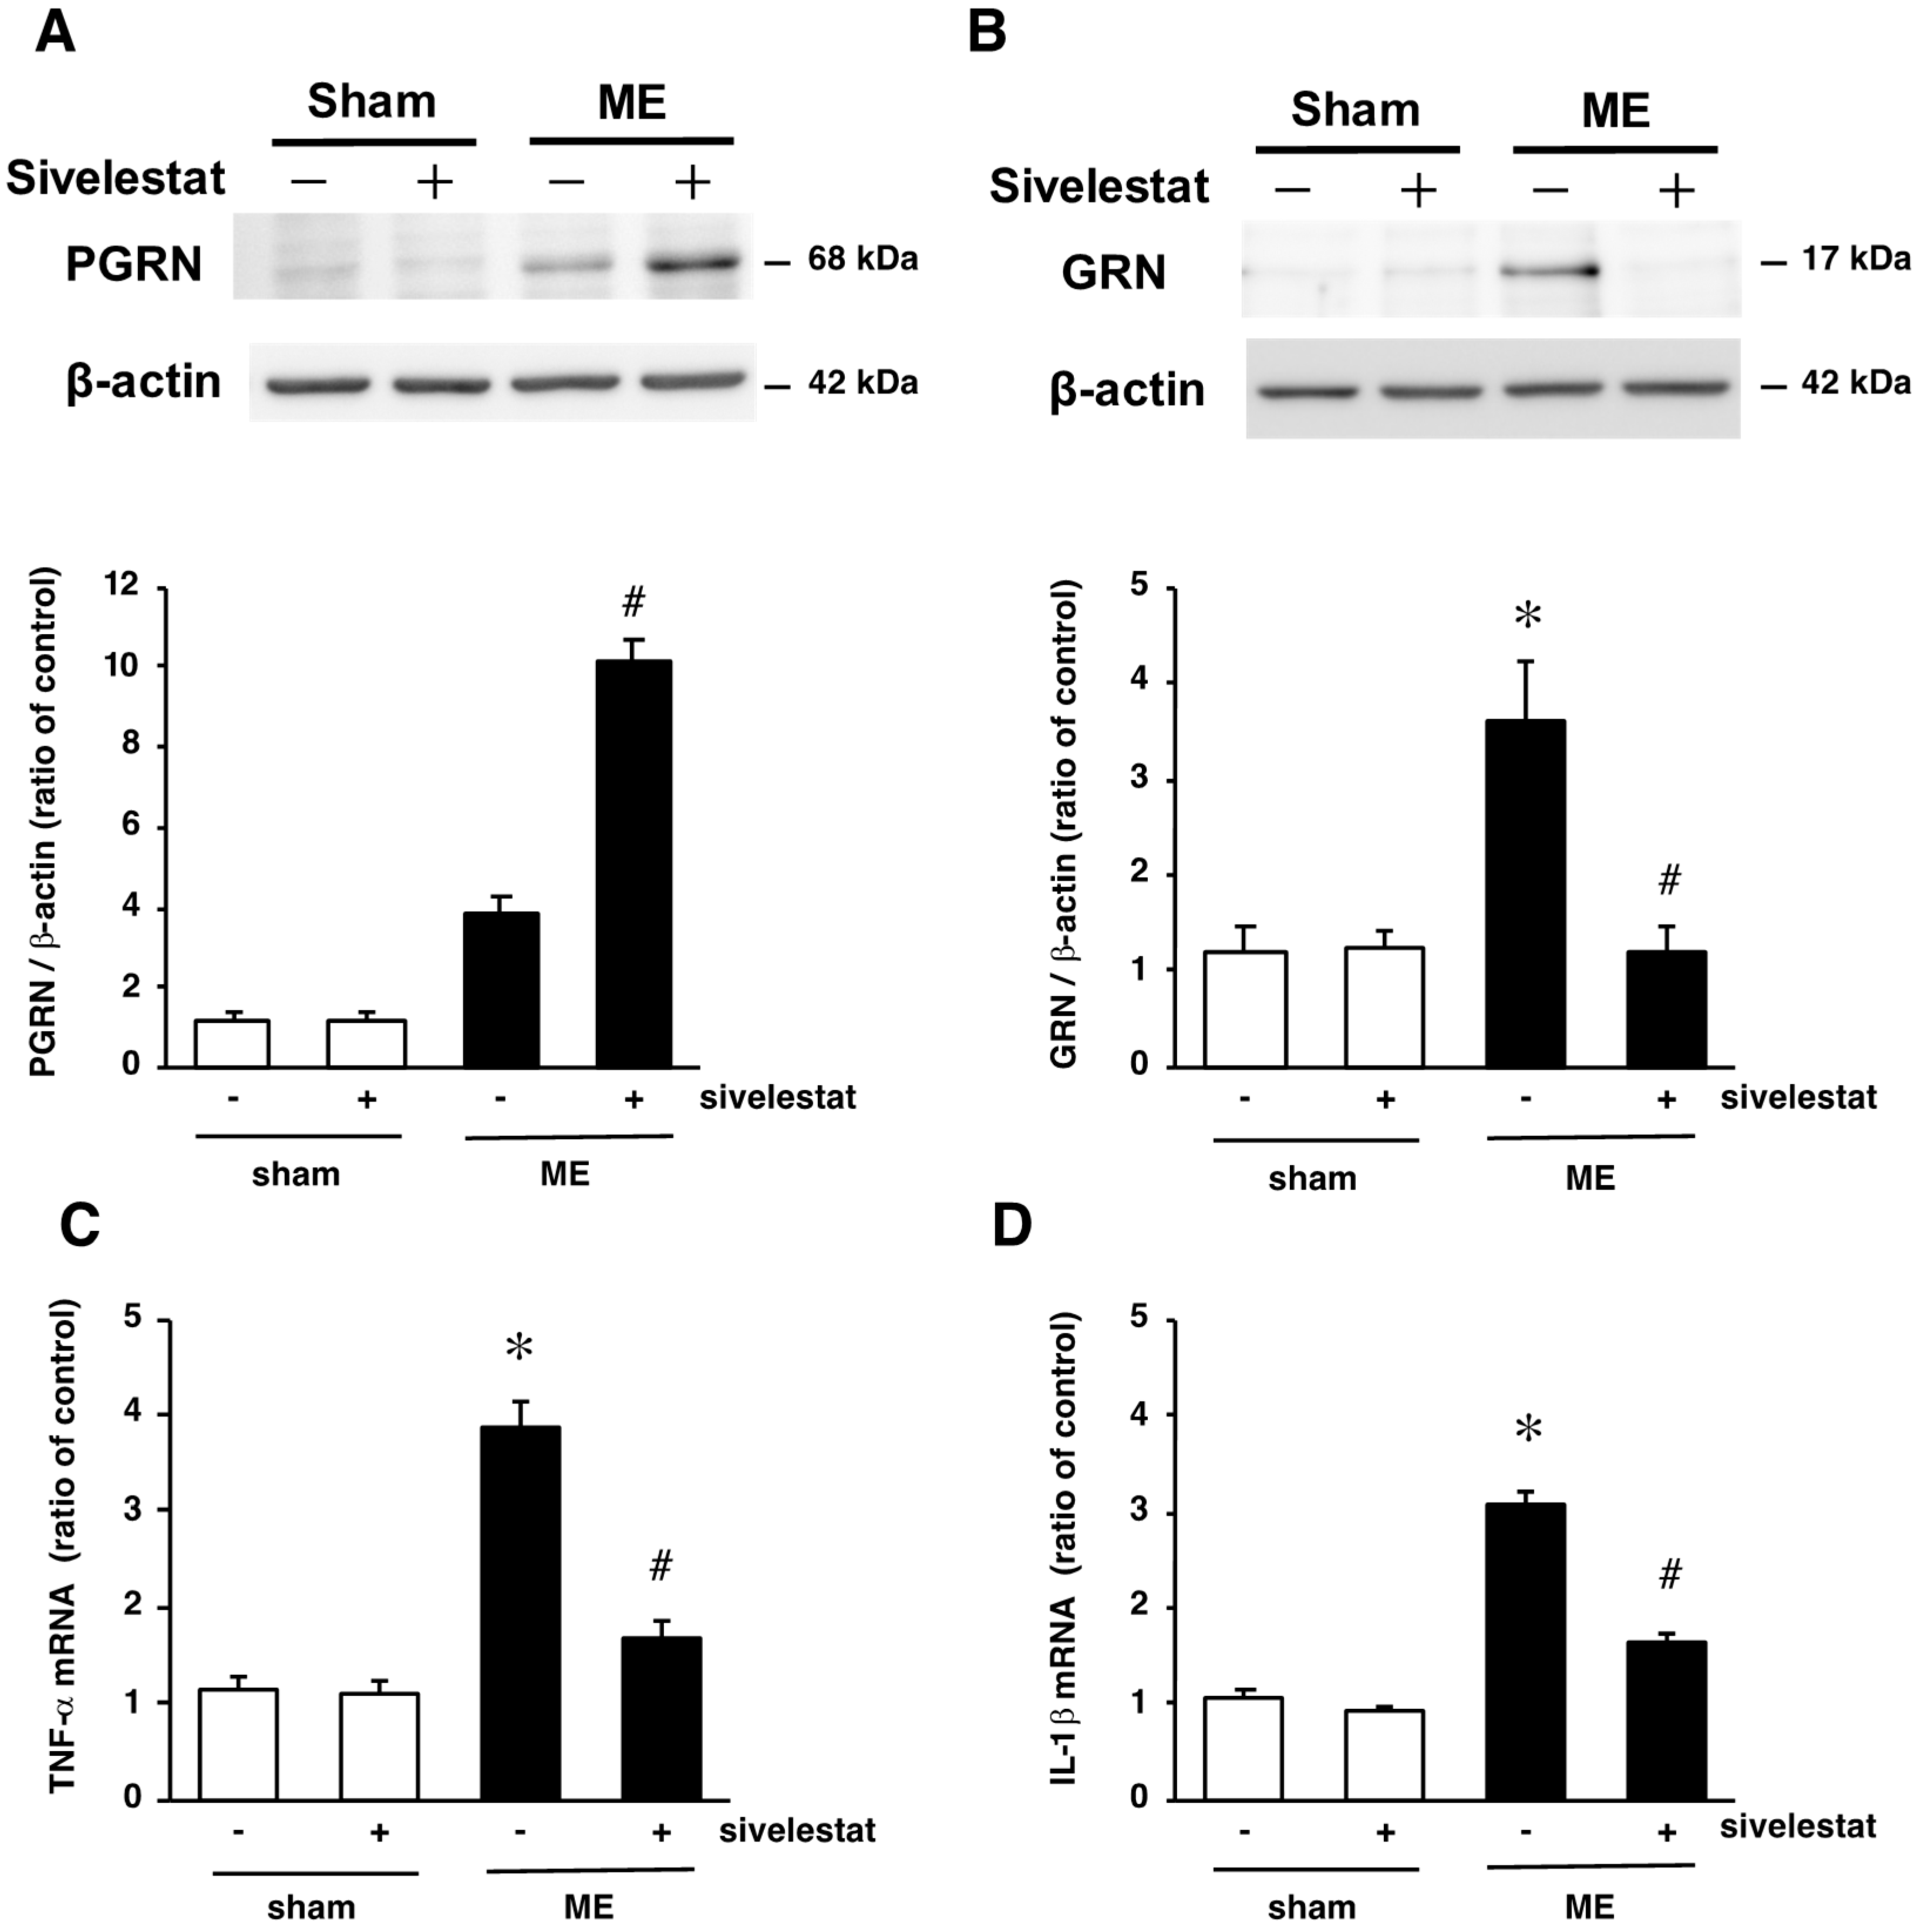
2.6. Effect of Elastase Inhibitor on the Levels PGRN and GRN Protein Levels and on mRNA Levels of Inflammatory Cytokines TNF-α and IL-1β after Cerebral Ischemia
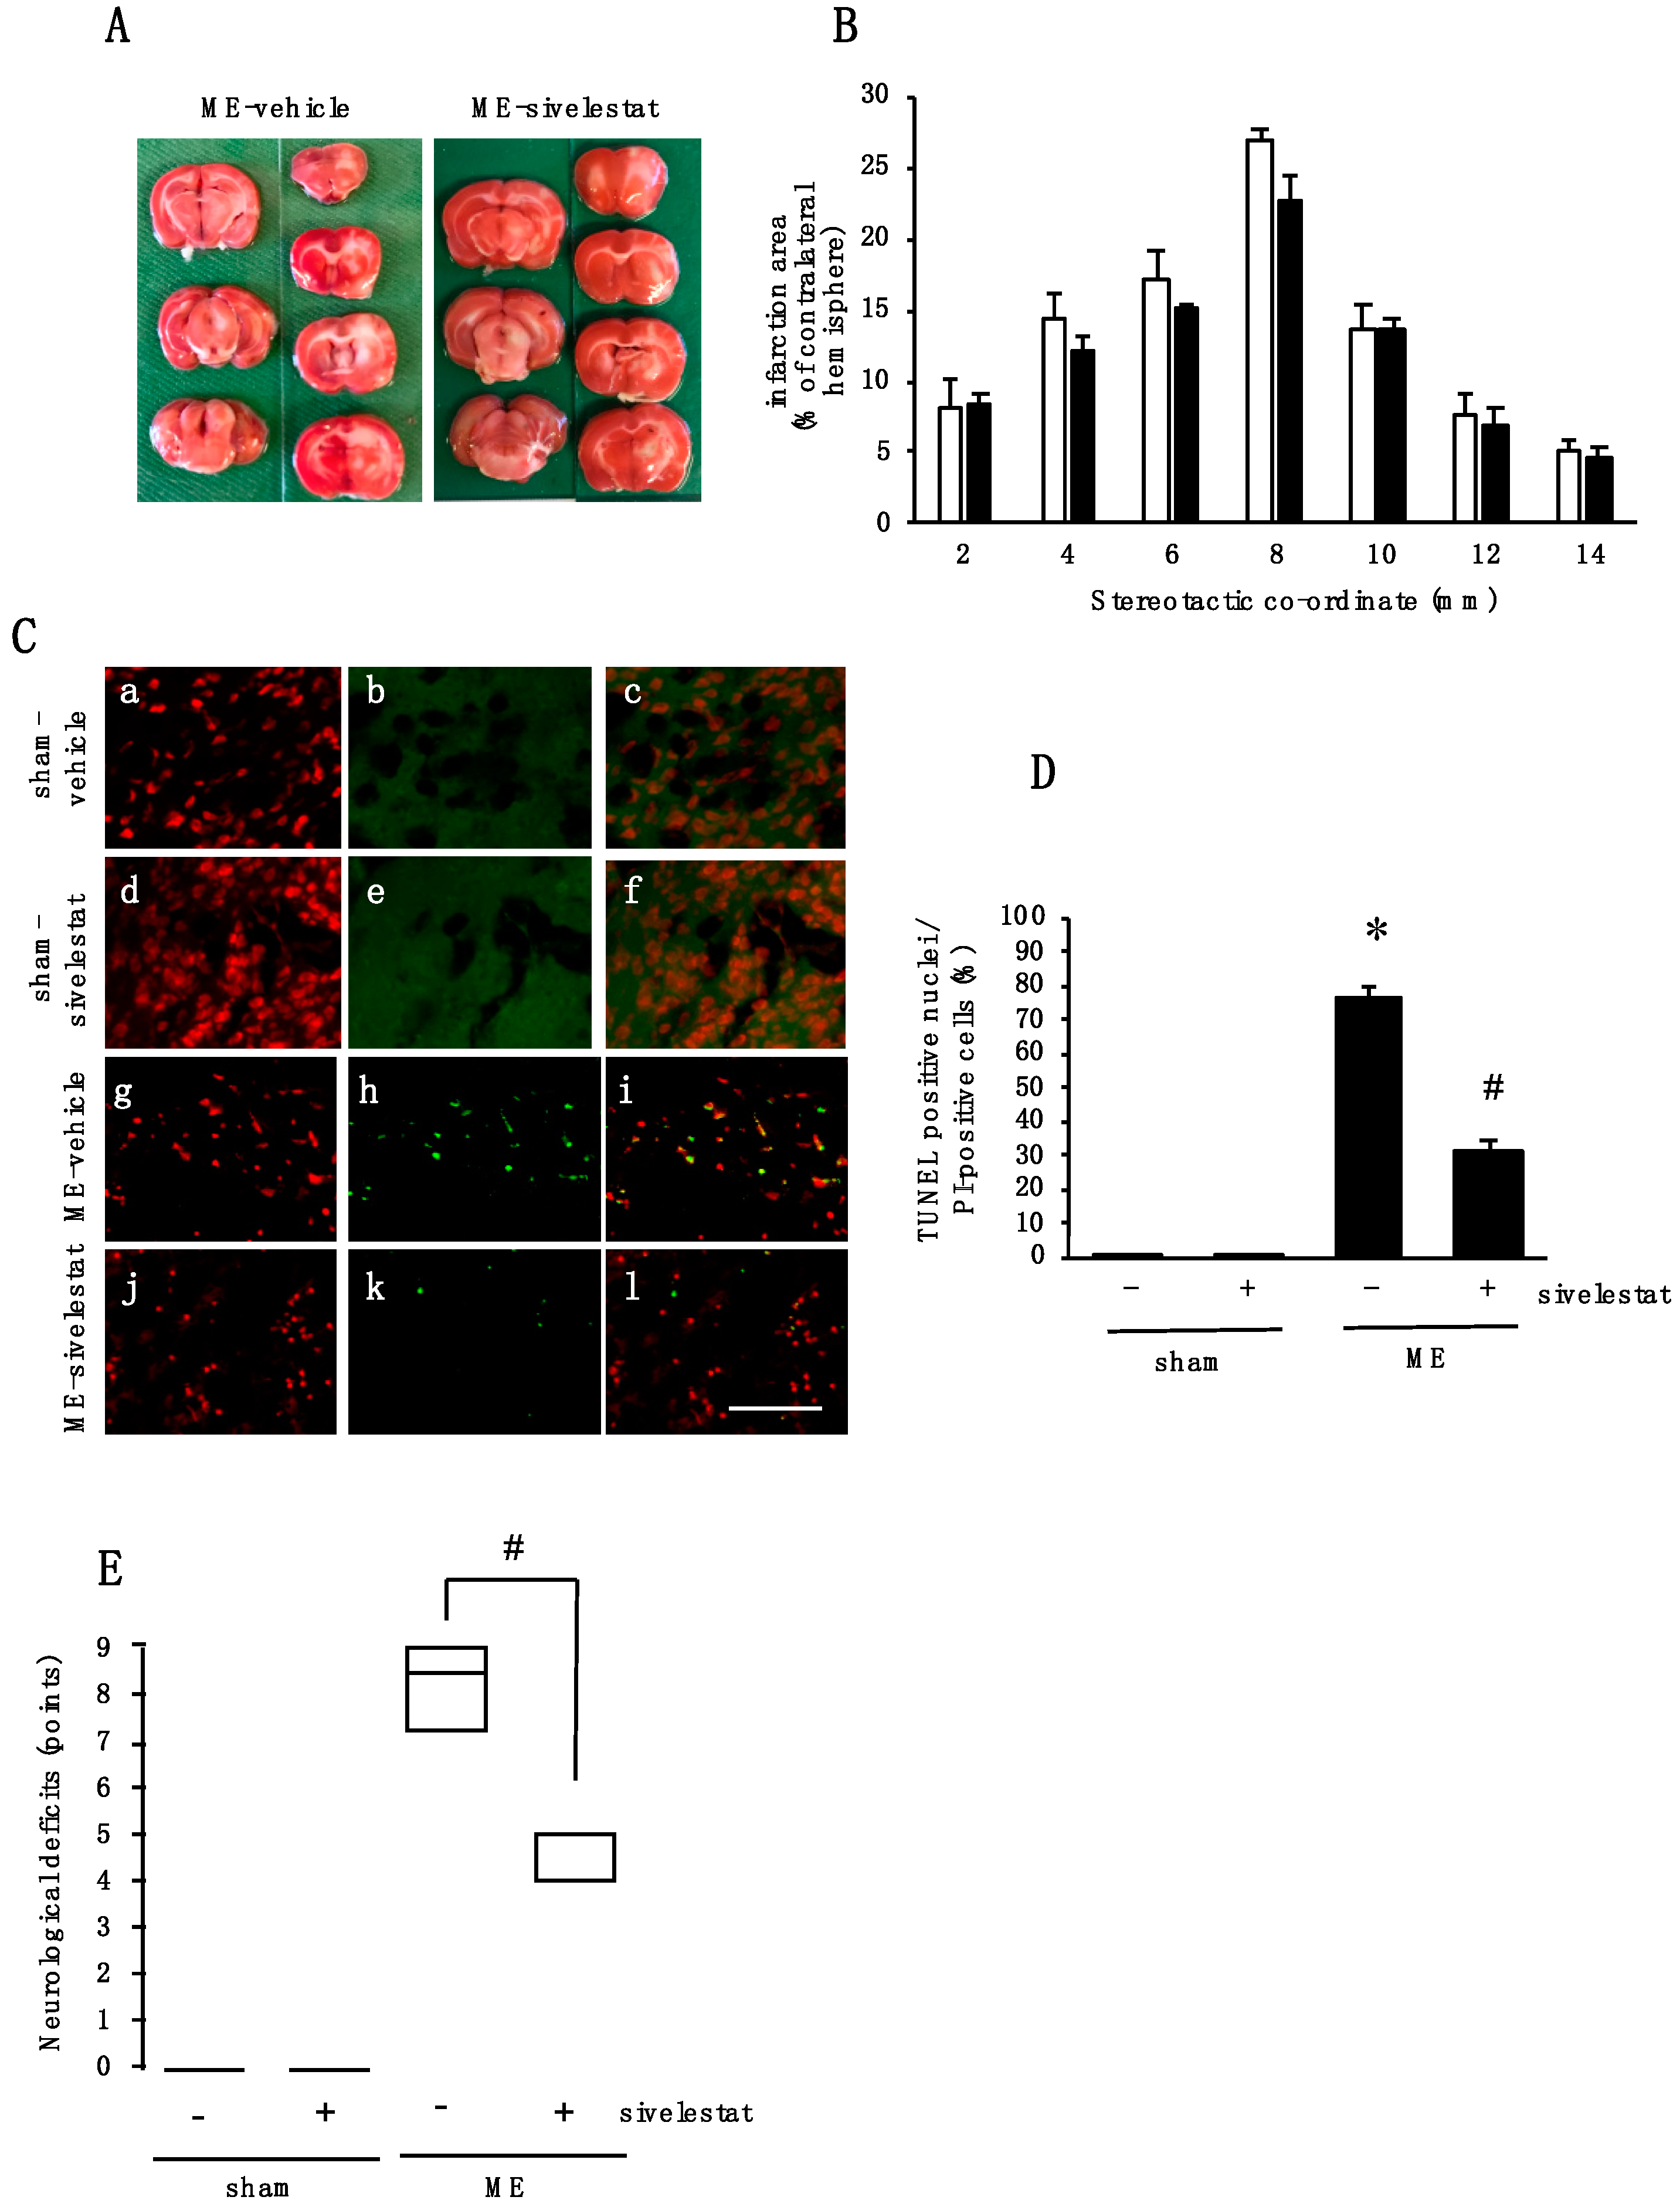
2.7. Effect of Elastase Inhibitor on Cell Injury and Neurological Deficits after Cerebral Ischemia
3. Discussion
4. Materials and Methods
4.1. Model of Microsphere-Induced Cerebral Embolism in Rats
4.2. Assessment of Neurological Deficit
4.3. Drug Administration
4.4. Isolation and Culture of Cortical Microglia
4.5. Western Immunoblotting
4.6. qRT-PCR
4.7. Immunohistochemistry
4.8. 2, 3, 5-Triphenyltetrazolium Chloride Staining
4.9. Terminal Deoxynucleotidyl Transferase-Mediated dUTP-Biotin Nick end Labeling
4.10. Elastase Activity
4.11. Oxygen and Glucose Deprivation (OGD)
4.12. Immunocytochemistry
4.13. Statistical Analysis
5. Conclusions
Author Contributions
Funding
Acknowledgments
Conflicts of Interest
Abbreviations
| PGRN | Progranulin |
| GRN | Granulin |
| t-PA | Tissue plasminogen activator |
| BBB | blood-brain barrier |
| ME | Microsphere-induced cerebral embolism |
| OGD | Oxygen/glucose deprivation |
| GFAP | glial fibrillary acidic protein |
| MPO | Myeloperoxidase |
| TUNEL | Terminal deoxynucleotidyl transferase-mediated dUTP-biotin nick end labeling |
References
- Goto, H.; Fujisawa, H.; Oka, F.; Nomura, S.; Kajiwara, K.; Kato, S.; Fujii, M.; Maekawa, T.; Suzuki, M. Neurotoxic effects of exogenous recombinant tissue-type plasminogen activator on the normal rat brain. J. Neurotrauma 2007, 24, 745–752. [Google Scholar] [CrossRef] [PubMed]
- Jickling, G.C.; Liu, D.; Stamova, B.; Ander, B.P.; Zhan, X.; Lu, A.; Sharp, F.R. Hemorrhagic transformation after ischemic stroke in animals and humans. J. Cereb. Blood Flow Metab. 2014, 34, 185–199. [Google Scholar] [CrossRef] [PubMed]
- Jin, R.; Yang, G.; Li, G. Inflammatory mechanisms in ischemic stroke: Role of inflammatory cells. J. Leukoc. Biol. 2010, 87, 779–789. [Google Scholar] [CrossRef] [PubMed]
- Xiong, X.Y.; Liu, L.; Yang, Q.W. Functions and mechanisms of microglia/macrophages in neuroinflammation and neurogenesis after stroke. Prog. Neurobiol. 2016, 142, 23–44. [Google Scholar] [CrossRef] [PubMed]
- Daniel, R.; He, Z.; Carmichael, K.P.; Halper, J.; Bateman, A. Cellular localization of gene expression for progranulin. J. Histochem. Cytochem. 2000, 48, 999–1009. [Google Scholar] [CrossRef]
- Caesar, M.; Felk, S.; Zach, S.; Bronstad, G.; Aasly, J.O.; Gasser, T.; Gillardon, F. Changes in matrix metalloprotease activity and progranulin levels may contribute to the pathophysiological function of mutant leucine-rich repeat kinase 2. Glia 2014, 62, 1075–1092. [Google Scholar] [CrossRef]
- He, Z.; Bateman, A. Progranulin (granulin-epithelin precursor, PC-cell-derived growth factor, acrogranin) mediates tissue repair and tumorigenesis. J. Mol. Med. 2003, 81, 600–612. [Google Scholar] [CrossRef]
- Kawase, R.; Ohama, T.; Matsuyama, A.; Matsuwaki, T.; Okada, T.; Yamashita, T.; Yuasa-Kawase, M.; Nakaoka, H.; Nakatani, K.; Inagaki, M.; et al. Deletion of progranulin exacerbates atherosclerosis in ApoE knockout mice. Cardiovasc. Res. 2013, 100, 125–133. [Google Scholar] [CrossRef] [Green Version]
- Zhu, J.; Nathan, C.; Jin, W.; Sim, D.; Ashcroft, G.S.; Wahl, S.M.; Lacomis, L.; Erdjument-Bromage, H.; Tempst, P.; Wright, C.D.; et al. Conversion of proepithelin to epithelins: Roles of SLPI and elastase in host defense and wound repair. Cell 2002, 111, 867–878. [Google Scholar] [CrossRef]
- Bateman, A.; Belcourt, D.; Bennett, H.; Lazure, C.; Solomon, S. Granulins, a novel class of peptide from leukocytes. Biochem. Biophys. Res. Commun. 1990, 173, 1161–1168. [Google Scholar] [CrossRef]
- Tang, W.; Lu, Y.; Tian, Q.Y.; Zhang, Y.; Guo, F.J.; Liu, G.Y.; Syed, N.M.; Lai, Y.; Lin, E.A.; Kong, L.; et al. The growth factor progranulin binds to TNF receptors and is therapeutic against inflammatory arthritis in mice. Science 2011, 332, 478–484. [Google Scholar] [CrossRef] [PubMed]
- Van Damme, P.; Van Hoecke, A.; Lambrechts, D.; Vanacker, P.; Bogaert, E.; van Swieten, J.; Carmeliet, P.; Van Den Bosch, L.; Robberecht, W. Progranulin functions as a neurotrophic factor to regulate neurite outgrowth and enhance neuronal survival. J. Cell Biol. 2008, 181, 37–41. [Google Scholar] [CrossRef] [PubMed] [Green Version]
- Miyake, K.; Takeo, S.; Kaijihara, H. Sustained decrease in brain regional blood flow after microsphere embolism in rats. Stroke 1993, 24, 415–420. [Google Scholar] [CrossRef] [PubMed]
- Kajihara, H.; Tsutsumi, E.; Kinoshita, A.; Nakano, J.; Takagi, K.; Takeo, S. Activated astrocytes with glycogen accumulation in ischemic penumbra during the early stage of brain infarction: Immunohistochemical and electron microscopic studies. Brain Res. 2001, 909, 92–101. [Google Scholar] [CrossRef]
- Lyden, P.D.; Zivin, J.A.; Chabolla, D.R.; Jacobs, M.A.; Gage, F.H. Quantitative effects of cerebral infarction on spatial learning in rats. Exp. Neurol. 1992, 116, 122–132. [Google Scholar] [CrossRef]
- Naritomi, H. Experimental basis of multi-infarct dementia: Memory impairments in rodent models of ischemia. Alzheimer Dis. Assoc. Disord. 1991, 5, 103–111. [Google Scholar] [CrossRef]
- Nakajima, K.; Kohsaka, S. Functional roles of microglia in the brain. Neurosci. Res. 1993, 17, 187–203. [Google Scholar] [CrossRef]
- Nimmerjahn, A.; Kirchhoff, F.; Helmchen, F. Resting microglial cells are highly dynamic surveillants of brain parenchyma in vivo. Science 2005, 308, 1314–1318. [Google Scholar] [CrossRef]
- Weinstein, J.R.; Koerner, I.P.; Moller, T. Microglia in ischemic brain injury. Future Neurol 2010, 5, 227–246. [Google Scholar] [CrossRef] [Green Version]
- Dang, D.D.; Saiyin, H.; Yu, Q.; Liang, W.M. Effects of sevoflurane preconditioning on microglia/macrophage dynamics and phagocytosis profile against cerebral ischemia in rats. CNS Neurosci. Ther. 2018, 24, 564–571. [Google Scholar] [CrossRef] [Green Version]
- Matsubara, T.; Mita, A.; Minami, K.; Hosooka, T.; Kitazawa, S.; Takahashi, K.; Tamori, Y.; Yokoi, N.; Watanabe, M.; Matsuo, E.; et al. PGRN is a key adipokine mediating high fat diet-induced insulin resistance and obesity through IL-6 in adipose tissue. Cell Metab. 2012, 15, 38–50. [Google Scholar] [CrossRef] [PubMed]
- Hamzei Taj, S.; Le Blon, D.; Hoornaert, C.; Daans, J.; Quarta, A.; Praet, J.; Van der Linden, A.; Ponsaerts, P.; Hoehn, M. Targeted intracerebral delivery of the anti-inflammatory cytokine IL13 promotes alternative activation of both microglia and macrophages after stroke. J. Neuroinflamm. 2018, 15, 174. [Google Scholar] [CrossRef] [PubMed]
- Chu, H.X.; Kim, H.A.; Lee, S.; Moore, J.P.; Chan, C.T.; Vinh, A.; Gelderblom, M.; Arumugam, T.V.; Broughton, B.R.; Drummond, G.R.; et al. Immune cell infiltration in malignant middle cerebral artery infarction: Comparison with transient cerebral ischemia. J. Cereb. Blood Flow Metab. 2014, 34, 450–459. [Google Scholar] [CrossRef] [PubMed]
- Lee, W.L.; Downey, G.P. Leukocyte elastase: Physiological functions and role in acute lung injury. Am. J. Respir. Crit. Care Med. 2001, 164, 896–904. [Google Scholar] [CrossRef]
- McColl, B.W.; Rothwell, N.J.; Allan, S.M. Systemic inflammatory stimulus potentiates the acute phase and CXC chemokine responses to experimental stroke and exacerbates brain damage via interleukin-1- and neutrophil-dependent mechanisms. J. Neurosci. 2007, 27, 4403–4412. [Google Scholar] [CrossRef]
- Egashira, Y.; Suzuki, Y.; Azuma, Y.; Takagi, T.; Mishiro, K.; Sugitani, S.; Tsuruma, K.; Shimazawa, M.; Yoshimura, S.; Kashimata, M.; et al. The growth factor progranulin attenuates neuronal injury induced by cerebral ischemia-reperfusion through the suppression of neutrophil recruitment. J. Neuroinflamm. 2013, 10, 105. [Google Scholar] [CrossRef]
- Tao, J.; Ji, F.; Wang, F.; Liu, B.; Zhu, Y. Neuroprotective effects of progranulin in ischemic mice. Brain Res. 2012, 1436, 130–136. [Google Scholar] [CrossRef]
- Kawabata, K.; Suzuki, M.; Sugitani, M.; Imaki, K.; Toda, M.; Miyamoto, T. ONO-5046, a novel inhibitor of human neutrophil elastase. Biochem. Biophys. Res. Commun. 1991, 177, 814–820. [Google Scholar] [CrossRef]
- Takemasa, A.; Ishii, Y.; Fukuda, T. A neutrophil elastase inhibitor prevents bleomycin-induced pulmonary fibrosis in mice. Eur. Respir. J. 2012, 40, 1475–1482. [Google Scholar] [CrossRef] [Green Version]
- Yoshikawa, N.; Inomata, T.; Okada, Y.; Shimbo, T.; Takahashi, M.; Akita, K.; Uesugi, Y.; Narumi, Y. Sivelestat sodium hydrate reduces radiation-induced lung injury in mice by inhibiting neutrophil elastase. Mol. Med. Rep. 2013, 7, 1091–1095. [Google Scholar] [CrossRef] [Green Version]
- Nomura, N.; Asano, M.; Saito, T.; Nakayama, T.; Mishima, A. Sivelestat attenuates lung injury in surgery for congenital heart disease with pulmonary hypertension. Ann. Thorac. Surg. 2013, 96, 2184–2191. [Google Scholar] [CrossRef] [PubMed]
- Tagami, T.; Tosa, R.; Omura, M.; Fukushima, H.; Kaneko, T.; Endo, T.; Rinka, H.; Murai, A.; Yamaguchi, J.; Yoshikawa, K.; et al. Effect of a selective neutrophil elastase inhibitor on mortality and ventilator-free days in patients with increased extravascular lung water: A post hoc analysis of the PiCCO Pulmonary Edema Study. J Intensive Care 2014, 2, 67. [Google Scholar] [CrossRef] [PubMed]
- Kakimoto, K.; Matsukawa, A.; Yoshinaga, M.; Nakamura, H. Suppressive effect of a neutrophil elastase inhibitor on the development of collagen-induced arthritis. Cell. Immunol. 1995, 165, 26–32. [Google Scholar] [CrossRef] [PubMed]
- Uchida, Y.; Freitas, M.C.; Zhao, D.; Busuttil, R.W.; Kupiec-Weglinski, J.W. The protective function of neutrophil elastase inhibitor in liver ischemia/reperfusion injury. Transplantation 2010, 89, 1050–1056. [Google Scholar] [CrossRef] [PubMed]
- Kisoh, K.; Hayashi, H.; Itoh, T.; Asada, M.; Arai, M.; Yuan, B.; Tanonaka, K.; Takagi, N. Involvement of GSK-3beta Phosphorylation Through PI3-K/Akt in Cerebral Ischemia-Induced Neurogenesis in Rats. Mol. Neurobiol. 2017, 54, 7917–7927. [Google Scholar] [CrossRef]
- Furlow, T.W., Jr.; Bass, N.H. Arachidonate-induced cerebrovascular occlusion in the rat. The role of platelets and aspirin in stroke. Neurology 1976, 26, 297–304. [Google Scholar] [CrossRef]
- McGraw, C.P. Experimental cerebral infarctioneffects of pentobarbital in Mongolian gerbils. Arch. Neurol. 1977, 34, 334–336. [Google Scholar] [CrossRef]
- Moriyama, Y.; Takagi, N.; Itokawa, C.; Tanonaka, K. Injection of neural progenitor cells attenuates decrease in level of connexin 43 in brain capillaries after cerebral ischemia. Neurosci. Lett. 2013, 543, 152–156. [Google Scholar] [CrossRef]
- Ikegame, Y.; Yamashita, K.; Hayashi, S.; Yoshimura, S.; Nakashima, S.; Iwama, T. Neutrophil elastase inhibitor prevents ischemic brain damage via reduction of vasogenic edema. Hypertens. Res. 2010, 33, 703–707. [Google Scholar] [CrossRef]
- Tonai, T.; Shiba, K.; Taketani, Y.; Ohmoto, Y.; Murata, K.; Muraguchi, M.; Ohsaki, H.; Takeda, E.; Nishisho, T. A neutrophil elastase inhibitor (ONO-5046) reduces neurologic damage after spinal cord injury in rats. J. Neurochem. 2001, 78, 1064–1072. [Google Scholar] [CrossRef] [Green Version]
- Giulian, D.; Baker, T.J. Characterization of ameboid microglia isolated from developing mammalian brain. J. Neurosci. 1986, 6, 2163–2178. [Google Scholar] [CrossRef] [PubMed]
- Saura, J.; Tusell, J.M.; Serratosa, J. High-yield isolation of murine microglia by mild trypsinization. Glia 2003, 44, 183–189. [Google Scholar] [CrossRef] [PubMed]


© 2019 by the authors. Licensee MDPI, Basel, Switzerland. This article is an open access article distributed under the terms and conditions of the Creative Commons Attribution (CC BY) license (http://creativecommons.org/licenses/by/4.0/).
Share and Cite
Horinokita, I.; Hayashi, H.; Oteki, R.; Mizumura, R.; Yamaguchi, T.; Usui, A.; Yuan, B.; Takagi, N. Involvement of Progranulin and Granulin Expression in Inflammatory Responses after Cerebral Ischemia. Int. J. Mol. Sci. 2019, 20, 5210. https://doi.org/10.3390/ijms20205210
Horinokita I, Hayashi H, Oteki R, Mizumura R, Yamaguchi T, Usui A, Yuan B, Takagi N. Involvement of Progranulin and Granulin Expression in Inflammatory Responses after Cerebral Ischemia. International Journal of Molecular Sciences. 2019; 20(20):5210. https://doi.org/10.3390/ijms20205210
Chicago/Turabian StyleHorinokita, Ichiro, Hideki Hayashi, Rika Oteki, Risa Mizumura, Tatsuaki Yamaguchi, Akane Usui, Bo Yuan, and Norio Takagi. 2019. "Involvement of Progranulin and Granulin Expression in Inflammatory Responses after Cerebral Ischemia" International Journal of Molecular Sciences 20, no. 20: 5210. https://doi.org/10.3390/ijms20205210