Article

Expression Profile of Cell Cycle-Related Genes in Human Fibroblasts Exposed Simultaneously to Radiation and Simulated Microgravity

1
Gunma University Heavy Ion Medical Center, Maebashi, Gunma 371-8511, Japan
2
Department of Genome Biology, Faculty of Medicine, University of Tsukuba, Tsukuba, Ibaraki 305-8577, Japan
3
Graduate School of Life Sciences, Tohoku University, Sendai, Miyagi 980-8577, Japan
4
Radiation Institute for Science & Engineering, Prairie View A&M University, Prairie View, TX 77446, USA
5
Department of Cardiology, University of Texas MD Anderson Cancer Center, Houston, TX 77030, USA
*
Author to whom correspondence should be addressed.
Current address: Gunma University Initiative for Advanced Research, Maebashi, Gunma 371-8511, Japan.
Current address: Department of Heavy Particle Medical Science, Graduate School of Medical Science, Yamagata University, Yamagata, Yamagata 990-9585, Japan.
Int. J. Mol. Sci. 2019, 20(19), 4791; https://doi.org/10.3390/ijms20194791
Submission received: 9 August 2019 / Revised: 16 September 2019 / Accepted: 24 September 2019 / Published: 26 September 2019
(This article belongs to the Special Issue Adaptation of Living Organisms in Space: From Mammals to Plants)

Abstract

:
Multiple unique environmental factors such as space radiation and microgravity (μG) pose a serious threat to human gene stability during space travel. Recently, we reported that simultaneous exposure of human fibroblasts to simulated μG and radiation results in more chromosomal aberrations than in cells exposed to radiation alone. However, the mechanisms behind this remain unknown. The purpose of this study was thus to obtain comprehensive data on gene expression using a three-dimensional clinostat synchronized to a carbon (C)-ion or X-ray irradiation system. Human fibroblasts (1BR-hTERT) were maintained under standing or rotating conditions for 3 or 24 h after synchronized C-ion or X-ray irradiation at 1 Gy as part of a total culture time of 2 days. Among 57,773 genes analyzed with RNA sequencing, we focused particularly on the expression of 82 cell cycle-related genes after exposure to the radiation and simulated μG. The expression of cell cycle-suppressing genes (ABL1 and CDKN1A) decreased and that of cell cycle-promoting genes (CCNB1, CCND1, KPNA2, MCM4, MKI67, and STMN1) increased after C-ion irradiation under μG. The cell may pass through the G1/S and G2 checkpoints with DNA damage due to the combined effects of C-ions and μG, suggesting that increased genomic instability might occur in space.

Graphical Abstract

1. Introduction

Many manned space missions are scheduled in the near future. During such missions, astronauts are continuously exposed to space radiation, which differs from that on Earth. For space missions in low Earth orbit, such as at the International Space Station (ISS), the major source of radiation exposure is solar storms. For exploratory missions beyond low Earth orbit, such as explorations of the Moon and Mars, the effects of exposure to galactic cosmic radiation, including heavy ions, are the most significant health concern. During solar storms, high-dose exposure can have acute effects, including fatigue, nausea, and vomiting [1]. In contrast, during long-duration and exploratory spaceflights, chronic exposure increases the risk of cancer [2,3] and can cause tissue degeneration, development of cataracts [4,5], and potentially affect the central nervous system [6] and immune function [7]. It has also been reported that the risk of cardiovascular disease may be increased by traveling into deep space [8]. However, in another study, this conclusion was questioned because the small number of samples did not enable a statistically robust analysis [9]. Several factors are leading to large uncertainties in the projection of these risks and impeding evaluation of the effectiveness of possible countermeasures; these factors include the type of radiation and the presence of microgravity (μG) [10]. For the assessment and management of human health risks in space, it is necessary to obtain more basic data on the combined effects of radiation under μG.
In previous space experiment, there was no appreciable difference in results between space and ground samples because the time spent in space was short and samples were thus exposed to space radiation at a low dose [11]. In other studies, various organisms have been irradiated before space flight to test the effect of μG on the repair of radiation-induced DNA damage, but again there was no appreciable difference in results [12,13,14,15]. It has been reported that the presence of μG enhances the effects of space radiation [16,17,18], while another study reports improved recovery from radiation damage under μG [19]. Control experiments performed in space under conditions equivalent to Earth’s gravity (1G) are limited. The combined effects of μG and radiation thus remain unclear [20,21,22], although it is thought that μG influences the effects of radiation on living organisms.
In previous ground studies on the combined effects of radiation and μG, a three-dimensional (3D) clinostat [23] or a rotating wall vessel [24] was used to simulate μG, and in order to irradiate samples on these μG simulators, it was necessary to stop rotation during irradiation. As another system to simulate space conditions on the ground, chronic irradiation of samples on the 3D clinostat with neutrons of several MeV from the radioisotope 252Cf was reported [25,26], but the effects of radiation were not compared with the status of 1G standing samples. Producing actual μG on the ground has limitations in the duration of μG applied when employing the methods such as a drop tower or parabolic flight. It is too short for plants or cultured cells to exhibit obvious changes in growth and development in such method [27]. We thus selected a 3D clinostat for use, which creates simulated μG conditions without time restriction.
Recently, we overcame these previous problems (i.e., discontinuous μG conditions, lack of a 1G control experiment) and carried out irradiation experiments under chronic simulated μG conditions. Our 3D clinostat can manipulate the effect of gravity through 3D rotation about two orthogonal axes and through continuously (not randomly) changing the orientation of cells relative to the direction of gravity. This system exerts simulated μG on cells in the direction of gravity on average via mechanical regulation [27,28,29,30]. In parallel with this experimental condition, we performed the same irradiation under 1G standing conditions. Using our newly developed simulated μG/irradiation system, we have reported that simultaneous exposure of human fibroblasts to simulated μG and radiation results in more chromosome aberrations than in cells exposed to radiation alone [31]. We know that defects in a cell cycle checkpoint may be responsible for genomic instability [32]. Genes specifically involved in the cell cycle are regulated transcriptionally [33] and are expressed just before they are needed [34]. Therefore, we focused here on the expression of cell cycle-related genes. According to previous reports, the total dose in a mission to Mars may exceed 1 Sv. The maximum allowable effective dose over an astronaut’s lifetime is also around 1 Sv, a level that has been established by several space agencies [35]. Against this background, we irradiated cells with 1 Gy of X-rays or carbon (C)-ions under simulated μG. To address the cause of the combined effects of radiation and simulated μG on genomic instability, we obtained transcriptomic data by RNA sequencing (RNA-seq) in human fibroblasts exposed simultaneously to X-rays or C-ions under simulated μG.

2. Results

2.1. Gene Expression Profile Changes after Radiation and/or Simulated μG Treatment

To investigate the profile of genes whose expression changes significantly with simulated μG or radiation treatment alone, screening of genes was carried out using Empirical Analysis of DGE [EDGE, CLC Main Workbench (Qiagen Bioinformatics, Aarhus, Denmark), p-value < 0.05, fold change absolute value > 2.0] for each combination of a total of 57,773 genes from RNA-seq analysis in 1BR-hTERT human fibroblasts.
First, to identify genes whose expression levels are altered by simulated μG alone, we compared the expression profile of cells cultured at 1G with that of cells exposed to simulated μG for 48 h and found that 140 genes were up-regulated and 103 genes down-regulated. In the pathway analysis using the DAVID Bioinformatics Resources 6.8 (NIAID/NIH, Bethesda, MD, USA) [36] and KEGG (Kanehisa laboratories of Kyoto University, Uji, Kyoto, Japan) databases [37], we found that simulated μG up-regulated a set of genes related to morphine addiction was associated with the gene group for which significant expression changes were observed (Table 1a).
In contrast, for the group of genes that were down-regulated after simulated μG treatment alone, no specific associated pathways were identified. By focusing on the Molecular Function-Direct of Gene Ontology in DAVID [36], we have found that the gene groups showed a tendency for decreased expression were related to calcium ion binding, G-protein coupled purinergic nucleotide receptor activity, and myosin binding (Table 1b). In X-ray or C-ion treatment alone, the major pathways of up-regulated genes (p53 signaling pathway) and down-regulated genes (cell cycle pathway) tended to be similar. We focused on cell cycle-related genes for further data analysis because the p53 signaling pathway is also related to the cell cycle.

2.2. Radiation Exposure Led to a Marked Change in the Cell Cycle-Related Gene Expression Profile

On the basis of our RNA-seq results from cells exposed to radiation alone (Table 1), we performed further investigation to identify significant genes related to the cell cycle. Specifically, 84 genes encoding key molecules involved in the cell cycle were selected with information of human cell cycle RT² Profiler PCR Array (Qiagen, Hilden, Germany) [38]. Of those genes, 82 were selected in our sample after RNA-seq. Gene expression profile changes under each condition compared with that in the non-irradiated 1G sample are shown as a heatmap in Figure 1. The heatmap represents the extent of gene expression in cells harvested 3 and 24 h after X-ray or C-ion irradiation under simulated μG compared with the expression level of the same gene in non-irradiated samples under 1G. The expression levels of up-regulated genes are shown in red and those of down-regulated genes are in green. The up- or down-regulation of gene expression caused by X-ray or C-ion irradiation was more remarkable than the influence of simulated μG (Figure 1b,c) because the pattern did not change markedly between the 1G and simulated μG conditions. Upon comparison to the non-irradiated 1G sample, the group of genes down-regulated upon radiation exposure alone was related to several key functions for promoting the cell cycle (Figure 1b). In contrast, those up-regulated genes were related to p53 signaling, such as CDKN1A (Figure 1c).

2.3. Changes in Cell Cycle-Related Genes Expression Profile in Cells under Simulated μG and Radiation

To determine whether the radiation response was enhanced or suppressed by the combination with simulated μG, we focused on genes whose expression specifically changed under the combined conditions. Figure 2 shows the judgement criteria for assessing gene expression profile changes. Of the 57,773 genes targeted for RNAseq analysis, 82 cell cycle-related genes were narrowed down in Step 1. As Step 2, the threshold value was set with the maximum value (> 1000) of the normalized expression in 1G sample. Thirteen genes met this criterion in Step 2. Next, the genes that showed significant differences under the influence of radiation were further selected based on the difference in their expression under 1G vs. those in simulated μG environment (EDGE; p < 0.05) as Step 3. Here, nine out of 13 genes showed significant differences. On the four genes (ATM, CDC20, CDK6, and TFDP1) that did not show significant differences, we performed comparative studies between 1G non-irradiated cells and simulated μG non-irradiated cells, and examined whether simulated μG by itself had a significant effect. We found that these four genes were not affected by changes in gravitational conditions (Step 4). In Step 5, the expression value in the simulated μG irradiated sample was first converted using the ratio of 1G non-irradiated samples vs. simulated μG non-irradiated samples. Next, we calculated the fold change compared with the expression value of 1G irradiated samples and the converted expression value of simulated μG-irradiated samples. If the fold change showed a decrease or increase, this means gene expression even more by adding to simulated μG compared with radiation alone.
Nine genes (ABL1 [39], CCNB1 [40], CCND1 [41], CDKN1A [40,41], KPNA2 [42], MCM4 [43], MDM2 [44], MKI67 [45], and STMN1 [46]) were calculated by considering the effect of simulated μG alone with several processes of Step 5 in judgement criteria (Figure 2). Table 2 provides summary information on the nine selected genes. We could obtain the profile of genes with a change in expression upon adding simulated μG and comparing the results with those obtained with radiation alone.
The relative expression values of nine cell cycle-related genes were compared among different gravity and radiation conditions, as shown in Figure 3. Simulated μG alone did not have a significant effect on the expression of all nine genes. As a result of X-ray or C-ion exposure alone regardless of the timing of this irradiation, an increased relative expression value was observed for MDM2. In addition, X-ray and C-ion irradiation showed no change in Abl1 but a significant increase in CDKN1A, and CCND1 working downstream of these kinases showed no change in relative gene expression. Moreover, CCNB1 showed a tendency for a decrease in its relative expression value. There was also a tendency for decreases in the relative expression values of cell cycle-promoting genes such as KPNA2, MCM4, MK167, and STMN1. When the same physical dose of 1 Gy of X-rays or C-ions was used in this study, we found that the changes in relative expression value were significantly larger for the C-ion-irradiated samples than for the X-ray-irradiated ones (Figure 3; ST-X3 vs. ST-C3 in MDM2, KPNA2, MCM4, CCNB1, MKI67, and STMN1). The combined treatment gave significantly different results compared with radiation treatment alone in the gene expression of cell cycle checkpoints and promoting proteins.

3. Discussion

3.1. Gene Expression Profile Changes with Simulated μG

In simulated μG experiments on the ground using a simulator such as a clinostat or a rotating wall vessel, concerns have been raised about the possibility of cells being subjected to shear stress. When attempting to accurately evaluate the effects of simulated μG, it is important to carefully consider the experimental conditions [47] because research groups perform simulated μG experiments under various conditions with different types of simulator and cell line. Todd previously calculated the shear stress on monolayer neuromuscular synapses after rotation, and found it to be almost negligible in the absence of air bubbles in medium with slow rotation [48]. Although the adherent human fibroblasts 1BR-hTERT were used in this study, we completely filled a thin cell culture chamber with medium (without bubbles) to eliminate shear stress on the cells or minimize it as much as possible, based on the report by Todd [48]. It is not necessary to change the medium under our simulated μG conditions until the sampling. From our previous data on cellular growth, which showed no significant difference between rotating and standing conditions after 48 h of culture [29], it is unlikely that cells are subjected to shear stress under our experimental conditions using our system.

3.2. X-ray and C-Ion Irradiation Induced Changes in Gene Expression

From the results in Table 1, major cellular pathways targeted by X-ray and C-ion irradiation were up-regulated p53 signaling and down-regulated cell cycle which work downstream the p53 signaling pathway. The heatmap focused on genes involved in the cell cycle not only revealed similar results to those shown in Table 1, but also confirmed that the effect of radiation alone was greater than that of simulated μG treatment alone (Figure 1). These results were suggested to be consistent with the typical radiation-induced cell cycle checkpoints and subsequent repair responses reported so far [49,50]. The relative expression value change due to radiation alone of the cell cycle-related genes selected according to the judging criteria is shown in Figure 3. The expression of ABL1 did not change, while CDKN1A also known as p21 was up-regulated. CCND1 related to Cyclin D did not show a change of expression downstream of ABL1 and CDKN1A at both 3 and 24 h after irradiation. p21 expression increased upon C-ion irradiation, which matches the finding in a previous report [51].
Moreover, the expression level of KPNA2 was decreased and that of CDKN1A was increased, while the level of CCNB1 located downstream of them was decreased. MCM4, MKI67, and STMN1, which promote the cell cycle, showed a tendency to be down-regulated (Table 2). These results suggest that 1BR-hTERT has normal cell cycle checkpoints, including not only G1 arrest but also G2 arrest.

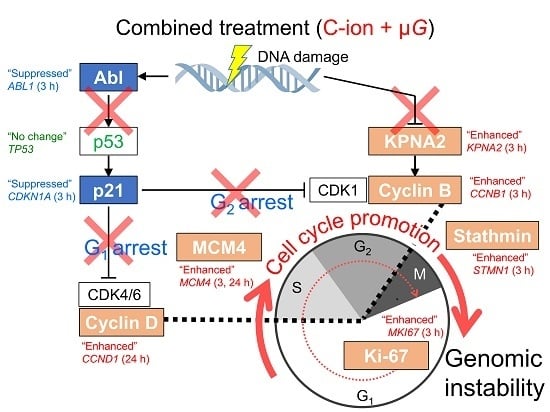
3.3. Synergistic Effect of Radiation and Simulated μG on Changes in Expression Profile of Cell Cycle-Related Genes

To simulate space conditions of radiation and μG with our system, samples were pulse-irradiated every minute. It has been estimated that cells are actually subjected to space radiation of high linear energy transfer (LET) particles (a few times per day) in space [52]. As a limitation of our system, the dose rate of space radiation during space flight is lower than 0.03 Gy/min as used in this study. However, our system enables irradiation without stopping rotation, and it has the unique advantage of simulating space conditions by comparison with the effects of X-rays and C-ions on the ground.
The results of several experiments focused on the cell cycle under simulated μG have been reported using various cell lines. For example, simulated μG induced partial G1 phase arrest in rat pheochromocytoma PC12 cells [53]. In addition, both normal murine vascular smooth muscle cells and neoplastic human breast cancer cells were induced to undergo partial arrest at G2/M and showed increased expression of CDKN1A upon simulated μG [54]. Moreover, in murine microvascular endothelial 1G11 cells, cell growth was inhibited and p21 was induced by simulated μG [55].
In contrast, Arase et al. reported that simulated μG reduced the expression of p21 in human fibroblasts [56]. Although the adaptation and responses to μG may differ depending on the cell type, target factors, and the treatment time [54], these previous reports suggest that μG is an important factor regulating the cell cycle through the p53 signaling pathway.
In this study, we found that a total of 140 genes were up-regulated and 103 genes were down-regulated by simulated μG treatment alone. A small group of up-regulated genes was associated with morphine addiction-related pathways, but no major pathways were identified for the down-regulated genes. The use of the Molecular Function-Direct by Gene Ontology with DAVID also revealed that some down-regulated genes were associated with processes related to the muscle contraction such as ACTA1. Similar result have previously been reported [25], thus our findings confirmed that our simulated μG system functions appropriately and that it is an effective tool for further investigation of the combined effect of radiation and simulated μG.
Our results after combined treatment with C-ion irradiation and simulated μG revealed synergistic changes in the expression of genes (Figure 3). The expression of CDKN1A also known as p21 was decreased at 3 h and that of CCND1 was increased at 24 h after the treatment through down-regulating ABL1 (3 h) and leaving TP53 unchanged. Therefore, the results suggest that G1 arrest does not occur under combined conditions of C-ion irradiation and simulated μG. Moreover, KPNA2 and CCNB1 were up-regulated with a decrease of CDKN1A at 3 h after the treatment, and then G2 arrest may not occur. Based on previous reports, our results suggest that C-ion irradiation alone may induce cell cycle checkpoints normally, but the checkpoints are released by adding simulated μG treatment.
While radiation treatment alone tended to suppress the cell cycle (Figure 3), the combined effect of C-ion irradiation and simulated μG may promote cell proliferation. Indeed, previous report show that simulated μG promotes the proliferation and differentiation of human mesenchymal stem cells [57]. Similar findings were also made in experiments using human dental pulp stem cells [58] and human epidermal stem cells [59], including the result of an increased percentage of Ki67-positive cells. These reports support our finding that C-ion irradiation and simulated μG together promote cell cycle progression.
On the basis of our results (Figure 3), we propose a model by which the cell cycle-related pathway is modified by the combined effect of C-ion exposure and simulated μG in 1BR-hTERT human fibroblasts (Figure 4). Cells may pass through each cell cycle checkpoint with DNA damage after combined treatment with C-ion irradiation and simulated μG. We reported that combined treatment of cells with simulated μG and radiation induced a higher frequency of both simple and complex types of chromosome aberrations compared with the level in cells irradiated with X-rays or C-ions alone under the 1G standing condition [31]. This proposed model for the modified cell cycle pathway may provide some insights into the mechanism for increased chromosome aberration due to the combined effect of C-ion and simulated μG.
In terms of the effect on 1BR-hTERT fibroblasts of X-ray irradiation in combination with simulated μG, only one gene, MDM2, showed a significant decrease in its expression. Although MDM2 is known as one of the components that negatively feeds back to p53 signaling, its expression was synergistically decreased by the combined effect relative to the effect of X-ray irradiation alone; thus, there is a possibility that accumulation of p53 protein may occur and that the cell cycle checkpoint works downstream of p53. Therefore, it is possible that there is no significant difference after combined treatment with X-ray irradiation in this study. Another potential reason for this result is the radiation dose used in this experiment. We used 1 Gy for both C-ions and X-rays. From the cell survival curve [31], a dose equivalent to 1 Gy C-ions would be 2 Gy by X-rays, and therefore a significant difference in the expression of some of the genes may not have been seen in this study with X-rays. However, the changes in gene expression profile due to the combined effect in genes involved in the cell cycle regulation showed a similar tendency between X-ray and C-ion treatments.
Previous studies on simulated μG experiments with radiation at the ground level that support our current model. Combined effects of these factors caused increases in double-strand breaks [60] and genomic instability such as the formation of micronuclei [61], a decrease in cell cycle checkpoints, and enhancements of DNA damage response (by γ-rays) [62] and chromosome aberrations (by X-rays) [63]. In a previous transcriptomic study, normal human bronchial epithelial cells exposed to heavy ions (silicon or iron ions) as high-LET radiation were compared with those exposed to γ-rays as low-LET radiation. The results revealed the distinct expression patterns of genes related to cell cycle regulation, DNA damage response, and other stress-responding mechanisms that were specific to the radiation quality [64]. In space experiments involving simultaneous exposure to space radiation and μG, several different sets of results have been reported, with suppression of the cell cycle through activated p21 [65] and cell proliferation [66], but also no change in the amount of p21 protein [67,68]. The reason for this difference may be the short stay in space and the lack of a sufficient dose to induce radiation effects. However, DNA damage has been detected [69,70,71] after time spent in space, and increases in genomic instability have also been shown in the NASA Twins Study [72]. In the review article, additional transcriptomic data presented that the pathway of nuclear factor kappa-light-chain-enhancer of activated B cells is well known to be altered by either μG or space radiation. This appeared potentially to have adverse impacts on health [73]. When non-dividing human fibroblasts were studied on the ISS for 14 days, no differences in gene or miRNA expression profiles were found upon comparison with ground samples. However, it has been shown that gene or miRNA expression profiles also change depending on the number of days of culture and the cellular conditions [74].
It is known that some changes in gene expression profile in ground-based experiments using a simulator mimicking μG conditions are not consistent with the changes seen in space experiments [75]. Therefore, it is necessary to compare comprehensively the specific genes screened by simulation experiments on the ground with transcriptomic data obtained in space experiments. Our results, which may indicate the release of checkpoints and promotion of the cell cycle by combined effects of C-ion irradiation and simulated μG, help to shed light on the mechanism behind the findings in these previous reports. The results also show the need to consider combined effects of simultaneously radiation and μG exposure on the risk assessment based on previous dose-response data obtained from irradiated cells under 1G conditions.

4. Materials and Methods

4.1. Cell Culture

Human fibroblasts (1BR-hTERT cells) were kindly provided by Dr. P.A. Jeggo (University of Sussex, Brighton, UK) and Dr. A. Shibata (Gunma University Initiative for Advanced Research (GIAR), Maebashi, Gunma, Japan). Cells were cultured in CO2-independent medium (Thermo Fisher Scientific, Waltham, MA, USA) supplemented with 10% (v/v) fetal bovine serum (MP Biomedicals, Santa Ana, CA, USA), 200 mM l-glutamine (Thermo Fisher Scientific), and penicillin–streptomycin mixed solution (Nacalai Tesque, Kyoto, Kyoto, Japan) at 37 °C. Exponentially growing cells were cultured in disposable sealed irradiation cell culture chambers (DCC) (Chiyoda Co., Yokohama, Kanagawa, Japan) [76,77] that were completely filled with fresh medium (without bubbles) before setting in the 3D clinostat [PMS-CST I; Advanced Engineering Services Co. Ltd. (AES), Tsukuba, Ibaraki, Japan] for simulated μG or a static stage (AES) as a 1G control, as previously reported [29].

4.2. Synchronized Irradiation Systems Under Simulated μG or 1G

Irradiation of cells without stopping clinostat motion was achieved by 0.2 sec of pulse irradiation when the cell growth surface of the chamber on the clinostat became perpendicular to the beam of irradiation. The controller of the 3D clinostat was also connected to a high-speed shutter system (Accelerator Engineering Co. (AEC), Chiba, Chiba, Japan) for X-ray irradiation (Figure 5A) or a respiratory gating system for C-ion irradiation (Figure 5B) to achieve this specific positioning (i.e., synchronization) of the chamber orientation and the timing of the pulse irradiation, which occurred every 60 sec. The X:Y ratios of clino-rotation were set at 11:13 rpm and = 66°/s:78°/s to accurately synchronize irradiation when the samples were in a horizontal position [28,29].
Synchronized X-ray irradiation was performed using an X-ray generator [200 kV, 14.6 mA, aluminum filter (0.3 mm thick), MultiRad225; Faxitron Bioptics, LLC, Tucson, AZ, USA] equipped with a high-speed shutter. Synchronized C-ion irradiation was performed using a synchrotron (Gunma University Heavy Ion Medical Center (GHMC), Maebashi, Gunma, Japan) and respiratory gating signals with a dose-averaged LET of 50 keV/μm at the center of the 6-cm spread-out Bragg peak of the beam with energy of 290 MeV/n [78]. As a control, cells in the same chamber mounted on a stationary clinostat (1G) were pulse-irradiated for 0.2 sec every 60 sec [28,29]. The dose used was 1 Gy of X-rays or C-ions, and the dose rate was approximately 0.03 Gy/min for both X-ray and C-ion irradiation under the simulated μG or 1G conditions.

4.3. Experimental Design

Comprehensive gene expression analysis of human fibroblasts was performed to determine the combined effects of irradiation and simulated μG. 3D clinostat-synchronized X-ray or C-ion irradiation at 1 Gy was performed without stopping rotation. Samples were set on the static stage for standing (ST) 1G and the 3D clinostat for rotation (RO) simulated μG after changing to new medium at 24 h after the seeding of cells. The cells were maintained for 3 or 24 h after X-ray or C-ion irradiation as part of total culture time of 2 days in standing or rotating conditions, and then total RNA was isolated from the cells (Figure 6).

4.4. RNA Extraction

The DCC samples were continuously cultured under standing or rotating conditions for 3 or 24 h after 1 Gy irradiation with X-rays or C-ions. Immediately after these treatments, adherent cells were lysed in 1.6 mL of TRIzol® Reagent (Thermo Fisher Scientific) for homogenization and frozen at −80 °C. Gene expression was analyzed by Tsukuba i-Laboratory LLP (Tsukuba, Ibaraki, Japan).

4.5. RNA Sequencing

A total of 36 samples were analyzed (1G or simulated μG alone, N = 6; the other 8 conditions, N = 3) using RNA sequencing. RNA sequence reads quantified 57,773 genes. After RNA sequencing, the profiles of genes with up- or down-regulation of their expression were listed according to ratios of the expression value using EDGE (p < 0.05, fold change with absolute value >2.0) with the CLC Main Workbench software.

4.6. Pathway Analysis

To identify cellular pathways within these lists after narrowing down the total of 57,773 genes by statistical analysis using EDGE of the CLC Main Workbench, we used the Functional Annotation Tool in DAVID Bioinformatics Resources 6.8 [36]. Using the KEGG pathway database, we selected the top three pathways which show a higher percentage in narrowing down pathways (p < 0.05). If no specific pathway was identified by KEGG tools, we selected the top three functions that show a higher percentage (p < 0.05) focusing on the Gene Ontology-Molecular Function in DAVID.

4.7. Heatmap Representation for Visualization of Changing Gene Expression Level

The expression values of each condition were normalized using CLC Main Workbench software for the screened group of 82 cell cycle-related genes. After adding 0.01 to normalized expression values, log 2 conversion was performed as transformed values. The gene expression level changes were presented as a heatmap using the transformed values calculated through these multiple steps with CLC Main Workbench software. To create the heatmap, versatile matrix visualization and the analytical software Morpheus (https://software.broadinstitute.org/morpheus) were used. Using a standing 1G non-irradiated sample (ST), if the difference of the transformed value of each condition vs. ST was smaller than 1.0, allocation to the no change group was performed (a). However, if the difference was larger than 1.0, allocation to the Down-regulated (b) or Up-regulated group (c) was performed.

4.8. Statistical Analysis

To observe the change in gene expression profile after exposure to the radiation and simulated μG, each sample was analyzed several times (total 36 samples; 1G or simulated μG alone, N = 6; the other 8 conditions, N = 3) at Tsukuba i-Laboratory LLP. The profiles of the up- or down-regulation of gene expression were listed according to the ratios of the expression value using EDGE with CLC Main Workbench software. In all statistical analyses, differences were considered significant at p-values less than 0.05. For selecting genes among the total of 57,773 genes, fold changes with an absolute value larger than 2.0 were considered statistically significant with p-values of less than 0.05. The bar graph of Figure 3 shows relative expression value ± standard error for each condition (ST or RO alone, N = 6; the other 8 conditions, N = 3).

5. Conclusions

In this study, we achieved to identify nine cell cycle-related genes that show synergistic changes by combined effects with X-ray or C-ion irradiation under simulated μG. Radiation treatment alone with X-rays or C-ions increased the gene expression of CDKN1A (p21), while each cell cycle checkpoint continued to work normally. However, the combined effects of C-ions and simulated μG decreased the expression of CDKN1A, which may have resulted in failure to achieve arrest at checkpoints; this promoted the cell cycle without sufficiently undergoing steps of DNA damage repair. Simulated μG may be one of the key factors that synergistically change the effect of radiation at ground level, and changes in the expression of cell cycle-related genes indicated the possibility of genomic instability including chromosomal abnormalities. To assess the risk of radiation in future long-term stays in space, further ground and space experiments need to be conducted, taking into consideration the results obtained here.

Author Contributions

Conceptualization, A.T. and J.H.; methodology, H.I., M.M., H.S., Y.Y., and A.T.; validation, H.I. and M.M.; writing—original draft preparation, H.I. and A.T.; writing—review & editing, M.H., and Y.Y.; supervision, M.H., and K.F.; project administration, A.T.; funding acquisition, M.H., and A.T.

Funding

This work was supported by NASA Space Biology Program (80NSSC19K0133) (M.H.), a MEXT Grant-in-Aid for Scientific Research on Innovative Areas “Living in Space” (JP15H05945, JP15H05935, and JP15K21745) (A.T.), and Research Projects with Heavy Ions at the GHMC (A.T.).

Acknowledgments

We thank Kathryn D. Held [Massachusetts General Hospital/Harvard Medical School (Boston, MA, USA), GIAR], and Anggraeini Puspitasari (GIAR) for helpful discussions, N. Nakamura, Y. Kakehashi and T. Harada (AES) for providing and improving the 3D clinostat, Yosuke Kano (AEC) and Aya Ishizaki (GHMC) for supporting our experiments, Penny A. Jeggo (University of Sussex) and Atsushi Shibata (GIAR) for supplying 1BR-hTERT cells.

Conflicts of Interest

The authors declare no conflicts of interest.

Abbreviations

3DThree-dimensional
ABL1ABL proto-oncogene 1, non-receptor tyrosine kinase (c-Abl)
ACTA1Actin alpha 1, skeletal muscle
AECAccelerator Engineering Co.
AESAdvanced Engineering Services Co. Ltd.
ATMATM serine/threonine kinase
CCNB1Cyclin B1
CCND1Cyclin D1
CDC20Cell division cycle 20
CDK1Cyclin-dependent kinase 1 (= cell division cycle protein 2, cdc2)
CDK4/6Cyclin-dependent kinase 4/6
CDKN1ACyclin-dependent kinase inhibitor 1A (= p21)
C-ionCarbon ion
DAVIDDatabase for Annotation, Visualization, and Integrated Discovery
DCCDisposable sealed irradiation cell culture chamber
EDGEEmpirical Analysis of DGE
GHMCGunma University Heavy Ion Medical Center
GIARGunma University Initiative for Advanced Research
ISSInternational Space Station
KEGGKyoto Encyclopedia of Genes and Genomes
KPNA2Karyopherin subunit alpha 2
LETLinear energy transfer
MCM4Minichromosome maintenance complex component 4
MDM2MDM2 proto-oncogene
MeV/nMegaelectronvolt per nucleon
μGMicrogravity
MKI67Marker of proliferation Ki-67
NIAIDNational Institute of Allergy and Infectious Diseases
NIHNational Institutes of Health
p53p53 tumor suppressor protein
RORotation for simulated μG
STStanding 1G
STMN1Stathmin 1
TFDP1Transcription factor Dp-1

References

  1. Kahn, J.; Liverman, C.T.; McCoy, M.A. Committee on Ethics Principles and Guidelines for Health Standards for Long Duration and Exploration Spaceflights. In Health Standards for Long Duration and Exploration Spaceflight: Ethics Principles, Responsibilities, and Decision Framework; National Academies Press: Washington, DC, USA, 2014; ISBN 978-0-309-29657-1. [Google Scholar]
  2. Cucinotta, F.A. A new approach to reduce uncertainties in space radiation cancer risk predictions. PLoS ONE 2015, 10, e0120717. [Google Scholar] [CrossRef] [PubMed]
  3. Cucinotta, F.A. Space radiation risks for astronauts on multiple International Space Station missions. PLoS ONE 2014, 9, e96099. [Google Scholar] [CrossRef] [PubMed]
  4. Cucinotta, F.A.; Manuel, F.K.; Jones, J.; Iszard, G.; Murrey, J.; Djojonegro, B.; Wear, M. Space radiation and cataracts in astronauts. Radiat. Res. 2001, 156, 460–466. [Google Scholar] [CrossRef]
  5. Jones, J.A.; McCarten, M.; Manuel, K.; Djojonegoro, B.; Murray, J.; Feiversen, A.; Wear, M. Cataract formation mechanisms and risk in aviation and space crews. Aviat. Space Environ. Med. 2007, 78, A56–A66. [Google Scholar] [PubMed]
  6. Cucinotta, F.A.; Alp, M.; Sulzman, F.M.; Wang, M. Space radiation risks to the central nervous system. Life Sci. Space Res. 2014, 2, 54–69. [Google Scholar] [CrossRef] [Green Version]
  7. Fernandez-Gonzalo, R.; Baatout, S.; Moreels, M. Impact of particle irradiation on the immune system: From the clinic to Mars. Front. Immunol. 2017, 8, 177. [Google Scholar] [CrossRef] [PubMed]
  8. Delp, M.D.; Charvat, J.M.; Limoli, C.L.; Globus, R.K.; Ghosh, P. Apollo lunar astronauts show higher cardiovascular disease mortality: Possible deep space radiation effects on the vascular endothelium. Sci. Rep. 2016, 6, 29901. [Google Scholar] [CrossRef] [PubMed]
  9. Cucinotta, F.A.; Hamada, N.; Little, M.P. No evidence for an increase in circulatory disease mortality in astronauts following space radiation exposures. Life Sci. Space Res. 2016, 10, 53–56. [Google Scholar] [CrossRef]
  10. Durante, M.; Cucinotta, F.A. Heavy ion carcinogenesis and human space exploration. Nat. Rev. Cancer 2008, 8, 465–472. [Google Scholar] [CrossRef]
  11. Bender, M.A.; Gooch, P.C.; Kondo, S. The Gemini-XI S-4 spaceflight-radiation interaction experiment: The human blood experiment. Radiat. Res. 1968, 34, 228–238. [Google Scholar] [CrossRef]
  12. Horneck, G.; Rettberg, P.; Kozubek, S.; Baumstark-Khan, C.; Rink, H.; Schäfer, M.; Schmitz, C. The influence of microgravity on repair of radiation-induced DNA damage in bacteria and human fibroblasts. Radiat. Res. 1997, 147, 376–384. [Google Scholar] [CrossRef] [PubMed]
  13. Pross, H.D.; Kiefer, J. Repair of cellular radiation damage in space under microgravity conditions. Radiat. Environ. Biophys. 1999, 38, 133–138. [Google Scholar] [CrossRef] [PubMed]
  14. Takahashi, A.; Ohnishi, K.; Takahashi, S.; Masukawa, M.; Sekikawa, K.; Amano, T.; Nakano, T.; Nagaoka, S.; Ohnishi, T. The effects of microgravity on induced mutation in Escherichia coli and Saccharomyces cerevisiae. Adv. Space Res. 2001, 28, 555–561. [Google Scholar] [CrossRef]
  15. Takahashi, A.; Ohnishi, K.; Takahashi, S.; Masukawa, M.; Sekikawa, K.; Amano, T.; Nakano, T.; Nagaoka, S.; Ohnishi, T. The effects of microgravity on ligase activity in the repair of DNA double-strand breaks. Int. J. Radiat. Biol. 2000, 76, 783–788. [Google Scholar] [CrossRef] [PubMed]
  16. Bücker, H.; Horneck, G.; Reitz, G. Embryogenesis and organogenesis of Carausius morosus under spaceflight conditions. Naturwissenschaften 1986, 73, 433–434. [Google Scholar] [CrossRef] [PubMed]
  17. Gao, Y.; Xu, D.; Zhao, L.; Zhang, M.; Sun, Y. Effects of microgravity on DNA damage response in Caenorhabditis elegans during Shenzhou-8 spaceflight. Int. J. Radiat. Biol. 2015, 91, 531–539. [Google Scholar] [CrossRef] [PubMed]
  18. Ikenaga, M.; Yoshikawa, I.; Kojo, M.; Ayaki, T.; Ryo, H.; Ishizaki, K.; Kato, T.; Yamamoto, H.; Hara, R. Mutations induced in Drosophila during space flight. Biol. Sci. Space 1997, 11, 346–350. [Google Scholar] [CrossRef] [PubMed]
  19. Kobayashi, Y.; Kikuchi, M.; Nagaoka, S.; Watanabe, H. Recovery of Deinococcus radiodurans from radiation damage was enhanced under microgravity. Biol. Sci. Space 1996, 10, 97–101. [Google Scholar] [CrossRef] [PubMed]
  20. Yatagai, F.; Ishioka, N. Are biological effects of space radiation really altered under the microgravity environment? Life Sci. Space Res. 2014, 3, 76–89. [Google Scholar] [CrossRef]
  21. Moreno-Villanueva, M.; Wong, M.; Lu, T.; Zhang, Y.; Wu, H. Interplay of space radiation and microgravity in DNA damage and DNA damage response. NPJ Microgravity 2017, 3, 14. [Google Scholar] [CrossRef] [PubMed]
  22. Yatagai, F.; Honma, M.; Dohmae, N.; Ishioka, N. Biological effects of space environmental factors: A possible interaction between space radiation and microgravity. Life Sci. Space Res. 2019, 20, 113–123. [Google Scholar] [CrossRef] [PubMed]
  23. Indo, H.P.; Tomiyoshi, T.; Suenaga, S.; Tomita, K.; Suzuki, H.; Masuda, D.; Terada, M.; Ishioka, N.; Gusev, O.; Cornette, R.; et al. MnSOD downregulation induced by extremely low 0.1 mGy single and fractionated X-rays and microgravity treatment in human neuroblastoma cell line, NB-1. J. Clin. Biochem. Nutr. 2015, 57, 98–104. [Google Scholar] [CrossRef] [PubMed] [Green Version]
  24. Wang, T.; Sun, Q.; Xu, W.; Li, F.; Li, H.; Lu, J.; Wu, L.; Wu, Y.; Liu, M.; Bian, P. Modulation of modeled microgravity on radiation-induced bystander effects in Arabidopsis thaliana. Mutat. Res. 2015, 773, 27–36. [Google Scholar] [CrossRef]
  25. Beck, M.; Moreels, M.; Quintens, R.; Abou-El-Ardat, K.; El-Saghire, H.; Tabury, K.; Michaux, A.; Janssen, A.; Neefs, M.; van Oostveldt, P.; et al. Chronic exposure to simulated space conditions predominantly affects cytoskeleton remodeling and oxidative stress response in mouse fetal fibroblasts. Int. J. Mol. Med. 2014, 34, 606–615. [Google Scholar] [CrossRef] [Green Version]
  26. Pani, G.; Verslegers, M.; Quintens, R.; Samari, N.; de Saint-Georges, L.; van Oostveldt, P.; Baatout, S.; Benotmane, M.A. Combined exposure to simulated microgravity and acute or chronic radiation reduces neuronal network integrity and survival. PLoS ONE 2016, 11, e0155260. [Google Scholar] [CrossRef]
  27. Herranz, R.; Anken, R.; Boonstra, J.; Braun, M.; Christianen, P.C.; de Geest, M.; Hauslage, J.; Hilbig, R.; Hill, R.J.; Lebert, M.; et al. Ground-based facilities for simulation of microgravity: Organism-specific recommendations for their use, and recommended terminology. Astrobiology 2013, 13, 1–17. [Google Scholar] [CrossRef]
  28. Ikeda, H.; Souda, H.; Puspitasari, A.; Held, K.D.; Hidema, J.; Nikawa, T.; Yoshida, Y.; Kanai, T.; Takahashi, A. A new system for three-dimensional clinostat synchronized X-irradiation with high-speed shutter for space radiation research. Biol. Sci. Space 2016, 30, 8–16. [Google Scholar] [CrossRef]
  29. Ikeda, H.; Souda, H.; Puspitasari, A.; Held, K.D.; Hidema, J.; Nikawa, T.; Yoshida, Y.; Kanai, T.; Takahashi, A. Development and performance evaluation of a three-dimensional clinostat synchronized heavy-ion irradiation system. Life Sci. Space Res. 2017, 12, 51–60. [Google Scholar] [CrossRef]
  30. Takahashi, A.; Ikeda, H.; Souda, H.; Puspitasari, A.; Held, K.D.; Hidema, J.; Nikawa, T.; Yoshida, Y.; Kanai, T. Performance evaluation of new devices to synchronize heavy-ion or X-ray irradiation and simulated microgravity for space radiation research~Improvement of a control stage. In Proceedings of the 31st International Symposium on Space Technology and Science, Tokyo, Japan, 6 June 2017. [Google Scholar]
  31. Hada, M.; Ikeda, H.; Rhone, J.R.; Beitman, A.J.; Plante, I.; Souda, H.; Yoshida, Y.; Held, K.D.; Fujiwara, K.; Saganti, P.B.; et al. Increased chromosome aberrations in cells exposed simultaneously to simulated microgravity and radiation. Int. J. Mol. Sci. 2019, 20, 43. [Google Scholar] [CrossRef]
  32. Hartwell, L. Defects in a cell cycle checkpoint may be responsible for the genomic instability of cancer cells. Cell 1992, 71, 543–546. [Google Scholar] [CrossRef]
  33. Cho, R.J.; Huang, M.; Campbell, M.J.; Dong, H.; Steinmetz, L.; Sapinoso, L.; Hampton, G.; Elledge, S.J.; Davis, R.W.; Lockhart, D.J. Transcriptional regulation and function during the human cell cycle. Nat. Genet. 2001, 27, 48–54. [Google Scholar] [CrossRef]
  34. Cohen, B.A.; Mitra, R.D.; Hughes, J.D.; Church, G.M. A computational analysis of whole-genome expression data reveals chromosomal domains of gene expression. Nat. Genet. 2000, 26, 183–186. [Google Scholar] [CrossRef] [PubMed]
  35. Zeitlin, C.; Hassler, D.M.; Cucinotta, F.A.; Ehresmann, B.; Wimmer-Schweingruber, R.F.; Brinza, D.E.; Kang, S.; Weigle, G.; Böttcher, S.; Böhm, E.; et al. Measurements of energetic particle radiation in transit to Mars on the Mars science laboratory. Science 2013, 340, 1080–1084. [Google Scholar] [CrossRef] [PubMed]
  36. Huang, D.W.; Sherman, B.T.; Lempicki, R.A. Systematic and integrative analysis of large gene lists using DAVID Bioinformatics Resources. Nat. Protoc. 2009, 4, 44–57. [Google Scholar] [CrossRef] [PubMed]
  37. Kanehisa, M.; Goto, S. KEGG: Kyoto Encyclopedia of Genes and Genomes. Nucleic Acids Res. 2000, 28, 27–30. [Google Scholar] [CrossRef]
  38. Formisano, L.; Lu, Y.; Servetto, A.; Hanker, A.B.; Jansen, V.M.; Bauer, J.A.; Sudhan, D.R.; Guerrero-Zotano, A.L.; Croessmann, S.; Guo, Y.; et al. Aberrant FGFR signaling mediates resistance to CDK4/6 inhibitors in ER+ breast cancer. Nat. Commun. 2018, 10, 1373. [Google Scholar] [CrossRef] [PubMed]
  39. Levav-Cohen, Y.; Goldberg, Z.; Zuckerman, V.; Grossman, T.; Haupt, S.; Haupt, Y. C-Abl as a modulator of p53. Biochem. Biophys. Res. Commun. 2005, 331, 737–749. [Google Scholar] [CrossRef]
  40. Charrier-Savournin, F.B.; Château, M.T.; Gire, V.; Sedivy, J.; Piette, J.; Dulic, V. p21-Mediated nuclear retention of cyclin B1-Cdk1 in response to genotoxic stress. Mol. Biol. Cell. 2004, 15, 3965–3976. [Google Scholar] [CrossRef] [PubMed]
  41. Harper, J.W.; Elledge, S.J.; Keyomarsi, K.; Dynlacht, B.; Tsai, L.H.; Zhang, P.; Dobrowolski, S.; Bai, C.; Connell-Crowley, L.; Swindell, E. Inhibition of cyclin-dependent kinases by p21. Mol. Biol. Cell. 1995, 6, 387–400. [Google Scholar] [CrossRef] [PubMed]
  42. Gao, C.L.; Wang, G.W.; Yang, G.Q.; Yang, H.; Zhuang, L. Karyopherin subunit-α 2 expression accelerates cell cycle progression by upregulating CCNB2 and CDK1 in hepatocellular carcinoma. Oncol. Lett. 2018, 15, 2815–2820. [Google Scholar] [CrossRef]
  43. Ishimi, Y.; Komamura-Kohno, Y.; Kwon, H.J.; Yamada, K.; Nakanishi, M. Identification of MCM4 as a target of the DNA replication block checkpoint system. J. Biol. Chem. 2003, 278, 24644–24650. [Google Scholar] [CrossRef]
  44. Giono, L.E.; Resnick-Silverman, L.; Carvajal, L.A.; St Clair, S.; Manfredi, J.J. Mdm2 promotes Cdc25C protein degradation and delays cell cycle progression through the G2/M phase. Oncogene 2017, 36, 6762–6773. [Google Scholar] [CrossRef] [Green Version]
  45. Sun, X.; Bizhanova, A.; Matheson, T.D.; Yu, J.; Zhu, L.J.; Kaufman, P.D. Ki-67 contributes to normal cell cycle progression and inactive x heterochromatin in p21 checkpoint-proficient human cells. Mol. Cell. Biol. 2017, 37, e00569-16. [Google Scholar] [CrossRef]
  46. Rubin, C.I.; Atweh, G.F. The role of stathmin in the regulation of the cell cycle. J. Cell. Biochem. 2004, 93, 242–250. [Google Scholar] [CrossRef]
  47. Hauslage, J.; Cevik, V.; Hemmersbach, R. Pyrocystis noctiluca represents an excellent bioassay for shear forces induced in ground-based microgravity simulators (clinostat and random positioning machine). npj Microgravity 2017, 3, 12. [Google Scholar] [CrossRef]
  48. Todd, P. Physical effects at the cellular level under altered gravity conditions. Adv. Space Res. 1992, 12, 43–49. [Google Scholar] [CrossRef]
  49. Deckbar, D.; Jeggo, P.A.; Löbrich, M. Understanding the limitations of radiation-induced cell cycle checkpoints. Crit. Rev. Biochem. Mol. Biol. 2011, 46, 271–283. [Google Scholar] [CrossRef] [Green Version]
  50. Jeggo, P.A.; Löbrich, M. Contribution of DNA repair and cell cycle checkpoint arrest to the maintenance of genomic stability. DNA Repair 2006, 5, 1192–1198. [Google Scholar] [CrossRef] [Green Version]
  51. Takahashi, A.; Ohnishi, K.; Tsuji, K.; Matsumoto, H.; Aoki, H.; Wang, X.; Tamamoto, T.; Yukawa, O.; Furusawa, Y.; Ejima, Y.; et al. WAF1 accumulation by carbon-ion beam and alpha-particle irradiation in human glioblastoma cultured cells. Int. J. Radiat. Biol. 2000, 76, 335–341. [Google Scholar] [CrossRef]
  52. Yasuda, H.; Komiyama, T.; Fujitaka, K. Probability of hippocampus cell hits by high-LET space radiation in a low-Earth-orbit mission (STS-91). Phys. Med. 2001, 17, S166–S169. [Google Scholar]
  53. Wang, J.; Zhang, J.; Bai, S.; Wang, G.; Mu, L.; Sun, B.; Wang, D.; Kong, Q.; Liu, Y.; Yao, X.; et al. Simulated microgravity promotes cellular senescence via oxidant stress in rat PC12 cells. Neurochem. Int. 2009, 55, 710–716. [Google Scholar] [CrossRef]
  54. Coinu, R.; Chiaviello, A.; Galleri, G.; Franconi, F.; Crescenzi, E.; Palumbo, G. Exposure to modeled microgravity induces metabolic idleness in malignant human MCF-7 and normal murine VSMC cells. FEBS Lett. 2006, 580, 2465–2470. [Google Scholar] [CrossRef] [Green Version]
  55. Cotrupi, S.; Ranzani, D.; Maier, J.A. Impact of modeled microgravity on microvascular endothelial cells. Biochim. Biophys. Acta. 2005, 1746, 163–168. [Google Scholar] [CrossRef] [Green Version]
  56. Arase, Y.; Nomura, J.; Sugaya, S.; Sugita, K.; Kita, K.; Suzuki, N. Effects of 3-D clino-rotation on gene expression in human fibroblast cells. Cell Biol. Int. 2002, 26, 225–233. [Google Scholar] [CrossRef]
  57. Yuge, L.; Kajiume, T.; Tahara, H.; Kawahara, Y.; Umeda, C.; Yoshimoto, R.; Wu, S.L.; Yamaoka, K.; Asashima, M.; Kataoka, K.; et al. Microgravity potentiates stem cell proliferation while sustaining the capability of differentiation. Stem Cells Dev. 2006, 15, 921–929. [Google Scholar] [CrossRef]
  58. Li, Y.; He, L.; Pan, S.; Zhang, L.; Zhang, W.; Yi, H.; Niu, Y. Three-dimensional simulated microgravity culture improves the proliferation and odontogenic differentiation of dental pulp stem cell in PLGA scaffolds implanted in mice. Mol. Med. Rep. 2017, 15, 873–878. [Google Scholar] [CrossRef]
  59. Lei, X.H.; Ning, L.N.; Cao, Y.J.; Liu, S.; Zhang, S.B.; Qiu, Z.F.; Hu, H.M.; Zhang, H.S.; Liu, S.; Duan, E.K. NASA-approved rotary bioreactor enhances proliferation of human epidermal stem cells and supports formation of 3D epidermis-like structure. PLoS ONE 2011, 6, e26603. [Google Scholar] [CrossRef]
  60. Moreno-Villanueva, M.; Feiveson, A.H.; Krieger, S.; Kay Brinda, A.; von Scheven, G.; Bürkle, A.; Crucian, B.; Wu, H. Synergistic effects of weightlessness, isoproterenol, and radiation on DNA damage response and cytokine production in immune cells. Int. J. Mol. Sci. 2018, 19, 3689. [Google Scholar] [CrossRef]
  61. Canova, S.; Fiorasi, F.; Mognato, M.; Grifalconi, M.; Reddi, E.; Russo, A.; Celotti, L. “Modeled microgravity” affects cell response to ionizing radiation and increases genomic damage. Radiat. Res. 2005, 163, 191–199. [Google Scholar] [CrossRef]
  62. Girardi, C.; De Pittà, C.; Casara, S.; Sales, G.; Lanfranchi, G.; Celotti, L.; Mognato, M. Analysis of miRNA and mRNA expression profiles highlights alterations in ionizing radiation response of human lymphocytes under modeled microgravity. PLoS ONE 2012, 7, e31293. [Google Scholar] [CrossRef]
  63. Mosesso, P.; Schuber, M.; Seibt, D.; Schmitz, C.; Fiore, M.; Schinoppi, A.; Penna, S.; Palitti, F. X-ray-induced chromosome aberrations in human lymphocytes in vitro are potentiated under simulated microgravity conditions (Clinostat). Phys. Med. 2001, 17, S264–S266. [Google Scholar]
  64. Ding, L.H.; Park, S.; Peyton, M.; Girard, L.; Xie, Y.; Minna, J.D.; Story, M.D. Distinct transcriptome profiles identified in normal human bronchial epithelial cells after exposure to γ-rays and different elemental particles of high Z and energy. BMC Genom. 2013, 14, 372. [Google Scholar] [CrossRef] [PubMed]
  65. Blaber, E.A.; Dvorochkin, N.; Lee, C.; Alwood, J.S.; Yousuf, R.; Pianetta, P.; Globus, R.K.; Burns, B.P.; Almeida, E.A. Microgravity induces pelvic bone loss through osteoclastic activity, osteocytic osteolysis, and osteoblastic cell cycle inhibition by CDKN1a/p21. PLoS ONE 2013, 8, e61372. [Google Scholar] [CrossRef] [PubMed]
  66. Wang, P.; Tian, H.; Zhang, J.; Qian, J.; Li, L.; Shi, L.; Zhao, Y. Spaceflight/microgravity inhibits the proliferation of hematopoietic stem cells by decreasing Kit-Ras/cAMP-CREB pathway networks as evidenced by RNA-Seq assays. FASEB J. 2019, 33, 5903–5913. [Google Scholar] [CrossRef] [PubMed]
  67. Ikenaga, M.; Hirayama, J.; Kato, T.; Kitao, H.; Han, Z.B.; Ishizaki, K.; Nishizawa, K.; Suzuki, F.; Cannon, T.F.; Fukui, K.; et al. Effect of space flight on the frequency of micronuclei and expression of stress-responsive proteins in cultured mammalian cells. J. Radiat. Res. 2002, 43, S141–S147. [Google Scholar] [CrossRef]
  68. Takahashi, A.; Suzuki, H.; Omori, K.; Seki, M.; Hashizume, T.; Shimazu, T.; Ishioka, N.; Ohnishi, T. Expression of p53-regulated proteins in human cultured lymphoblastoid TSCE5 and WTK1 cell lines during spaceflight. J. Radiat. Res. 2012, 53, 168–175. [Google Scholar] [CrossRef] [PubMed]
  69. Ohnishi, T.; Ohnishi, K.; Takahashi, A.; Taniguchi, Y.; Sato, M.; Nakano, T.; Nagaoka, S. Detection of DNA damage induced by space radiation in Mir and space shuttle. J. Radiat. Res. 2002, 43, S133–S136. [Google Scholar] [CrossRef] [PubMed]
  70. Ohnishi, T.; Takahashi, A.; Nagamatsu, A.; Omori, K.; Suzuki, H.; Shimazu, T.; Ishioka, N. Detection of space radiation-induced double strand breaks as a track in cell nucleus. Biochem. Biophys. Res. Commun. 2009, 390, 485–488. [Google Scholar] [CrossRef] [PubMed]
  71. Lu, T.; Zhang, Y.; Wong, M.; Feiveson, A.; Gaza, R.; Stoffle, N.; Wang, H.; Wilson, B.; Rohde, L.; Stodieck, L.; et al. Detection of DNA damage by space radiation in human fibroblasts flown on the International Space Station. Life Sci. Space Res. 2017, 12, 24–31. [Google Scholar] [CrossRef] [PubMed] [Green Version]
  72. Garrett-Bakelman, F.E.; Darshi, M.; Green, S.J.; Gur, R.C.; Lin, L.; Macias, B.R.; McKenna, M.J.; Meydan, C.; Mishra, T.; Nasrini, J.; et al. The NASA Twins Study: A multidimensional analysis of a year-long human spaceflight. Science 2019, 364, eaau8650. [Google Scholar] [CrossRef]
  73. Zhang, Y.; Moreno-Villanueva, M.; Krieger, S.; Ramesh, G.T.; Neelam, S.; Wu, H. Transcriptomics, NF-κB pathway, and their potential spaceflight-related health consequences. Int. J. Mol. Sci. 2017, 18, 1166. [Google Scholar] [CrossRef] [PubMed]
  74. Zhang, Y.; Lu, T.; Wong, M.; Wang, X.; Stodieck, L.; Karouia, F.; Story, M.; Wu, H. Transient gene and microRNA expression profile changes of confluent human fibroblast cells in spaceflight. FASEB J. 2016, 30, 2211–2224. [Google Scholar] [CrossRef] [PubMed] [Green Version]
  75. Hammond, T.G.; Lewis, F.C.; Goodwin, T.J.; Linnehan, R.M.; Wolf, D.A.; Hire, K.P.; Campbel, W.C.; Benes, E.; O’Reilly, K.C.; Globus, R.K.; et al. Gene expression in space. Nat. Med. 1999, 5, 359. [Google Scholar] [CrossRef]
  76. Harada-Sukeno, A.; Kohno, S.; Nakano, R.; Hirasaka, K.; Higashibata, A.; Yamazaki, T.; Ishioka, N.; Suzuki, H.; Shimazu, T.; Maita, A.; et al. Myo Lab: A JAXA cell biology experiment in “Kibo (JEM)” of the International Space Station. Biol. Sci. Space 2009, 23, 189–193. [Google Scholar] [CrossRef]
  77. Tanigawa, N.; Yano, S.; Higashibata, A.; Tsuchiya, Y.; Tanii, H.; Ando, N.; Kubota, K.; Nagase, M. Development and validation of a closed chamber for cell culture experiments in space. Biol. Sci. Space 2014, 28, 1–5. [Google Scholar] [CrossRef]
  78. Ohno, T.; Kanai, T.; Yamada, S.; Yusa, K.; Tashiro, M.; Shimada, H.; Torikai, K.; Yoshida, Y.; Kitada, Y.; Katoh, H.; et al. Carbon ion radio-therapy at the Gunma university heavy ion medical center: New facility set-up. Cancers 2011, 3, 4046–4060. [Google Scholar] [CrossRef] [PubMed]
Figure 1. Heatmap of 82 cell cycle-related genes under various conditions. ST, standing 1G; RO, rotation for simulated μG; X, X-ray irradiation; C, carbon-ion irradiation; 3, 3 h after irradiation; 24, 24 h after irradiation. After treatment, a total of 36 samples was analyzed for each condition (ST or RO alone, N = 6; the other 8 conditions, N = 3). The range of expression levels was from −7.00 (yellow-green, down-regulation) to 13.00 (red, up-regulation); black represents 0.00. When the difference between the transformed expression value of a gene under each condition and that of ST was smaller than 1.0, the gene was allocated to the no change group (a). If the difference was larger than 1.0, it was put into either the down-regulated (b) or up-regulated group (c).
Ijms 20 04791 g001
Figure 2. Criteria for identifying genes whose expression levels are different in 1BR-hTERT human fibroblasts when they are exposed simultaneously to radiation and simulated μG vs. when exposed to radiation alone. To narrow down the number of target genes from the total of 57,773 genes, cell cycle-related genes were selected in Step 1. In Step 2, the threshold was set as when the maximum normalized expression value of standing (1G) condition was 1000 or more. The normalized expression values of each condition were calculated by CLC Main Workbench software. If this threshold was exceeded, Step 3 involved comparing the simulated μG effect between irradiated samples: normalized expression value of irradiated standing 1G samples vs. simulated μG irradiated samples. If Step 3 showed a significant difference (EDGE; p < 0.05) between without and with simulated μG, the analysis proceeded to Step 5. If no difference was noted in Step 3, these genes proceeded to Step 4 for judging the simulated μG effect alone: comparison of expression values of 1G non-irradiated samples vs. rotation simulated μG condition non-irradiated samples. When genes passed this step (EDGE; p < 0.05), they were sent to Step 5 for the calculation of fold change while considering the simulated μG effect alone.
Ijms 20 04791 g002
Figure 3. Comparison of relative expression value changes of nine cell cycle-related genes screened via Step 3 and Step 4 in Figure 2; relative expression values were determined by dividing the normalized expression value of each condition by the maximum value (Max) in each gene. The normalized expression values were calculated by CLC Main Workbench software. ST, standing 1G; RO, rotation for simulated μG; X, X-ray irradiation; C, carbon-ion irradiation; 3, 3 h after irradiation; 24, 24 h after irradiation. Significantly decreased relative expression values as revealed by statistical analysis with EDGE (* p < 0.05, NS = not significant) are shown with blue arrows and increased ones with red arrows. Bar graphs indicate relative expression value ± standard error under each condition (ST or RO alone, N = 6; the other 8 conditions, N = 3).
Ijms 20 04791 g003
Figure 4. Schematic representation of the proposed model of cell cycle-related pathway modified by combined effect of C-ion exposure with simulated μG in 1BR-hTERT human fibroblasts. The pink column shows cell cycle-promoting genes and blue column indicates cell cycle-suppressing ones.
Ijms 20 04791 g004
Figure 5. Schema of 3D clinostat synchronized irradiation systems for studying the combined effects of radiation and simulated μG. For synchronization, X-ray irradiation using a high-speed shutter (A) and C-ion irradiation with a respiratory gating system as used in heavy ion radiotherapy were performed (B).
Ijms 20 04791 g005
Figure 6. Experimental design from cell seeding to RNA extraction using human fibroblasts. ST (ae) and RO conditions (fj). No irradiation (a,f), X-ray (b,d,g,i), or C-ion (c,e,h,j) irradiation.
Ijms 20 04791 g006
Table 1. Numbers of up- and down-regulated gene sets and the top three of related cellular pathways after simulated μG or radiation treatment in human fibroblasts.
(a) Genes up-regulated by radiation and/or simulated μG
vs. STTotal GenesCellular Pathways (Number of Genes)
ST-X3315p53 signaling (7), FoxO signaling (5),
Adrenergic signaling in cardiomyocytes (5)
ST-X24523Neuroactive ligand–receptor interaction (13),
Calcium signaling (11), cAMP signaling (11)
ST-C3253Cytokine–cytokine receptor interaction (7),
p53 signaling (6), Measles (5)
ST-C24350p53 signaling (6), FoxO signaling (5)
RO-X3204p53 signaling (4)
RO-X24674Neuroactive ligand–receptor interaction (17),
Calcium signaling (11), cAMP signaling (11)
RO-C3211p53 signaling (7),
Cytokine–cytokine receptor interaction (6)
RO-C24339PI3K–Akt signaling (10), p53 signaling (6),
ABC transporters (5)
RO140Morphine addiction (3)
(b) Genes down-regulated by radiation and/or simulated μG
vs. STTotal GenesCellular Pathways (Number of Genes)
ST-X379Cell cycle (5), MicroRNAs in cancer (4), p53 signaling (3)
ST-X24439Systemic lupus erythematosus (46), Alcoholism (46),
Cell cycle (32)
ST-C3198Cell cycle (5), Systemic lupus erythematosus (4)
ST-C24663Systemic lupus erythematosus (55), Alcoholism (55),
Cell cycle (36)
RO-X386Pathways in cancer (5)
RO-X24507Alcoholism (46), Systemic lupus erythematosus (45),
Cell cycle (33)
RO-C3210Pathways in cancer (7)
RO-C24702Systemic lupus erythematosus (55), Alcoholism (55),
Cell cycle (35)
RO103* Calcium ion binding (6),
* G-protein coupled purinergic nucleotide receptor activity (2),
* Myosin binding (2)
ST, standing 1G; RO, rotation for simulated μG; X, X-ray irradiation; C, carbon-ion irradiation; 3, 3 h after irradiation; 24, 24 h after irradiation. * The list by Gene Ontology-Molecular Function-Direct with DAVID (p < 0.05, top three show a higher percentage in narrowing as biological process).
Table 2. Summary of nine cell cycle-related genes affected by combined treatment with radiation and simulated μG identified by the screening criteria shown in Figure 2.
Cell CycleGene ID
(Protein)
EnsemblFunctionRef.
SuppressionABL1
(c-Abl)
ENSG00000097007This gene encodes a protein tyrosine kinase. C-Abl protects p53 by antagonizing the inhibitory effect of Mdm2, an action that requires direct interplay between c-Abl and Mdm2.[39]
CDKN1A
(p21)
ENSG00000124762The encoded protein binds to and inhibits the activity of cyclin D1–CDK4/6 or cyclin B1–CDK1 complexes, and thus functions as a regulator of cell cycle progression at G1 and G2.[40,41]
PromotionCCNB1
(Cyclin B1)
ENSG00000134057Activated cyclin B1 with CDK1 promotes several of the events of early mitosis. DNA damage leads to nuclear accumulation of inactive cyclin B1–CDK1 complexes by p21, and contributes to the establishment of permanent G2 arrest.[40]
CCND1
(Cyclin D1)
ENSG00000110092This cyclin forms a complex with and functions as a regulatory subunit of CDK4/6, whose activity is required for cell cycle G1/S transition. DNA damage leads to nuclear accumulation of inactive cyclin D1–CDK4/6 complexes by p21, and contributes to the establishment of G1 arrest.[41]
KPNA2
(KPNA2)
ENSG00000182481KPNA2 expression accelerates cell cycle progression by up-regulating cyclin B and CDK1.[42]
MCM4
(MCM4)
ENSG00000104738MCM4, a subunit of a putative replicative helicase, is essential for the initiation of eukaryotic genome replication. MCM4 is one of the crucial targets of the DNA replication checkpoint system.[43]
MDM2
(MDM2)
ENSG00000135679MDM2 can promote tumor formation by targeting tumor suppressor p53 proteins for proteasomal degradation. Mdm2 promotes Cdc25C protein degradation and delays cell cycle progression through the G2/M phase.[44]
MKI67
(Ki-67)
ENSG00000148773Ki-67 is associated with and may be necessary for cellular proliferation. Ki-67 contributes to normal cell cycle progression.[45]
STMN1
(Stathmin 1)
ENSG00000117632Stathmin 1 is a ubiquitous cytosolic phosphor-protein. Stathmin is critically important not only for the formation of a normal mitotic spindle upon entry into mitosis but also for regulation of the function of the mitotic spindle in the later stages of mitosis and for the timely exit from mitosis.[46]

