Article

Early Life Stress and High FKBP5 Interact to Increase Anxiety-Like Symptoms through Altered AKT Signaling in the Dorsal Hippocampus

Department of Molecular Medicine, USF Health Byrd Institute, University of South Florida, Tampa, FL 33613, USA
*
Author to whom correspondence should be addressed.
Deceased.
Int. J. Mol. Sci. 2019, 20(11), 2738; https://doi.org/10.3390/ijms20112738
Submission received: 17 April 2019 / Revised: 18 May 2019 / Accepted: 31 May 2019 / Published: 4 June 2019
(This article belongs to the Section Molecular Neurobiology)

Abstract

:
Clinical studies show a significant association of childhood adversities and FK506-binding protein 5 (FKBP5) polymorphisms on increasing the susceptibility for neuropsychiatric disorders. However, the mechanisms by which early life stress (ELS) influences FKBP5 actions have not been fully elucidated. We hypothesized that interactions between ELS and high FKBP5 induce phenotypic changes that correspond to underlying molecular changes in the brain. To test this, we exposed newborn mice overexpressing human FKBP5 in the forebrain, rTgFKBP5, to ELS using a maternal separation. Two months after ELS, we observed that ELS increased anxiety levels, specifically in mice overexpressing FKBP5, an effect that was more pronounced in females. Biochemically, Protein kinase B (AKT) phosphorylation was reduced in the dorsal hippocampus in rTgFKBP5 mice, which demonstrates that significant molecular changes occur as a result of ELS when FKBP5 levels are altered. Taken together, our results have a significant impact on our understanding mechanisms underlying the gene x environment interaction showing that anxiety and AKT signaling in the hippocampus were affected by the combination of ELS and FKBP5. An increased knowledge of the molecular mechanisms underlying these interactions may help determine if FKBP5 could be an effective target for the treatment of anxiety and other mood-related illnesses.

1. Introduction

Mental health disorders are very common, affecting around 1.1 billion people worldwide and 44.7 million adults in the United States [1]. Although there is no population completely resilient to these disorders, there is a lower prevalence in men (15%) compared to women (21.7%) and a lower prevalence in older adults (14.5%) compared to young adults (22.1%), according to the 2017 National Survey on Drug Use and Health [1]. In adolescents, anxiety disorders are the most prevalent mental health conditions [2,3]. Clinical studies have highlighted several factors like age, genetics, and environment [4,5], which can increase susceptibility to neuropsychiatric diseases, including anxiety, depression, and posttraumatic stress disorder (PTSD) [6,7]. These factors are not entirely separate but can actually influence each other. It is now known that environmental factors can modify the genes implicated in mental health disorders, including genes regulating learning, memory, and emotion. We also know that some of these environmental factors, such as early life adversities, can induce long-lasting epigenetic modifications (e.g., DNA methylation) that affect gene and protein expression throughout life and, in some cases, can even be passed down through generations [5]. Some of the most commonly affected genes in neurotransmission and stress response include the serotonin transporter, brain-derived neurotrophic factor, nerve growth factor, and glucocorticoid receptor [8]. These genes encode for proteins involved in crucial developmental, synaptic, and stress response processes.
An impaired stress response, which is mediated by the hypothalamic-pituitary-adrenal (HPA) axis, is a common feature in individuals who are more susceptible to developing mental disorders [9,10]. After stress, the HPA axis mediates the secretion of glucocorticoids (cortisol in humans and corticosterone in rodents) that bind to mineralocorticoid and glucocorticoid (GR) receptors throughout the brain. Activation of these receptors serves as a negative feedback loop controlling or terminating the cellular stress response [11]. Imbalance in this feedback loop at any stage can result in short- and long-term detrimental effects in the brain, inducing neuronal death, slowed neurogenesis, weakened synaptic connections, and increased inflammation, as well as impaired learning and memory processes, which was recently reviewed [12]. One key regulator for reducing the affinity of GR for glucocorticoids is the 51 kDa FK506-binding protein, also known as FKBP5/FKBP51. Increased FKBP5 protein expression and common polymorphisms in the FKBP5 gene are significantly associated with GR resistance [13]. In addition, the interaction of early life stressors (e.g., childhood abuse) with several common FKBP5 allelic variations has been shown to increase susceptibility of many mental health disorders [14,15], indicating that dysregulation of FKBP5 may contribute to a maladaptive stress response in these patients. One specific example, the FKBP5 rs1360780 T-allele variant significantly increase susceptibility to depressive disorders, while the CC allelic variant has been shown to offer protection [13]. In this study, patients with major depression carrying the T-allele carriers presented reduced FKBP5 mRNA induction and higher GR resistance when compared to the FKBP5 rs1360780 CC protective genotype. In a separate study, carriers of the rs1360780 risk variant were more susceptible to anxiety and other mental health disorders when exposed to maltreatment as a child [15,16]. This variant increases FKBP5 expression following stress [16]. However, the causal relationship between altered FKBP5 and early life stress (ELS) has not been tested.
Here, we examined the interaction between ELS and FKBP5 in vivo using the recently developed rTgFKBP5 mouse model, which overexpresses human FKBP5 throughout the forebrain. This model does not show any anxiety-like or depression-like phenotypes basally [17], but we hypothesized that the interaction of high FKBP5 and ELS may yield neuropsychiatric-like symptoms through the altered stress-feedback pathways in the brain. We combined behavioral, molecular, and histochemical approaches to address this question, examining changes in the hippocampus and the amygdala, which are two main brain regions responsible for emotional and cognitive functions and known to be susceptible to stressors. We observed that anxiety levels were increased by the combination of FKBP5 and ELS. We also examined Protein kinase B (AKT) phosphorylation, since it has been previously demonstrated to be inhibited by FKBP5 [18] and is known to regulate autophagy, cell survival, and hippocampal synaptic plasticity, affecting learning and memory processes [19,20]. We found that rTgFKBp5 mice presented reduced AKT Ser374 phosphorylation in the dorsal hippocampus. Together, this result suggests that altered FKBP5 levels can combine with ELS to uniquely alter molecular pathways and increase anxiety-like behavior in vivo.

2. Results

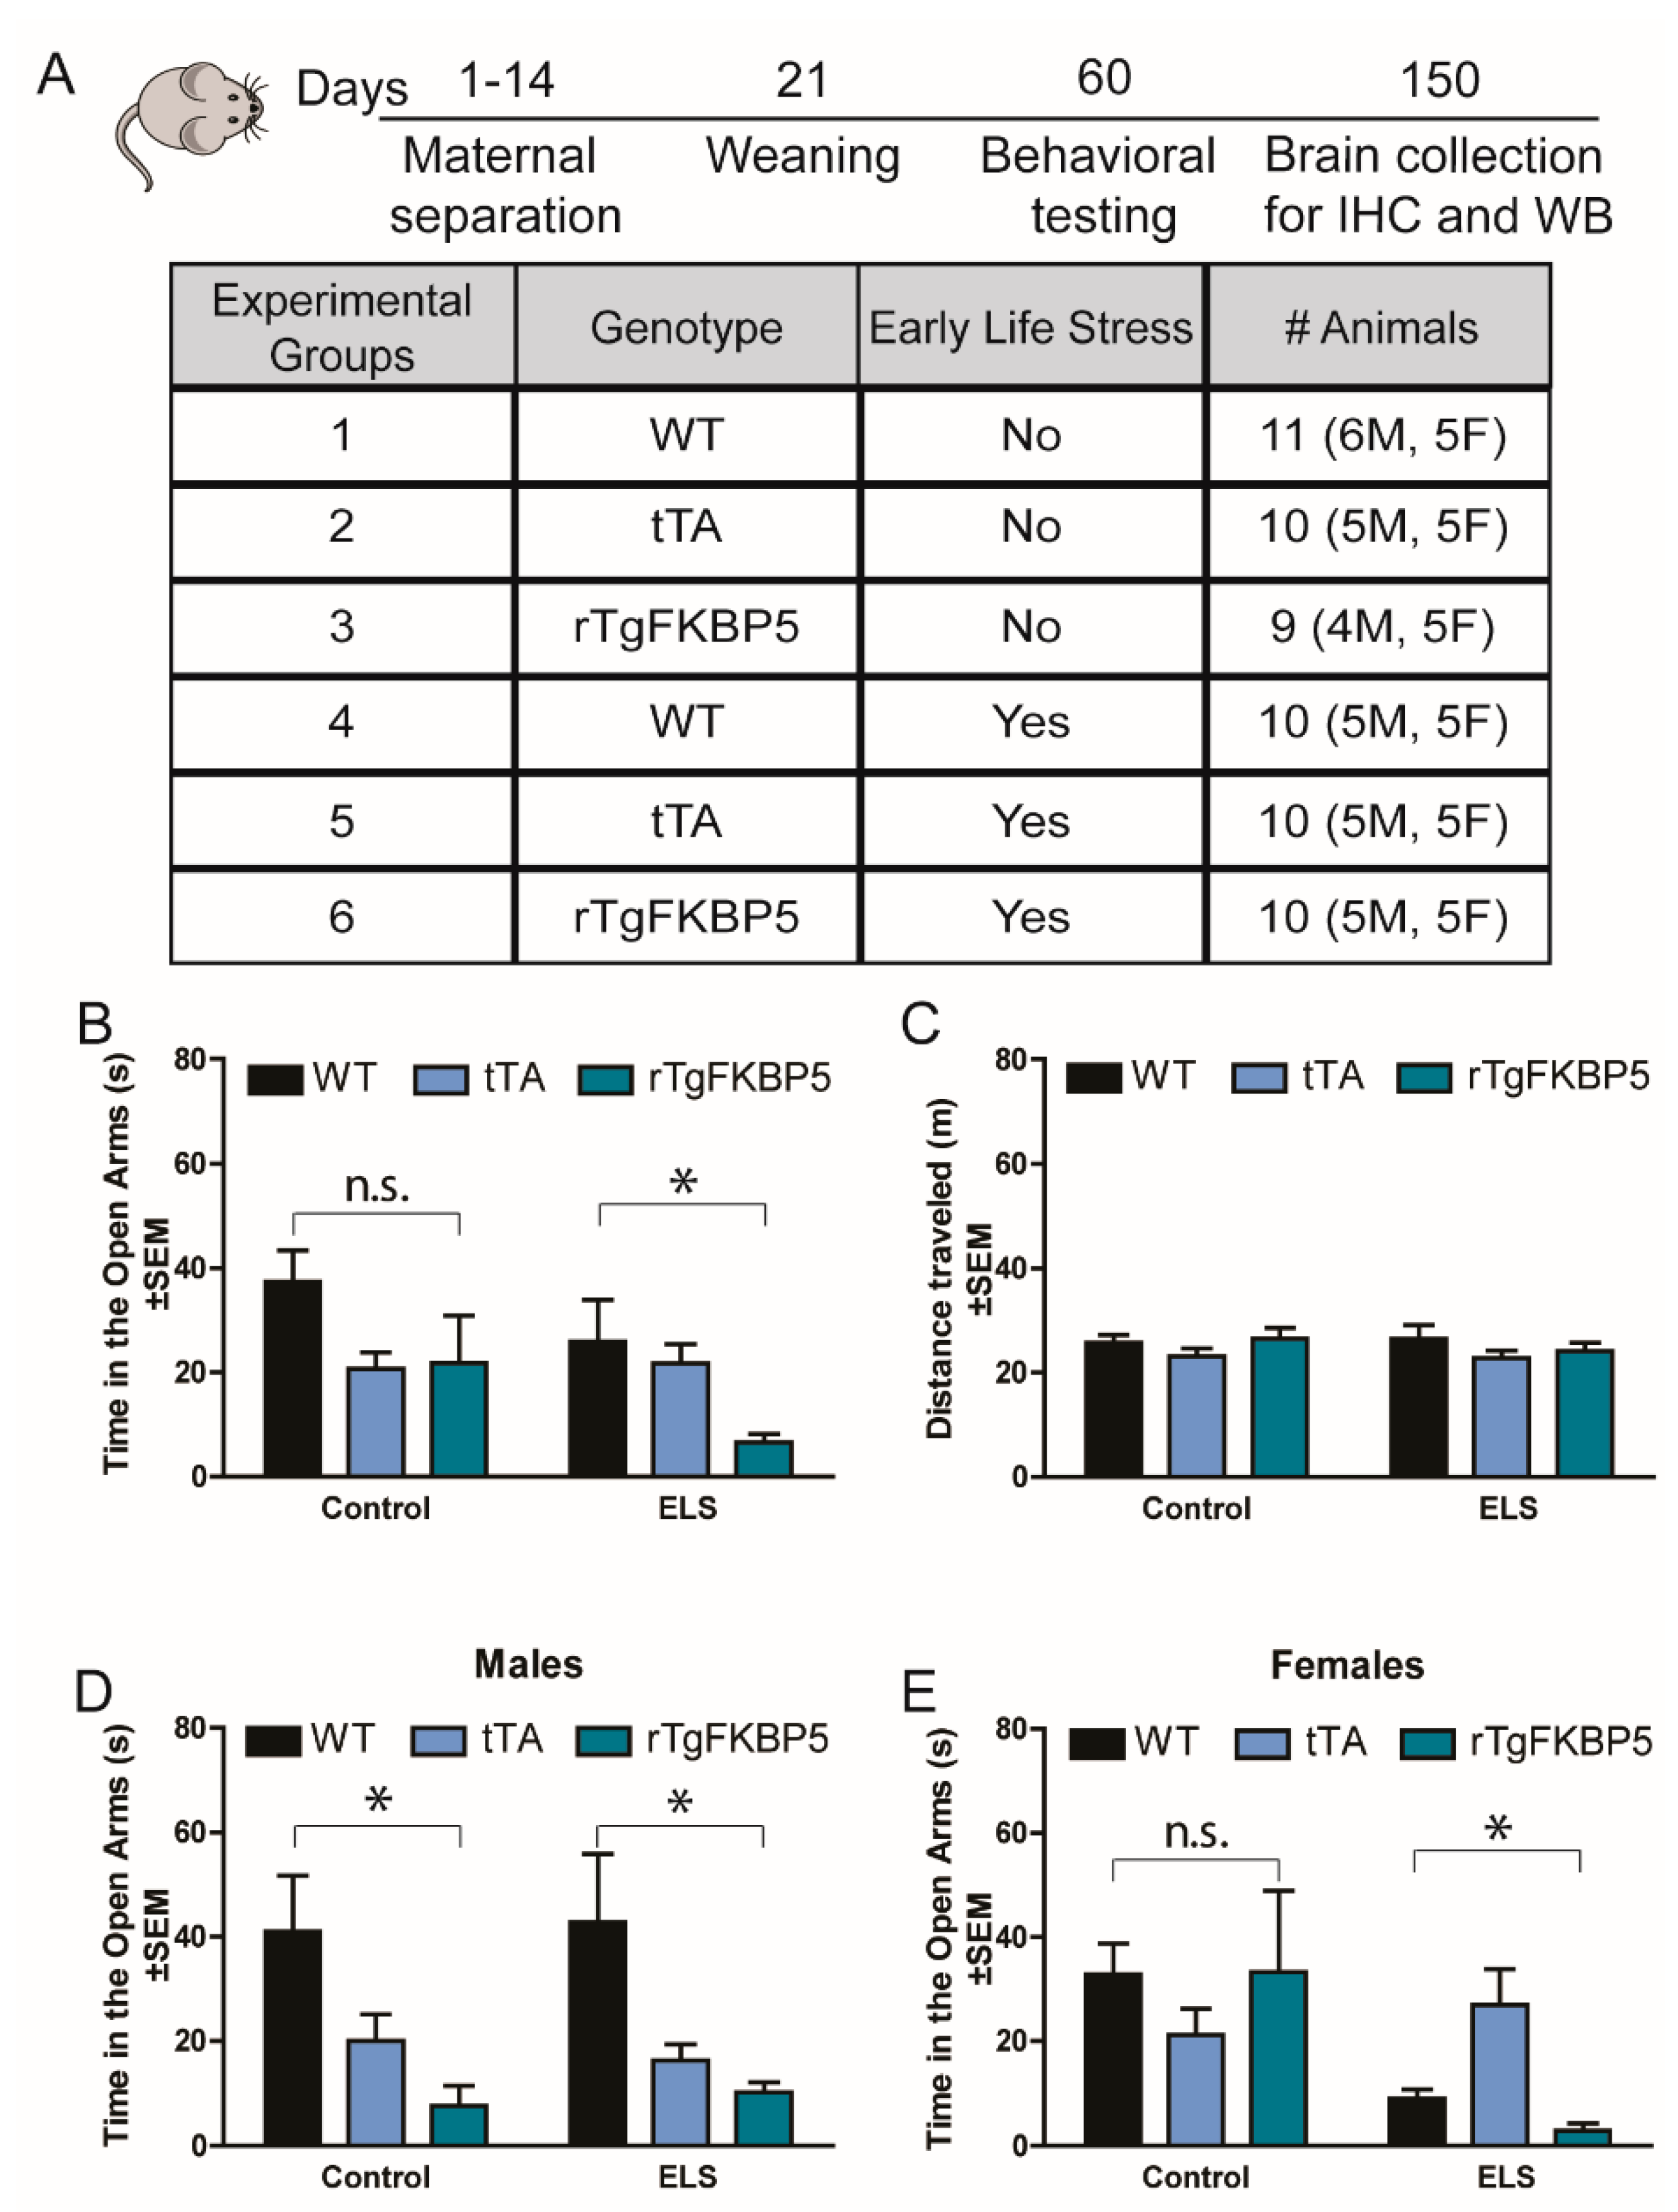
2.1. Early Life Stress Selectively Increases Anxiety-Like Behavior in rTgFKBP5 Mice

To examine the outcomes of the interaction between an adverse environment during early ages with high FKBP5, we evaluated phenotypic and biochemical changes in mice following maternal separation as the ELS (Figure 1A). First, we evaluated anxiety levels using an elevated plus maze (EPM) in the control (WT and tTA) and FKBP51-overexpressing (rTgFKBP5) littermates. We used both the wild-type (WT) and CamKIIα-tTA (tTA) controls to ensure any effect of high FKBP51 was independent of either background. CamKIIα-tTA mice express the tetracycline-controlled transactivator protein regulated by the forebrain-specific calcium-calmodulin-dependent kinase II promoter. Although the genotype presented a significant effect on the ELS group (Table 1), the number of factors being studied reduced the significant power in the Bonferroni post-hoc test (p > 0.05). Additionally, sex significantly contributed to the variability (p = 0.05) in the ELS group. However, due the small representation of animals per sex in each group, we ad-hoc used an independent sample t-test comparing the groups. In this analysis, the rTgFKBP5-ELS mice displayed increased anxiety-like behavior as measured by a significant decrease in time in the open arms compared to tTA-ELS (t(18) = 3.489, p = 0.002) and WT-ELS (t(18) = 2.261, p = 0.036) mice (Figure 1B), which was not affected by the number of entries to open arms (Table 1) or locomotor differences among the groups (Figure 1C). rTgFKBP5-ELS mice also had significantly lower percent number of open arm entries compared to tTA-ELS mice by two-way Analysis of variance (ANOVA) (Supplementary Material File S1). No significant difference was found within the non-stressed control groups (Table 1). However, sex significantly interacted with genotype (p < 0.05) affecting anxiety-like behavior. Overall, the rTgFKBP5-ELS female mice showed the highest level of anxiety-like behavior when compared to tTA-ELS (t(8) = 3.436, p = 0.008) and WT-ELS (t(8) = 2.807, p = 0.023) mice, while changes in anxiety in males varied by genotype (Figure 1D,E).

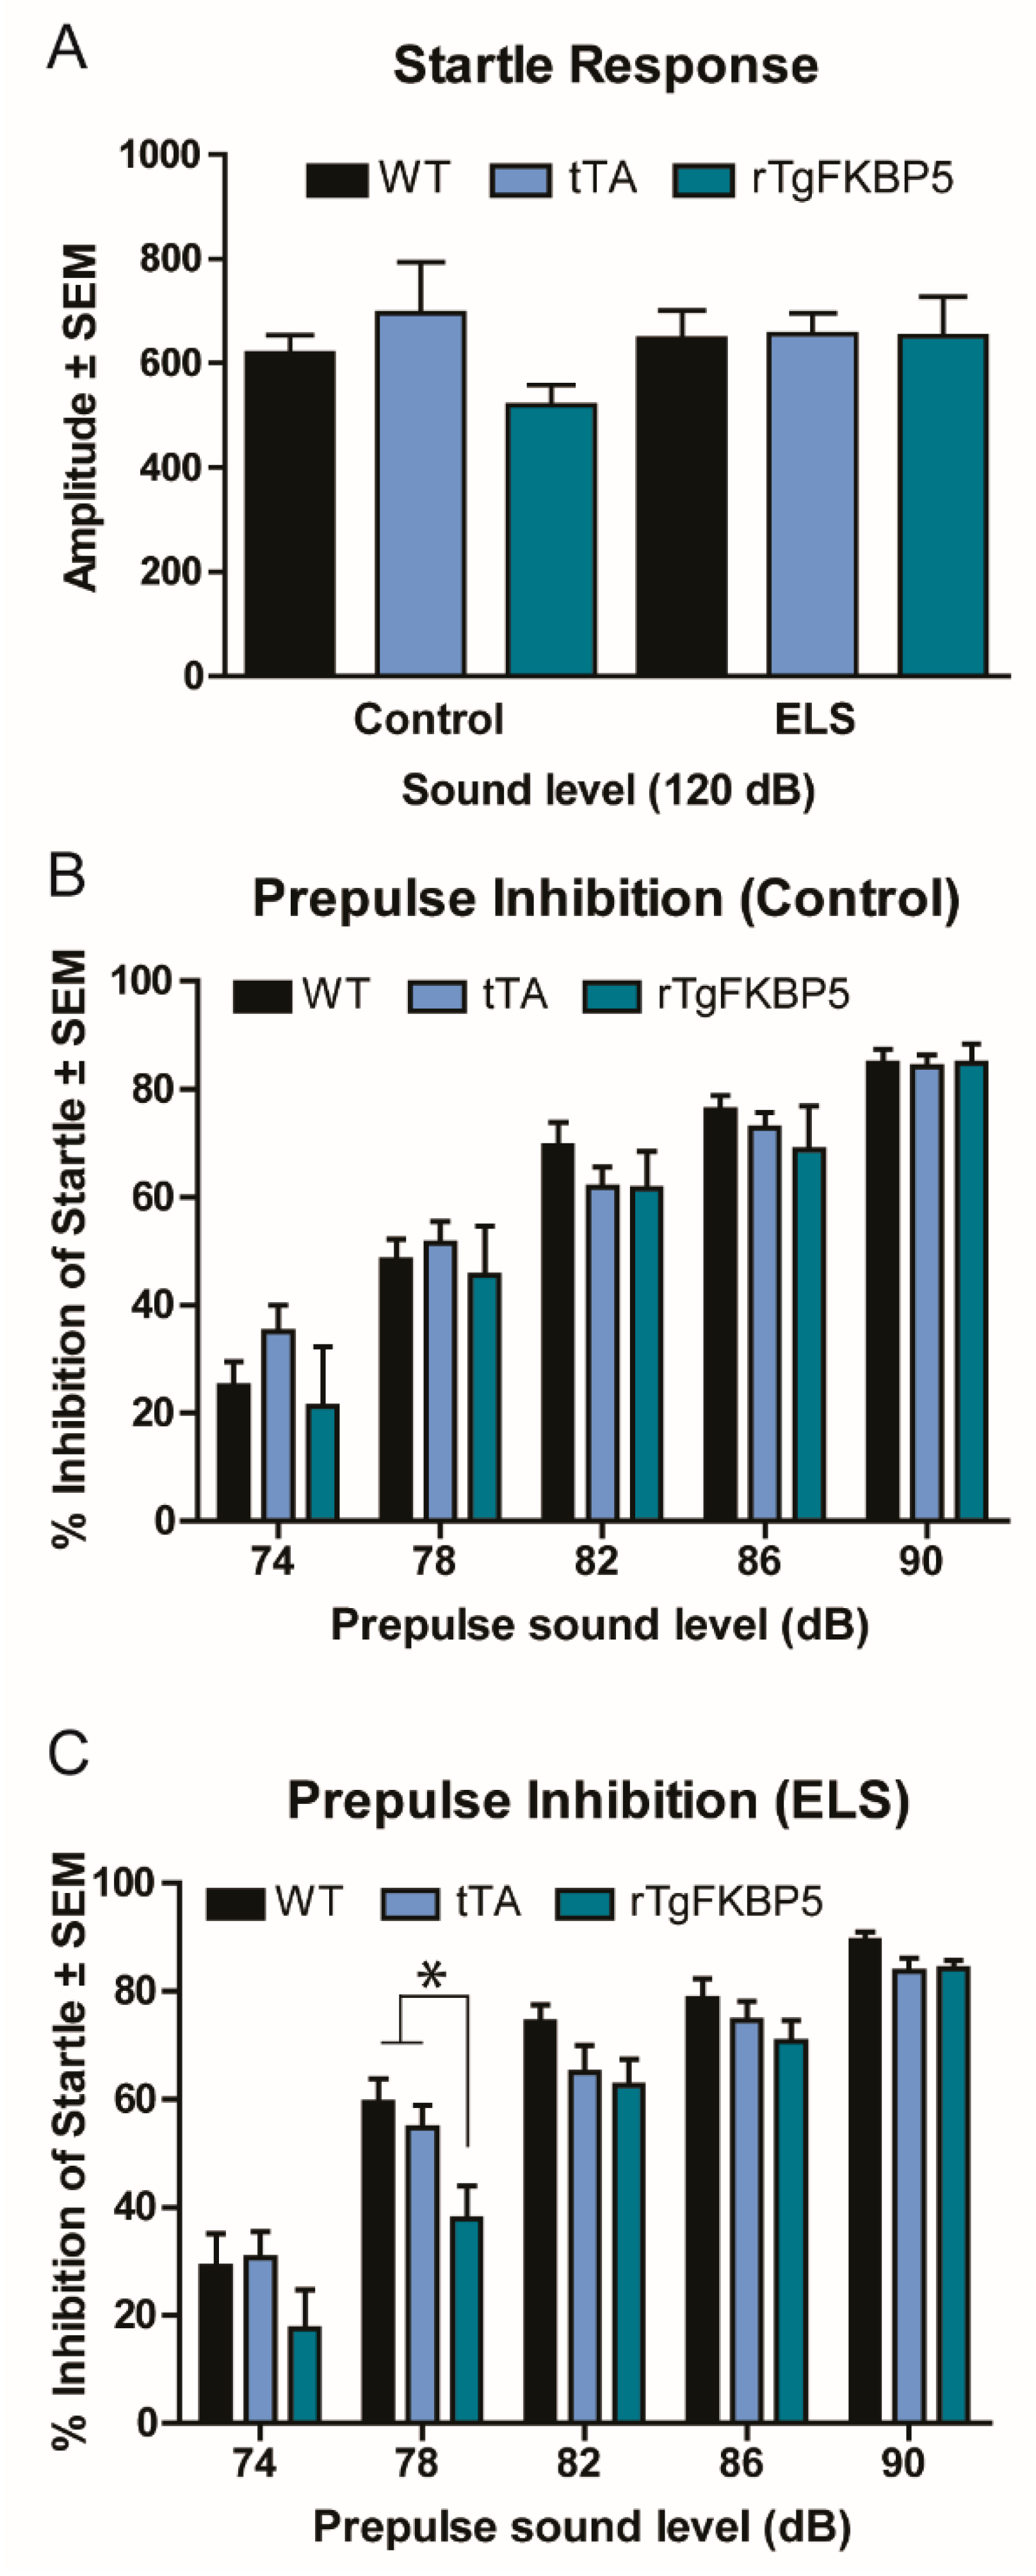
2.2. Sex and Genotype Modestly Affect the Prepulse Inhibition Response

Since sensorimotor gating reflexes are known to be reduced in patients with various neuropsychiatric disorders linked to FKBP5 and stress [21], we tested for any deficiencies in startle habituation (response after repeated presentations of a stimulus) and the prepulse inhibition (PPI, response after previous presentation of a weak stimulus). Startle habituation was similar within all groups (Figure 2A). However, a significant difference within the ELS group was measured by PPI, but only following the 78 dB stimulus (Figure 2B,C). Once again, we found sex differences between the groups. Specifically, the stressed rTgFKBP5 females had lower inhibition of startle (p < 0.05) when compared to the WT and tTA controls (Supplementary Material File S2). Overall, we only found modest changes in the overall startle response and PPI caused by the interaction of ELS and FKBP5 (p > 0.05) (Table 1).

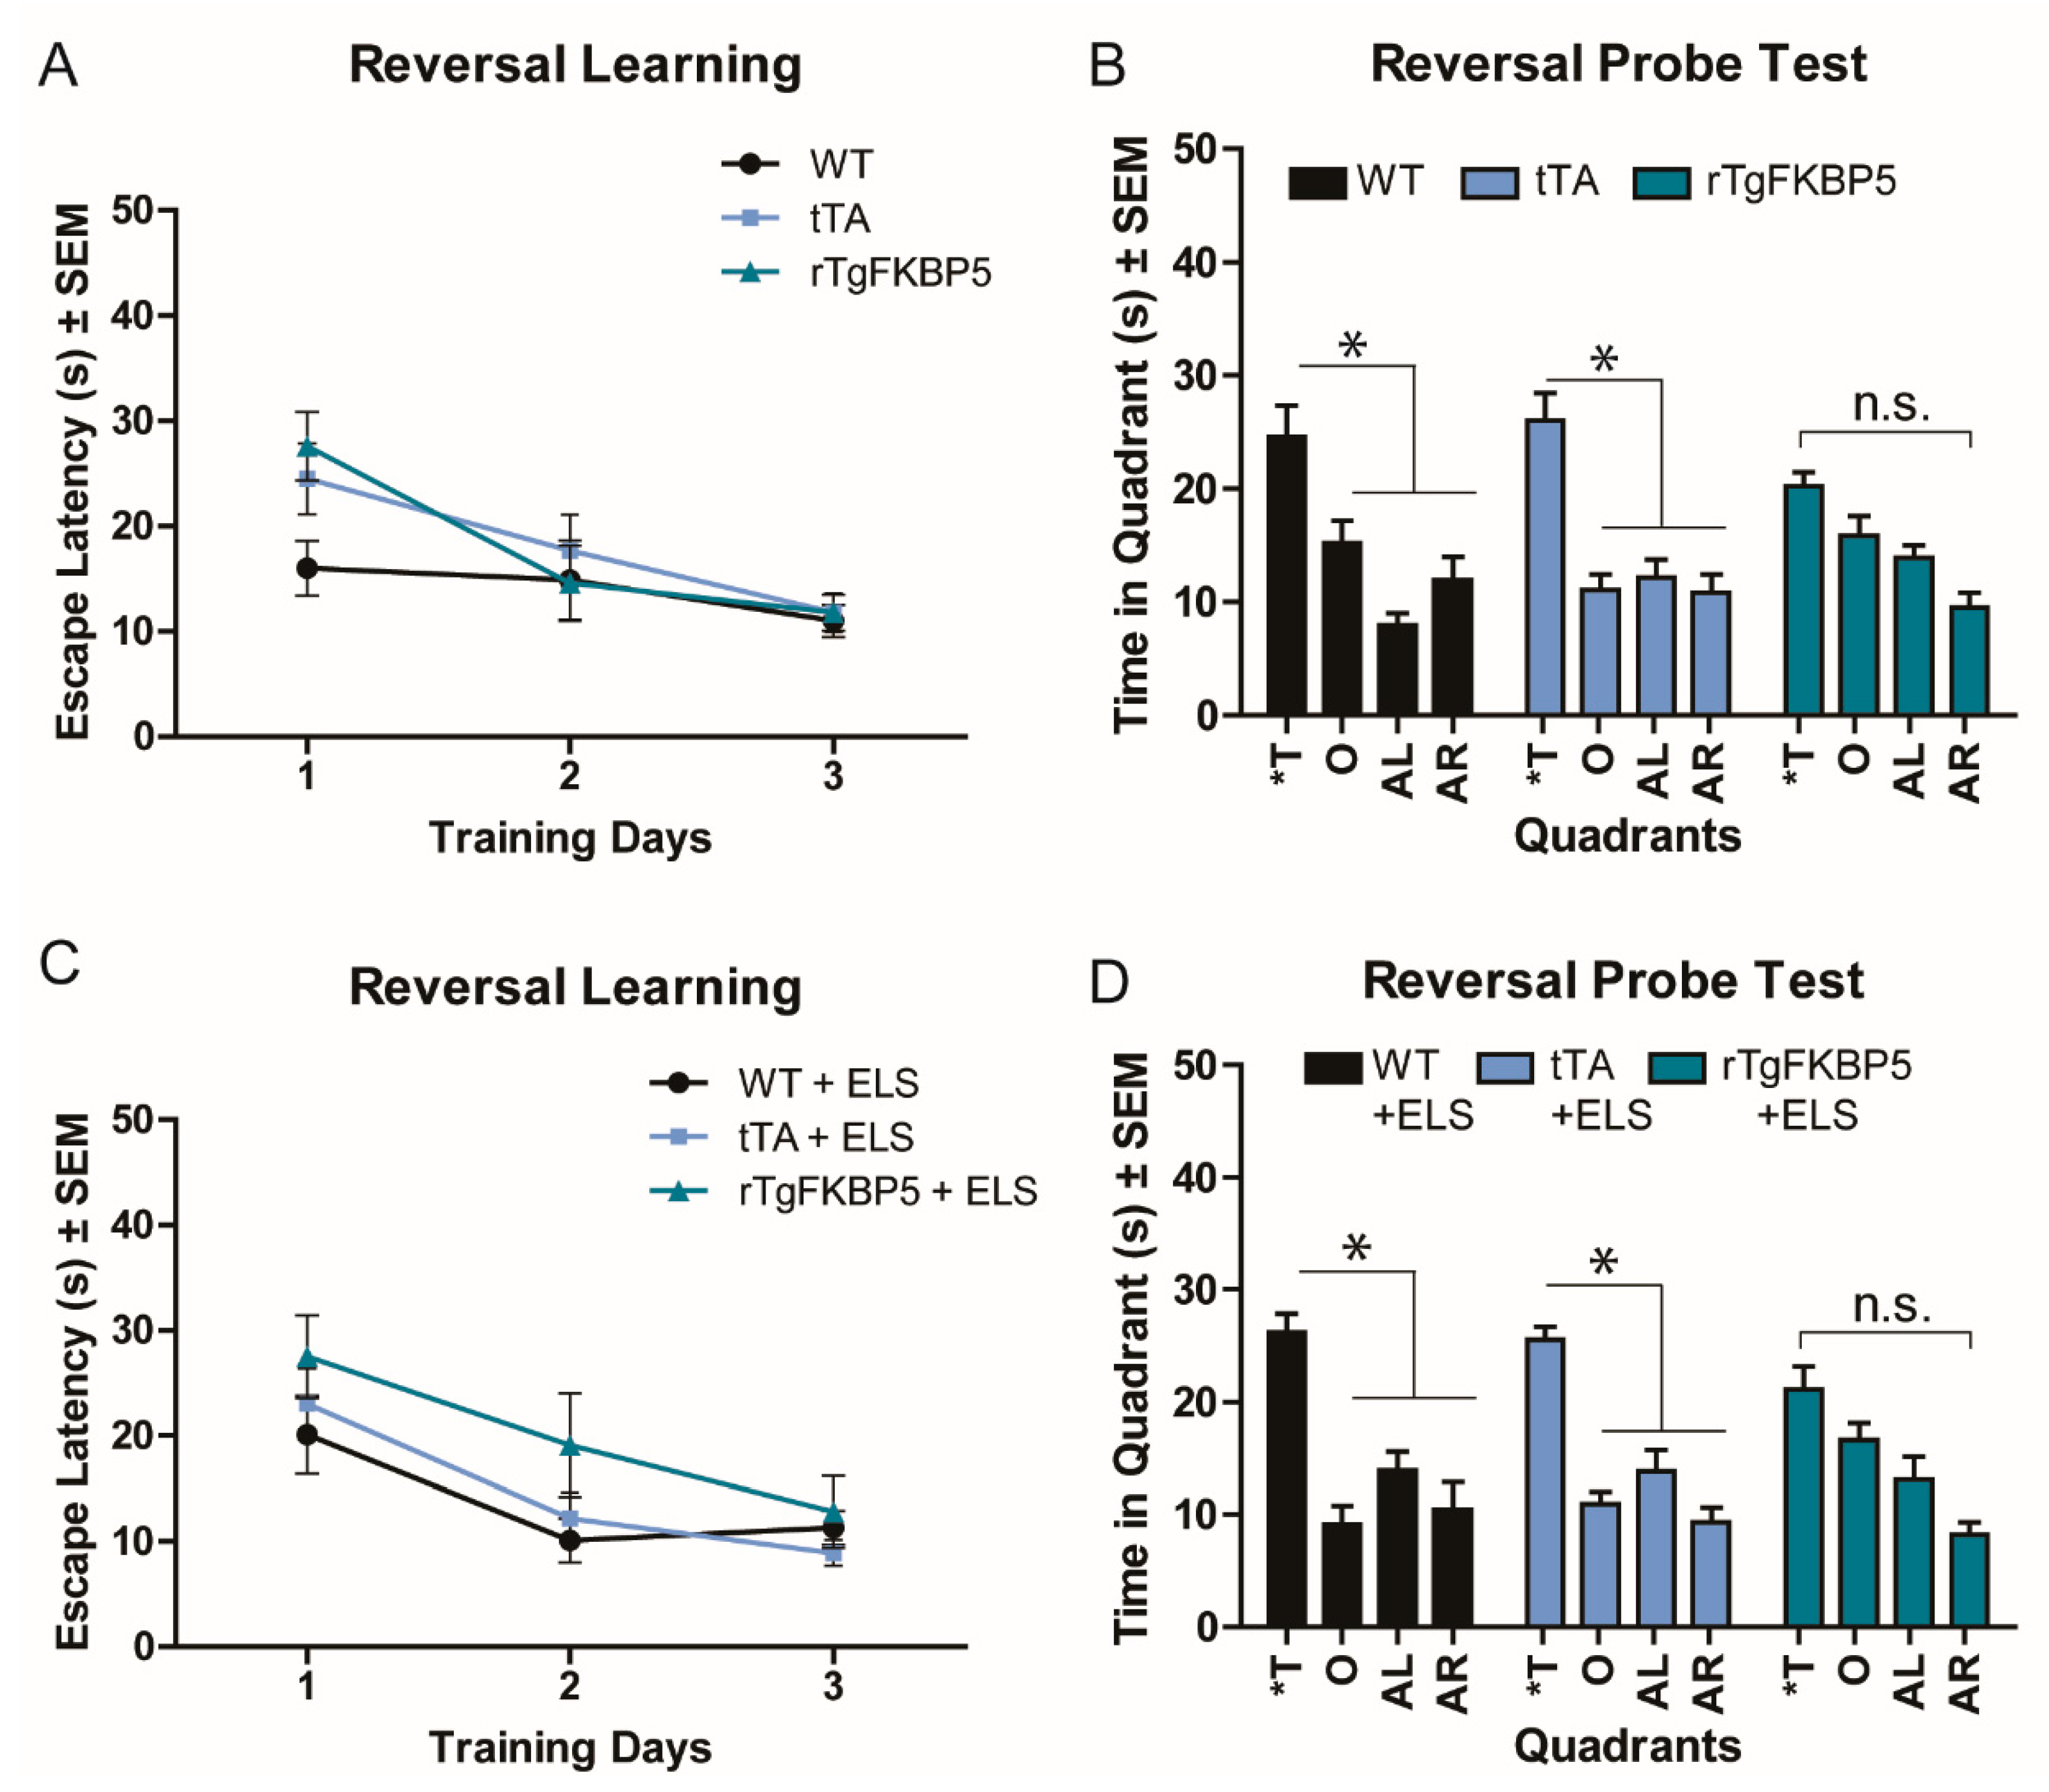
2.3. FKBP5 Induces Spatial Reversal Learning Deficits in the Morris Water Maze (MWM) Test

We previously demonstrated that rTgFKBP5 mice have impaired spatial learning and cognitive flexibility using the MWM reversal task [17]. Here, we examined whether ELS could intensify this impairment. We found no difference between the groups in the initial training or probe test (Supplementary Material File S3), except that the rTgFKBP5-ELS mice spent significantly more time in the target quadrant during the Day 5 probe trial than the tTA-ELS, WT-ELS, and non-stressed rTgFKBP5 (Bonferroni post-hoc, p < 0.05). While this result is interesting, all of the groups were able to successfully identify the target quadrant. To test for cognitive flexibility, we relocated the platform in the opposite quadrant. Despite a similar escape latency for the reversal learning among the groups during the reversal training (Figure 3A,C), learning deficits were apparent during the reversal probe test (Figure 3B,D). The rTgFKBP5 mice were unable to identify the new target quadrant spending similar time among the all quadrants, corroborating our previous findings [17]. However, this effect was not enhanced by ELS (Bonferroni post-hoc, p > 0.05).

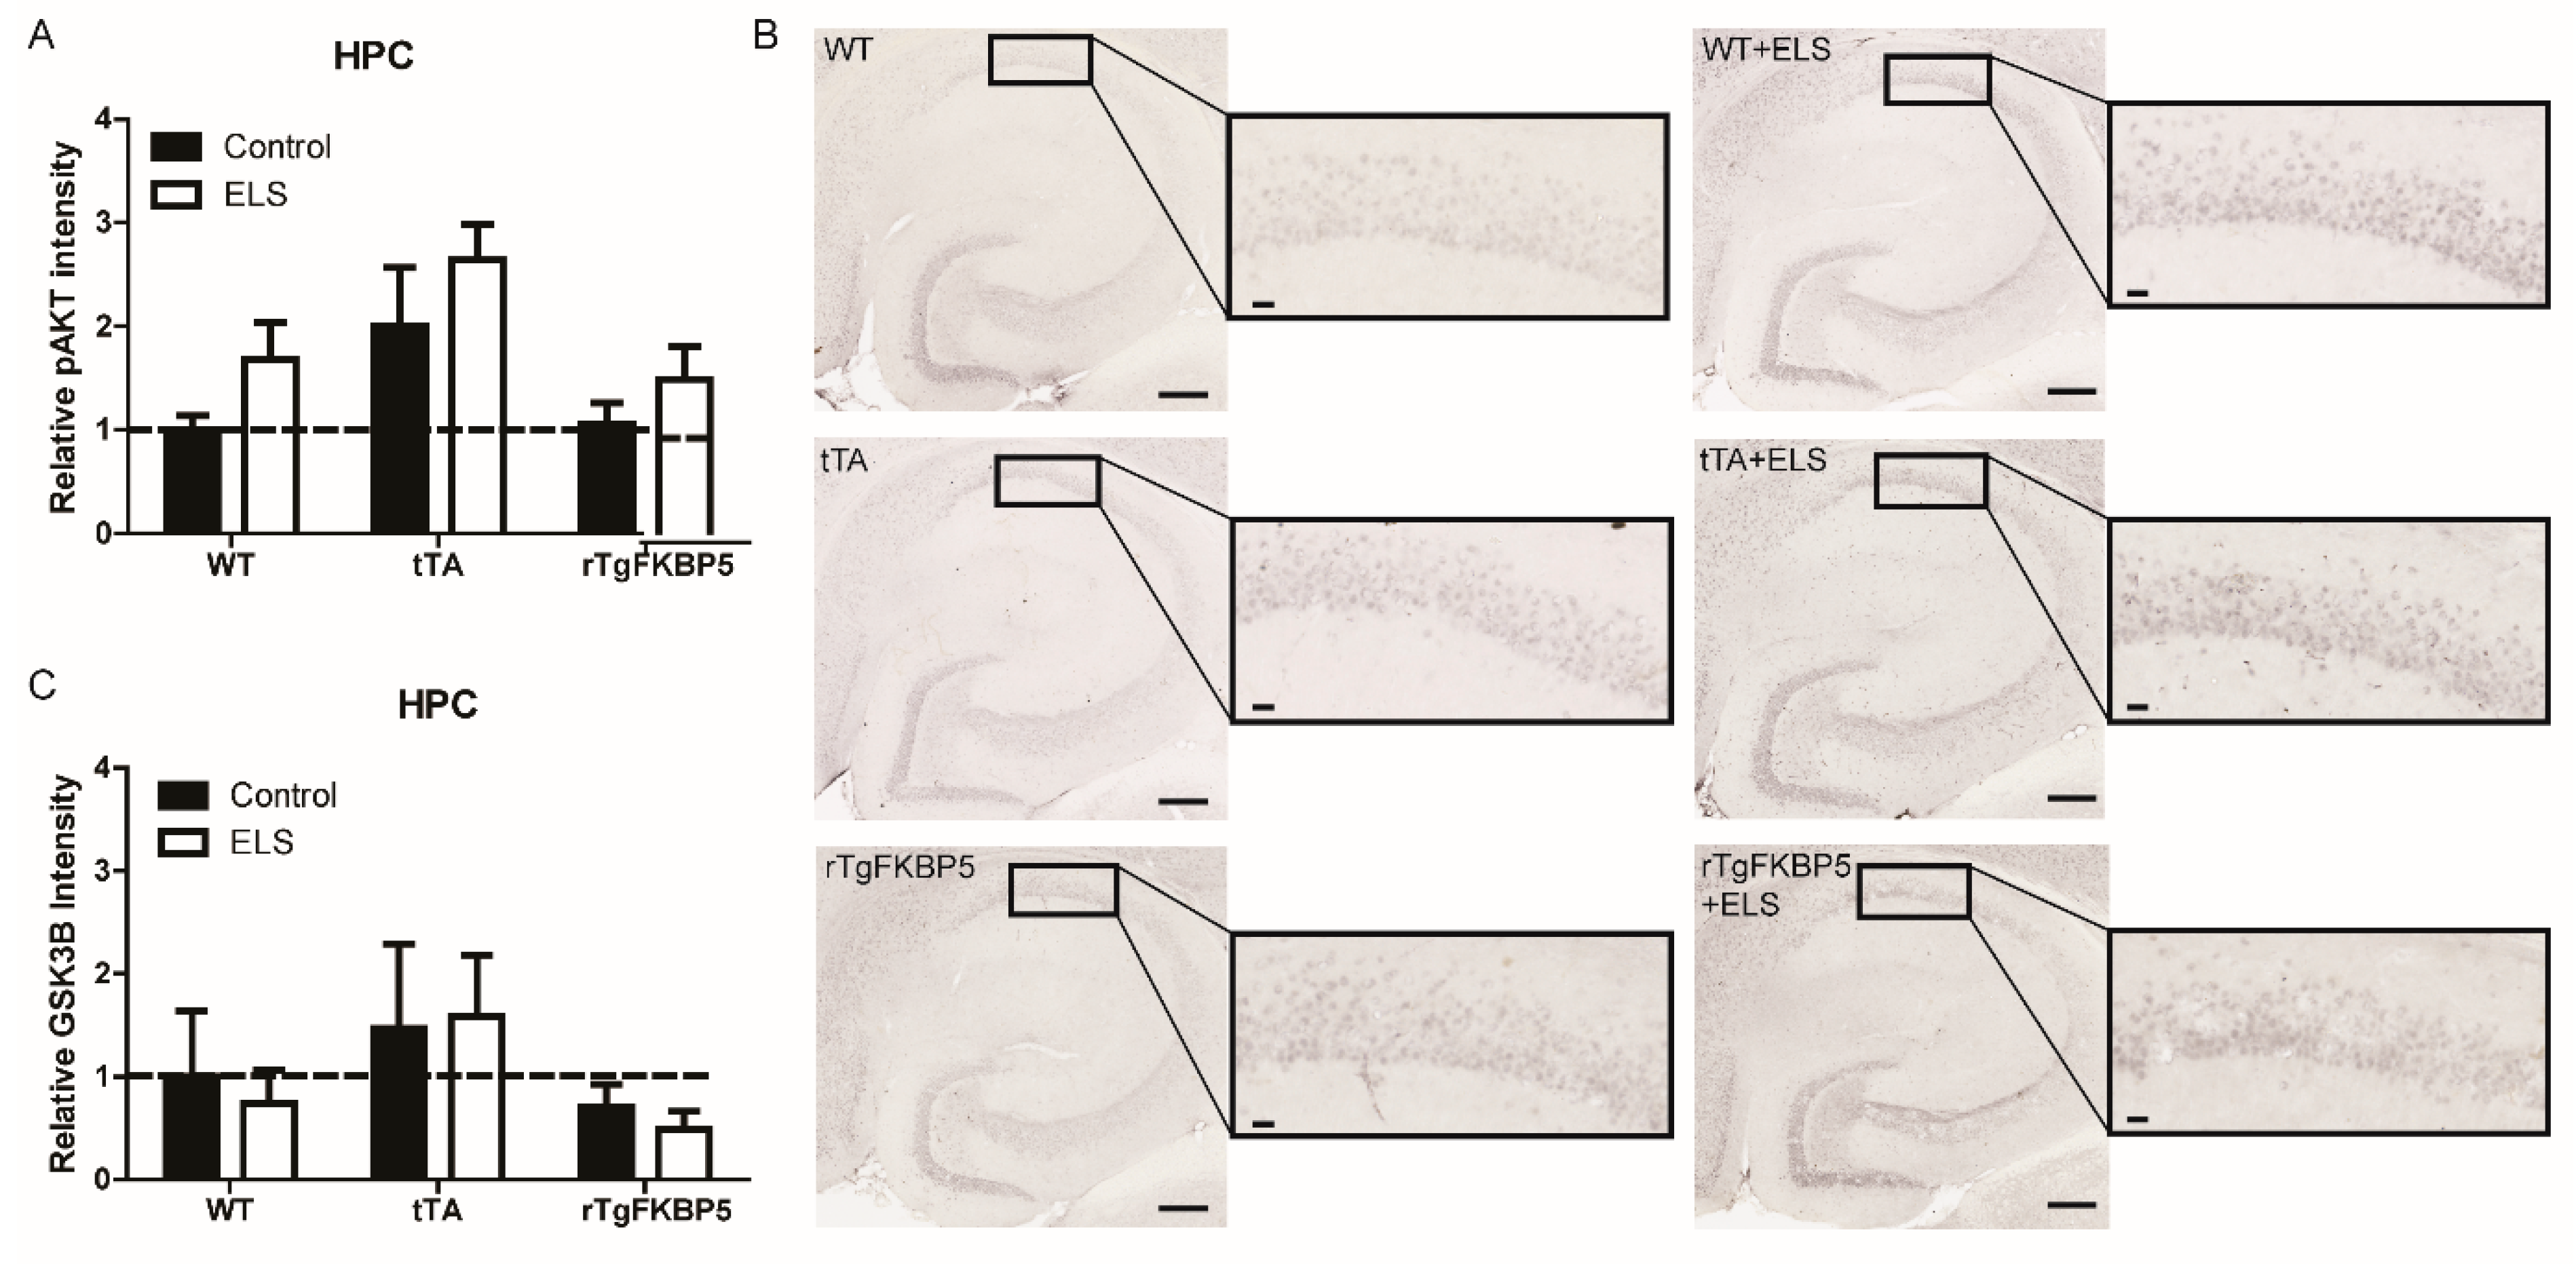
2.4. Early Life Stress Affects the pAKT/AKT Ratio in the Hippocampus

Levels of FKBP51 have been previously demonstrated to alter AKT signaling in vitro. Therefore, we wanted to examine how this important signaling cascade was affected by the interaction of FKBP51 and ELS. We measured AKT activity by quantifying the expression of phosphorylated AKT at Serine 473 (pAKTSer473, active form) and total AKT as well as the phosphorylation status of Glycogen synthase kinase 3 beta (GSK-3β), which is directly downstream in the AKT signaling pathway, in the whole hippocampus (HPC). We found that pAKTSer473 was significantly increased in the HPC by ELS, as determined by two-way ANOVA (Figure 4A,B), but GSK-3β was not affected throughout the HPC (p > 0.05) (Figure 4C). Post-hoc analysis of the pAKTSer473 levels showed no difference among the groups (p > 0.05). To look more closely at how this pathway is regulated by FKBP5, we examined two hippocampal subregions that have different functions and present differential stress sensitivity [22].

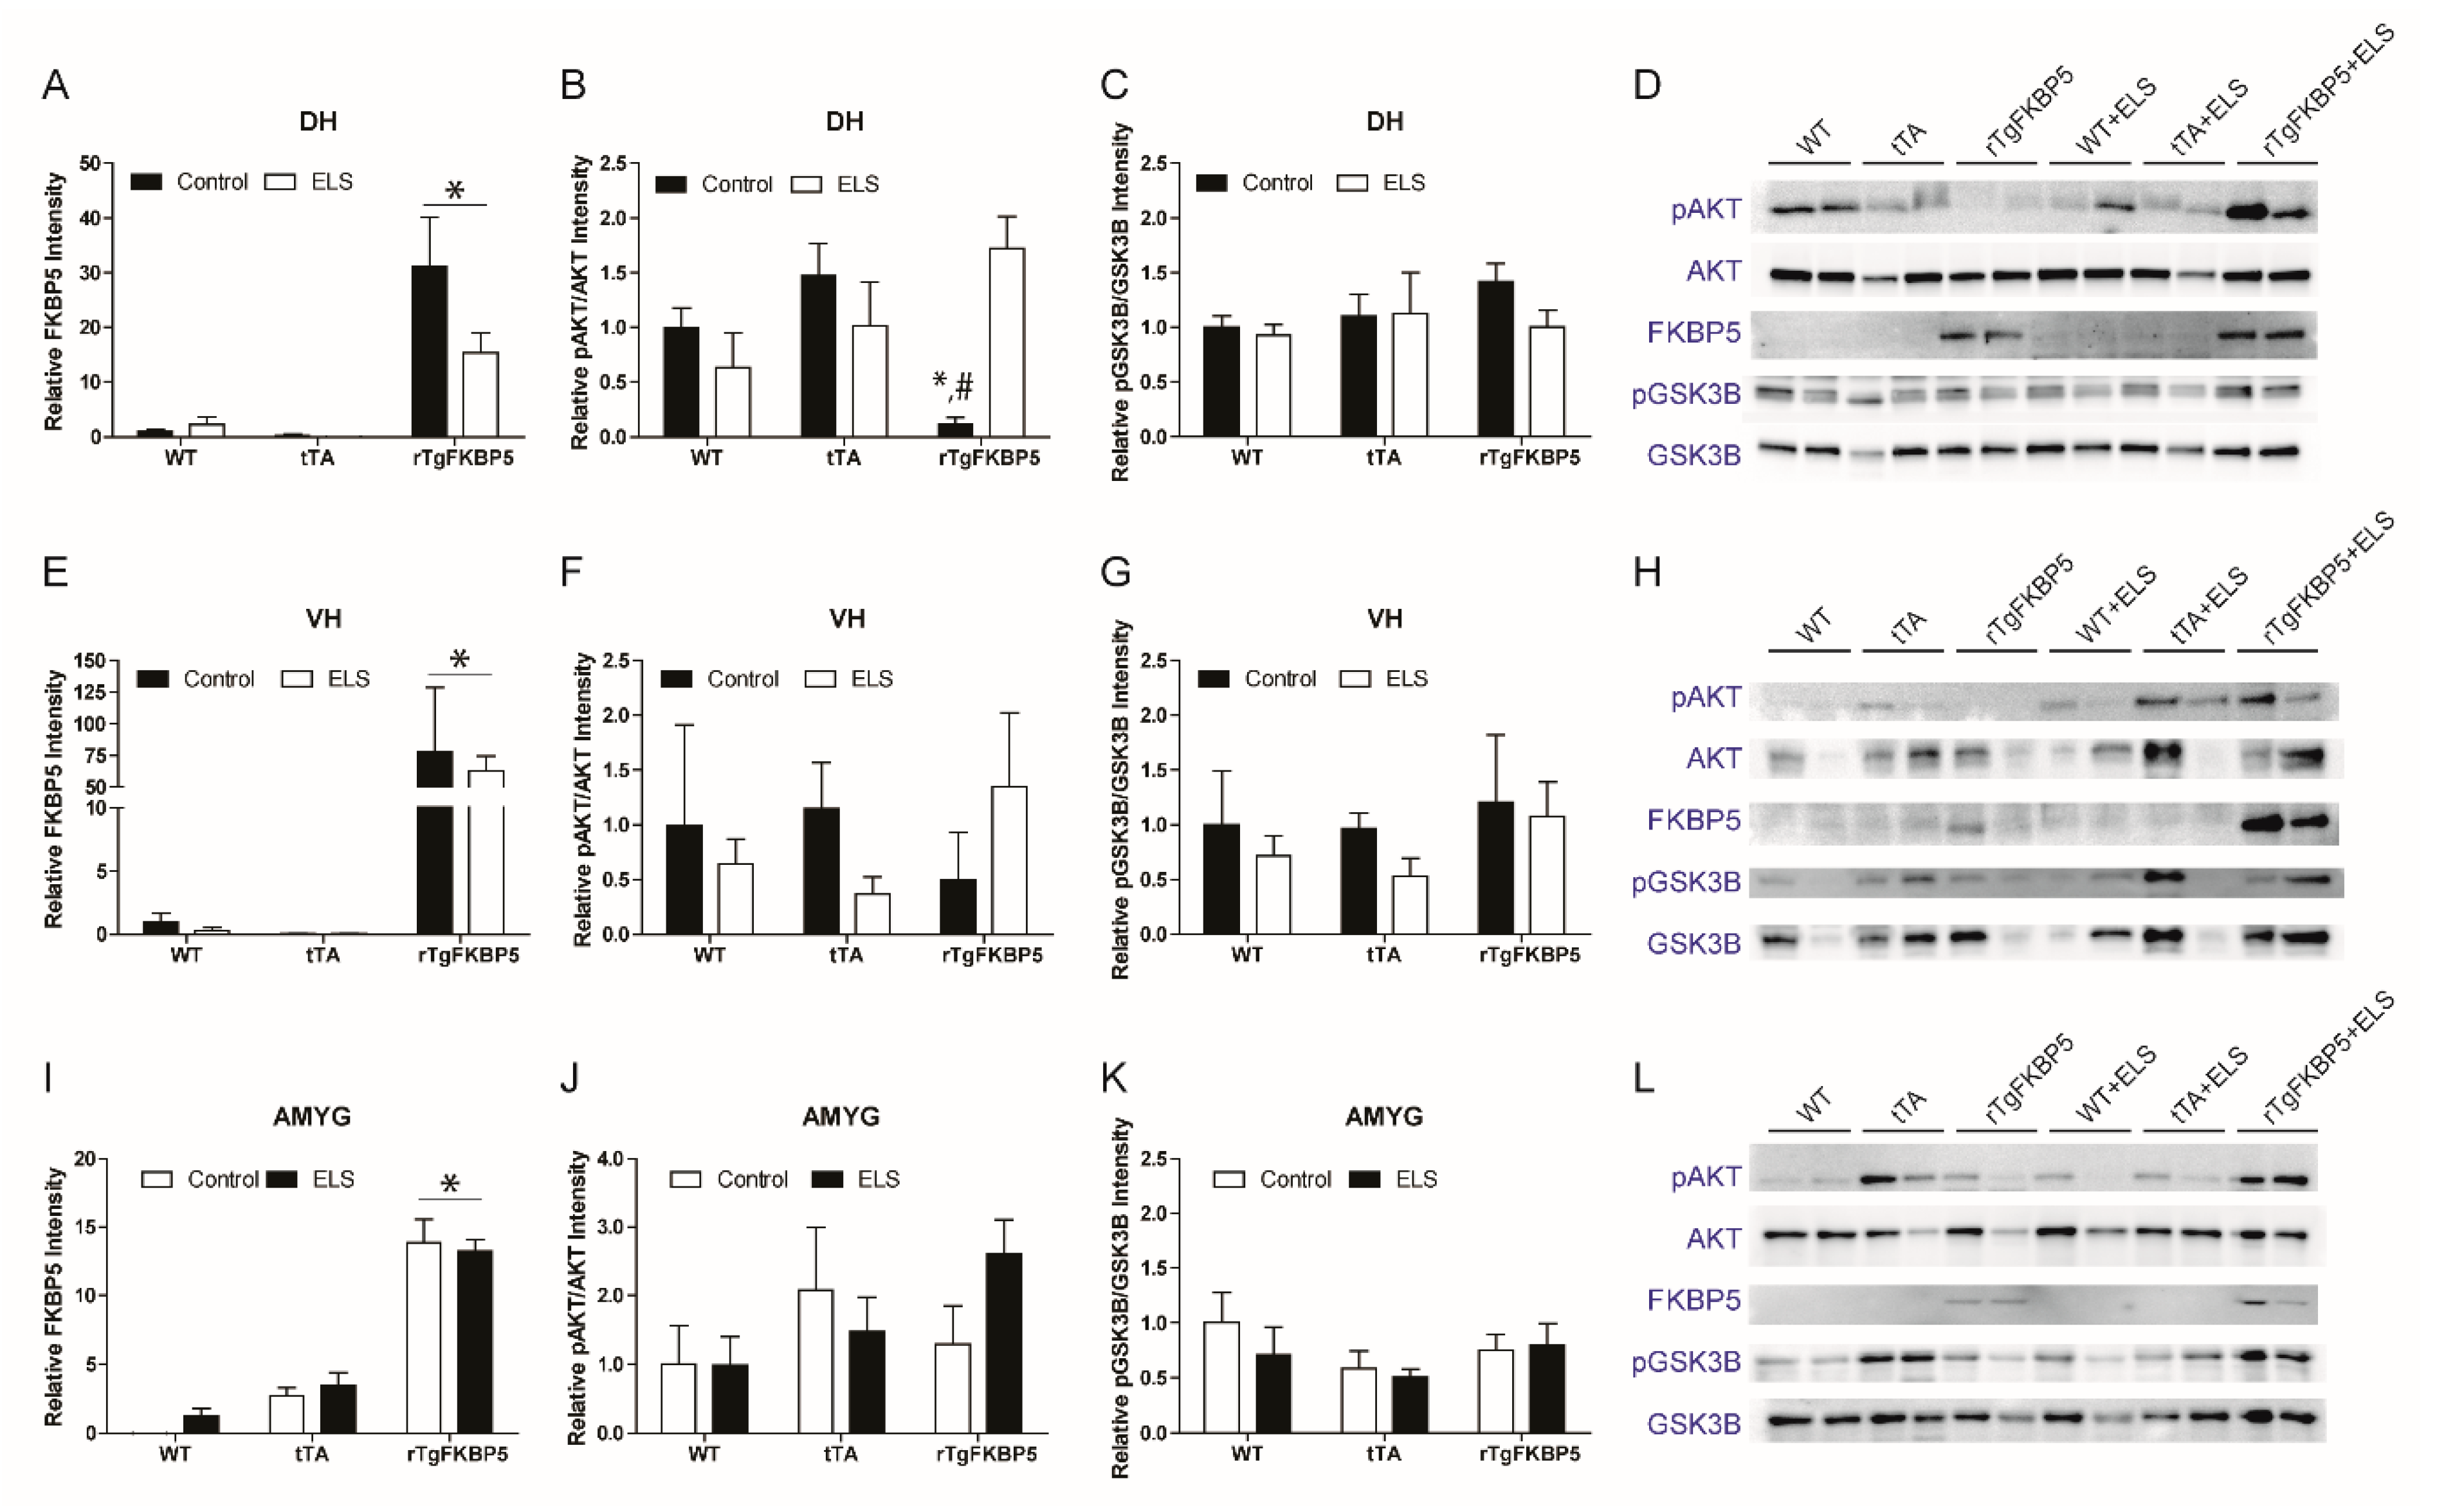
2.5. FKBP5 Differentially Regulates AKT Phosphorylation in the Dorsal Hippocampus in the Presence Or Absence of ELS

Traditionally, the hippocampus has been studied for memory functions. However, the dorsal (DH) and ventral (VH) areas of the hippocampus differ in their inputs and projections to different cortical and subcortical structures [23]. In both hippocampal subregions, we assessed whether genotype and ELS affect AKT and GSK-3β levels. Again, we evaluated changes in the active form of AKT (pAKTSer473), which may subsequently prevent GSK-3β activation by phosphorylating this kinase at serine 9. We first confirmed that, in the dorsal hippocampus, rTgFKBP5 mice presented higher levels of FKBP5 than the WT and tTA mice (genotype effect: p < 0.0001) (Figure 5A). Then, a two-way ANOVA revealed a significant interaction in stress and genotype in the pAKTSer473/AKT ratio (p = 0.006) (Figure 5B). In the non-stressed group, rTgFKBP5 had a significantly lower pAKTSer473/AKT ratio compared to WT and tTA (Bonferroni post-hoc, p < 0.05) mice. These results are in line with previous cell culture studies showing that increased expression of FKBP5 reduces AKT phosphorylation [19,24]. Interestingly, ELS significantly reverted the pAKTSer473/AKT ratio in rTgFKBP5-ELS mice when compared to non-stressed-rTgFKBP5 mice (Bonferroni post-hoc, p < 0.05). Since GSK-3β is a downstream target of AKT, we expected lower levels of Serine 9 phosphorylated GSK-3β (pGSK-3βSer9, inactive form) as a result of having less pAKTSer473 in non-stressed rTgFKBP5 mice. However, the pGSK-3βSer9/GSK-3β ratio was not affected by the interaction of stress and genotype in the DH (Figure 5C,D).

2.6. AKT and GSK-3β Expression in the VH and Amygdala (AMYG) is not Affected by the FKBP5 x ELS Interaction

We further examined if AKT and GSK3β were changed in the ventral hippocampus. We found that even though rTgFKBP5 mice showed high expression of FKBP5 (p < 0.0001) (Figure 5E), the pAKTSer473/AKT ratio was unaffected by genotype, stress, or interaction of both (Figure 5F). Similar results were observed in the pGSK-3βSer9/GSK-3β ratio, which showed no main effects by genotype, stress, or their interaction (Figure 5G and H). Comparable to the VH findings, the overexpression of FKBP5 in the AMYG (Figure 5I) did not affect the pAKTSer473/AKT ratio (Figure 5J). Similarly, the pGSK-3βSer9/GSK-3β ratio (Figure 5K,L) remained unchanged in the AMYG suggesting that the interaction of FKBP5 and stress was not implicated in the increased anxiety in rTgFKBP5-ELS mice.

3. Discussion

Preclinical and clinical studies have demonstrated that the FKBP5 rs1360780 risk allele increases the susceptibility to develop mental health illnesses when combined with adverse environments during early ages [6,7,14,16,25,26,27]. Therefore, in this study, we investigated the relationship between ELS and high FKBP5 in the brain. We used a unique mouse model overexpressing FKBP5 (rTgFKBP5) and two control groups (WT and tTA) to address our hypothesis. The tTA control group express the tetracycline-off transactivator driven by the CAMKII promoter, which helped us distinguish rTgFKBP5 mice from any phenotypical and biochemical difference caused by this construct. We found that stress significantly exacerbated anxiety levels in rTgFKBP5-ELS mice but did not alter spatial reversal learning. Besides the behavioral and cognitive alterations, the rTgFKBP5 mice showed a reduction of phosphorylated AKT at Ser473 in the dorsal hippocampus, but this was increased in the ELS group. This demonstrates that genotype alone can induce direct molecular changes that are further regulated by ELS. Overall, this suggests that the interaction of gene and environment may cause long term neurobiological changes, which may be relevant to patients with neuropsychiatric disorders.

3.1. Sex as a Confounding Factor that Effects Stress Susceptibility

Interestingly, the rTgFKBP5 females presented the highest anxiety levels out of all the groups. This finding adds to the growing number of studies examining both sexes, in rodents and humans, that demonstrate how sex can contribute to differences in brain development, biological regulation, and emotional reactivity throughout the lifespan [28,29,30,31,32]. To our interest, clinical studies have reported higher anxiety prevalence and poor brain connectivity in women who were previously exposed to trauma and carriers of FKBP5 risk variants [33,34]. In addition to elevated FKBP5 levels, other factors, such as hormones and activity of steroid receptors, may also impact anxiety levels in females. Estrogen levels during the reproductive cycle (estrous in mice and menstrual in women) can also affect stress responsiveness, anxiety, fear neurocircuits, and activation of brain structures, potentially contributing to sex differences [35,36]. Although our goal in this study was to test any interaction between stress and FKBP5 expression, for future studies it would be interesting to examine how estrogen and steroid receptors are affected by FKBP5 and stress, which might directly or indirectly contribute the observed sex differences in anxiety. It is important to note that previous studies have demonstrated significant differences in female rats using EPM [37], which may be applicable to other rodents. It will be valuable to confirm these using other anxiety-like behavioral tests in future studies. Anxiety-like behaviors, as many other behaviors, are difficult to assess in rodents. This difficulty arises from the number of mice needed to observe significant differences, the inclusion of sex as an independent variable in previous studies to make valuable comparisons, and the limited information about the biochemical and physiological differences between sexes in rodents’ brain.

3.2. Early Life Stress Modestly Interacted with Genotype

Although we were anticipating that ELS would cause robust behavioral and molecular effects in all genotypes, this stress had only a modest impact on just the rTgFKBP5 mice. It is possible that we could have achieved a stronger effect by applying a secondary stressor before behavioral testing, which is supported by the three-hit hypothesis [38]. Further studies are needed to test this alternative and examine if the combination of early- and later-life stressors induces more severe changes in the brain. Additionally, some behavioral and molecular discrepancies have been reported based on mouse strain (35), so another possibility is that our ELS protocol (maternal separation) was not sufficient to induce significant changes in startle response or enhanced cognitive deficits in our Friend Virus B (FVB) background mice. It is also possible that more phenotypic and biochemical changes would be detectible at an older age.

3.3. Genotype Influences Learning Processes at the Behavioral and Molecular Levels

We previously showed that rTgFKBP5 mice had impairments in spatial learning and cognitive flexibility while promoting the α-amino-3-hydroxy-5-methyl-4-isoxazolepropionic acid, AMPA, receptor recycling in hippocampal neurons [17]. However, ELS did not alter this cognitive impairment in rTgFKBP5, so we did not follow-up on synaptic changes in the present study. Instead, we decided to examine changes in the AKT/GSK-3β signaling, which is known to be affected by FKBP5 [39]. We found only minor changes in the levels of these kinases by immunohistochemistry of the whole hippocampus. Interestingly, the tTA group appears to have a non-significant increase in pAKT levels (Figure 4). This may be due to the regulation of the CAMKIIα transgene, since CAMKIIα has been previously demonstrated to regulate AKT [40]. The presence of high FKBP51 appears to reduce this, but additional mice are needed to determine if this reaches significance. Biochemically, our findings revealed that high FKBP5 significantly decreases pAKTSer473/AKT ratio in vivo (Figure 5). This is in line with previously in vitro reports [19,39]. Interestingly, this reduction in the pAKTSer473/AKT ratio was only observed in the dorsal, but not ventral, hippocampus in rTgFKBP5 mice. Another previous study showed that overexpression of FKBP5 in the dorsal hippocampus did not have an effect on anxiety-like behaviors. However, different from our study, their investigation only included males, and the behavioral testing was performed at an older age than in our experiments [41].

3.4. FKBP5 Overexpression Modulates AKT in Selective Brain Structures

In addition to spatial learning deficits in rTgFKBP5 mice, we observed differences in anxiety levels (Figure 1B). Despite the extensive literature about the role of the hippocampus in mood disorders, there are limited studies examining the role of FKBP5 and stress affecting AKT in hippocampal axes. Here, we investigated the AKT activity in the dorsal hippocampus, which is mainly involved in cognitive processes like spatial learning and in the ventral hippocampus which plays a greater role modulating emotional information such as anxiety. One key finding in this study is the reduction of pAKTSer473 in the dorsal hippocampus of the rTgFKBP5 mice. Considering that overexpression of GSK-3β impairs spatial memory formation [42], we suspected that FKBP5-induced reduction of pAKTSer473 in the dorsal hippocampus would lead to increased GSK-3β activity, but this was not the case. Similar results were also reported in another study [24], suggesting that AKT may use other intermediary proteins that could be effected by FKBP5 to modulate GSK-3β.
The pAKTSer473 changes were only observed in the dorsal hippocampus, but not in the ventral axis nor the amygdala. This outcome was unexpected since the ventral hippocampus and amygdala, which are highly susceptible to stress, are key structures regulating memory and emotional processes [43,44]. More recently, a study showed that induction of FKBP5 in the basolateral (BLA) and central (CeA) nuclei of the amygdala caused an anxiety-like behavior in male mice supporting its role in modulating susceptibility to anxiety disorders [41]. One possibility for not observing changes in the AKT pathway may be that the tissue analyzed contained various amygdala nuclei. Due their dissociable functions of these amygdala nuclei in anxiety [45] and other mental health disorders [46], if this was the case, the difference may not be detectible. Additional studies are needed to address specific changes in these amygdalar subregions.

3.5. Concluding Remarks

Our findings highlight the importance of stress and genes (like FKBP5) in modulating vulnerability to mood disorders and learning impairments. This study demonstrates how sex may contribute to susceptibility and prevalence differences in these illnesses and cognitive processes. Our data revealed that changes in the AKT signaling in the dorsal hippocampus may be contributing to the reduced cognitive flexibility exhibited in the rTgFKBP5 mice during the Morris Water Maze reversal test. One limitation of our study is lacking an appropriate number of animals representing each sex per each group which prevent us from making conclusions about possible sex influence on molecular findings. We will also need this information to establish any possible correlation between behavior and molecular outcomes. Besides sex differences, it will be interesting to further study how ELS differentially affects the hippocampal axes’ synaptic plasticity in rTgFKBP5 mice. This information could contribute to our knowledge on how cognitive and emotional components may influence hippocampal plasticity and activity after stressful events. These changes may also inform us about long-lasting neuronal changes affecting our susceptibility to stress at later ages. Taken together, our results support our hypothesis and is align with many clinical studies suggesting that the interaction of high FKBP5 x stress could contribute to the development of mental health disorders.

4. Materials and Methods

4.1. Animal Subjects

Mice were obtained from our colony at the University of South Florida (USF) vivarium. They were housed up to five per cage, maintained under standard conditions with a 12 h light/dark cycle, and had free access to food and water. All animal experiments were carried out accordingly with the National Institutes of Health (NIH) Guide for the Care and Use of Laboratory Animals and approved on the 15th of November 2016 [R2543] by the USF Institutional Animal Care and Use Committee (IACUC).
Generation of the rTgFKBP5 mice has been previously described in [17]. Briefly, rTgFKBP5 single-transgenic founder mice on a FVB background were crossed with CAMKIIα-tTA (tTA) mice on the 129S6 background (internally maintained colony originally a gift from Jada Lewis, strain can be purchased from Jackson Labs, stock 003010). The offspring corresponds to the rTgFKBP5 double-transgenic line. All genotypes (WT, tTA, rTgFKBP5) were confirmed by polymerase chain reaction (PCR) amplifying DNA from ear clips using the following primers: (1) human FKBP5 gene (F, 5′GTGTACGGTGGGAGGCCTAT3′, and R, 5′GTCCCATGCCTTGATGACTT3′) and (2) housekeeping gene T-cell receptor delta chain (Tcrd) (F, 5′-CAAATGTTGCTTGTCTGGTG-3′, and R, 5′-GTCAGTCGAGTGCACAGTTT-3′). A QIAxcel Advanced system (Qiagen, Valencia, CA, USA) was used to analyze the PCR product.

4.2. Early Life Stress (ELS) Model

We used the maternal separation protocol, which is a widely used procedure for early life stressors in rodents [47,48]. During the ELS protocol, mice underwent maternal separation for 3 h per day for 14 days, starting on postnatal day 1 (P1) (Figure 1A). This separation consists of relocating the dams to new cages in a separate room. We used six groups to examine changes induced by stress, genotype, or interaction between both. We used both WT and tTA littermates (expressing the tetracycline-off transactivator driven by the CAMKII promoter) as controls. The non-stressed control group remained undisturbed with their dams until they were weaned (P21). Although this is considered a chronic stress model, no pups were lost during the maternal separation procedure. Over the five-month experiment, no overt physical abnormalities were observed in any of the mice.

4.3. Elevated Plus Maze (EPM)

The EPM, as previously described [31], consisted on four perpendicular arms (two open and two closed) with an elevation of 40 cm off the floor. Each mouse was individually placed in the center is the platform and allowed to explore for 5 min. Exploration of center, closed arms, and open arms was tracked and recorded using ANY-maze software (www.anymaze.com). The chamber was cleaned with 10% ethanol between trials.

4.4. Prepulse Inhibition (PPI)

PPI was performed as previously described [31]. Briefly, mice were individually placed in a clear Plexiglass restrainer located inside a SR-LAB Startle apparatus (San Diego Instruments, San Diego, CA, USA). Each session was initiated with a 5 min acclimation exposing the mice to constant background white noise. This was followed by a 120 dB startle stimulus. This 120 db startle stimulus with no prepulse was used to measure the baseline. The prepulse set consisted of 5 different acoustic stimuli at 74, 78, 82, 86, and 90 dB. Trials were separated by a randomized inter-trial interval (ITI) of 10 and 30 s. PPI was calculated as the percent inhibition of the startle response from baseline, as measured by the maximum velocity of the movement in a set window following the acoustic stimulus.

4.5. Morris Water Maze (MWM)

MWM was performed as previously described [17]. The first day, mice were placed in random quadrants for a total of 4 trials in a large circular pool allowing them to find a visible platform that was placed in random locations around the pool within 60 s period (Supplementary Material File S3A). Then, for the next four days, mice were given a total of 4 trials of 60 s each to locate a hidden platform in an open pool (learning phase) with spatial cues. Each mouse was allowed to remain on the platform for 15 s at the end of each trial. The escape latency, or time it took to find the platform, was recorded by a blind observer. When the animal failed to find the platform within the allotted time, it was manually placed on the platform and allowed to remain for 15 s. To assess spatial memory, mice were exposed to one 60 s trial (probe) twenty-four hours after completing the learning phase. Swimming time in the target quadrant versus the opposite, adjacent right, and adjacent left quadrants was used as a measure for spatial memory. For the spatial reversal learning, the acquisition and test trials were repeated as described above, but the hidden platform was placed in the opposite quadrant. The results from acquisition trials were averaged across 4 trials per day (mean ± S.E.M.). ANY-maze video tracking software was used to record and analyze the videos.

4.6. Tissue Collection, IHC, and Western Blot

These procedures are described in more detail in our previous publication [1]. Briefly, one week after behavioral testing, 5-month-old mice were euthanized with a Somnasol overdose and transcardially perfused with 0.9% saline. In half of the cohort [Non-stressed control (WT= 6, tTA = 5, rTgFKBP5 = 5), ELS (WT= 5, tTA = 5, rTgFKBP5 = 5)], we collected the brains where the left hemisphere was transferred to 4% paraformaldehyde for overnight fixation and the right hemisphere was used to isolate brain structures. Free-floating 25 µm sections were used for immunohistochemical analysis. Tissue sections were incubated overnight with the following primary antibodies: anti-pAKTSer473 (CS-4060; 1:1000) and anti-GSK-3β (CS-9832; 1:1000). A Zeiss AxioScan.Z1 slide scanner (Zeiss, Oberkochen, Germany ) was used to image 20 x brightfield sections followed by tissue cytometry using the NearCYTE software (www.nearcyte.org).
In the remaining animals (Non-stressed control (WT= 5, tTA = 5, rTgFKBP5 = 4), ELS (WT= 5, tTA = 5, rTgFKBP5 = 5)), the whole brain was collected after 0.9% saline perfusion and 1 mm brain tissue punches were obtained from the hippocampus (dorsal & ventral) and amygdala. Tissue was homogenized in radioimmunoprecipitation assay buffer, RIPA, buffer containing phosphatase and protease inhibitors. Tissue lysates were placed in a shaker at 4 °C for 30 min and then centrifuged at 10,000× g for 15 min. Protein quantification in the supernatant was performed using a bicinchoninic acid assay, BCA, assay (Thermo Scientific, #PI-23225, Waltham, MA, USA). A total of 25 µg of sample was loaded into a Sodium dodecyl sulfate polyacrylamide gel electrophoresis (SDS–PAGE) gel and ran at 120 V until the dye front was near the bottom of the gel. Proteins were then transferred to a PVDF membrane. Ponceau staining was performed to measure total protein. Membranes were blocked using 7% milk and then incubated overnight with a blocking buffer containing the following antibodies one at a time: anti-FKBP5 (CS-8245; 1:1000), anti-pAKTSer473 (CS-4060; 1:1000), anti-AKT (CS-9272; 1:1000), anti-pGSK-3βSer9 (CS-9323; 1:1000), anti-GSK-3β (CS-9832; 1:1000), anti-GAPDH (Proteintech, 10494-1AP; 1:1000, Rosemont, IL, USA). Images were taken using the GE ImageQuant LAS 4000 imager (Piscataway, NJ, USA) and protein bands were analyzed using the Scion Image software (www.scion-image.software.informer.com).

4.7. Statistical Analysis

A total of non-stressed (WT= 11, tTA =10, rTgFKBP5 = 9) and maternal-stressed (WT= 10, tTA = 10, rTgFKBP5 = 10) mice were used per group for behavioral testing. Each group contained a balanced number of males (~5) and females (~5) (Figure 1A). Interaction between genotype and ELS was examined by a two-way ANOVA analysis using the SPSS program. A two-way repeated measures ANOVA was performed for PPI and MWM behavioral outcomes. Protein expression was analyzed with two-way ANOVA (PRISM, Graph Pad Software; https://www.graphpad.com). ANOVA was followed by Bonferroni correction to compared individual means within the experimental group or genotypes. A difference was considered significant if p < 0.05. Data are presented as mean ± standard error of the mean (SEM). All statistical analyses can be found in Table 1 and Table 2.

Supplementary Materials

Supplementary materials can be found at https://www.mdpi.com/1422-0067/20/11/2738/s1.

Author Contributions

Conceptualization, original draft preparation, and writing, M.C.-M. and L.J.B.; Behavioral testing and analysis, M.C.-M. and T.M.S.; Histopathological and immunohistochemistry analysis, M.C.-M., L.A.G., N.T.G. and S.K.; Western blot analysis, R.J.B. and M.C.-M.; Resources and funding acquisition, C.A.D. and L.J.B.; Supervision and project administration, L.J.B. All authors participated in reviewing the manuscript.

Funding

This work was funded by NIMH R01 MH103848 and NINDS R01 NS073899.

Acknowledgments

This work was originally conceived by C.A.D. We would like to dedicate this work to him for his inspirational brilliance, creativity, and determination.

Conflicts of Interest

The authors declare the following competing financial interest(s): C.A.D. and L.J.B. are co-inventors of the following patent application: “Transgenic mouse model for conditional fkbp51 expression and related methods.” US Patent Application# US20150327523 A1. The other authors have no competing financial interest to disclose. The funders had no role in the design of the study; in the collection, analyses, or interpretation of data; in the writing of the manuscript, or in the decision to publish the results.

Abbreviations

AKTProtein kinase B
AMYGAmygdala
ANOVAAnalysis of variance
BLA and CeABasolateral and central nuclei of the amygdala
CAMKIICa2+/calmodulin-dependent protein kinase II
DHDorsal hippocampus
ELSEarly life stress
EPMElevated plus maze
FKBP5FK506-binding protein 5/FK506-binding protein 51
GAPDHGlyceraldehyde 3-phosphate dehydrogenase
GRGlucocorticoid receptor
GSK-3βGlycogen synthase kinase 3
HPAHypothalamic-pituitary-adrenal axis
HPCHippocampus
MWMMorris water maze
pAKTSer473Phosphorylated AKT at Serine 473
pGSK-3βSer9Phosphorylated GSK-3β phosphorylation at Serine 9
P1Postnatal Day 1
P21Postnatal Day 2
PPIPrepulse inhibition
PTSDPost-traumatic stress disorder
PVDFPolyvinylidene fluoride or polyvinylidene difluoride
SDS-PAGESodium dodecyl sulfate polyacrylamide gel electrophoresis
SEMStandard error of the mean
VHVentral hippocampus

References

  1. Substance Abuse and Mental Health Services Administration. Key Substance Use and Mental Health Indicators in the United States: Results from the 2016 National Survey on Drug Use and Health. Available online: https://www.samhsa.gov/data/ (accessed on 12 January 2019).
  2. Merikangas, K.R.; He, J.-P.; Burstein, M.; Swanson, S.A.; Avenevoli, S.; Cui, L.; Benjet, C.; Georgiades, K.; Swendsen, J. Lifetime prevalence of mental disorders in U.S. adolescents: Results from the National Comorbidity Survey Replication—Adolescent Supplement (NCS-A). J. Am. Acad. Child Adolesc. Psychiatry 2010, 49, 980–989. [Google Scholar] [CrossRef] [PubMed]
  3. Kessler, R.C.; Avenevoli, S.; Jane Costello, E.; Georgiades, K.; Greif Green, J.; Gruber, M.J.; He, J.; Koretz, D.; McLaughlin, K.A.; Petukhova, M.; et al. Prevalence, Persistence, and Sociodemographic Correlates of DSM-IV Disorders in the National Comorbidity Survey Replication Adolescent Supplement. Arch. Gen. Psychiatry 2012, 69, 372–380. [Google Scholar] [PubMed]
  4. Green, J.G.; McLaughlin, K.A.; Berglund, P.A.; Gruber, M.J.; Sampson, N.A.; Zaslavsky, A.M.; Kessler, R.C. Childhood adversities and adult psychiatric disorders in the national comorbidity survey replication I: Associations with first onset of DSM-IV disorders. Arch. Gen. Psychiatry 2010, 67, 113–123. [Google Scholar] [CrossRef] [PubMed]
  5. Klengel, T.; Binder, E.B. Epigenetics of Stress-Related Psychiatric Disorders and Gene 3 Environment Interactions. Neuron 2015, 86, 1343–1357. [Google Scholar] [CrossRef] [PubMed]
  6. Kessler, R.C.; McLaughlin, K.A.; Green, J.G.; Gruber, M.J.; Sampson, N.A.; Zaslavsky, A.M.; Aguilar-Gaxiola, S.; Alhamzawi, A.O.; Alonso, J.; Angermeyer, M.; et al. Childhood adversities and adult psychopathology in the WHO World Mental Health Surveys. Br. J. Psychiatry 2010, 197, 378–385. [Google Scholar] [CrossRef] [PubMed] [Green Version]
  7. McLaughlin, K.A.; Green, J.G.; Gruber, M.J.; Sampson, N.A.; Zaslavsky, A.M.; Kessler, R.C. Childhood adversities and adult psychiatric disorders in the national comorbidity survey replication II: Associations with persistence of DSM-IV disorders. Arch. Gen. Psychiatry 2010, 67, 124–132. [Google Scholar] [CrossRef] [PubMed]
  8. Roberts, S.; Keers, R.; Lester, K.J.; Coleman, J.R.; Breen, G.; Arendt, K.; Blatter-Meunier, J.; Cooper, P.; Creswell, C.; Fjermestad, K.; et al. HPA Axis Related Genes and Response to Psychological Therapies: Genetics and Epigenetics. Depress. Anxiety 2015, 32, 861–870. [Google Scholar] [CrossRef] [PubMed]
  9. Yehuda, R.; Golier, J.A.; Yang, R.-K.; Tischler, L.; Alonso, S.; Damas, C.; Navarra, E.; Altemus, M.; Cloitre, M.; Dhabhar, F.; et al. Enhanced sensitivity to glucocorticoids in peripheral mononuclear leukocytes in posttraumatic stress disorder. Biol. Psychiatry 2004, 55, 1110–1116. [Google Scholar] [CrossRef]
  10. Hori, H.; Ozeki, Y.; Teraishi, T.; Matsuo, J.; Kawamoto, Y.; Kinoshita, Y.; Suto, S.; Terada, S.; Higuchi, T.; Kunugi, H. Relationships between psychological distress, coping styles, and HPA axis reactivity in healthy adults. J. Psychiatr. Res. 2010, 44, 865–873. [Google Scholar] [CrossRef]
  11. Herman, J.P.; McKlveen, J.M.; Solomon, M.B.; Carvalho-Netto, E.; Myers, B. Neural regulation of the stress response: Glucocorticoid feedback mechanisms. Braz. J. Med. Biol. Res. 2012, 45, 292–298. [Google Scholar] [CrossRef]
  12. Arango-Lievano, M.; Jeanneteau, F. Timing and crosstalk of glucocorticoid signaling with cytokines, neurotransmitters and growth factors. Pharmacol. Res. 2016, 113, 1–17. [Google Scholar] [CrossRef] [PubMed]
  13. Menke, A.; Klengel, T.; Rubel, J.; Brückl, T.; Pfister, H.; Lucae, S.; Uhr, M.; Holsboer, F.; Binder, E.B. Genetic variation in FKBP5 associated with the extent of stress hormone dysregulation in major depression. Genes. Brain. Behav. 2013, 12, 289–296. [Google Scholar] [CrossRef] [PubMed]
  14. Zimmermann, P.; Brückl, T.; Nocon, A.; Pfister, H.; Binder, E.B.; Uhr, M.; Lieb, R.; Moffitt, T.E.; Caspi, A.; Holsboer, F.; et al. Interaction of FKBP5 Gene Variants and Adverse Life Events in Predicting Depression Onset: Results From a 10-Year Prospective Community Study. Am. J. Psychiatry 2011, 168, 1–18. [Google Scholar] [CrossRef] [PubMed]
  15. Scheuer, S.; Ising, M.; Uhr, M.; Otto, Y.; von Klitzing, K.; Klein, A.M. FKBP5 polymorphisms moderate the influence of adverse life events on the risk of anxiety and depressive disorders in preschool children. J. Psychiatr. Res. 2016, 72, 30–36. [Google Scholar] [CrossRef] [PubMed]
  16. Klengel, T.; Mehta, D.; Anacker, C.; Rex-haffner, M.; Jens, C.; Pariante, C.M.; Pace, T.W.W.; Mercer, K.B.; Helen, S.; Ressler, K.J.; et al. Allele-specific FKBP5 DNA demethylation mediates gene– childhood trauma interactions. Nat. Neurosci. 2013, 16, 33–41. [Google Scholar] [CrossRef] [PubMed]
  17. Blair, L.J.; Criado-Marrero, M.; Zheng, D.; Wang, X.; Kamath, S.; Nordhues, B.A.; Weeber, E.J.; Dickey, C.A. The disease-associated chaperone FKBP51 impairs cognitive function by accelerating AMPA receptor recycling. eNeuro 2019. [Google Scholar] [CrossRef] [PubMed]
  18. Gassen, N.C.; Hartmann, J.; Schmidt, M.V.; Rein, T. FKBP5/FKBP51 enhances autophagy to synergize with antidepressant action. Autophagy 2015, 11, 578–580. [Google Scholar] [CrossRef] [PubMed] [Green Version]
  19. Pei, H.; Li, L.; Fridley, B.L.; Jenkins, G.D.; Kalari, K.R.; Lingle, W.; Petersen, G.; Lou, Z.; Wang, L. FKBP51 Affects Cancer Cell Response to Chemotherapy by Negatively Regulating Akt. Cancer Cell 2009, 16, 259–266. [Google Scholar] [CrossRef] [Green Version]
  20. Yang, P.-C.; Yang, C.-H.; Huang, C.-C.; Hsu, K.-S. Phosphatidylinositol 3-Kinase Activation Is Required for Stress Protocol-induced Modification of Hippocampal Synaptic Plasticity. J. Biol. Chem. 2008, 283, 2631–2643. [Google Scholar] [CrossRef] [Green Version]
  21. Kohl, S.; Heekeren, K.; Klosterkötter, J.; Kuhn, J. Prepulse inhibition in psychiatric disorders—Apart from schizophrenia. J. Psychiatr. Res. 2013, 47, 445–452. [Google Scholar] [CrossRef]
  22. Pinto, V.; Costa, J.C.; Morgado, P.; Mota, C.; Miranda, A.; Bravo, F.V.; Oliveira, T.G.; Cerqueira, J.J.; Sousa, N. Differential impact of chronic stress along the hippocampal dorsal–ventral axis. Brain Struct. Funct. 2015, 220, 1205–1212. [Google Scholar] [CrossRef] [PubMed]
  23. Fanselow, M.S.; Dong, H.-W. Are the dorsal and ventral hippocampus functionally distinct structures? Neuron 2010, 65, 7–19. [Google Scholar] [CrossRef] [PubMed]
  24. Gassen, N.C.; Hartmann, J.; Zannas, A.; Kretzschmar, A.; Zschocke, J.; Maccarrone, G.; Hafner, K.; Zellner, A.; Kollmannsberger, L.; Wagner, K.; et al. FKBP51 inhibits GSK3β and augments the effects of distinct psychotropic medications. Mol. Psychiatry 2016, 21, 277–289. [Google Scholar] [CrossRef] [PubMed]
  25. Uhelski, M.L.; Fuchs, P.N. Maternal separation stress leads to enhanced emotional responses to noxious stimuli in adult rats. Behav. Brain Res. 2010, 212, 208–212. [Google Scholar] [CrossRef] [PubMed]
  26. de Castro-Catala, M.; Peña, E.; Kwapil, T.R.; Papiol, S.; Sheinbaum, T.; Cristóbal-Narváez, P.; Ballespí, S.; Barrantes-Vidal, N.; Rosa, A. Interaction between FKBP5 gene and childhood trauma on psychosis, depression and anxiety symptoms in a non-clinical sample. Psychoneuroendocrinology 2017, 85, 200–209. [Google Scholar] [CrossRef] [PubMed]
  27. Zannas, A.S.; Wiechmann, T.; Gassen, N.C.; Binder, E.B. Gene-Stress-Epigenetic Regulation of FKBP5: Clinical and Translational Implications. Neuropsychopharmacology 2016, 41, 261–274. [Google Scholar] [CrossRef] [PubMed]
  28. Maeng, L.Y.; Milad, M.R. Sex differences in anxiety disorders: Interactions between fear, stress, and gonadal hormones. Horm. Behav. 2015, 76, 106–117. [Google Scholar] [CrossRef] [PubMed] [Green Version]
  29. McLean, C.P.; Asnaani, A.; Litz, B.T.; Hofmann, S.G. Gender differences in anxiety disorders: Prevalence, course of illness, comorbidity and burden of illness. J. Psychiatr. Res. 2011, 45, 1027–1035. [Google Scholar] [CrossRef] [PubMed] [Green Version]
  30. Scharf, S.H.; Liebl, C.; Binder, E.B.; Schmidt, M.V.; Müller, M.B. Expression and regulation of the Fkbp5 gene in the adult mouse brain. PLoS ONE 2011, 6, e16883. [Google Scholar] [CrossRef]
  31. O’Leary, J.C.; Dharia, S.; Blair, L.J.; Brady, S.; Johnson, A.G.; Peters, M.; Cheung-Flynn, J.; Cox, M.B.; de Erausquin, G.; Weeber, E.J.; et al. A new anti-depressive strategy for the elderly: Ablation of FKBP5/FKBP51. PLoS ONE 2011, 6. [Google Scholar] [CrossRef]
  32. Sabbagh, J.J.; O’Leary, J.C.; Blair, L.J.; Klengel, T.; Nordhues, B.A.; Fontaine, S.N.; Binder, E.B.; Dickey, C.A. Age-Associated Epigenetic Upregulation of the FKBP5 Gene Selectively Impairs Stress Resiliency. PLoS ONE 2014, 9, e107241. [Google Scholar] [CrossRef] [PubMed]
  33. Isaksson, J.; Comasco, E.; Åslund, C.; Rehn, M.; Tuvblad, C.; Andershed, H.; Nilsson, K.W. Associations between the FKBP5 haplotype, exposure to violence and anxiety in females. Psychoneuroendocrinology 2016, 72, 196–204. [Google Scholar] [CrossRef] [PubMed]
  34. Fani, N.; King, T.Z.; Shin, J.; Srivastava, A.; Brewster, R.C.; Jovanovic, T.; Bradley, B.; Ressler, K.J. Structural and Functional Connectivity in Posttraumatic Stress Disorder: Associations with FKBP5. Depress. Anxiety 2016, 33, 300–307. [Google Scholar] [CrossRef] [PubMed]
  35. Glover, E.M.; Jovanovic, T.; Norrholm, S.D. Estrogen and extinction of fear memories: Implications for posttraumatic stress disorder treatment. Biol. Psychiatry 2015, 78, 178–185. [Google Scholar] [CrossRef] [PubMed]
  36. Goldstein, J.M.; Jerram, M.; Abbs, B.; Whitfield-Gabrieli, S.; Makris, N. Sex differences in stress response circuitry activation dependent on female hormonal cycle. J. Neurosci. 2010, 30, 431–438. [Google Scholar] [CrossRef]
  37. Fernandes, C.; González, M..; Wilson, C.; File, S. Factor Analysis Shows That Female Rat Behaviour Is Characterized Primarily by Activity, Male Rats Are Driven by Sex and Anxiety. Pharmacol. Biochem. Behav. 1999, 64, 731–736. [Google Scholar] [CrossRef]
  38. Daskalakis, N.P.; Bagot, R.C.; Parker, K.J.; Vinkers, C.H.; de Kloet, E.R.; Peters, J.J. The three-hit concept of vulnerability and resilience: Towards understanding adaptation to early-life adversity outcome. Psychoneuroendocrinology 2013, 38, 1858–1873. [Google Scholar] [CrossRef]
  39. Gassen, N.C.; Hartmann, J.; Zschocke, J.; Stepan, J.; Hafner, K.; Zellner, A.; Kirmeier, T.; Kollmannsberger, L.; Wagner, K.V.; Dedic, N.; et al. Association of FKBP51 with priming of autophagy pathways and mediation of antidepressant treatment response: Evidence in cells, mice, and humans. PLoS Med. 2014, 11. [Google Scholar] [CrossRef]
  40. Bouallegue, A.; Pandey, N.R.; Srivastava, A.K. CaMKII knockdown attenuates H2O2-induced phosphorylation of ERK1/2, PKB/Akt, and IGF-1R in vascular smooth muscle cells. Free Radic. Biol. Med. 2009, 47, 858–866. [Google Scholar] [CrossRef]
  41. Hartmann, J.; Wagner, K.V.; Gaali, S.; Kirschner, A.; Kozany, C.; Ru, G.; Dedic, N.; Ha, A.S.; Hoeijmakers, L.; Namendorf, C.; et al. Pharmacological Inhibition of the Psychiatric Risk Factor FKBP51 Has Anxiolytic Properties. J. Neurosci. 2015, 35, 9007–9016. [Google Scholar] [CrossRef] [Green Version]
  42. Hernández, F.; Borrell, J.; Guaza, C.; Avila, J.; Lucas, J.J. Spatial learning deficit in transgenic mice that conditionally over-express GSK-3β in the brain but do not form tau filaments. J. Neurochem. 2002, 83, 1529–1533. [Google Scholar] [CrossRef] [PubMed]
  43. Herman, J.P.; Patel, P.D.; Akil, H.; Watson, S.J. Localization and Regulation of Glucocorticoid and Mineralocorticoid Receptor Messenger RNAs in the Hippocampal Formation of the Rat. Mol. Endocrinol. 1989, 3, 1886–1894. [Google Scholar] [CrossRef] [PubMed]
  44. Han, F.; Ding, J.; Shi, Y. Expression of amygdala mineralocorticoid receptor and glucocorticoid receptor in the single-prolonged stress rats. BMC Neurosci. 2014, 15, 77. [Google Scholar] [CrossRef] [PubMed]
  45. Tye, K.M.; Prakash, R.; Kim, S.-Y.; Fenno, L.E.; Grosenick, L.; Zarabi, H.; Thompson, K.R.; Gradinaru, V.; Ramakrishnan, C.; Deisseroth, K. Amygdala circuitry mediating reversible and bidirectional control of anxiety. Nature 2011, 471, 358–362. [Google Scholar] [CrossRef] [PubMed]
  46. Mahan, A.L.; Ressler, K.J. Fear conditioning, synaptic plasticity and the amygdala: Implications for posttraumatic stress disorder. Trends Neurosci. 2012, 35, 24–35. [Google Scholar] [CrossRef] [PubMed]
  47. Chocyk, A.; Bobula, B.; Dudys, D.; Przyborowska, A.; Majcher-Maślanka, I.; Hess, G.; Wędzony, K. Early-life stress affects the structural and functional plasticity of the medial prefrontal cortex in adolescent rats. Eur. J. Neurosci. 2013, 38, 2089–2107. [Google Scholar] [CrossRef] [PubMed]
  48. Banqueri, M.; Méndez, M.; Arias, J.L. Behavioral effects in adolescence and early adulthood in two length models of maternal separation in male rats. Behav. Brain Res. 2017, 324, 77–86. [Google Scholar] [CrossRef] [PubMed]
Figure 1. High FK506-binding protein 5 (FKBP5) and early life stress increases anxiety-like behavior. (A) Timeline of experimental protocol and total number of animals per group for each genotype and stress condition. For the maternal separation, mice were separated from their dams for 3 h daily for 14 consecutive days. (B) Total time in open arms and (C) distance traveled during the elevated plus maze (EPM) test. EPM total time spent in open arms by (D) males and (E) females. WT = wild-type, tTA = CamKIIα-tTA, rTgFKBP5 = FKBP5 overexpressing mice, M = males, F = Females, s = seconds, m =meters, ELS = early life stress. Data are represented as standard error of the mean (SEM) and analyzed by three- and two-way Analysis of variance (ANOVA)s (see Table 1 for analysis). Significant results were considered when p < 0.05 and were followed by Bonferroni post hoc tests. * = two-way ANOVA significant difference (p < 0.05) within non-stressed or ELS groups; n.s. = non-significant. MWM = Morris Water Maze.
Ijms 20 02738 g001
Figure 2. Interaction of FKBP5 and early life stress does not affect startle response. (A) Baseline startle response. Percentage of prepulse inhibition to 74, 78, 82, 86, and 90 dB acoustic stimulus compared to the baseline startle for the (B) control and (C) ELS groups. Data are represented as standard error of the mean (SEM) and analyzed by repeated measures two-way ANOVA (see Table 1 for analysis). * = p < 0.05 when comparing ELS-genotype differences. ELS = early life stress.
Ijms 20 02738 g002
Figure 3. Deficit in spatial reversal learning is attributed to high levels of FKBP5 independently of stress. Spatial reversal memory analysis of non-stressed mice (WT= 11, tTA =10, TgFKBP5 = 9) during (A) training days and (B) probe test using the Morris Water Maze (MWM) paradigm. Data analysis for spatial reversal learning of early stressed mice (WT = 10, tTA = 10, rTgFKBP5 = 10) during (C) training days and (D) probe test. Each training day represents a block of 4–60 s trials. s = seconds, ELS = early life stress; Quadrants: T = target, O = Opposite, AR = adjacent right, AL = adjacent left. SEM = standard error of the mean, n.s. = non-significant. Data were analyzed by two-way ANOVA followed by Bonferroni post-hoc tests where significant results are represented as * = p < 0.05. Refer to Supplementary Material File S3 for MWM spatial learning and memory testing and Table 1 for three-way ANOVA analysis.
Ijms 20 02738 g003
Figure 4. Early life stress increases phosphorylated AKT at Serine 473 (pAKTSer473) in the hippocampus. (A) Relative intensity of pAKTSer473 in the hippocampus (HPC) from WT = 6, tTA = 5, rTgFKBP5 = 5 mice and WT = 5, tTA = 5, rTgFKBP5 = 5 mice with ELS. (B) Representative images are shown. (C) GSK-3β levels in the HPC from the same mice. Interaction of stress and genotype was analyzed by two-way ANOVA followed by Bonferroni correction when significant (see Table 2). Values are represented as standard error of the mean (SEM) and relative protein expression is normalized to WT-control mice (represented by dotted lines). ELS = early life stress. Scale bar represents 200 µm; inset scale represents 20 µm. AKT = Protein kinase B.
Ijms 20 02738 g004
Figure 5. Overexpression of FKBP5 reduces pAKT/AKT ratio in the dorsal hippocampus. (A) FKBP5 protein expression from DH tissue punches normalized to total protein. Calculated ratio of (B) pAKT/AKT and (C) pGSK3β/GSK3β in DH. (D) Representative Western blots for DH. Protein expression calculated for (E) FKBP5, (F) pAKT/AKT and (G) pGSK3β/GSK3β ratios in the VH. (H) Representative Western blots for VH. Tissue punches were also extracted from the AMYG to assess protein expression of (I) FKBP5 followed by (J) pAKT/AKT and (K) pGSK3β/GSK3β in this structure. (L) Representative Western blots for AMYG. Interaction of stress and genotype was analyzed by two-way ANOVA followed by Bonferroni correction when significant * = p < 0.05.; # = significant difference between stressed and non-stressed rTgFKBP5 mice. Values are represented as standard error of the mean (SEM) and protein was normalized to total protein expression. DH = dorsal hippocampus, VH= ventral hippocampus, AMYG = amygdala, ELS = early life stress.
Ijms 20 02738 g005
Table 1. Summary of statistical analyses of behavioral tasks.
FigureMeasured ConditionGroups AnalyzedGen. x ELS FactorF Statistic and p-Value
1BEPM: Anxiety levels (open arms) See 1D-E for sex differences3-way ANOVA, All groupsF(2, 48) = 1.078, p = 0.347GenotypeF(2, 48) = 4.610, p = 0.014
ELSF(1, 48) = 3.28, p = 0.075
SexF(1, 48) = 0.308, p = 0.582
Sex/Gen/ELSF(2, 48) = 1.968, p = 0.151
2-way ANOVA, Non-stressedF(2, 48) = 1.548, p = 0.233GenotypeF(2, 48) = 1.442, p = 0.256
SexF(1, 48) = 0.617, p = 0.439
2-way ANOVA, ELSF(2, 48) = 3.089, p = 0.06GenotypeF(2, 48) = 4.015, p = 0.031
SexF(1, 48) = 4.003, p = 0.05
Number entries to open arms3-way ANOVA, All groupsF(2, 48) = 0.351, p = 0.705GenotypeF(2, 48) = 1.283, p = 0.285
ELSF(1, 48) = 0.049, p = 0.824
SexF(1, 48) = 1.478, p = 0.230
Sex/Gen/ELSF(1, 48) = 0.541, p = 0.585
Anxiety levels (closed arms)3-way ANOVA, All groupsF(2, 48) = 1.181, p = 0.316GenotypeF(2, 48) = 0.010, p = 0.989
ELSF(1, 48) = 0.850, p = 0.360
SexF(1, 48) = 0.638, p = 0.428
Sex/Gen/ELSF(2, 48) = 1.096, p = 0.342
2-way ANOVA, MalesF(2,24) = 0.228, p = 0.797GenotypeF(2,24) = 3.509, p = 0.049
ELSF(1,24) = 0.002, p = 0.958
2-way ANOVA, FemalesF(2,24) = 1.865, p = 0.176GenotypeF(2,24) = 1.649, p = 0.213
ELSF(1,24) = 0.354, p = 0.557
1CEPM: Locomotion3-way ANOVA, All groupsF(2,48) = 0.353, p = 0.704GenotypeF(2,48) = 1.657, p = 0.200
ELSF(1,48) = 0.205 p = 0.652
SexF(1,48) = 0.399, p = 0.673
Sex/Gen/ELSF(2,24) = 1.649, p = 0.213
2-way ANOVA, MalesF(2,24) = 0.137, p = 0.879GenotypeF(2,24) = 0.714, p = 0.499
ELSF(1,24) = 0.465 p = 0.501
2-way ANOVA, FemalesF(2,24) = 0.336, p = 0.717GenotypeF(2,24) = 1.327, p = 0.284
ELSF(1,24) = 0.0 p = 1
1DAnxiety levels (open arms)2-way ANOVA, MalesF(2,24) = 0.089, p = 0.914GenotypeF(2,24) = 8.900, p = 0.001
ELSF(1,24) = 0.001, p = 0.971
1E 2-way ANOVA, FemalesF(2,24) = 3.069, p = 0.065GenotypeF(2,24) = 0.747 p = 0.294
ELSF(1,24) = 6.449, p = 0.018
2AStartle response3-way ANOVA, All groupsF(2, 48) = 0.997, p = 0.377GenotypeF(2, 48) = 1.058 p = 0.355
ELSF(1, 48) = 0.609, p = 0.439
SexF(1, 48) = 0.388, p = 0.536
Sex/Gen/ELSF(1, 48) = 0.395, p = 0.676
2-way ANOVA, MalesF(2,24) = 0.691, p = 0.511GenotypeF(2,24) = 0.770, p = 0.475
ELSF(1,24) = 0.199, p = 0.660
2-way ANOVA, FemalesF(2,24) = 0.464, p = 0.634GenotypeF(2,24) = 0.791, p = 0.464
ELSF(1,24) = 0.789, p = 0.383
2B,CPPI 3-way RM-ANOVA, All groupsF(2, 48) = 0.629, p = 0.537GenotypeF(2, 48) = 7.658, p = 0.001
ELSF(1, 48) = 0.272, p = 0.605
SexF(1, 48) = 4.532, p = 0.038
Sex/Gen/ELSF(1, 48) = 0.620, p = 0.542
3A,CMWM, Reversal training3-way RM-ANOVA, All groups F(2, 54) = 0.688, p = 0.507GenotypeF(2, 54) = 2.685, p = 0.078
ELSF(1, 54) = 0.123, p = 0.727
SexF(1, 54) = 0.021, p = 0.886
Sex/Gen/ELSF(2, 54) = 0.385, p = 0.683
2-way RM-ANOVA, Non-Stressed GenotypeF(2, 24) = 1.456, p = 0.253
SexF(1, 24) = 0.101, p = 0.753
TrainingF(2, 23) = 28.02, p < 0.001
2-way RM-ANOVA, ELS GenotypeF(2, 24) = 1.913, p = 0.169
SexF(1, 24) = 0.006, p = 0.941
TrainingF(2, 23) = 17.53, p < 0.001
2-way ANOVA, MalesF(2,24) = 0.812, p = 0.456GenotypeF(2,24) = 3.454, p = 0.048
ELSF(1,24) = 0.003, p = 0.456
2-way ANOVA, FemalesF(2,24) = 0.054, p = 0.947GenotypeF(2,24) = 0.091, p = 0.913
ELSF(1,24) = 0.245, p = 0.625
3B,DMWM, Reversal Probe3-way RM-ANOVA, All groups F(2, 54) = 0.135, p = 0.873GenotypeF(2, 54) = 3.827, p = 0.027
ELSF(1, 54) = 0.170, p = 0.681
SexF(1, 54) = 0.183, p = 0.670
Sex/Gen/ELSF(2, 54) = 0.244, p = 0.784
2-way ANOVA, MalesF(2,24) = 0.076, p = 0.927GenotypeF(2,24) = 1.208, p = 0.316
ELSF(1,24) = 0.712, p = 0.407
2-way ANOVA, FemalesF(2,24) = 0.289, p = 0.752GenotypeF(2,24) = 0.012, p = 0.988
ELSF(1,24) = 2.547, p = 0.124
S1APercent of open arm entries3-way ANOVA, All groupsF(2, 48) = 1.560, p = 0.219GenotypeF(2, 48) = 3.956, p = 0.026
ELSF(1, 48) = 0.000, p = 0.998
SexF(1, 48) = 0.348, p = 0.558
Sex/Gen/ELSF(1, 48) = 1.720, p = 0.097
S1BPercent of open arm entries2-way ANOVA, MalesF(2, 48) = 2.753, p = 0.042GenotypeF(2, 48) = 5.423, p = 0.01
ELSF(1, 48) = 1.493, p = 0.234
S1CPercent of open arm entries2-way ANOVA, FemalesF(2, 48) =0.854, p = 0.526GenotypeF(2, 48) = 0.199, p = 0.821
ELSF(1, 48) = 1.627, p = 0.214
S2A 2-way RM-ANOVA, MalesF(2,24) = 0.412, p = 0.668GenotypeF(2,24) = 0.614, p = 0.552
ELSF(1,24) = 0.879, p = 0.360
S2B 2-way RM-ANOVA, FemalesF(2,24) = 7.092, p = 0.004GenotypeF(2,24) = 0.692, p = 0.511
ELSF(1,24) = 3.903, p = 0.061
S3AMWM, Visible3-way ANOVA, All groupsF(2, 54) = 0.107, p = 0.898GenotypeF(2, 54) = 2.062, p= 0.137
ELSF(1, 54) = 0.110, p= 0.740
SexF(1, 54) = 1.289, p = 0.262
Sex/Gen/ELSF(2, 54) = 0.099, p = 0.906
2-way ANOVA, MalesF(2,24) = 0.352, p = 0.707GenotypeF(2,24) = 5.372, p = 0.012
ELSF(1,24) = 0.488, p = 0.492
2-way ANOVA, FemalesF(2,24) = 0.008, p = 0.992GenotypeF(2,24) = 0.370, p = 0.694
ELSF(1,24) = 0.002, p = 0.961
S3B,DMWM, Training3-way RM-ANOVA, All groups F(2, 54) = 0.407, p = 0.668GenotypeF(2, 54) = 0.434, p = 0.650
ELSF(1, 54) = 1.231, p = 0.272
SexF(1, 54) = 0.003, p = 0.954
Sex/Gen/ELSF(2, 54) = 0.195, p = 0.823
2-way RM-ANOVA, Non-Stressed GenotypeF(2, 24) = 0.020, p = 0.981
SexF(1, 24) = 0.053, p = 0.821
TrainingF(2, 23) = 14.27, p < 0.001
2-way RM-ANOVA, ELS GenotypeF(2, 24) = 0.847, p = 0.441
SexF(1, 24) = 0.028, p = 0.868
TrainingF(2, 23) = 26.49, p < 0.001
2-way ANOVA, MalesF(2,24) = 0.174, p = 0.841GenotypeF(2,24) = 0.092, p = 0.912
ELSF(1,24) = 0.838, p = 0.369
2-way ANOVA, FemalesF(2,24) = 0.402, p = 0.673GenotypeF(2,24) = 0.534, p = 0.593
ELSF(1,24) = 0.313, p = 0.581
S3C,EMWM, Probe3-way ANOVA, All groups F(2, 54) = 7.047, p = 0.002GenotypeF(2, 54) = 7.018, p = 0.002
ELSF(1, 54) = 9.118, p = 0.004
SexF(1, 54) = 0.057, p = 0.813
Sex/Gen/ELSF(1, 54) = 0.362, p = 0.698
ELS: Early life stress, GEN: Genotype.
Table 2. Summary of statistical analyses by two-way ANOVA of staining and Western blots. DH = dorsal; VH = ventral; AMYG = amygdala.
FigureBrain AreaProteinGroupsGen. x ELS Gen.ELS
Figure 4AHPCpAKTSer473All groupsF(2, 24) = 0.077, p = 0.926F(2, 24) = 5.903, p = 0.007F(1, 24) = 4.373, p = 0.046
Figure 4CHPC GSK-3βAll groupsF(2, 24) = 0.079, p = 0.923F(2, 24) = 1.639, p = 0.215F(1, 24) = 0.083, p = 0.774
Figure 5ADHFKBP5All groupsF(2, 24) = 3.563, p = 0.045F(2, 24) = 27.23, p < 0.001F(1, 24) = 3.068, p = 0.093
Figure 5BDHpAKTSer473/AKT ratioAll groupsF(2, 22) = 6.304, p = 0.006F(2, 22) = 1.110, p < 0.347F(1, 22) = 0.965, p = 0.336
Figure 5CDHpGSK-3 βSer9/GSK-3βAll groupsF(2, 22) = 0.575 p = 0.570F(2, 22) = 0.703, p < 0.505F(1, 22) = 0.812, p = 0.376
Figure 5EVHFKBP5All groupsF(2, 22) = 0.898, p = 0.421F(2, 22) = 15.51, p < 0.001F(1, 22) = 1.041, p = 0.318
Figure 5FVHpAKTSer473/AKT ratioAll groupsF(2, 22) = 0.746, p = 0.487F(2, 22) = 0.057, p < 0.944F(1, 22) = 0.159, p = 0.694)
Figure 5GVHpGSK-3βSer9/GSK-3βAll groupsF(2, 22) = 0.185, p = 0.832F(2, 22) = 1.175, p < 0.329F(1, 22) = 1.219, p = 0.286
Figure 5IAMYGFKBP5All groupsF(2,18) = 1.485, p = 0.253F(2, 18) = 118.6, p < 0.001F(1, 18) = 0.645, p = 0.432
Figure 5JAMYGpAKTSer473/AKT ratioAll groupsF(2, 18) = 1.446, p = 0.263F(2, 18) = 2.502, p < 0.115F(1, 18) = 0.774, p = 0.391
Figure 5KAMYGpGSK-3βSer9/GSK-3βAll groupsF(2, 18) = 0.374, p = 0.693F(2, 18) = 1.322, p < 0.291F(1, 18) = 0.462, p = 0.505

