Exploration of Catalytic Selectivity for Aminotransferase (BtrR) Based on Multiple Molecular Dynamics Simulations

 and
and
Abstract
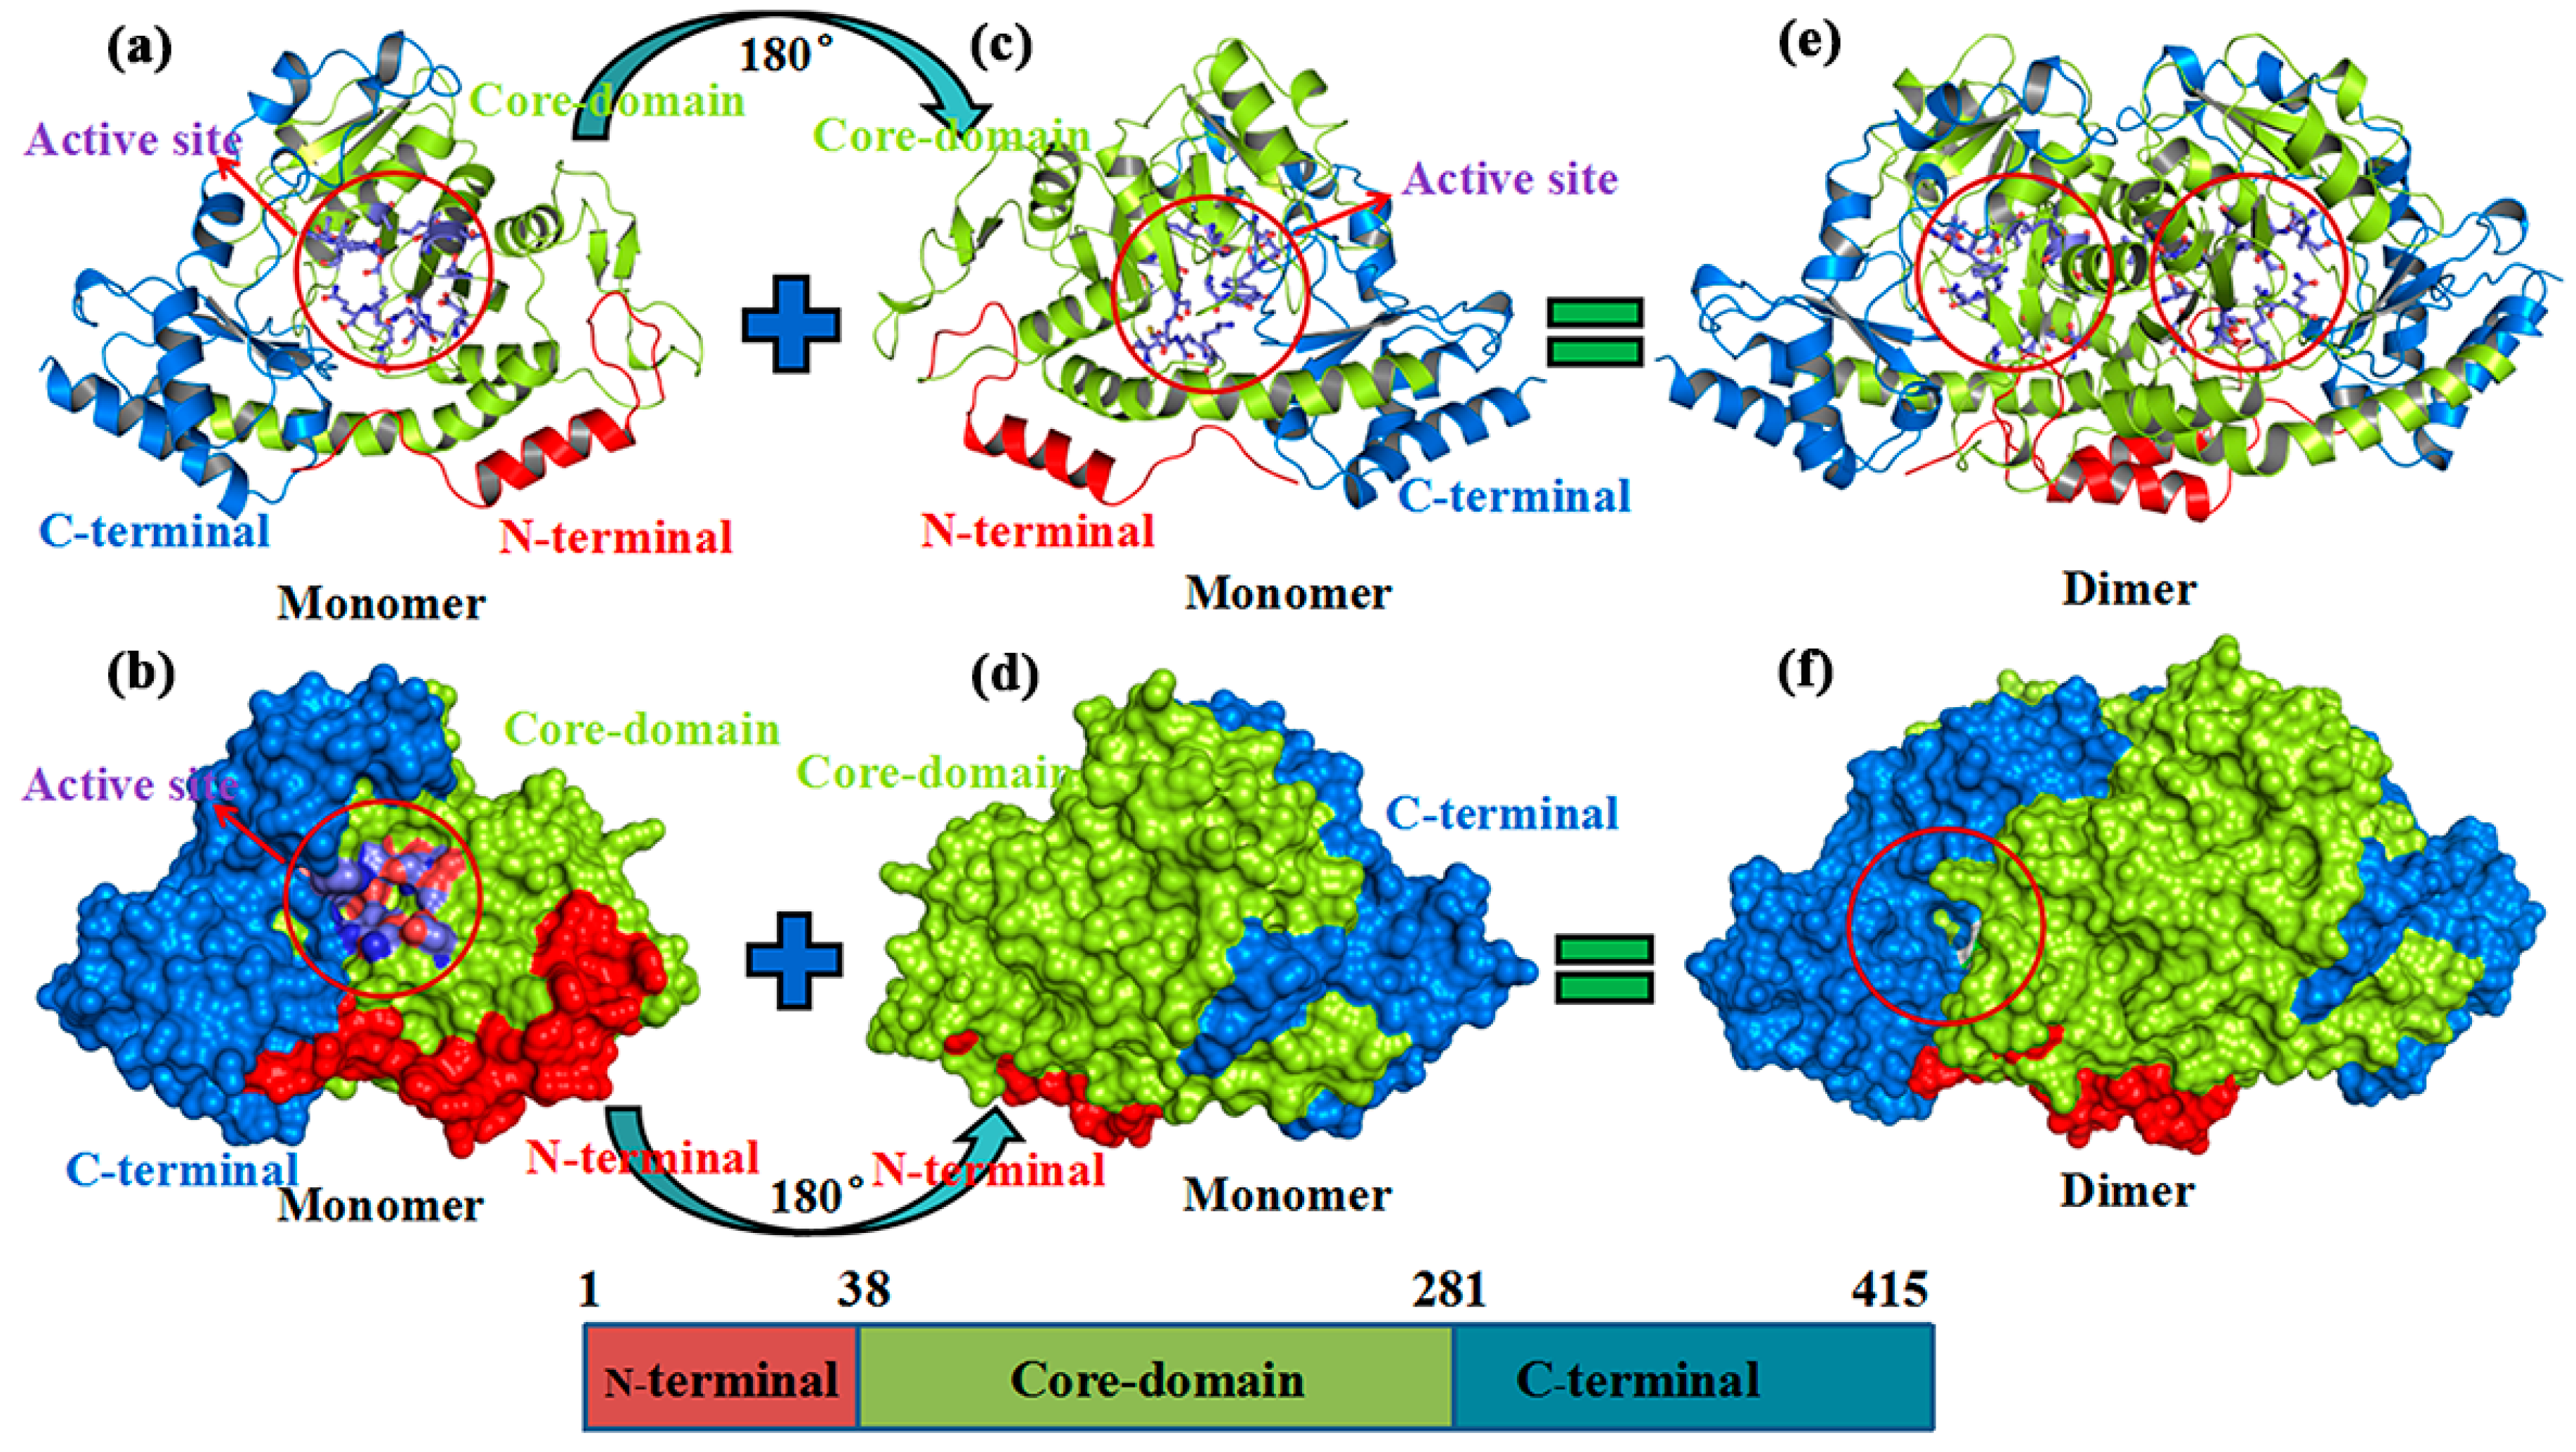
:1. Introduction
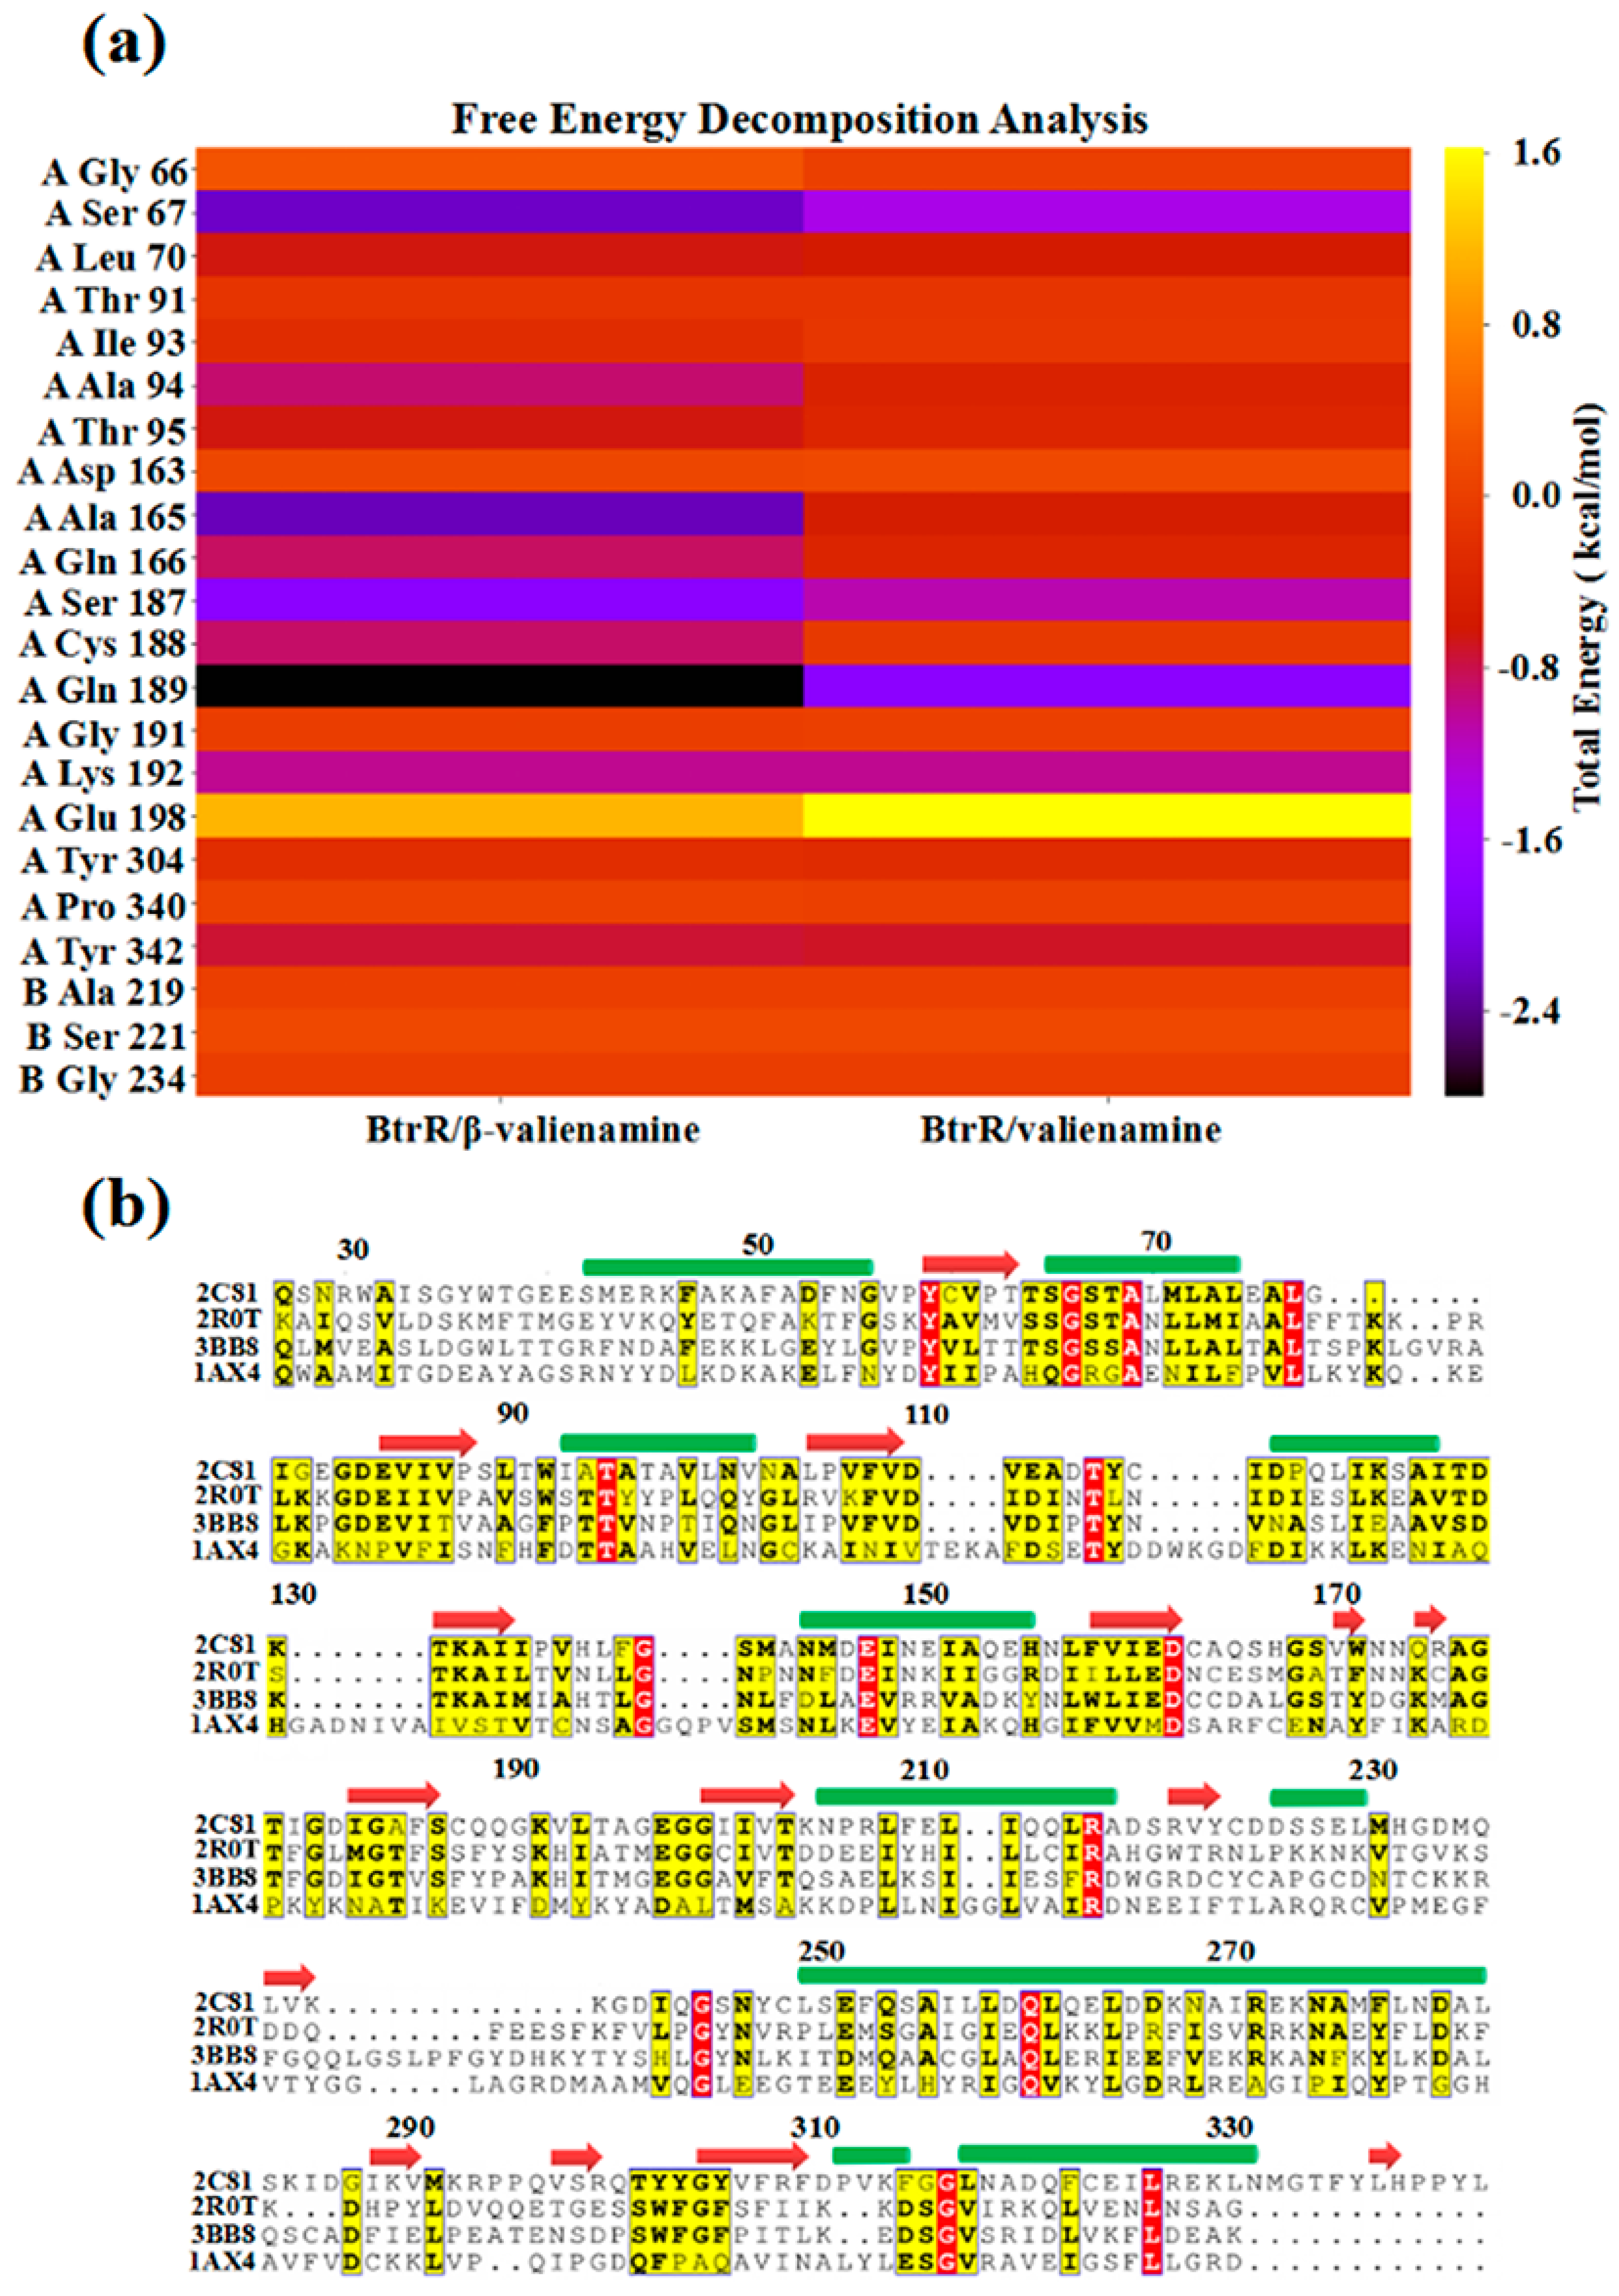
2. Results and Discussion
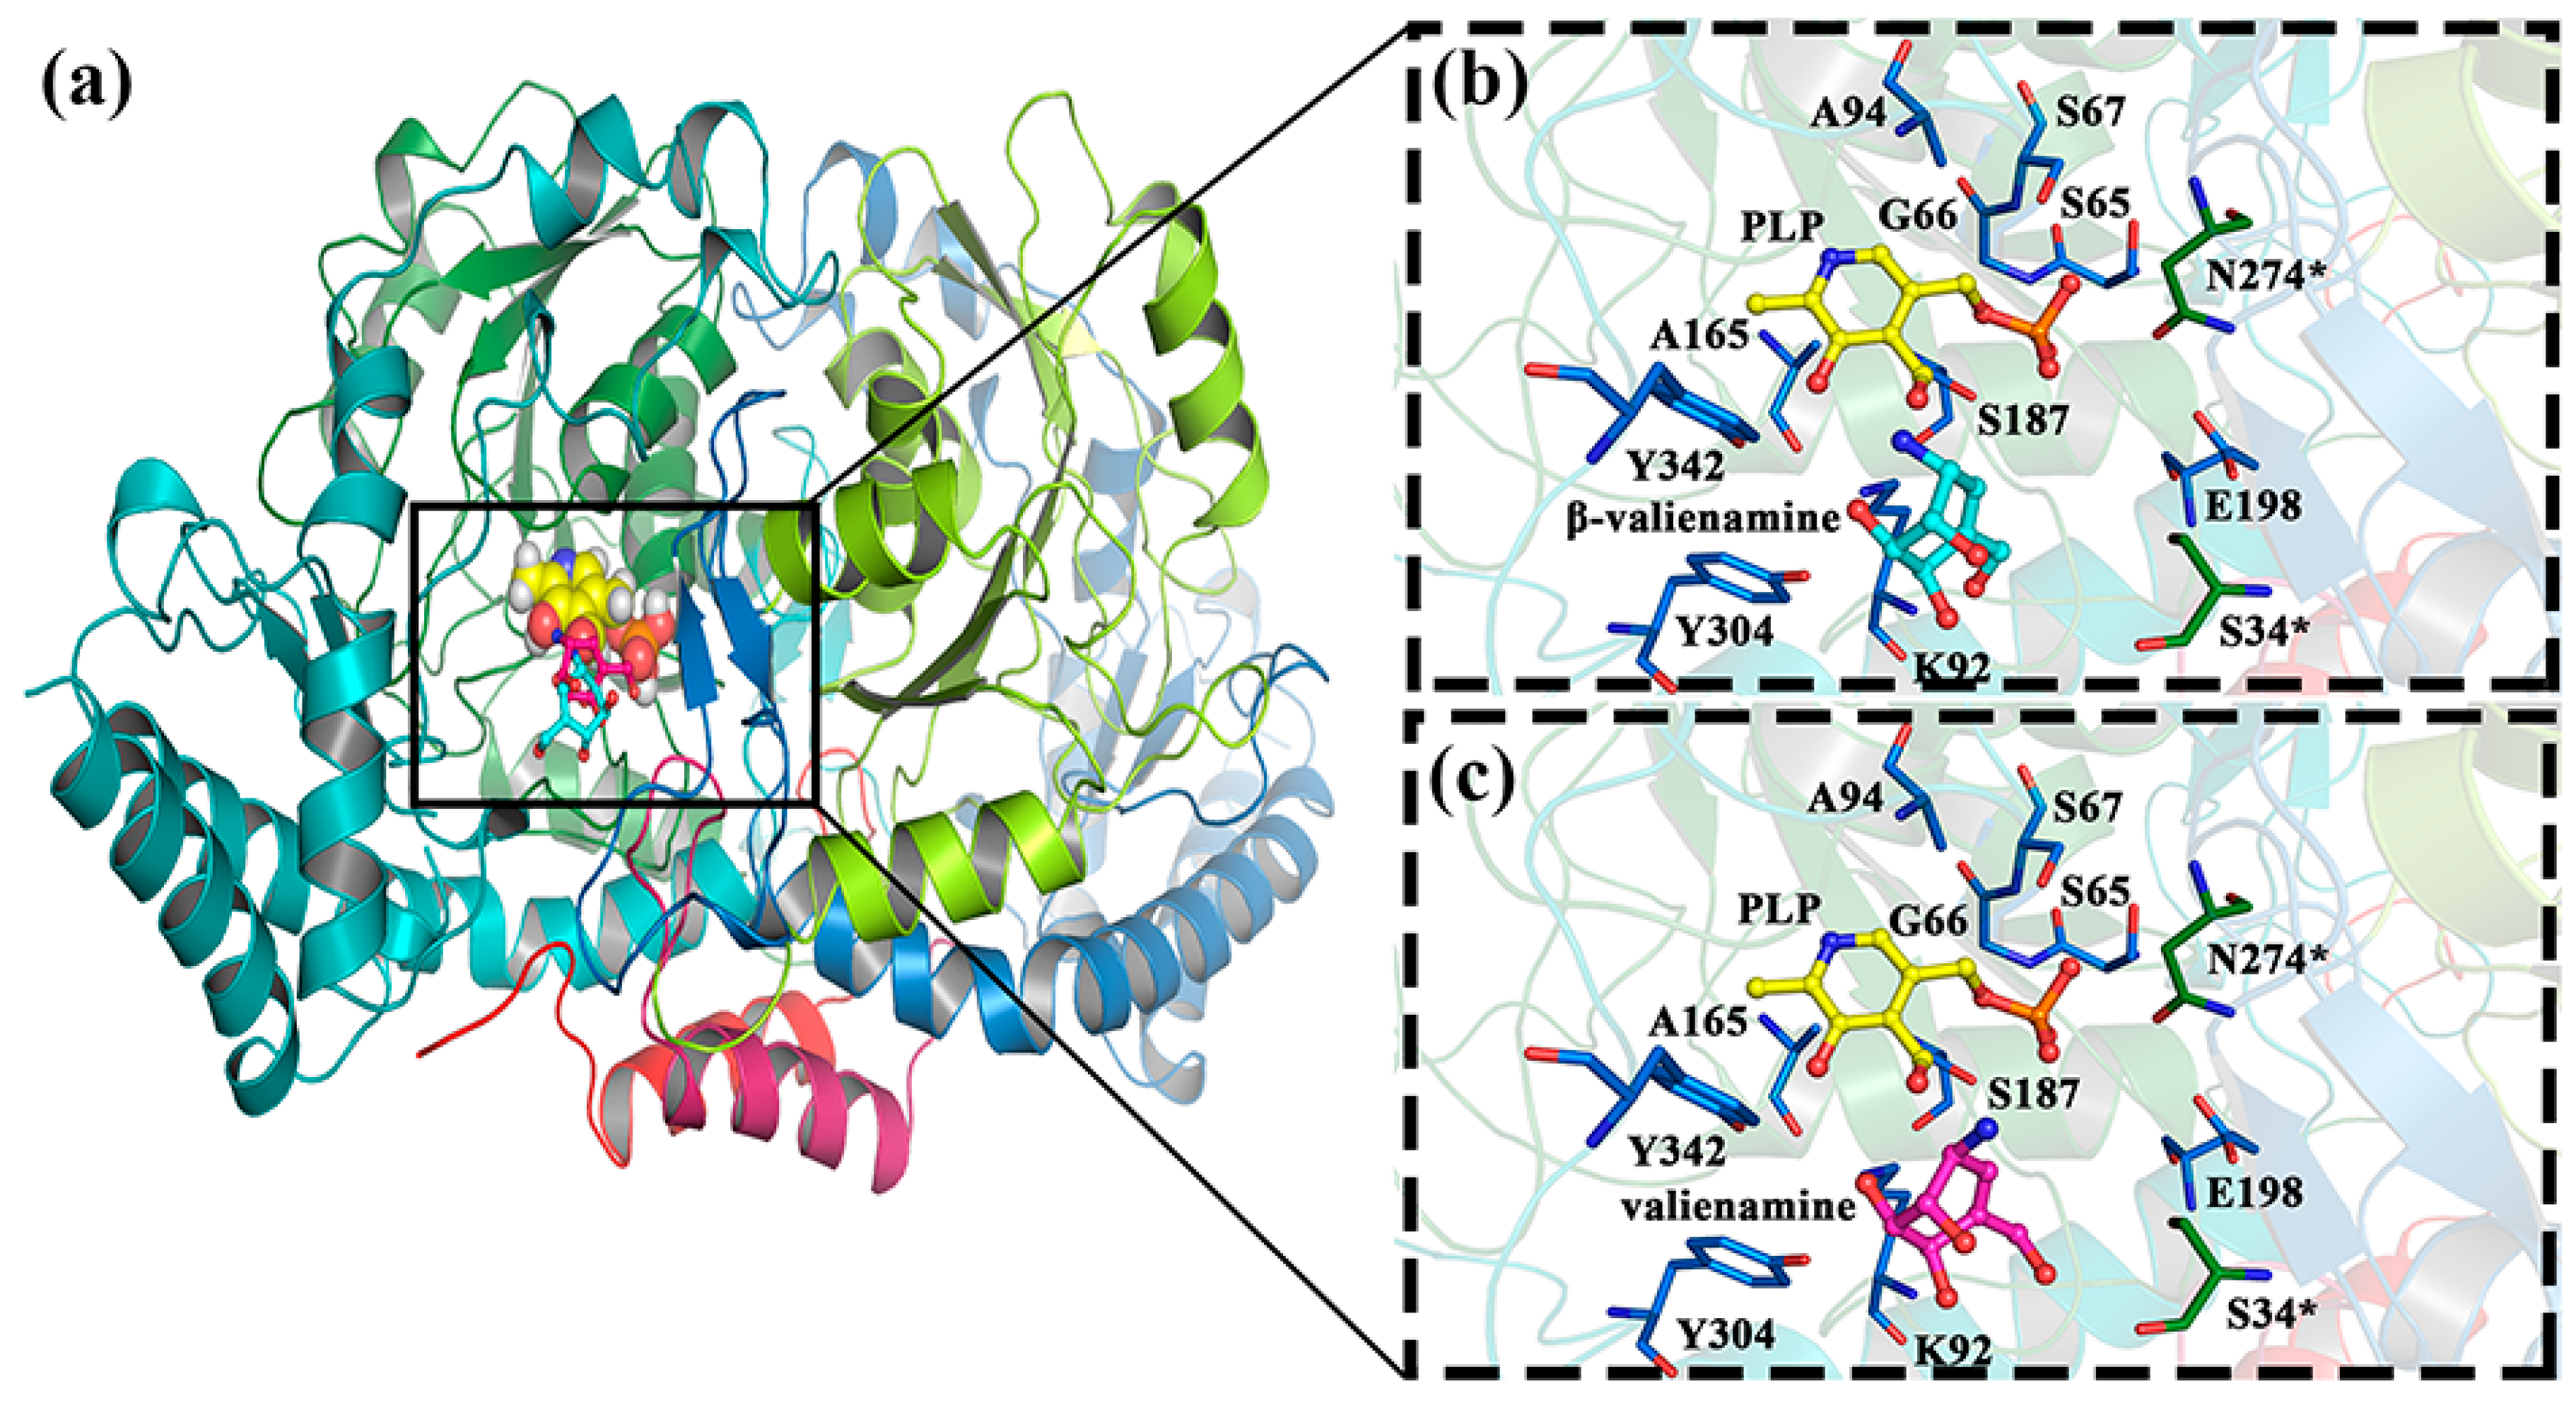
2.1. β-Valienamine and Valienamine Docking to BtrR
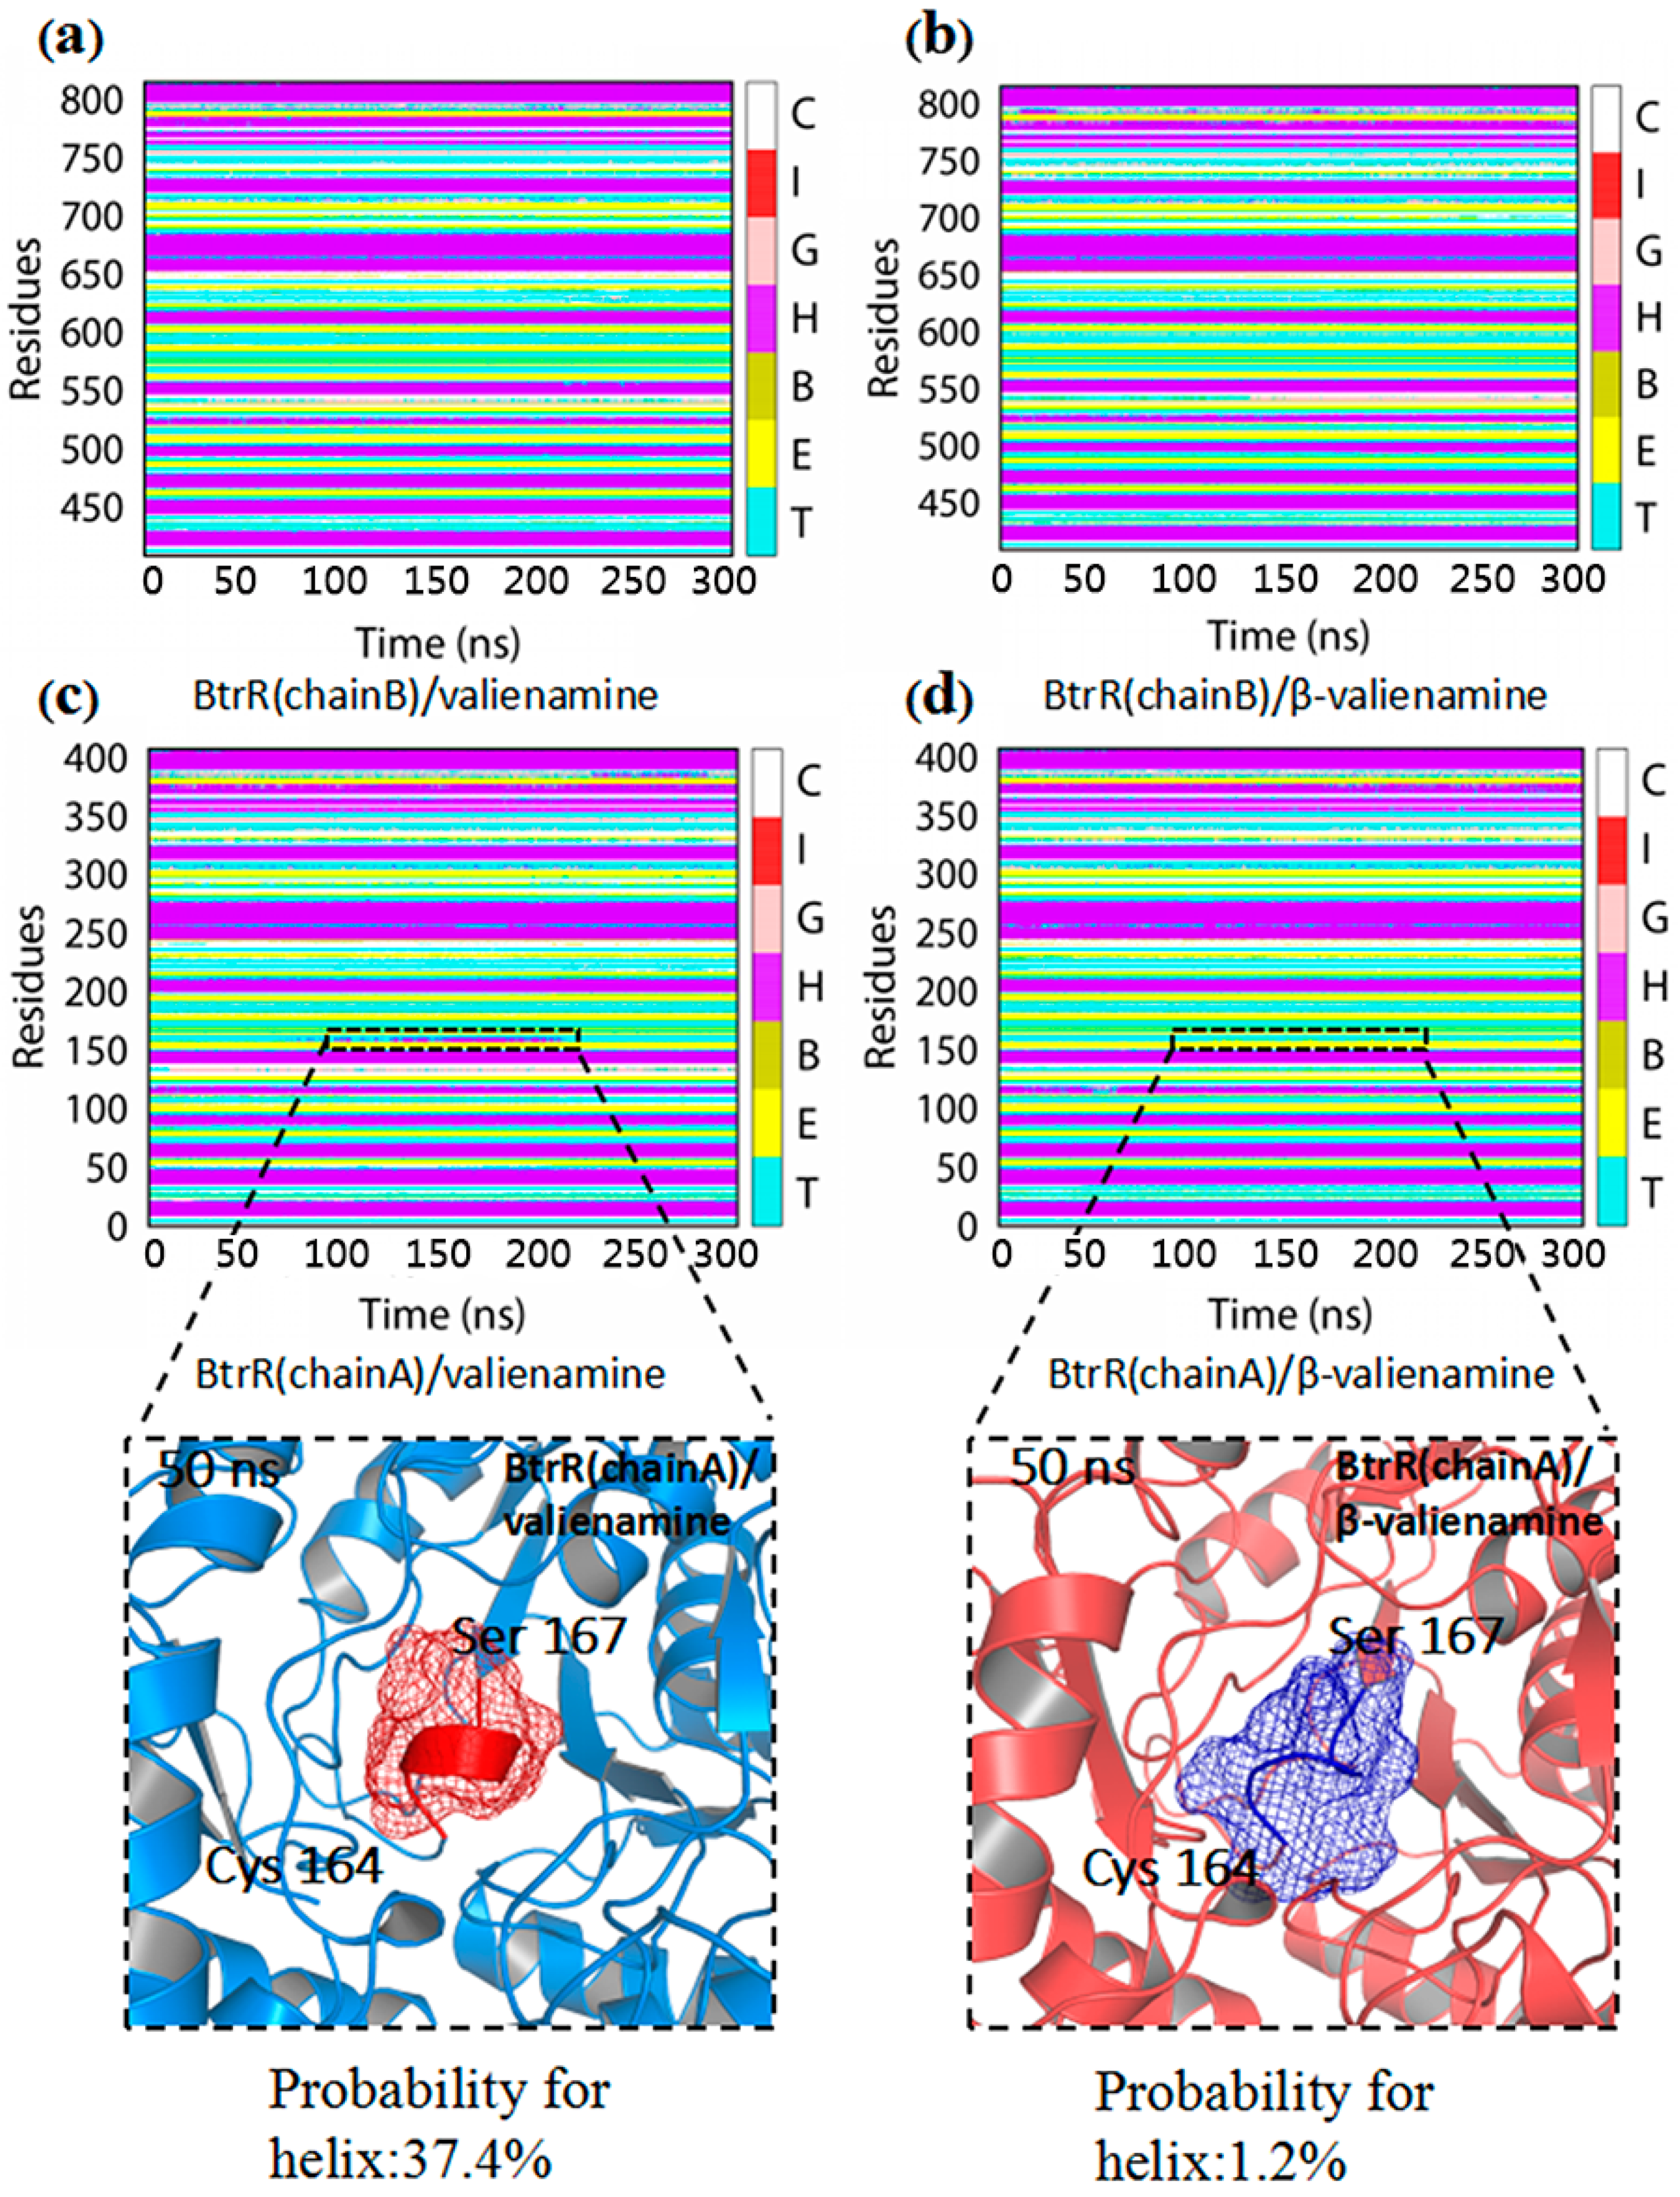
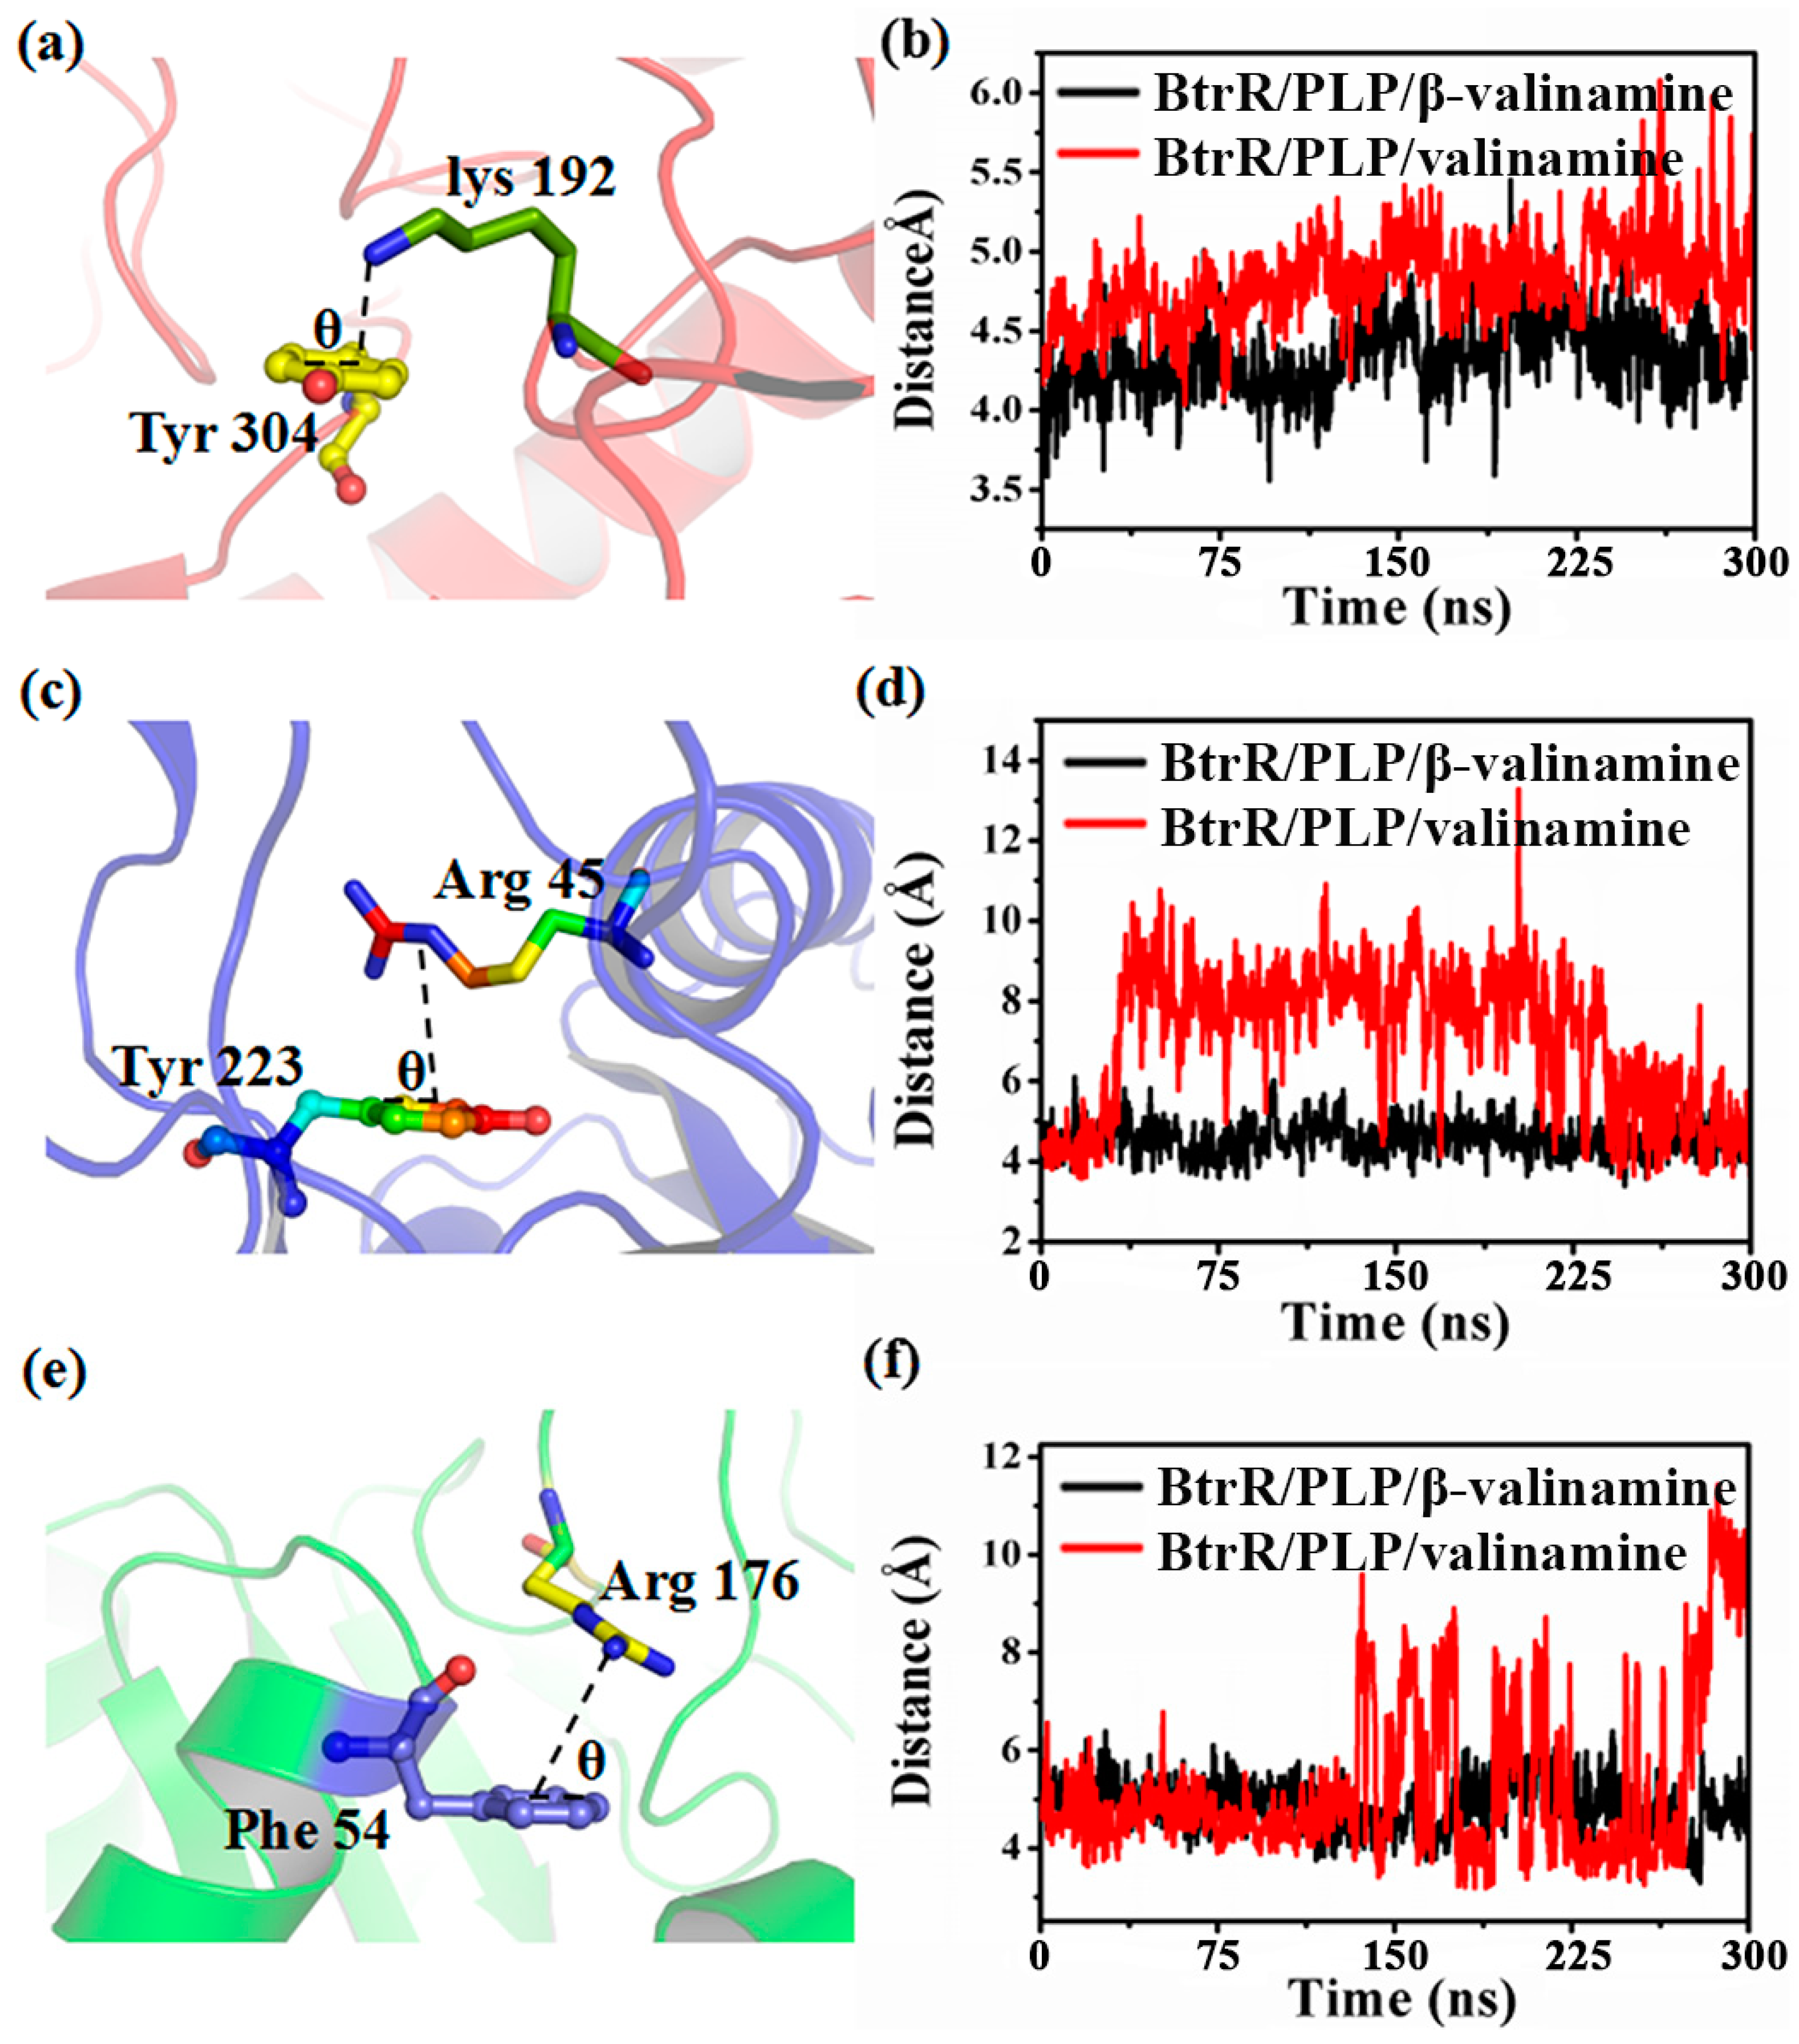
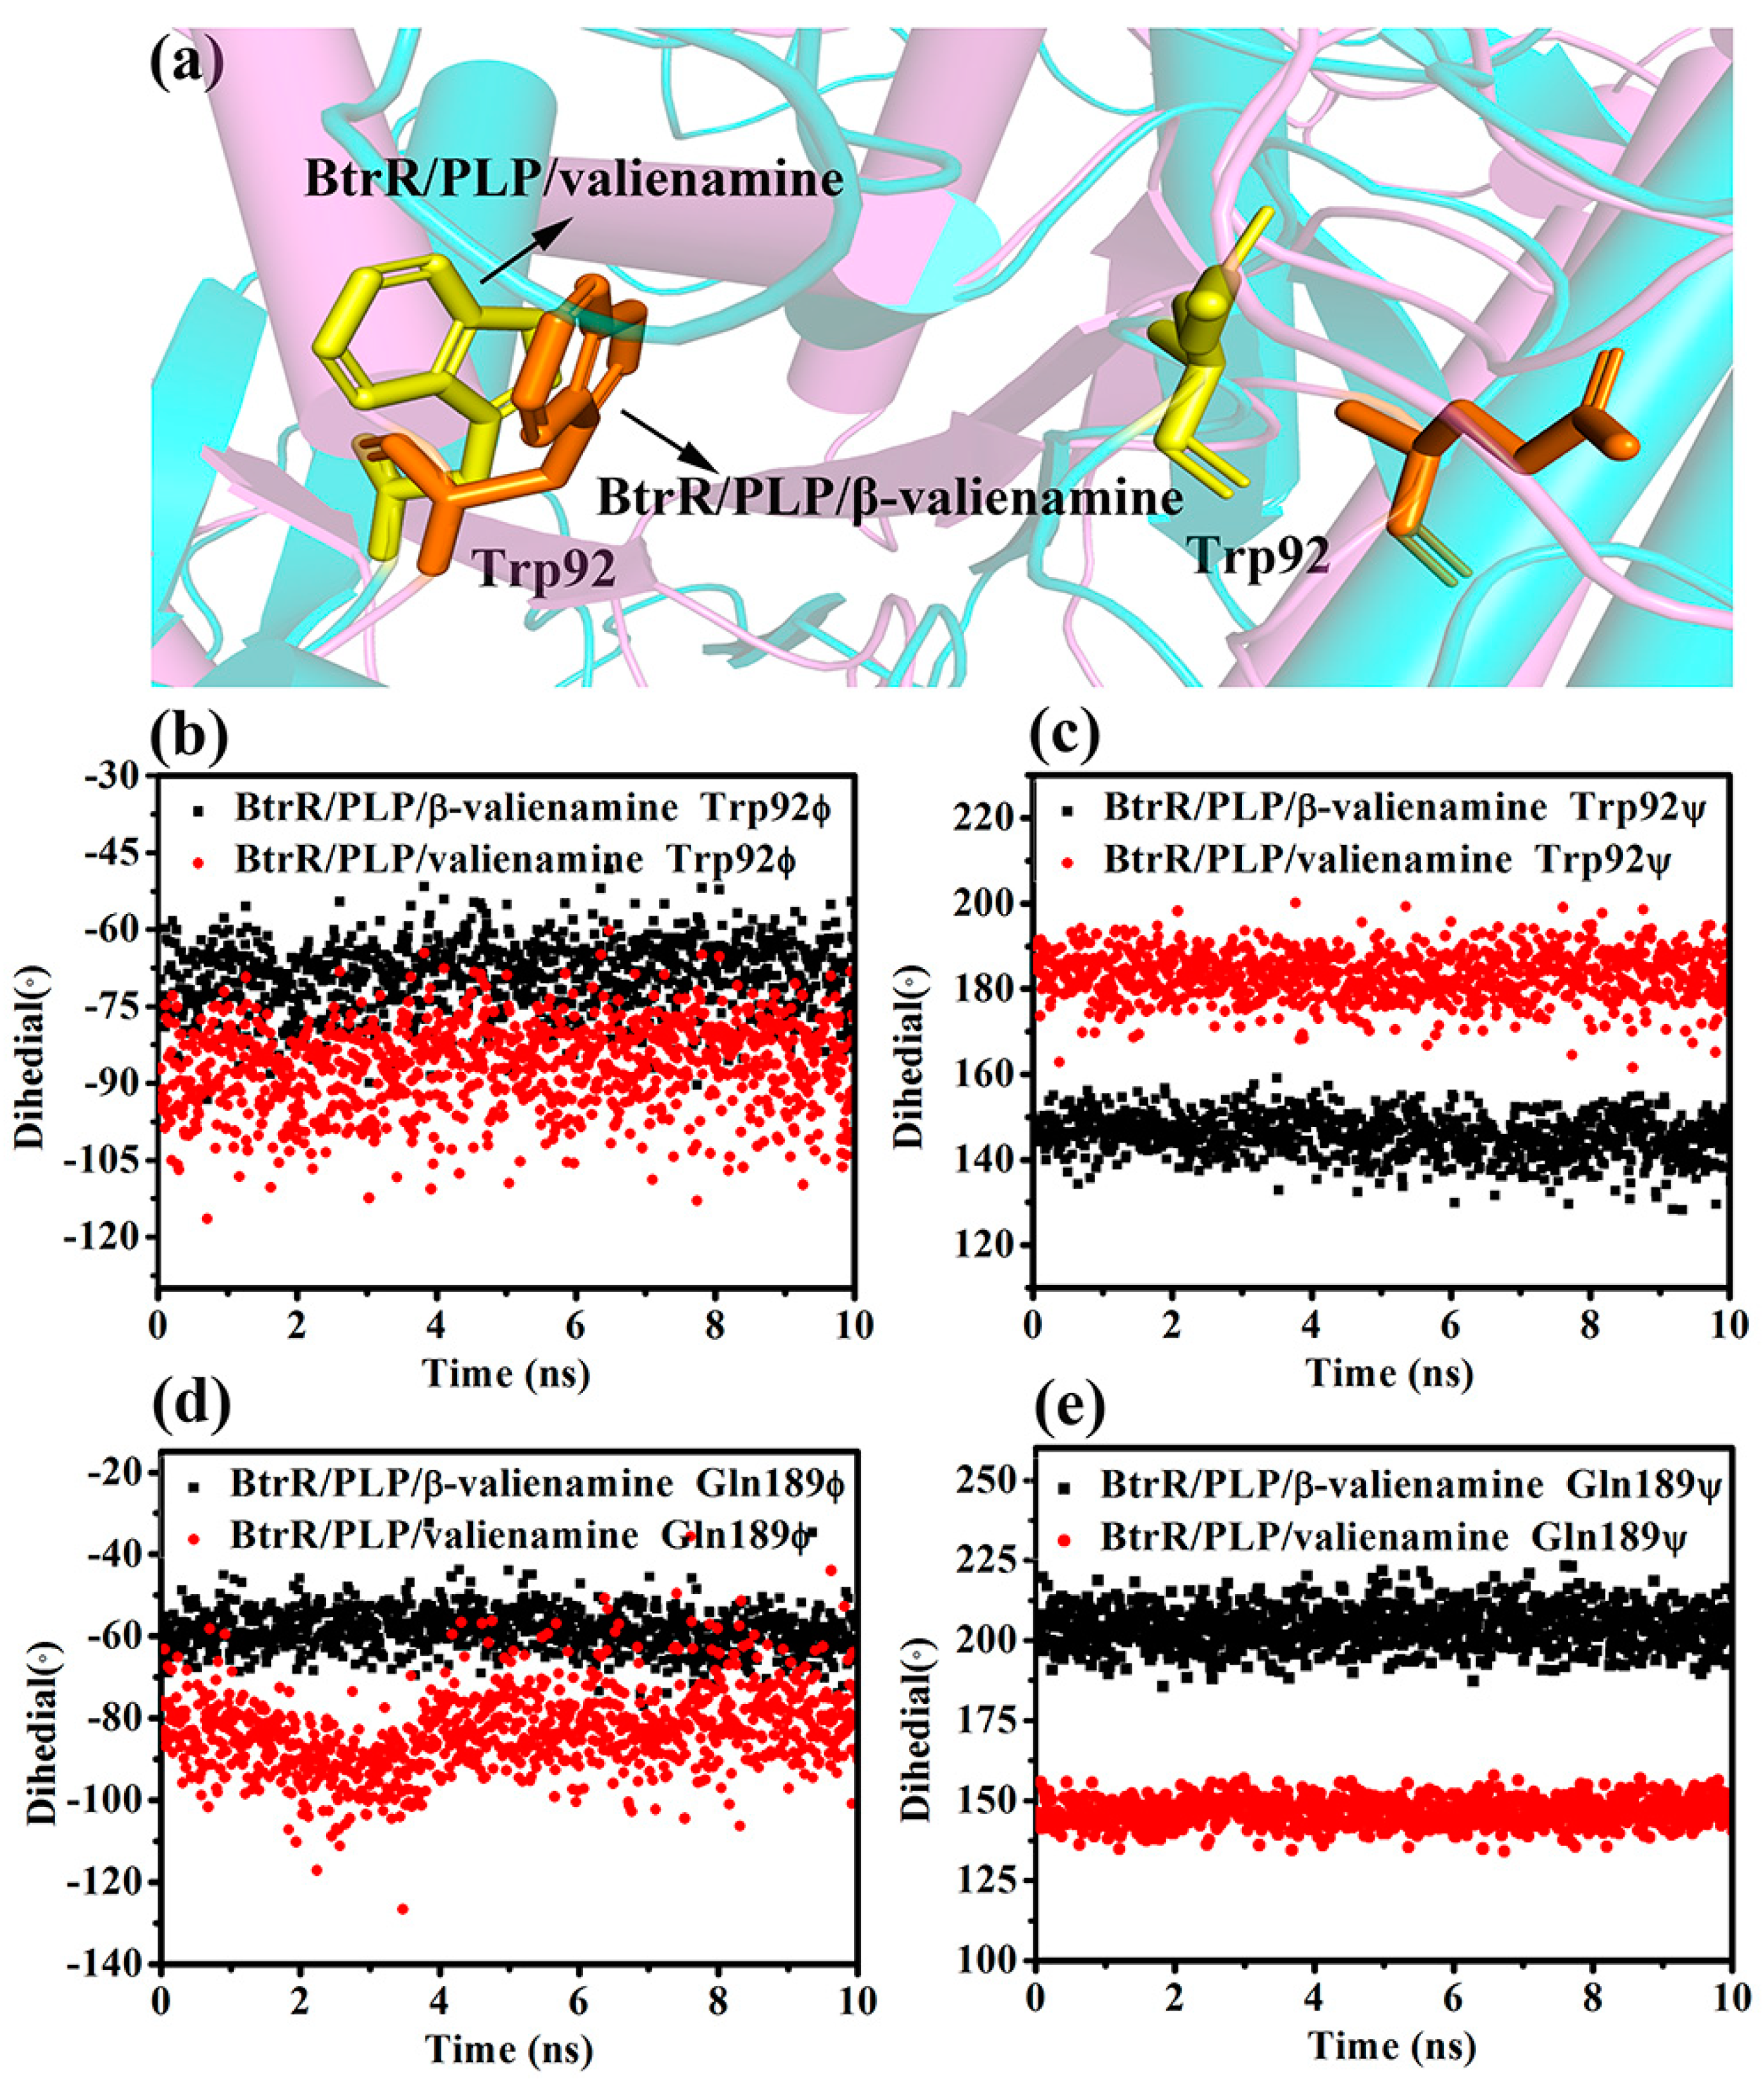
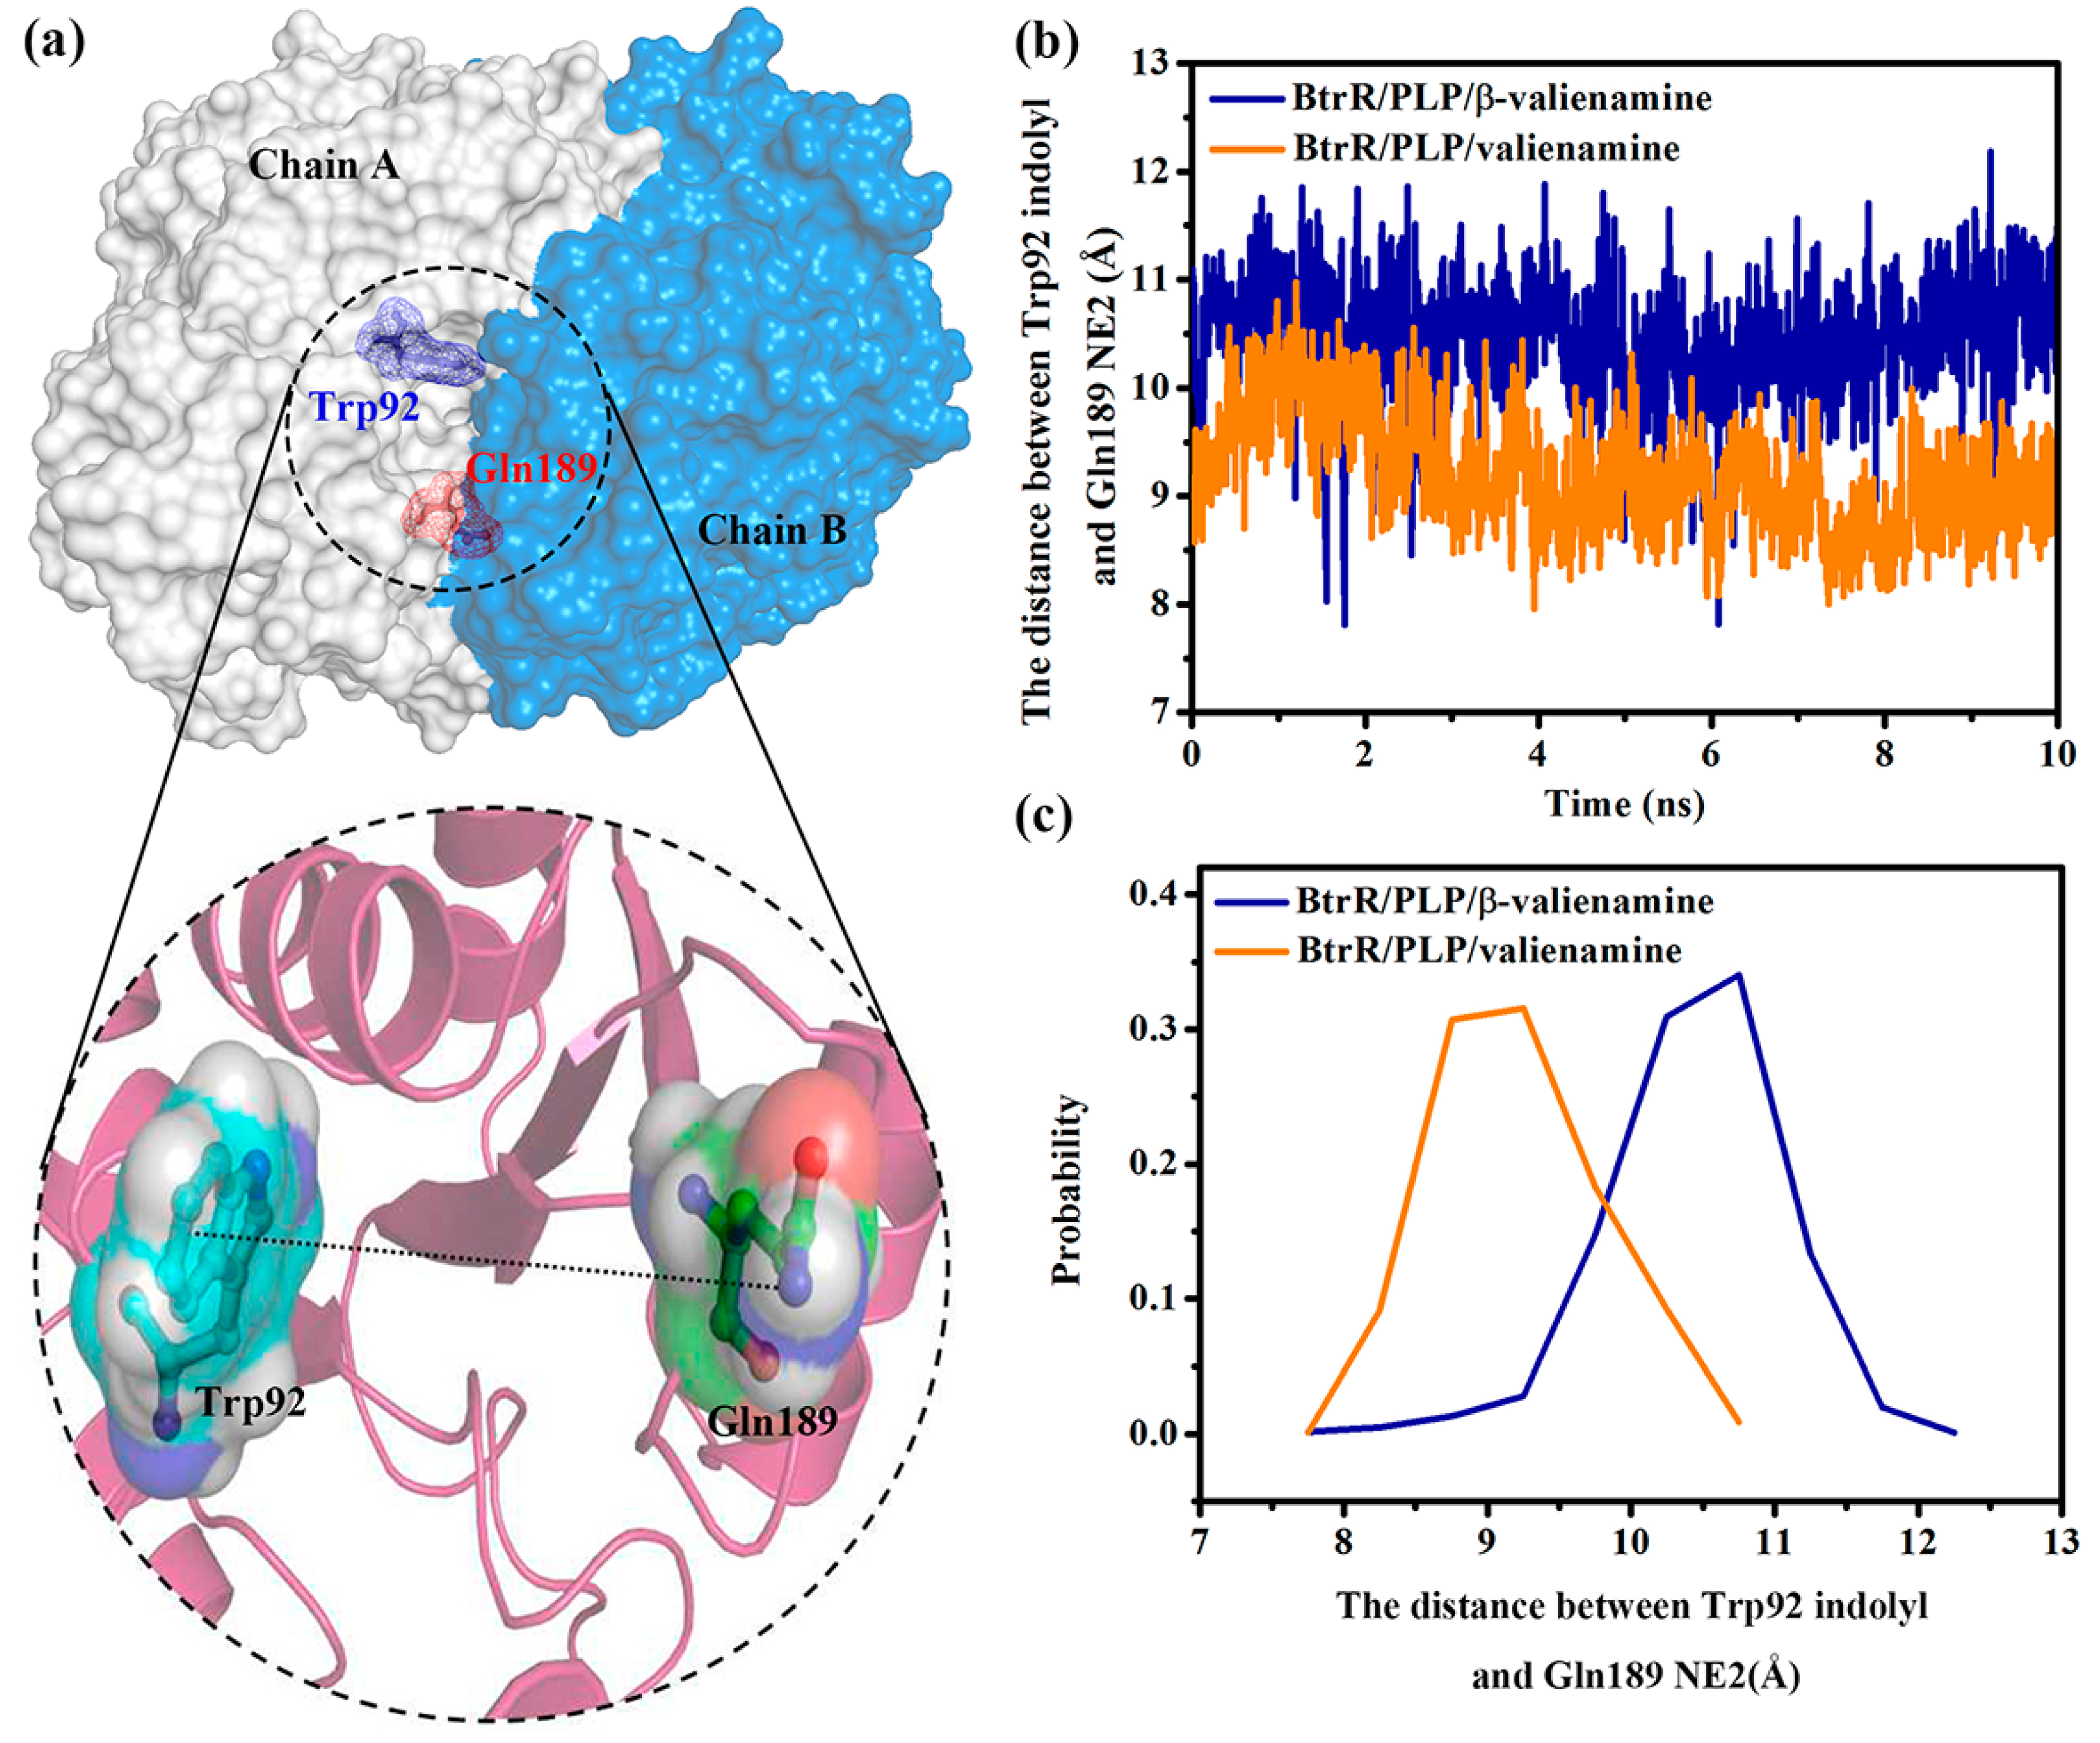
2.2. Structural Stability and Dominant Domain Motions of Two Complexes
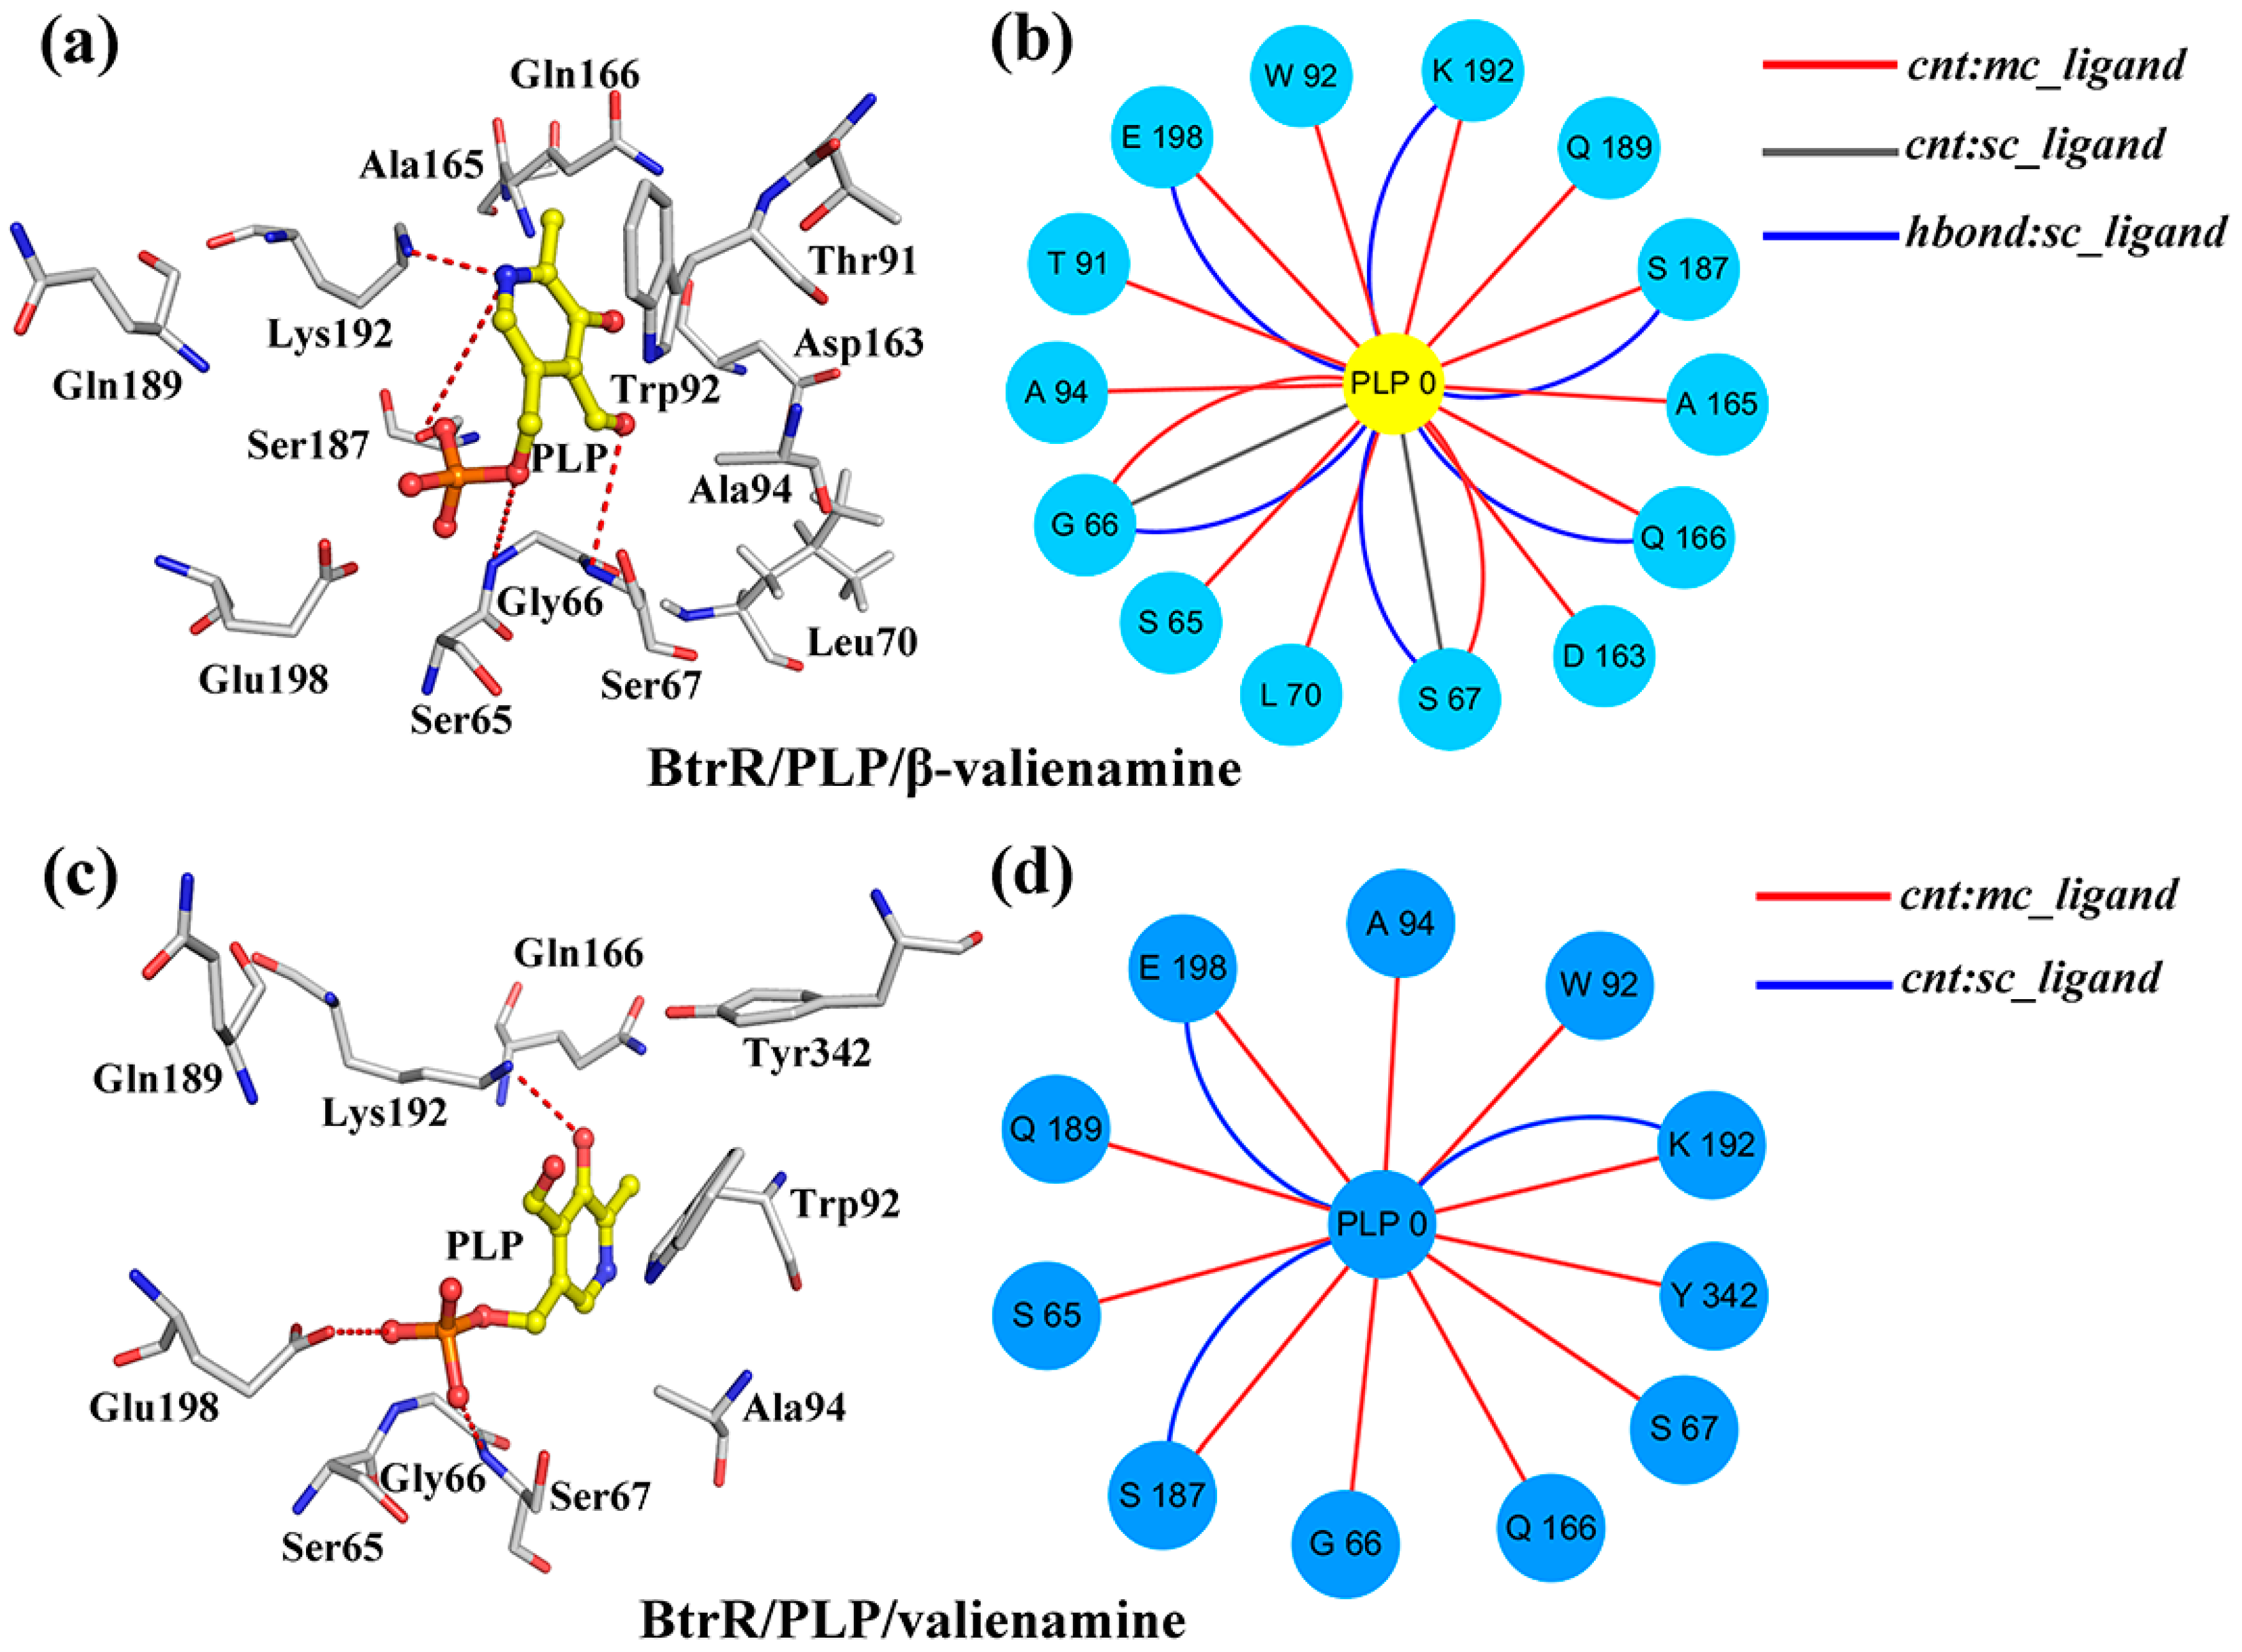
2.3. β-Valienamine and Valienamine Affect the PLP Binding to BtrR
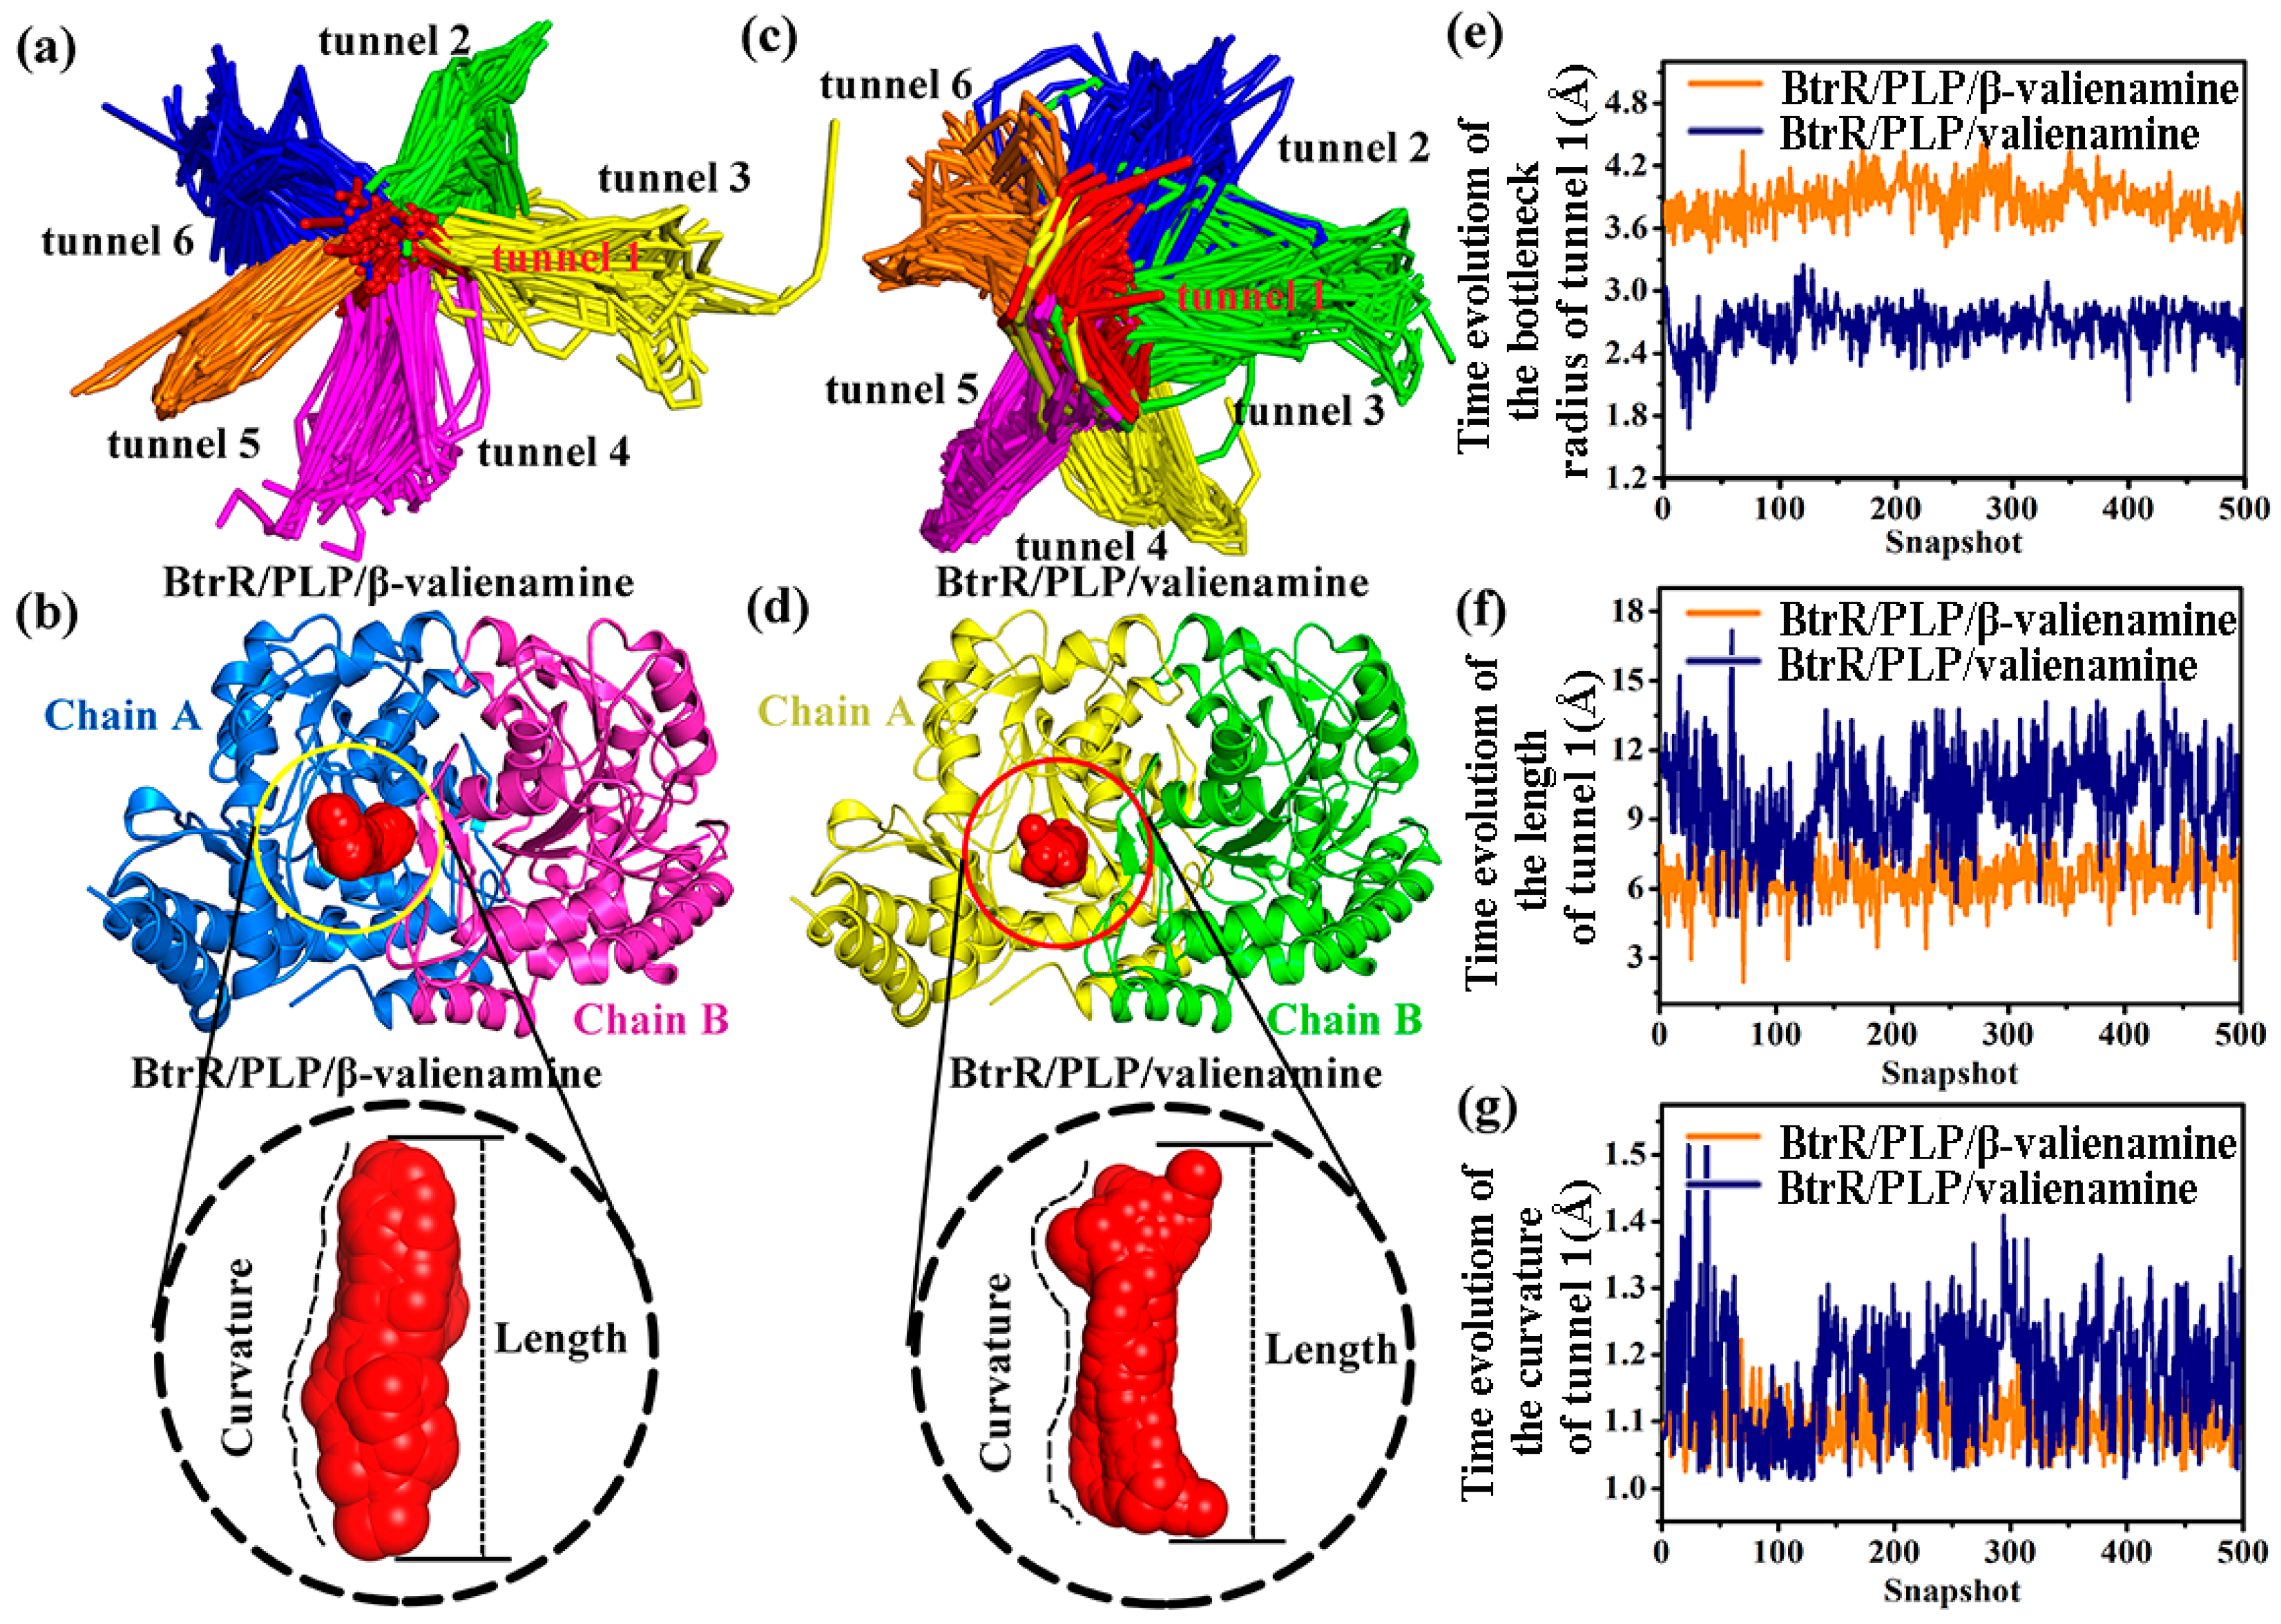
2.4. Compared to Valienamine, β-Valienamine Could Make the Tunnel of BtrR Wider and Straighter
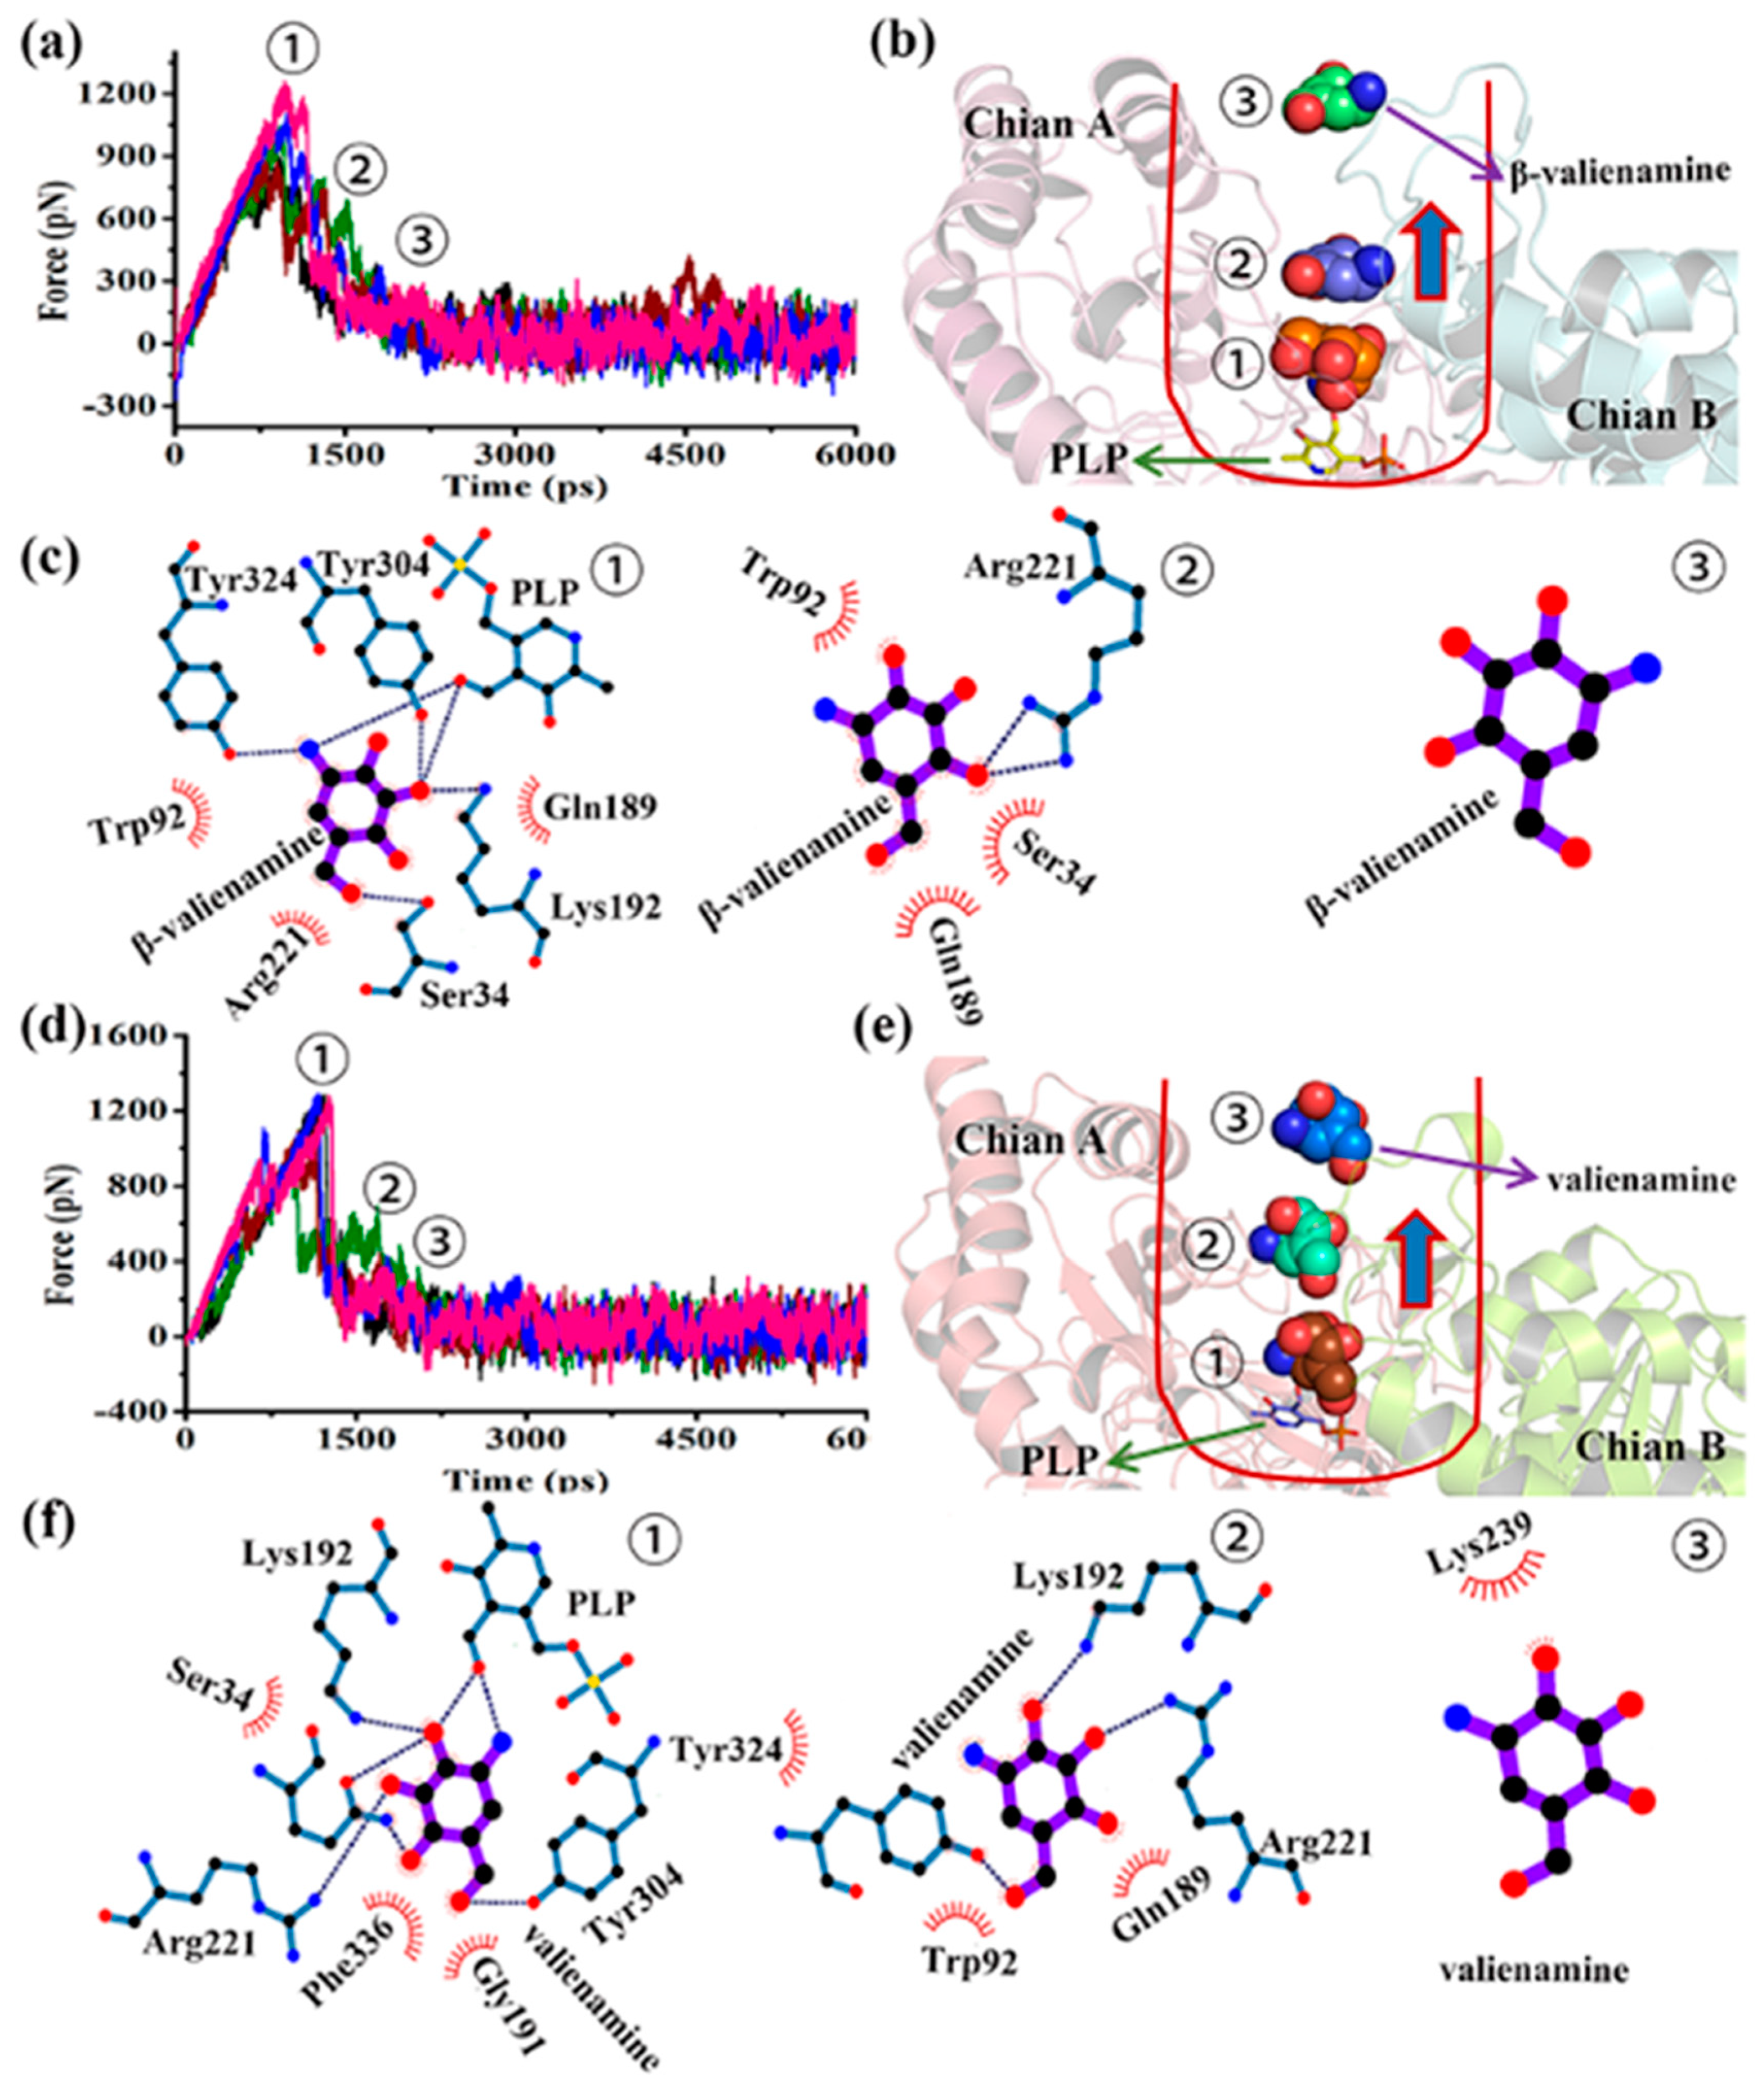
2.5. β-Valienamine Was Easier to Remove from BtrR
3. Materials and Methods
3.1. Preparation of the Protein Structures
3.2. Molecular Docking Studies
3.3. Molecular Dynamics Simulations
3.4. Pathways Identified with CAVER 3.0
3.5. Steered Molecular Dynamics Simulation and PMF Constraction
3.6. The Free Energy of Binding Calculation and Per-Residue Energy Decomposition Analysis
4. Conclusions
Supplementary Materials
Author Contributions
Acknowledgements
Conflicts of Interest
References
- Ogawa, S.; Kanto, M.; Suzuki, Y. Development and medical application of unsaturated carbaglycosylamine glycosidase inhibitors. Mini Rev. Med. Chem. 2007, 7, 679–691. [Google Scholar] [CrossRef] [PubMed]
- Suzuki, Y.; Ogawa, S.; Sakakibara, Y. Chaperone therapy for neuronopathic lysosomal diseases: Competitive inhibitors as chemical chaperones for enhancement of mutant enzyme activities. Perspect. Med. Chem. 2009, 3, 7. [Google Scholar] [CrossRef]
- Higaki, K.; Ninomiya, H.; Suzuki, Y.; Nanba, E. Candidate molecules for chemical chaperone therapy of gm1-gangliosidosis. Future Med. Chem. 2013, 5, 1551–1558. [Google Scholar] [CrossRef] [PubMed]
- Suzuki, Y. Chaperone therapy update: Fabry disease, g m1-gangliosidosis and gaucher disease. Brain Dev. 2013, 35, 515. [Google Scholar] [CrossRef] [PubMed]
- Luan, Z.; Li, L.; Ninomiya, H.; Ohno, K.; Ogawa, S.; Kubo, T.; Iida, M.; Suzuki, Y. The pharmacological chaperone effect of n-octyl-beta-valienamine on human mutant acid beta-glucosidases. Blood Cells Mol. Dis. 2010, 44, 48–54. [Google Scholar] [CrossRef] [PubMed]
- Matsuda, J.; Suzuki, O.; Oshima, A.; Yamamoto, Y.; Noguchi, A.; Takimoto, K.; Itoh, M.; Matsuzaki, Y.; Yasuda, Y.; Ogawa, S.; et al. Chemical chaperone therapy for brain pathology in g(m1)-gangliosidosis. Proc. Natl. Acad. Sci. USA 2003, 100, 15912–15917. [Google Scholar] [CrossRef]
- Ogawa, S.; Toyokuni, T.; Suami, T. Cheminform abstract: Synthesis of penta-n,o-acetyl-dl-valienamine and its related branched-chain unsaturated aminocyclitols and cyclitols. Cheminform 1980, 11, 713–716. [Google Scholar] [CrossRef]
- Ogawa, S.; Chida, N.; Suami, T. Synthetic studies on the validamycins. 5. Synthesis of dl-hydroxyvalidamine and dl-valienamine. Chem. Inf. 1983, 14, 1203–1207. [Google Scholar] [CrossRef]
- Ogawa, S.; Ashiura, M.; Uchida, C.; Watanabe, S.; Yamazaki, C.; Yamagishi, K.; Inokuchi, J.-I. Synthesis of potent β-d-glucocerebrosidase inhibitors: N-alkyl-β-valienamines. Bioorg. Med. Chem. Lett. 1996, 6, 929–932. [Google Scholar] [CrossRef]
- Ogawa, S.; Kobayashi, Y.; Kabayama, K.; Jimbo, M.; Inokuchi, J. Chemical modification of beta-glucocerebrosidase inhibitor n-octyl-beta-valienamine: Synthesis and biological evaluation of n-alkanoyl and n-alkyl derivatives. Bioorg. Med. Chem. 1998, 6, 1955–1962. [Google Scholar] [CrossRef]
- Cumpstey, I.; Gehrke, S.; Erfan, S.; Cribiu, R. Studies on the synthesis of valienamine and 1-epi-valienamine starting from d-glucose or l-sorbose. Carbohydr. Res. 2008, 343, 1675–1692. [Google Scholar] [CrossRef] [PubMed]
- Kuno, S.; Takahashi, A.; Ogawa, S. Concise syntheses of potent chaperone drug candidates, n-octyl-4-epi-β-valinenamine (noev) and its 6-deoxy derivative, from (+)-proto-quercitol. Carbohydr. Res. 2013, 368, 8–15. [Google Scholar] [CrossRef] [PubMed]
- Li, Q.R.; Kim, S.I.; Park, S.J.; Yang, H.R.; Baek, A.R.; Kim, I.S.; Jung, Y.H. Total synthesis of (+)-valienamine and (−)-1- epi -valienamine via a highly diastereoselective allylic amination of cyclic polybenzyl ether using chlorosulfonyl isocyanate. Tetrahedron 2013, 69, 10384–10390. [Google Scholar] [CrossRef]
- Cui, L.; Zhu, Y.; Guan, X.; Deng, Z.; Bai, L.; Feng, Y. De novo biosynthesis of β-valienamine in engineered streptomyces hygroscopicus 5008. ACS Synth. Biol. 2016, 5, 15–20. [Google Scholar] [CrossRef] [PubMed]
- Zachman-Brockmeyer, T.R.; Thoden, J.B.; Holden, H.M. The structure of rbmb from streptomyces ribosidificus, an aminotransferase involved in the biosynthesis of ribostamycin. Protein Sci. A Publ. Protein Soc. 2017, 26, 1886–1892. [Google Scholar] [CrossRef] [PubMed]
- Huang, F.; Li, Y.; Yu, J.; Spencer, J.B. Biosynthesis of aminoglycoside antibiotics: Cloning, expression and characterisation of an aminotransferase involved in the pathway to 2-deoxystreptamine. Chem. Commun. 2002, 23, 2860–2861. [Google Scholar] [CrossRef]
- Schneider, G.; Käck, H.; Lindqvist, Y. The manifold of vitamin b6 dependent enzymes. Structure 2000, 8, R1–R6. [Google Scholar] [CrossRef]
- Soda, K.; Yoshimura, T.; Esaki, N. Stereospecificity for the Hydrogen Transfer of Pyridoxal Enzyme Reactions. Chem. Rec. 2001, 1, 373–384. [Google Scholar] [CrossRef] [PubMed]
- Abazov, V.M.; Abbott, B.; Acharya, B.S.; Adams, M.; Adams, T.; Agnew, J.P.; Alexeev, G.D.; Alkhazov, G.; Alton, A.; Askew, A.; et al. Double parton interactions inγ+3jet andγ+b/cjet+2jet events in ppbar collisions ats=1.96 tev. Phys. Rev. D 2014, 89, 072006. [Google Scholar] [CrossRef]
- Trott, O.; Olson, A.J. Autodock vina: Improving the speed and accuracy of docking with a new scoring function, efficient optimization, and multithreading. J. Comput. Chem. 2010, 31, 455–461. [Google Scholar] [CrossRef] [PubMed]
- Grant, B.J.; Rodrigues, A.P.C.; Elsawy, K.M.; Mccammon, J.A.; Caves, L.S.D. Bio3d: An R package for the comparative analysis of protein structures. Bioinformatics 2006, 22, 2695–2696. [Google Scholar] [CrossRef] [PubMed]
- Hossein, M.; Harish, V. Insulin mimetic peptide S371 folds into a helical structure. J. Comput. Chem. 2017, 38, 1158–1166. [Google Scholar]
- Gordon, J.C.; Myers, J.B.; Folta, T.; Shoja, V.; Heath, L.S.; Onufriev, A. H++: A server for estimating pkas and adding missing hydrogens to macromolecules. Nucleic Acids Res. 2005, 33, 368–371. [Google Scholar] [CrossRef] [PubMed]
- Mekha, M.; Priyanka, J.; Ravisankar, V.; Puthiyaveetil, A.N. Molecular docking studies of phytochemicals from Phyllanthus niruri aganist Hepatitis B DNA. Bioinformation. 2015, 11, 426–431. [Google Scholar]
- Ayers, M. Chemspider: The free chemical database. Ref. Rev. 2012, 26, 45–46. [Google Scholar]
- Phillips, J.C.; Braun, R.; Wang, W.; Gumbart, J.; Tajkhorshid, E.; Villa, E.; Chipot, C.; Skeel, R.D.; Kalé, L.; Schulten, K. Scalable molecular dynamics with namd. J. Comput. Chem. 2005, 26, 1781–1802. [Google Scholar] [CrossRef] [PubMed]
- Best, R.B.; Zhu, X.; Shim, J.; Lopes, P.E.M.; Mittal, J.; Feig, M.; Jr, M.K. Optimization of the additive charmm all-atom protein force field targeting improved sampling of the backbone ϕ, ψ and side-chain χ1 and χ2 dihedral angles. J. Chem. Theory Comput. 2012, 8, 3257–3273. [Google Scholar] [CrossRef]
- Mackerell, A.D., Jr.; Feig, M.; Brooks, C.L., III. Extending the treatment of backbone energetics in protein force fields: Limitations of gas-phase quantum mechanics in reproducing protein conformational distributions in molecular dynamics simulations. J. Comput. Chem. 2010, 25, 1400–1415. [Google Scholar] [CrossRef]
- Harrach, M.F.; Drossel, B. Structure and dynamics of tip3p, tip4p, and tip5p water near smooth and atomistic walls of different hydroaffinity. J. Chem. Phys. 2014, 140, 174501. [Google Scholar] [CrossRef]
- Darden, T.; York, D.; Pedersen, L. Particle mesh ewald: An n⋅log(n) method for ewald sums in large systems. J. Chem. Phys. 1998, 98, 10089–10092. [Google Scholar] [CrossRef]
- Schlick, T. Molecular Modeling and Simulation; Springer: Berlin/Heidelberg, Germany, 2002; p. 355. [Google Scholar]
- Chovancova, E.; Pavelka, A.; Benes, P.; Strnad, O.; Brezovsky, J.; Kozlikova, B.; Gora, A.; Sustr, V.; Klvana, M.; Medek, P. Caver 3.0: A tool for the analysis of transport pathways in dynamic protein structures. PLoS Comput. Biol. 2012, 8, e1002708. [Google Scholar] [CrossRef] [PubMed]
- Evans, D.J.; Holian, B.L. The nose–hoover thermostat. J. Chem. Phys. 1985, 83, 4069–4074. [Google Scholar] [CrossRef]
- Parrinello, M.; Rahman, A. Polymorphic transitions in single crystals: A new molecular dynamics method. J. Appl. Phys. 1998, 52, 7182–7190. [Google Scholar] [CrossRef]
- Jarzynski, C. A nonequilibrium equality for free energy differences. Phys. Rev. Lett. 1997, 78, 2690–2693. [Google Scholar] [CrossRef]
- Justin, A.L.; David, R.B. Assessing the stability of Alzheimer’s amyloid protofibrils using molecular dynamics. J. Phys. Chem. B 2010, 114, 1652–1660. [Google Scholar]
- Hou, T.; Wang, J.; Li, Y.; Wang, W. Assessing the performance of the mm/pbsa and mm/gbsa methods: Ii. The accuracy of ranking poses generated from docking. J. Comput. Chem. 2011, 32, 866. [Google Scholar] [CrossRef] [PubMed]
- Hou, T.; Li, N.; Li, Y.; Wang, W. Characterization of domain–peptide interaction interface: Prediction of sh3 domain-mediated protein–protein interaction network in yeast by generic structure-based models. J. Proteome Res. 2012, 11, 2982–2995. [Google Scholar] [CrossRef]
- Xu, L.; Sun, H.; Li, Y.; Wang, J.; Hou, T. Assessing the performance of mm/pbsa and mm/gbsa methods. 3. The impact of force fields and ligand charge models. J. Phys. Chem. B 2013, 117, 8408–8421. [Google Scholar] [CrossRef]
- Sun, H.; Li, Y.; Tian, S.; Xu, L.; Hou, T. Assessing the performance of mm/pbsa and mm/gbsa methods. 4. Accuracies of mm/pbsa and mm/gbsa methodologies evaluated by various simulation protocols using pdbbind data set. Phys. Chem. Chem. Phys. 2014, 16, 16719–16729. [Google Scholar] [CrossRef]
- Sun, H.; Li, Y.; Shen, M.; Tian, S.; Xu, L.; Pan, P.; Guan, Y.; Hou, T. Assessing the performance of mm/pbsa and mm/gbsa methods. 5. Improved docking performance using high solute dielectric constant mm/gbsa and mm/pbsa rescoring. Phys. Chem. Chem. Phys. 2014, 16, 22035–22045. [Google Scholar] [CrossRef]


| Energy Components (eV) | β-Valienamine | Valienamine |
|---|---|---|
| Ionization potential (IP) | 6.420 | 6.059 |
| Electron affinity (EA) | 0.386 | 0.158 |
| Energy gap (Egap) | 5.901 | 6.034 |
| Hydrogen Bonds | BtrR/PLP/β-Valienamine | BtrR/PLP/Valienamine | |
|---|---|---|---|
| Donor | Accepter | ||
| Gly66:N (Chain A) | PLP:O5 (Chain A) | 100.00% | 100.00% |
| PLP:O5 (Chain A) | Glu198:OE1 (Chain A) | 100.00% | 68.54% |
| PLP:O3 (Chain A) | Gln166:OE1 (Chain A) | 89.62% | 0 |
| Ser187:OG (Chain A) | PLP:O5 (Chain A) | 89.11% | 58.05% |
| Ser187:OG (Chain A) | PLP:O2 (Chain A) | 87.59% | 66.85% |
| Ser67:N (Chain A) | PLP:O4 (Chain A) | 85.32% | 0 |
| Ser65:O (Chain A) | PLP:O4 (Chain A) | 69.37% | 26.22% |
| PLP:C15 (Chain A) | Asp163:OD1 (Chain A) | 68.99% | 20.60% |
| PLP:O3 (Chain A) | Gln166:CD (Chain A) | 65.95% | 0 |
| PLP:O5 (Chain A) | Glu198:CD (Chain A) | 88.01% | 52.78% |
| Ser67:OG (Chain A) | PLP:C11 (Chain A) | 48.10% | 36.33% |
| PLP:O5 (Chain A) | Gly199:O (Chain A) | 46.20% | 0 |
| PLP:C15 (Chain A) | Asp163:OD2 (Chain A) | 44.18% | 31.27% |
| Gly66:C (Chain A) | PLP:O2 (Chain A) | 43.16% | 0 |
| Gly66:C (Chain A) | PLP:O5 (Chain A) | 41.39% | 37.45% |
| Gln189:CG (Chain A) | PLP:O7 (Chain A) | 45.13% | 27.34% |
| Ser67:N (Chain A) | PLP:O2 (Chain A) | 45.88% | 26.33% |
| Rank | Pathway Cluster | No. of Snapshots | Average Bottleneck Radius | Maximum Bottleneck Radius | Average Throughput |
|---|---|---|---|---|---|
| BtrR/PLP/β-valienamine | |||||
| 1 | Tunnel 1 | 500 | 3.826 | 4.41 | 0.9399 |
| 2 | Tunnel 2 | 474 | 2.450 | 3.45 | 0.8375 |
| 3 | Tunnel 3 | 350 | 2.235 | 3.13 | 0.8604 |
| 4 | Tunnel 4 | 328 | 2.254 | 3.43 | 0.8205 |
| 5 | Tunnel 5 | 202 | 1.481 | 2.94 | 0.7030 |
| 6 | Tunnel 6 | 98 | 1.194 | 1.94 | 0.5484 |
| BtrR/PLP/valienamine | |||||
| 1 | Tunnel 1 | 500 | 2.658 | 3.25 | 0.8967 |
| 2 | Tunnel 2 | 432 | 2.134 | 2.99 | 0.8243 |
| 3 | Tunnel 3 | 335 | 2.078 | 2.84 | 0.7800 |
| 4 | Tunnel 4 | 301 | 1.478 | 2.13 | 0.7251 |
| 5 | Tunnel 5 | 211 | 1.366 | 1.90 | 0.5374 |
| 6 | Tunnel 6 | 108 | 0.927 | 1.03 | 0.6229 |
© 2019 by the authors. Licensee MDPI, Basel, Switzerland. This article is an open access article distributed under the terms and conditions of the Creative Commons Attribution (CC BY) license (http://creativecommons.org/licenses/by/4.0/).
Share and Cite
Liu, Y.; Wan, Y.; Zhu, J.; Li, M.; Yu, Z.; Han, J.; Zhang, Z.; Han, W. Exploration of Catalytic Selectivity for Aminotransferase (BtrR) Based on Multiple Molecular Dynamics Simulations. Int. J. Mol. Sci. 2019, 20, 1188. https://doi.org/10.3390/ijms20051188
Liu Y, Wan Y, Zhu J, Li M, Yu Z, Han J, Zhang Z, Han W. Exploration of Catalytic Selectivity for Aminotransferase (BtrR) Based on Multiple Molecular Dynamics Simulations. International Journal of Molecular Sciences. 2019; 20(5):1188. https://doi.org/10.3390/ijms20051188
Chicago/Turabian StyleLiu, Ye, Youzhong Wan, Jingxuan Zhu, Muxin Li, Zhengfei Yu, Jiarui Han, Zuoming Zhang, and Weiwei Han. 2019. "Exploration of Catalytic Selectivity for Aminotransferase (BtrR) Based on Multiple Molecular Dynamics Simulations" International Journal of Molecular Sciences 20, no. 5: 1188. https://doi.org/10.3390/ijms20051188