Article

Comparative Proteomic Analysis of Wheat Carrying Pm40 Response to Blumeria graminis f. sp. tritici Using Two-Dimensional Electrophoresis

1
College of Agronomy & Key Laboratory for Major Crop Diseases, Sichuan Agricultural University, Chengdu 611130, China
2
Department of Plant Pathology, The Ohio State University, Columbus, OH 43202, USA
3
Institute of Ecological Agriculture, Sichuan Agricultural University, Chengdu 611130, China
*
Author to whom correspondence should be addressed.
Int. J. Mol. Sci. 2019, 20(4), 933; https://doi.org/10.3390/ijms20040933
Submission received: 16 December 2018 / Revised: 15 February 2019 / Accepted: 16 February 2019 / Published: 21 February 2019
(This article belongs to the Special Issue Molecular Advances in Wheat and Barley)

Abstract

:
Wheat powdery mildew caused by Blumeria graminis f. sp. tritici (Bgt) is considered a major wheat leaf disease in the main wheat producing regions of the world. Although many resistant wheat cultivars to this disease have been developed, little is known about their resistance mechanisms. Pm40 is a broad, effective resistance gene against powdery mildew in wheat line L699. The aim of this study was to investigate the resistance proteins after Bgt inoculation in wheat lines L699, Neimai836, and Chuannong26. Neimai836 with Pm21 was used as the resistant control, and Chuannong26 without any effective Pm genes was the susceptible control. Proteins were extracted from wheat leaves sampled 2, 4, 8, 12, and 24 h after Bgt inoculation, separated by two-dimensional electrophoresis, and stained with Coomassie brilliant blue G-250. The results showed that different proteins were upregulated and downregulated in three wheat cultivars at different time points. For the wheat cultivar L699, a total of 62 proteins were upregulated and 71 proteins were downregulated after Bgt inoculation. Among these, 46 upregulated proteins were identified by mass spectrometry analysis using the NCBI nr database of Triticum. The identified proteins were predicted to be associated with the defense response, photosynthesis, signal transduction, carbohydrate metabolism, energy pathway, protein turnover, and cell structure functions. It is inferred that the proteins are not only involved in defense response, but also other physiological and cellular processes to confer wheat resistance against Bgt. Therefore, the resistance products potentially mediate the immune response and coordinate other physiological and cellular processes during the resistance response to Bgt. The lipoxygenase, glucan exohydrolase, glucose adenylyltransferasesmall, phosphoribulokinase, and phosphoglucomutase are first reported to be involved in the interactions of wheat-Bgt at early stage. The further study of these proteins will deepen our understanding of their detailed functions and potentially develop more efficient disease control strategies.

1. Introduction

Wheat powdery mildew caused by the obligate fungus Blumeria graminis f. sp. tritici (Bgt) is a major wheat leaf disease in the main wheat producing regions of world, leading to significant yield loss each year [1]. Agricultural and chemical methods are widely used to combat the disease. Wheat powdery mildew is an airborne disease and the chemical control methods for Bgt seriously pollute environments. Therefore, planting resistant cultivars is the most economical, most effective, and safest method to control wheat powdery mildew [2]. To date, approximately 90 formally designated powdery mildew resistance genes (Pm genes) are catalogued at 58 loci (Pm1Pm62, Pm18 = Pm1c, Pm22 = Pm1e, Pm23 = Pm4c, Pm31 = Pm21) with the loci of Pm1, Pm3, Pm4, Pm5, and Pm24 having 5, 17, 4, 5, and 2 alleles, respectively [3,4,5,6,7,8,9,10,11,12,13]. However, resistance genes often become ineffective due to the enrichment and variation of virulent races, particularly when a single resistance gene is used in large areas for long periods of time. Therefore, it is very important to identify effective resistance genes and develop multiple resistance cultivars in wheat breeding [14].
The resistant mechanisms of wheat cultivars against Bgt are not well-known. Bread wheat (Triticum aestivum L.) is a hexaploid (2n = 42; AABBDD) with a 17-gigabase genome that contains 124 201 genes [15]. Due to this complexity, cloning wheat genes by the standard map-based cloning strategy remains challenging. Although many powdery mildew resistance genes were identified and mapped in wheat, to date, only five genes, Pm2, Pm3, Pm8, Pm21, and Pm60 have been cloned [9,16,17,18,19,20]. The resistance gene Pm40 was transferred from Elytrigia intermedium into wheat line GRY19 and mapped on chromosome arm 7BS [21]. Pm40 is flanked by Xwmc335 and BF291338 at genetic distances of 0.58 cM and 0.26 cM, respectively, in deletion bin C-7BS-1-0.27 [22]. Wheat line L699, which is the high generation of wheat line GRY19, carries the resistance gene Pm40 and confers resistance to all available isolates of Bgt in China [23].
Proteins are not only the final executant of life functions but also the key to understanding physiological, pathological, and pharmacological functions of plants [24]. Therefore, it is difficult to thoroughly explain the powdery mildew resistance mechanism using genomic and transcriptomic methods. Proteomic approaches have been extensively applied in plant pathology research [25,26]. However, only a few studies examined the changes of plant proteome in response to Bgt. Wheat cultivars Bainong/W2132 (Pm21), JD8/JD8-Pm30, N8038 (PmG25), N9134 (PmAS846), and Xinong979 (without effective Pm genes) were used to analyze the effect of Bgt on wheat protein expression. These studies showed that most of the upregulated proteins were involved in stress responses and primary metabolic pathways [24,27,28,29,30]. However, there is no such study investigating the differences of protein expressions in the period before Bgt haustoria formation, which is very critical for us to better understand the interactions of this pathogen with different wheat cultivars at early stage. To understand the molecular recognition of wheat-Bgt during the contact period and penetration period, we identified a set of proteins in wheat inoculated with Bgt using two-dimensional electrophoresis (2-DE). The possible roles of the identified proteins in the defense response at early interaction stage were discussed according to their functional implications. This study deepens and extends our knowledge on the interactions of wheat with Bgt and allows us to further understand the wheat immune systems against Bgt. All these will facilitate the development of more efficient strategies to control this devastating pathogen for enhancing wheat production, which can also potentially provide insights for the control of different plant diseases caused by diverse powdery mildew pathogens.

2. Results

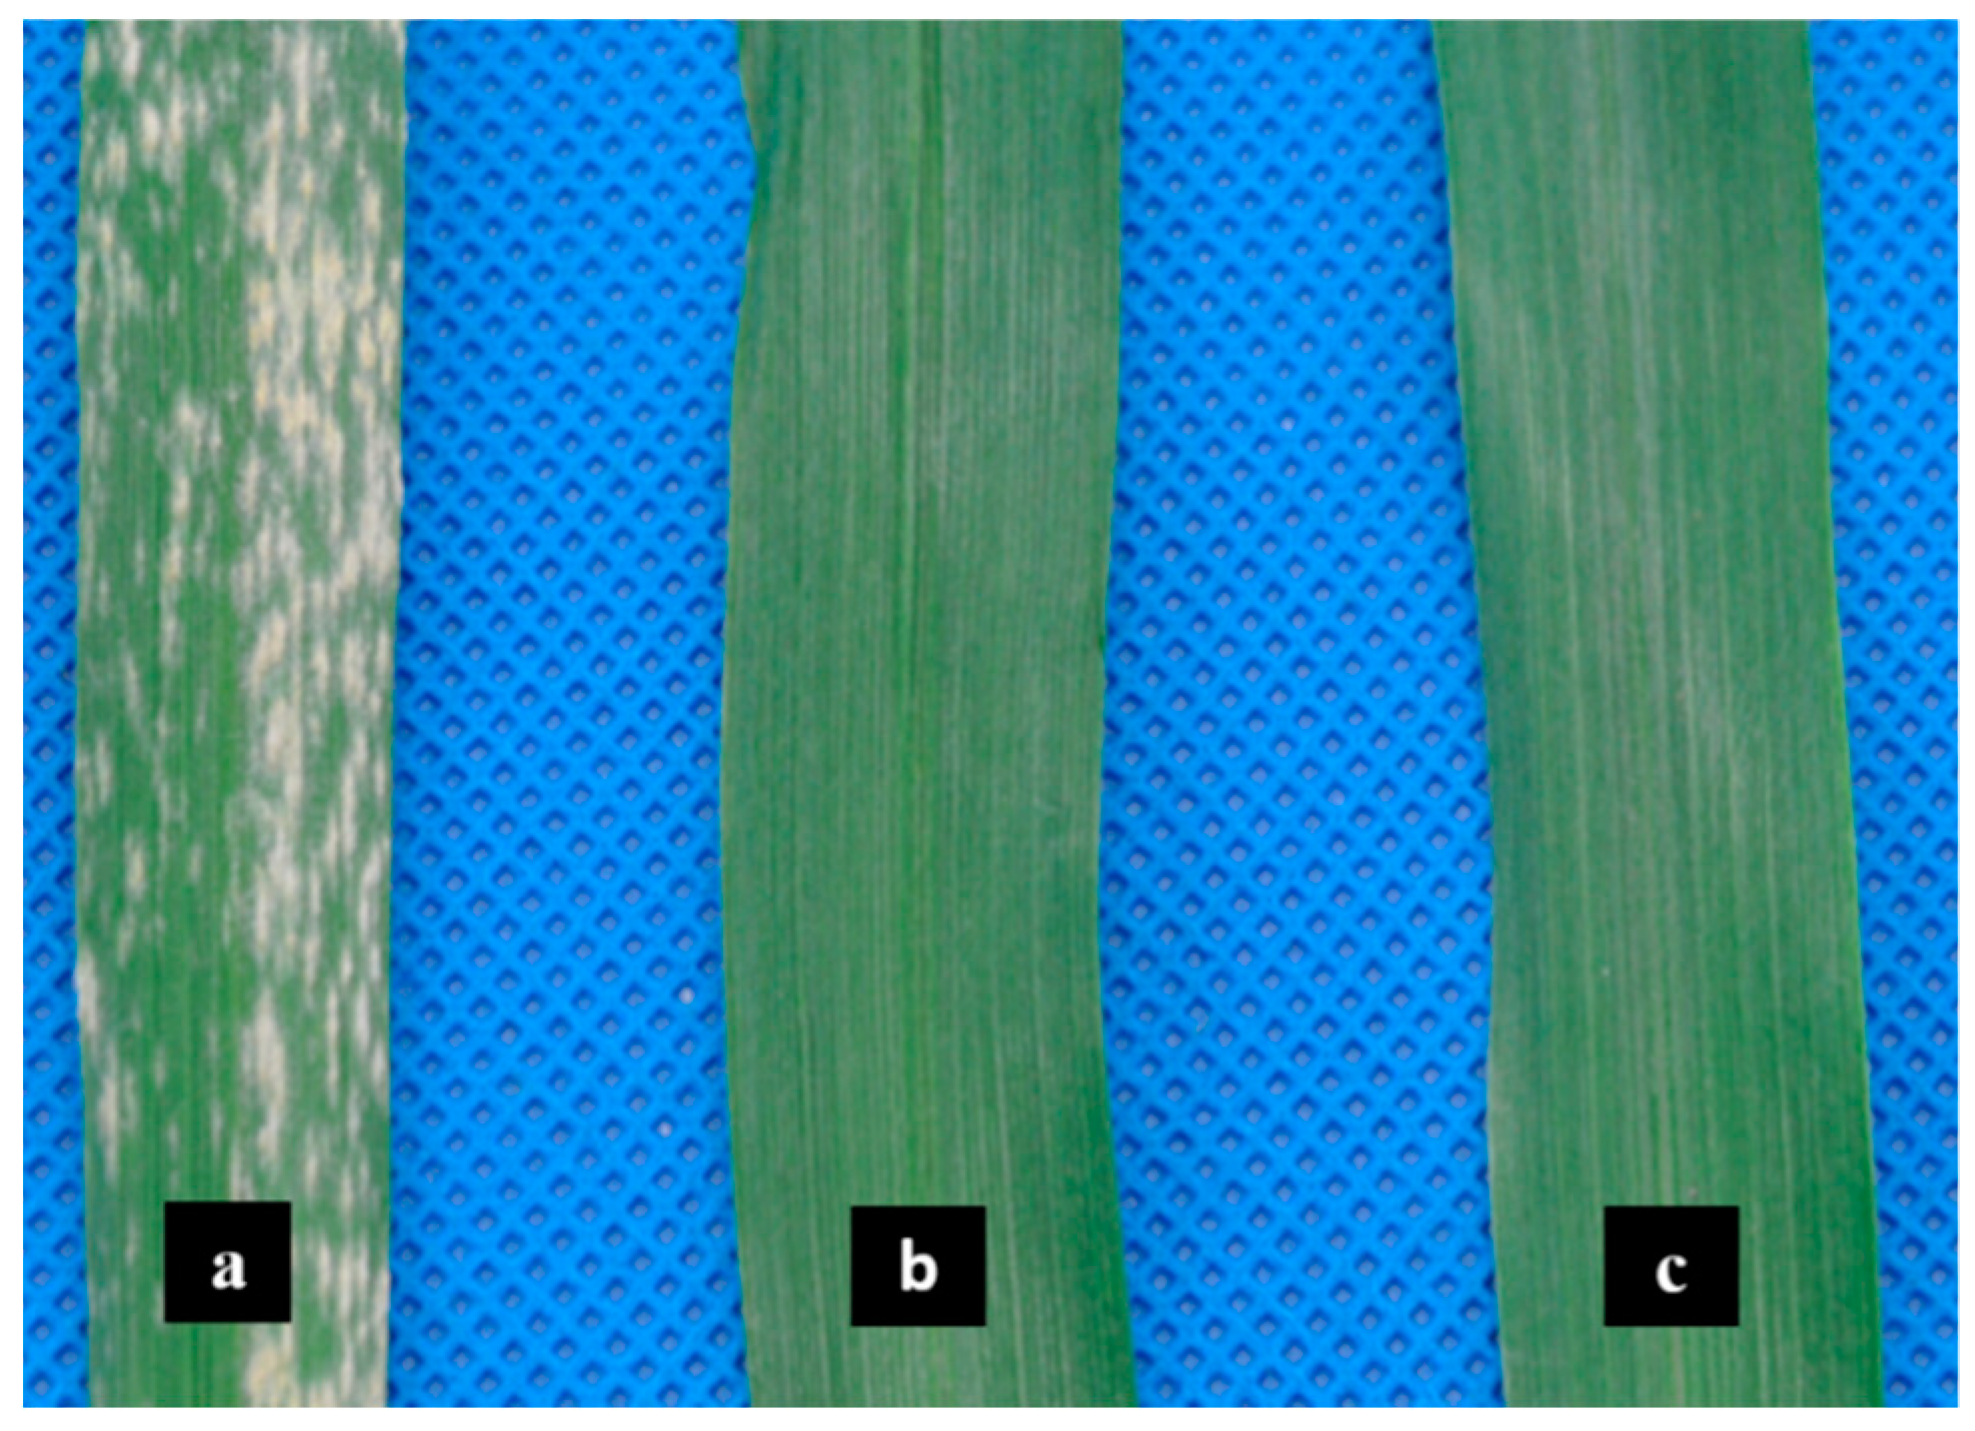
2.1. Phenotypic Differences of Leaves Affected by Bgt

The bioassay revealed differences in resistance to Bgt among L699, Chuannong26 and Neimai836 (Figure 1). The susceptible cultivar Chuannong26 was covered by a high number of sori and had the white powdery appearance due to the abundant conidia and conidiophores production on the leaf surface after 6 days of Bgt infection, with the infection type (IT) = 9 (Figure 1a). Meanwhile, the resistant wheat lines L699 and Neimai836 were observed to be healthy without any epidermal cell necrosis, chlorotic patches, and powdery appearance on the leaf surface, with the IT = 0 (L699: Figure 1b, Neimai836: Figure 1c) [23].

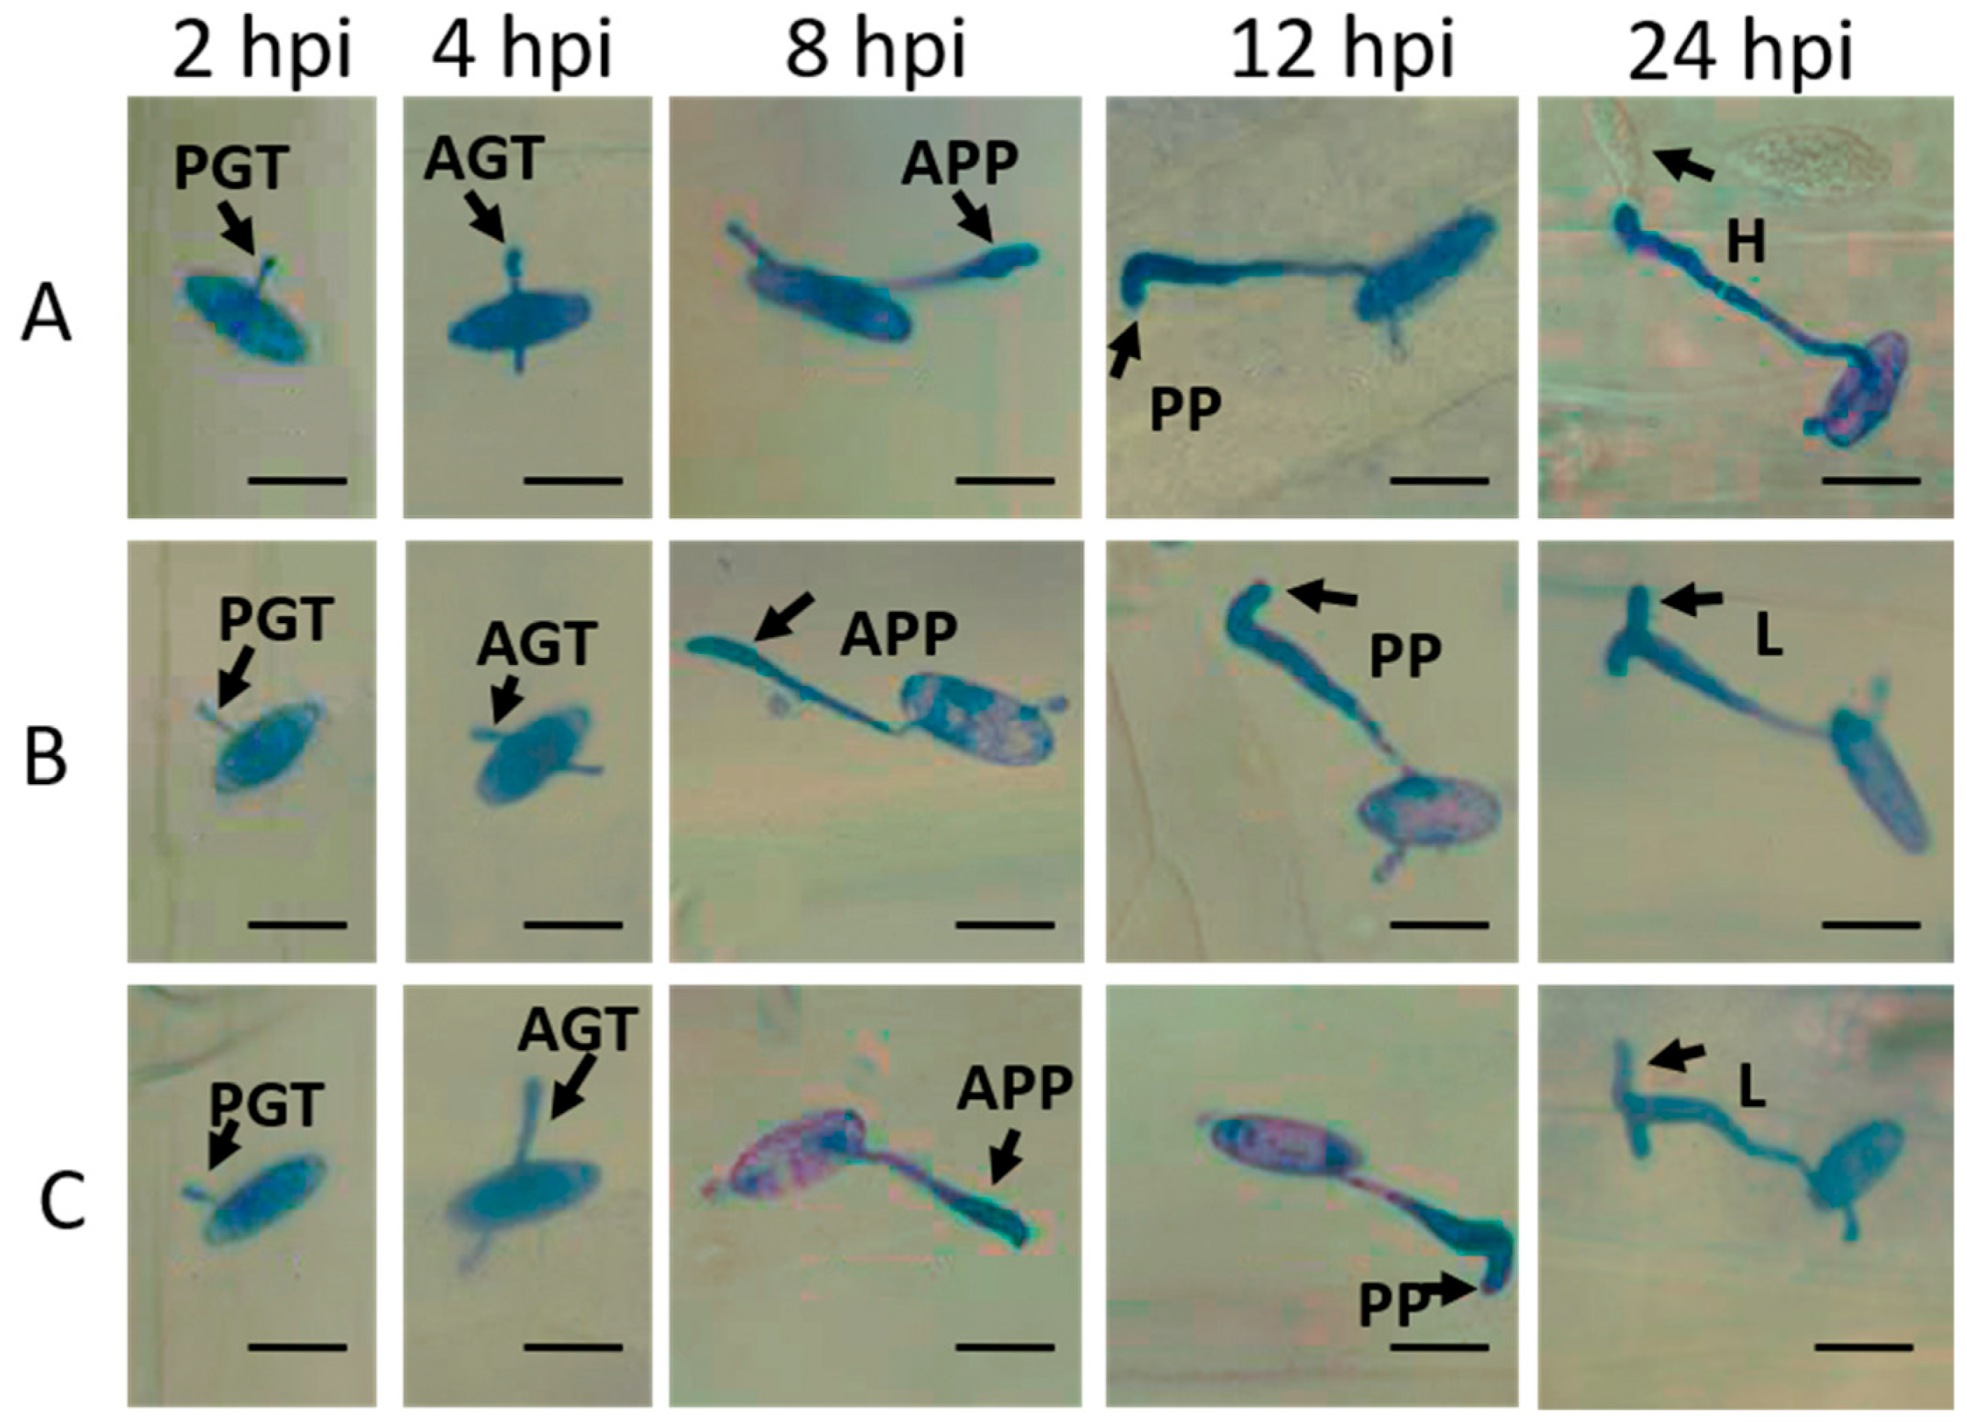
2.2. Estimation of Wheat-Bgt Interactions

To examine the development of Bgt and immune responses of wheat at 2, 4, 8, 12, and 24 h post-inoculation (hpi), the cytological observations of wheat samples were carried out. Bgt conidia successively formed primary germ tubes, appressorium germ tubes, appressoria, penetration pegs, and haustoria at 2, 4, 8, 12, and 24 hpi in susceptible wheat cultivar Chuannong26. However, in resistant wheat cultivars L699 and Neimai836, only a small number of conidia successfully penetrated the epidermal cells at 24 hpi, and the hypersensitive reaction (HR) and formation of papilla (PA) effectively suppressed the development of haustoria and hyphae [31]. In addition, the appressoria of some conidia sprouted another lobe and stopped growing because of the lack of nutrition at 24 hpi (Figure 2).

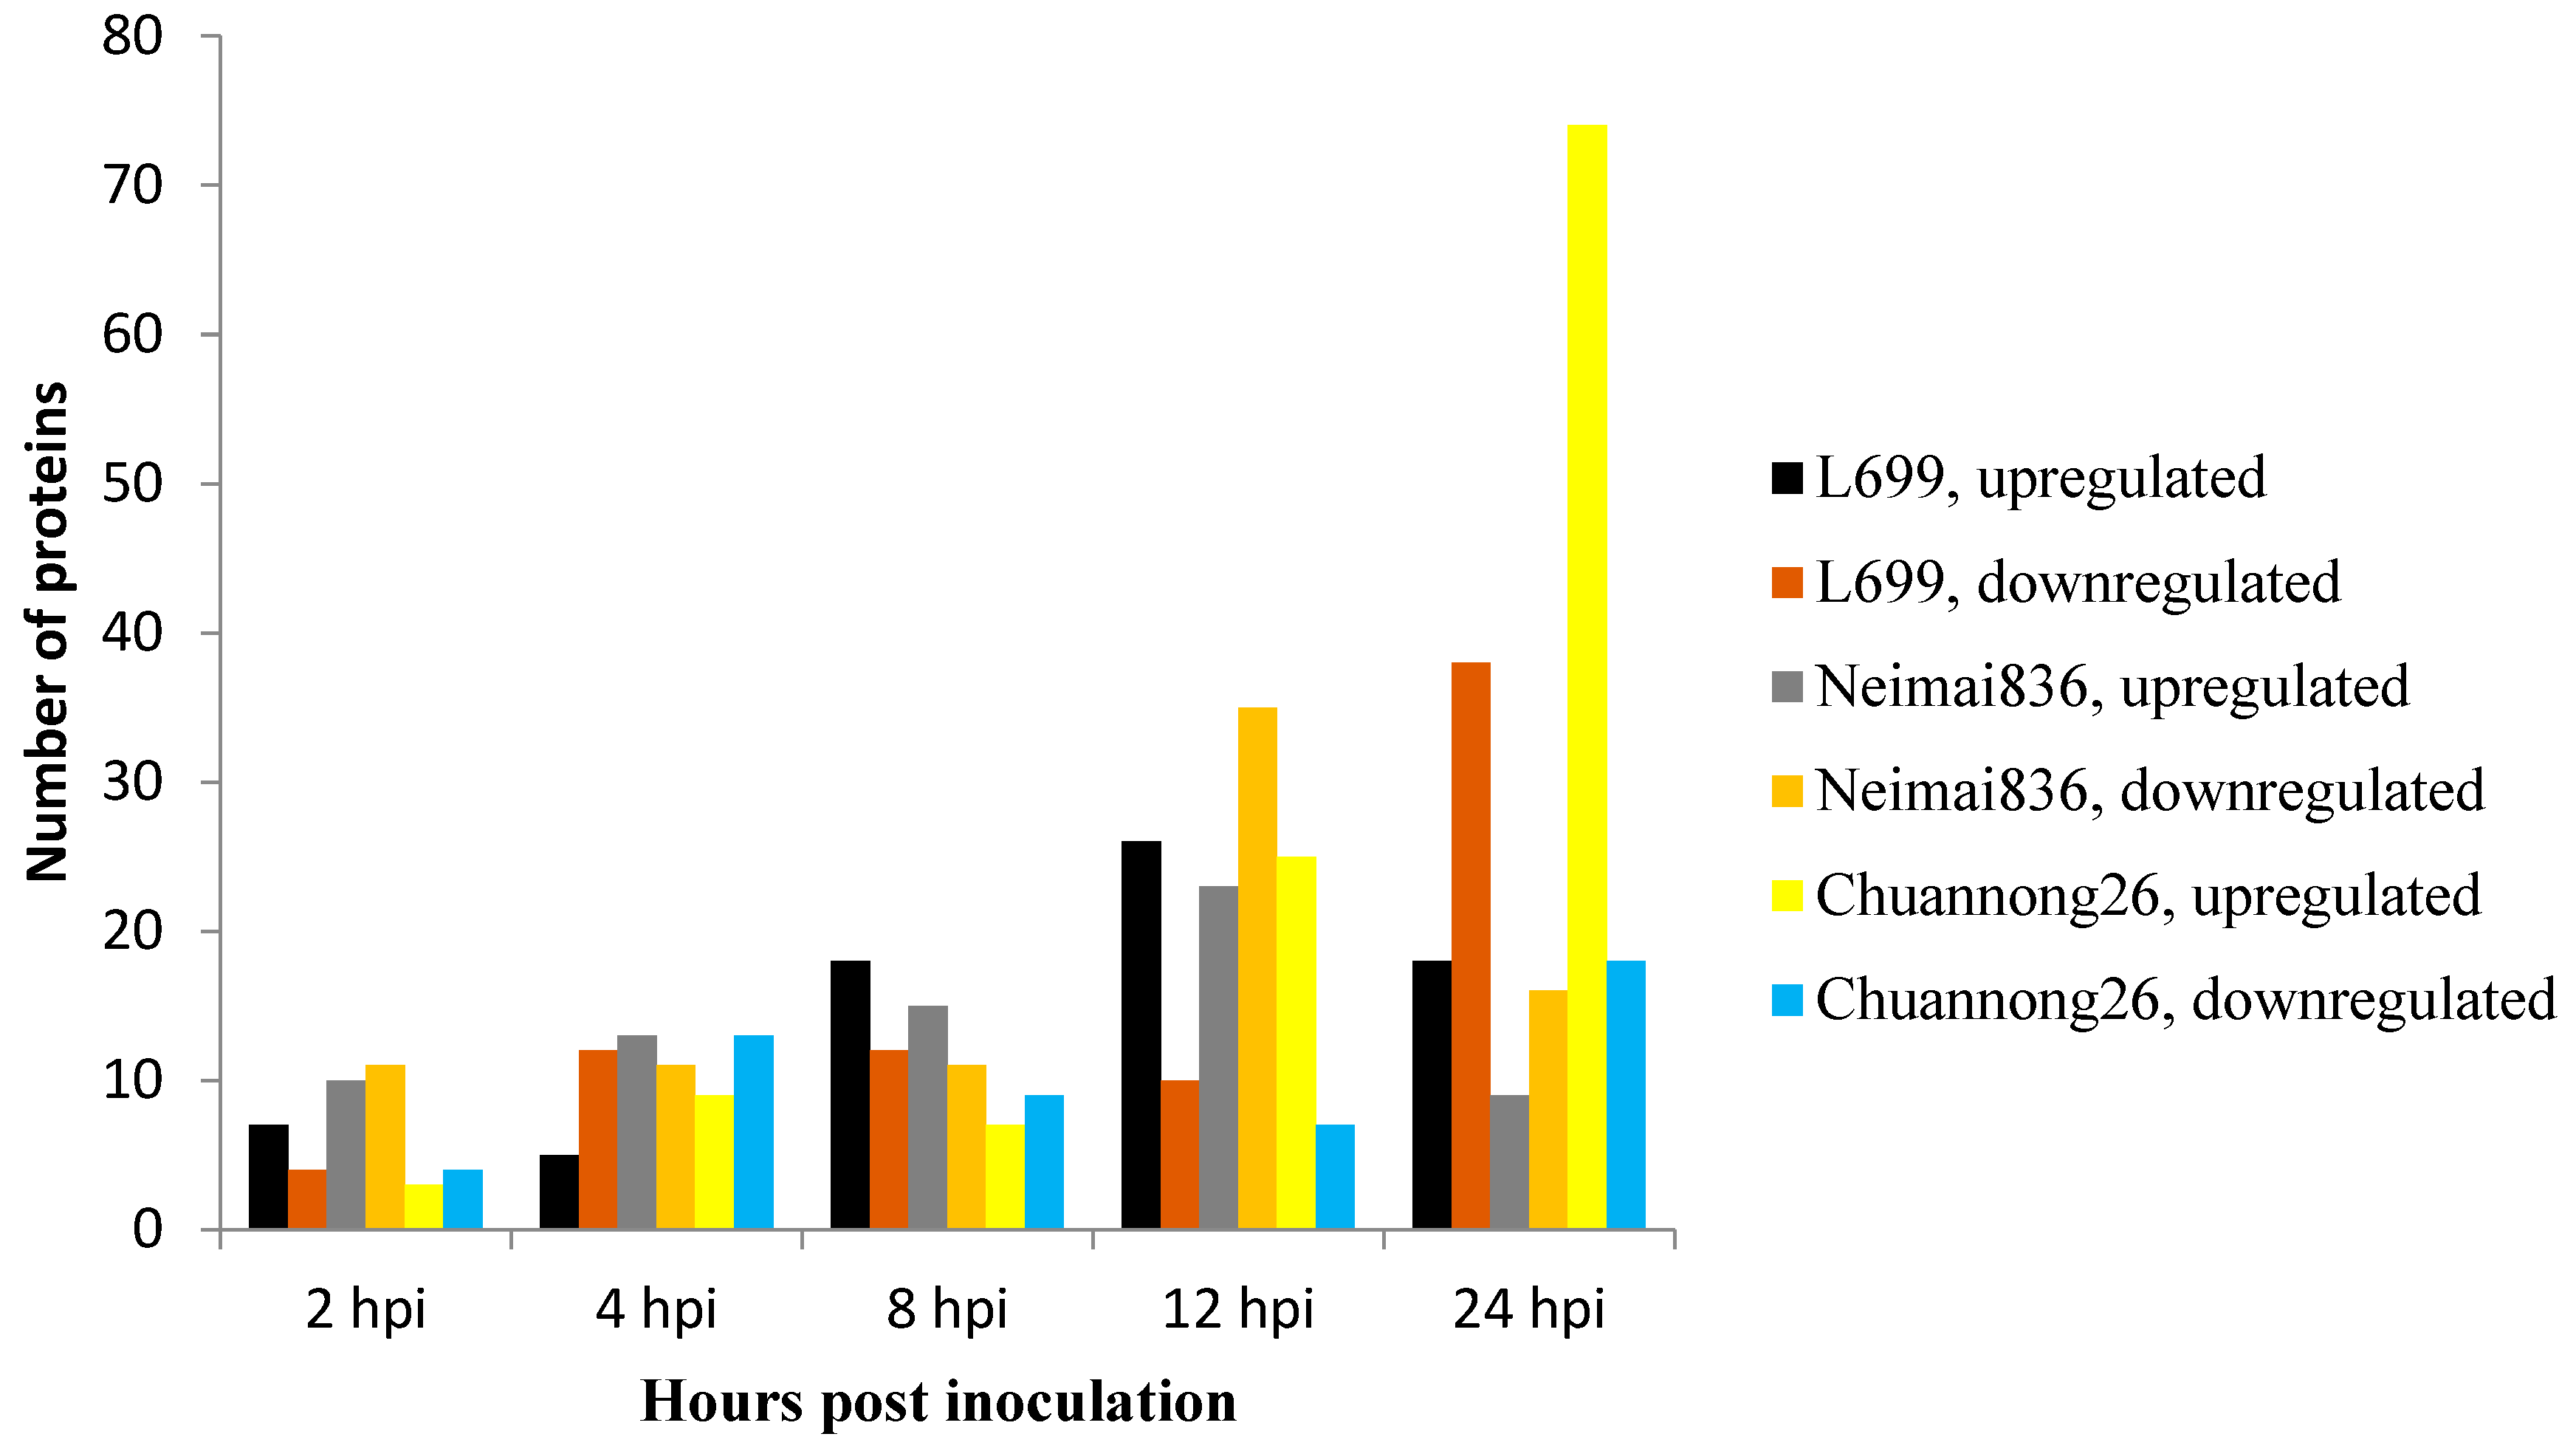
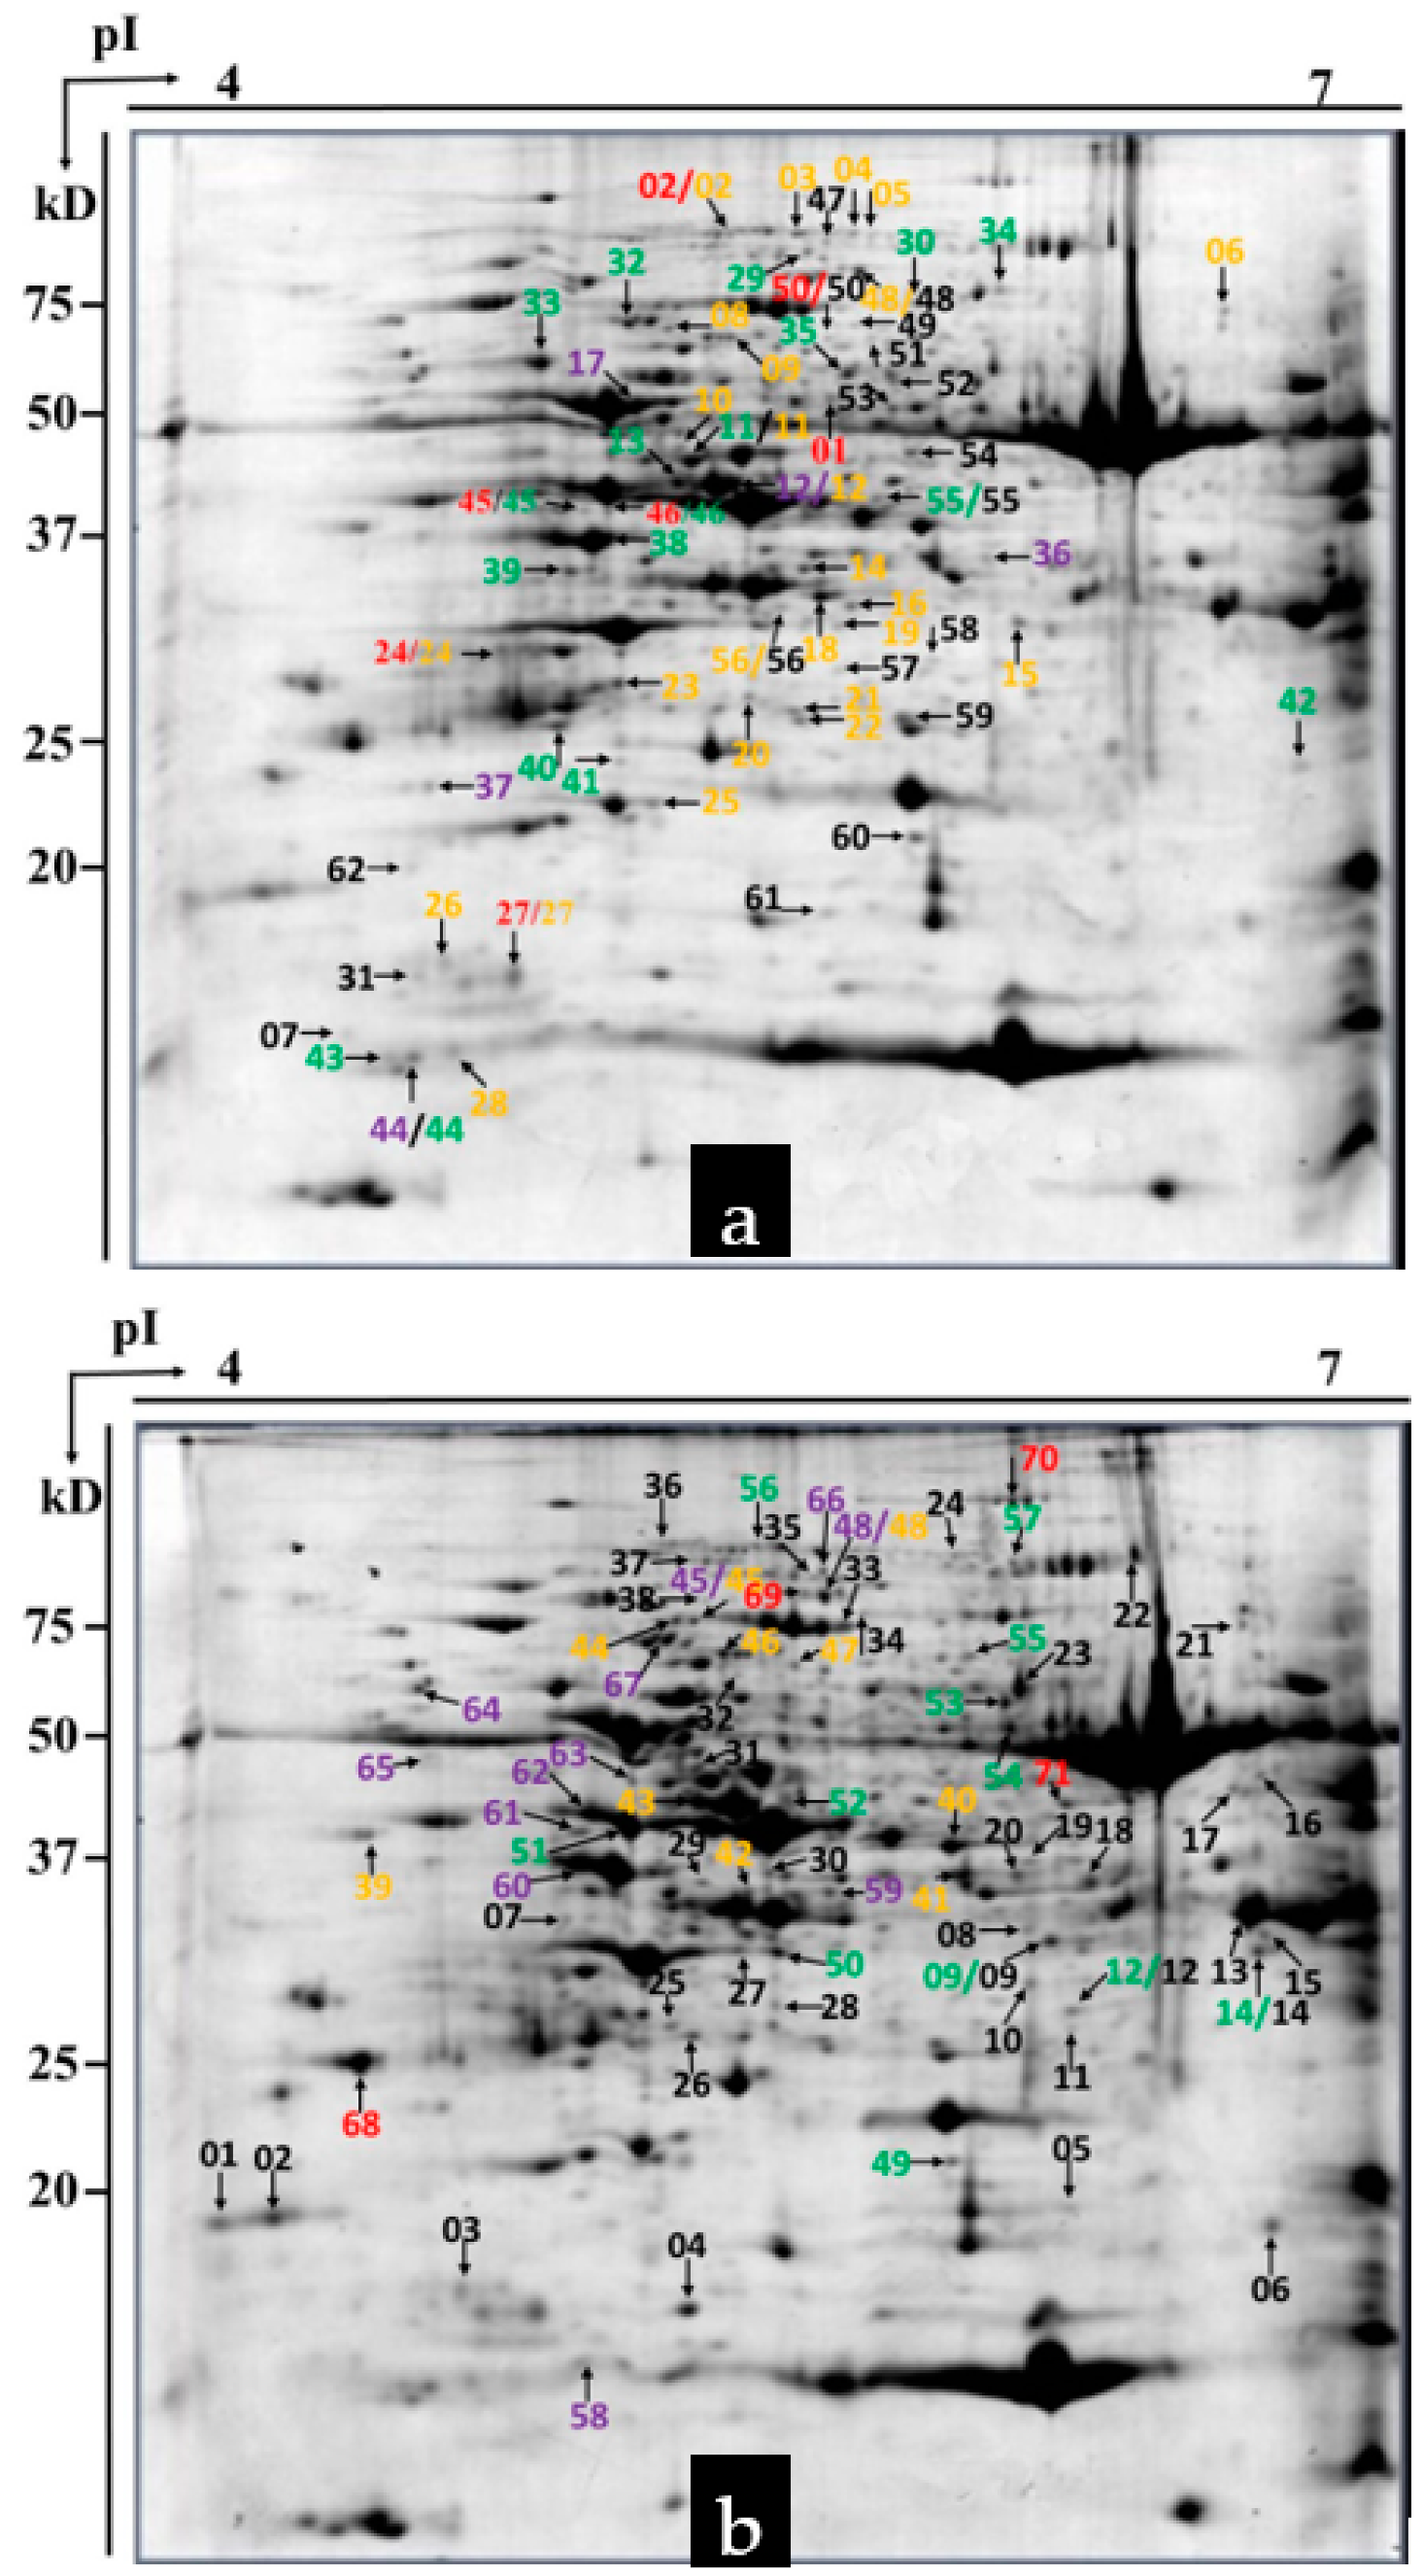
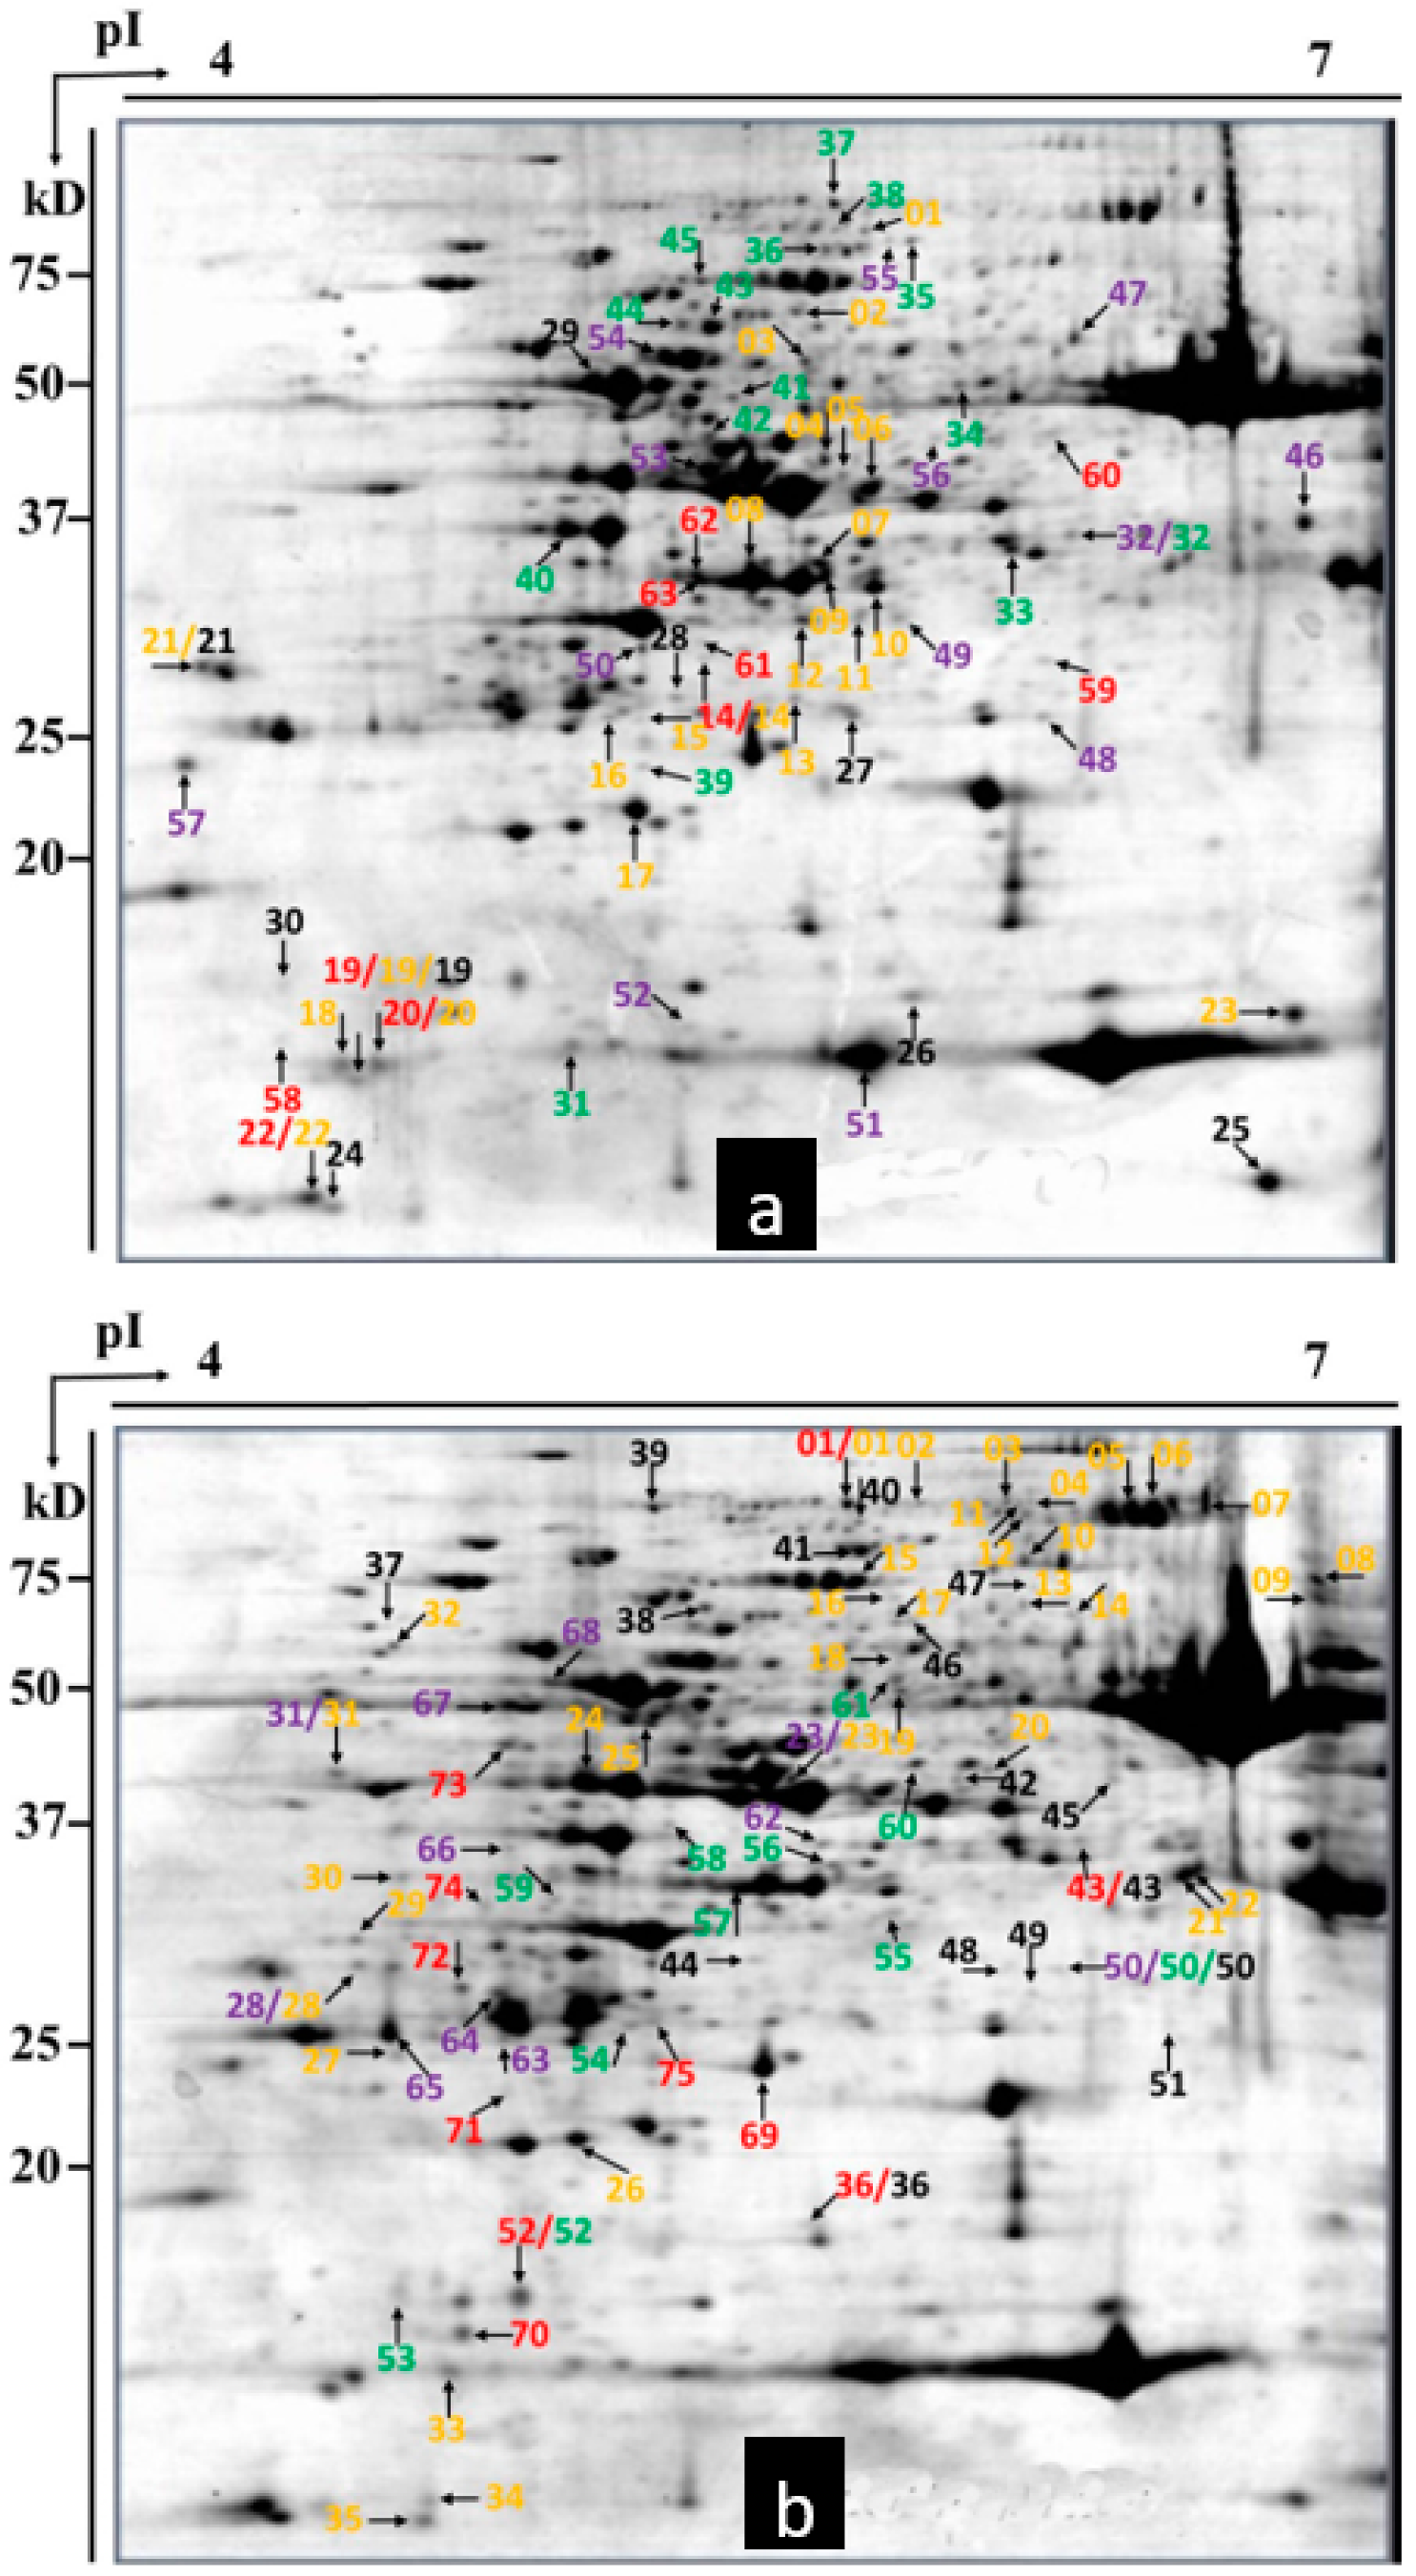
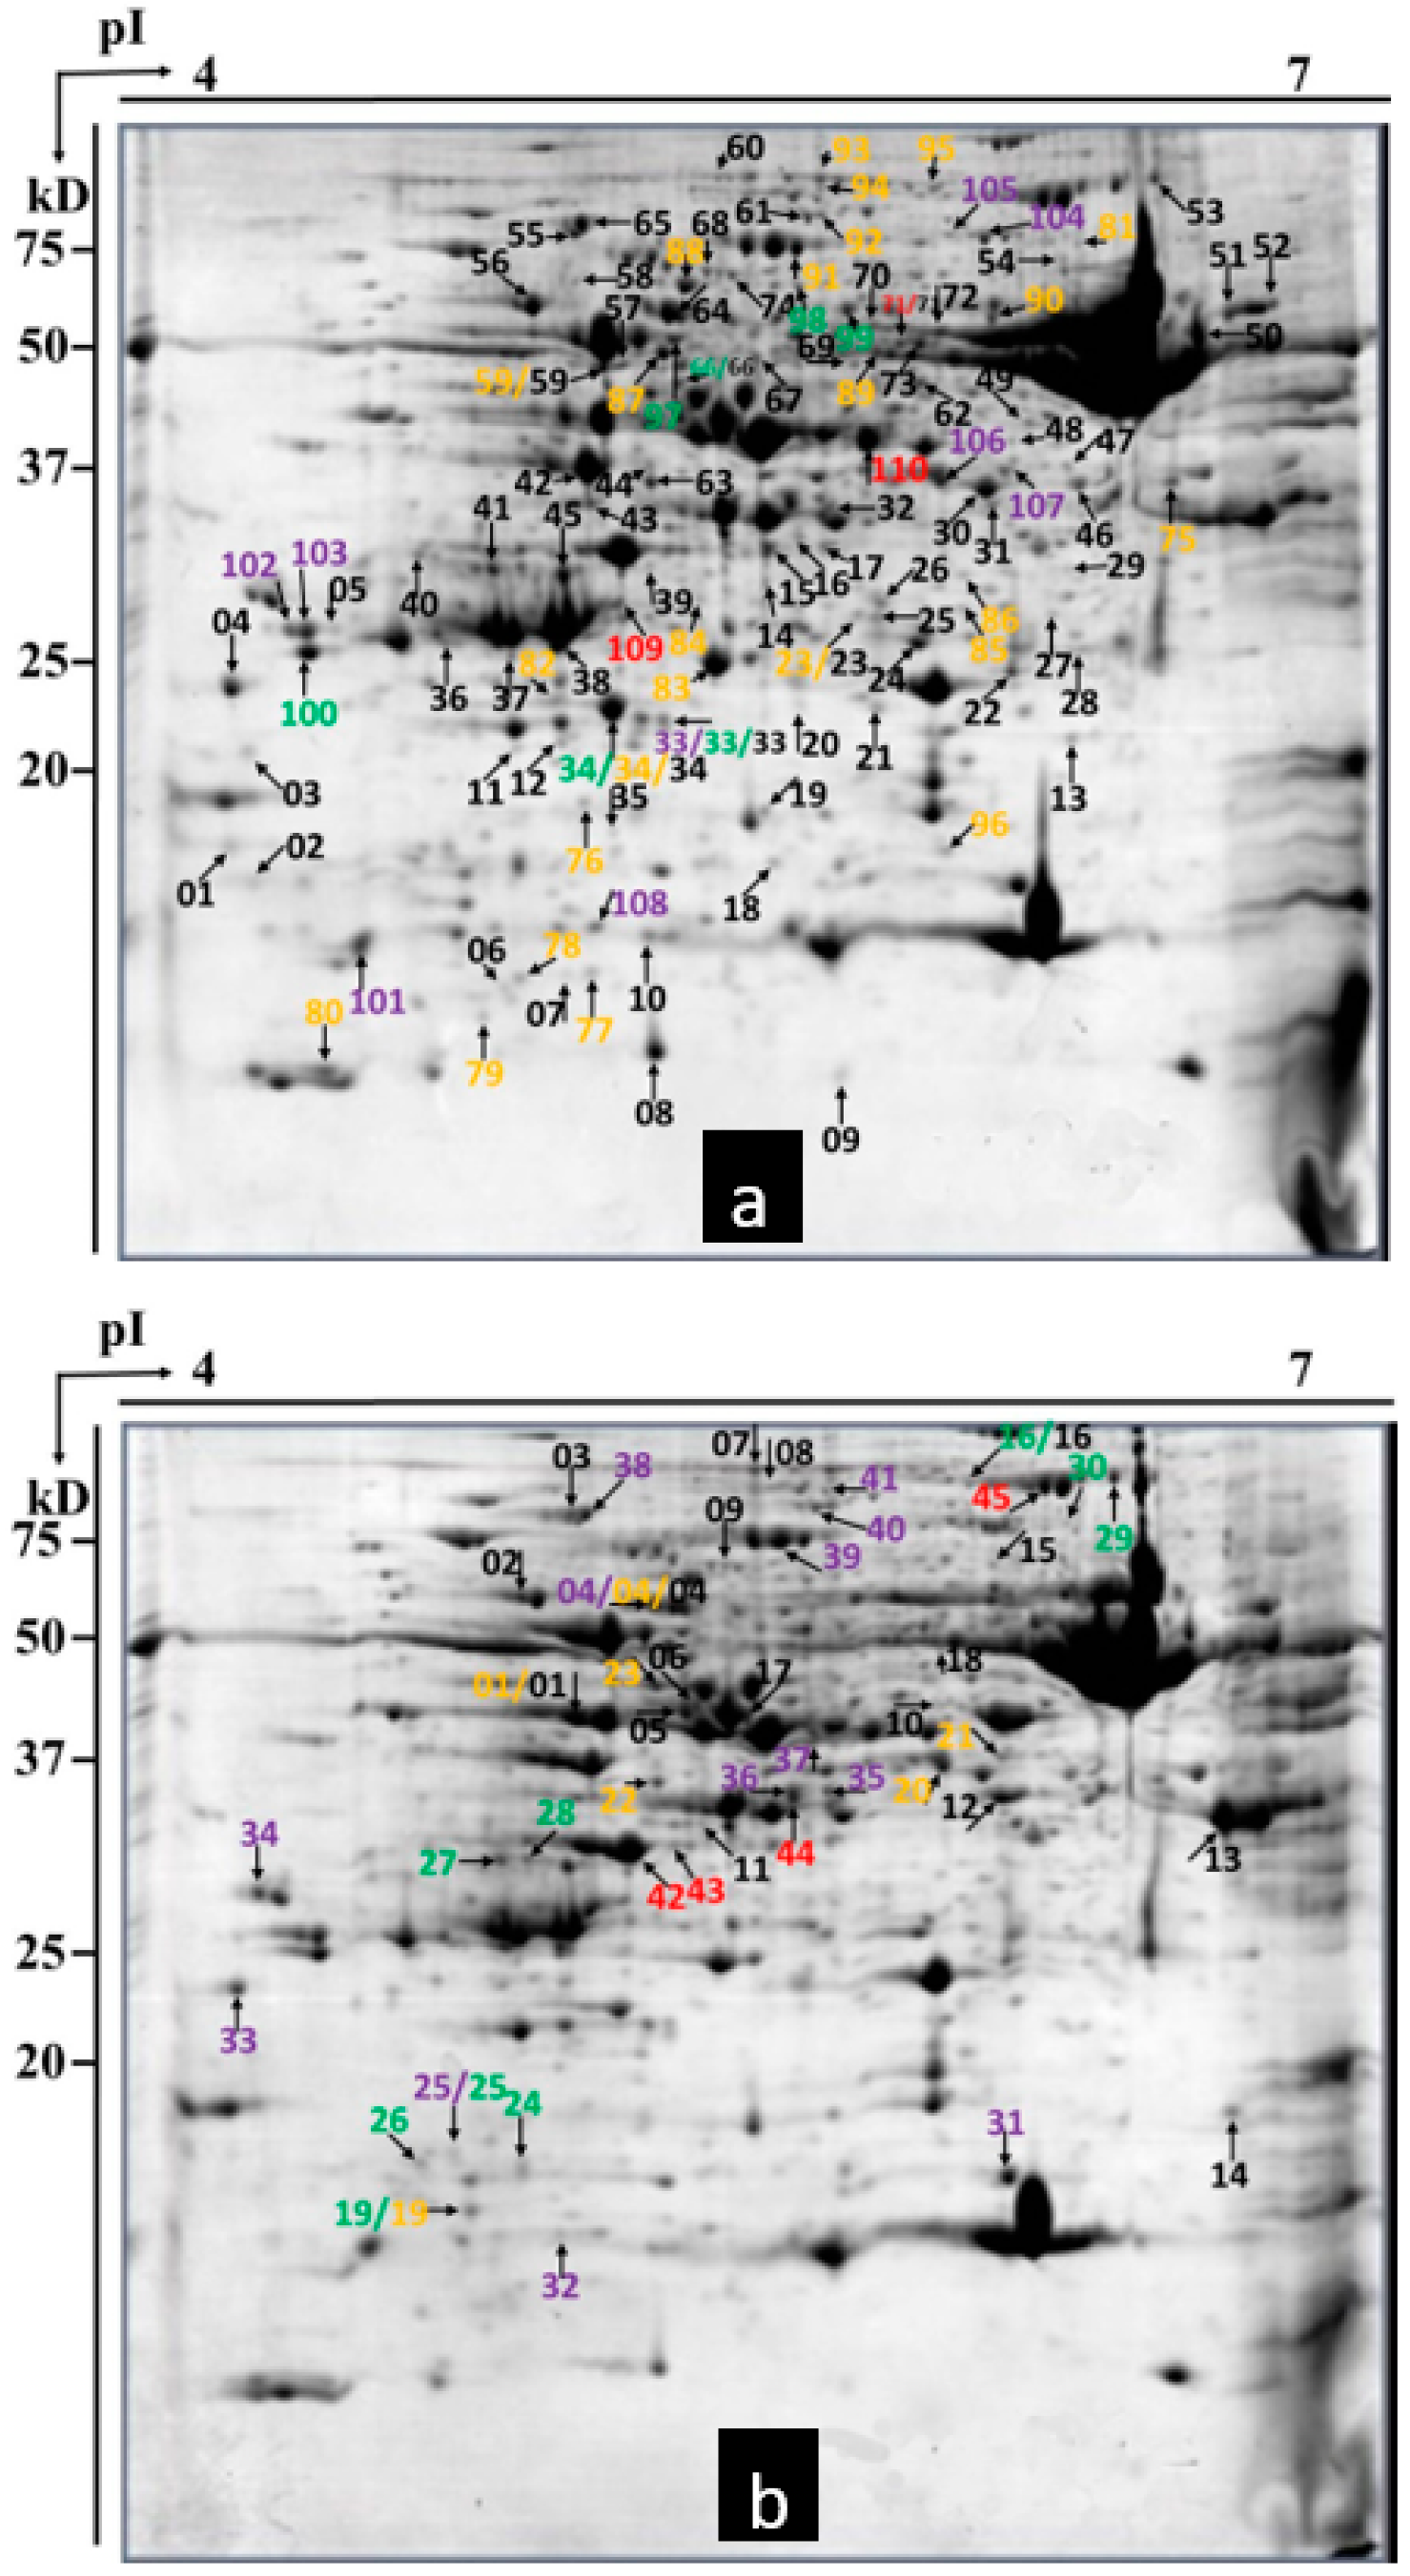
2.3. Detection of Differential Proteins by 2-DE

Approximately 500 protein spots were detected in all gels in this study. Using a twofold change cutoff, we found wheat cultivars L699, Neimai836, and Chuannong26 all had upregulated and downregulated proteins affected by Bgt. The numbers of upregulated proteins were seven (spot 01, 02, 24, 27, 45, 46, 50), five (spot 12, 17, 36, 37, 44), 18 (spot 11, 13, 29, 30, 32–35, 38–46, 55), 26 (spot 02–06, 08–12, 14–16, 18–28, 48, 56), and 18 (spot 07, 31, 47–62). The numbers of downregulated proteins were four (spot 68–71), 12 (spot 45, 48, 58–67), 12 (spot 09, 12, 14, 49–57), 10 (spot 39–48), and 38 (spot 01–38) in wheat cultivar L699 at 2, 4, 8, 12, 24 hpi, respectively (Figure 3 and Figure 4). The numbers of upregulated proteins were 10 (spot 14, 19, 20, 22, 58–63), 13 (spot 32, 46–57), 15 (spot 31–45), 23 (spot 1–23), and nine (spot 19, 21, 24–30). The numbers of downregulated proteins were 11 (spot 01, 36, 43, 52, 69–75), 11 (spot 23, 28, 31, 50, 62–68), 11 (spot 50, 52–61), 35 (spot 1–35), and 16 (spot 36–51) in wheat cultivar Neimai836 at 2, 4, 8, 12, 24 hpi, respectively (Figure 3 and Figure 5). The numbers of upregulated proteins were three (spot 71, 109–110), nine (spot 33, 101–108), seven (spot 33, 34, 66, 97–100), 25 (spot 23, 34, 59, 75–96), and 74 (spot 1–74). The numbers of downregulated proteins were four (spot 42–45), 13 (spot 04, 25, 31–41), nine (spot 16, 19, 24–30), 7 (spot 01, 04, 19–23), and 18 (spot 1–18) in wheat cultivar Chuannong26 at 2, 4, 8, 12, 24 hpi, respectively (Figure 3 and Figure 6).

2.4. Protein Identification

Sixty-two upregulated proteins in L699 at five different inoculation time points were eluted from representative 2-DE gels for identification, and 46 were successfully identified. Bioinformatics analysis of the identified proteins revealed that these proteins were putatively involved in diverse biological processes including stress and disease resistance, photosynthesis, signal transduction, carbohydrate metabolism, energy pathway, gene expression, protein turnover, and cell structure (Table 1). Five proteins (approximately 16.5% of the total differentially expressed proteins (DEPs)) were unnamed or hypothetical proteins. The largest category of these upregulated proteins was protein turnover (28%, thirteen), followed by carbohydrate metabolism (22%, ten), stress and disease resistance (13%, six), photosynthesis (13%, six), energy pathway (6.5%, three), signal transduction (2%, one), gene expression (2%, one), and cell structure (2%, one).

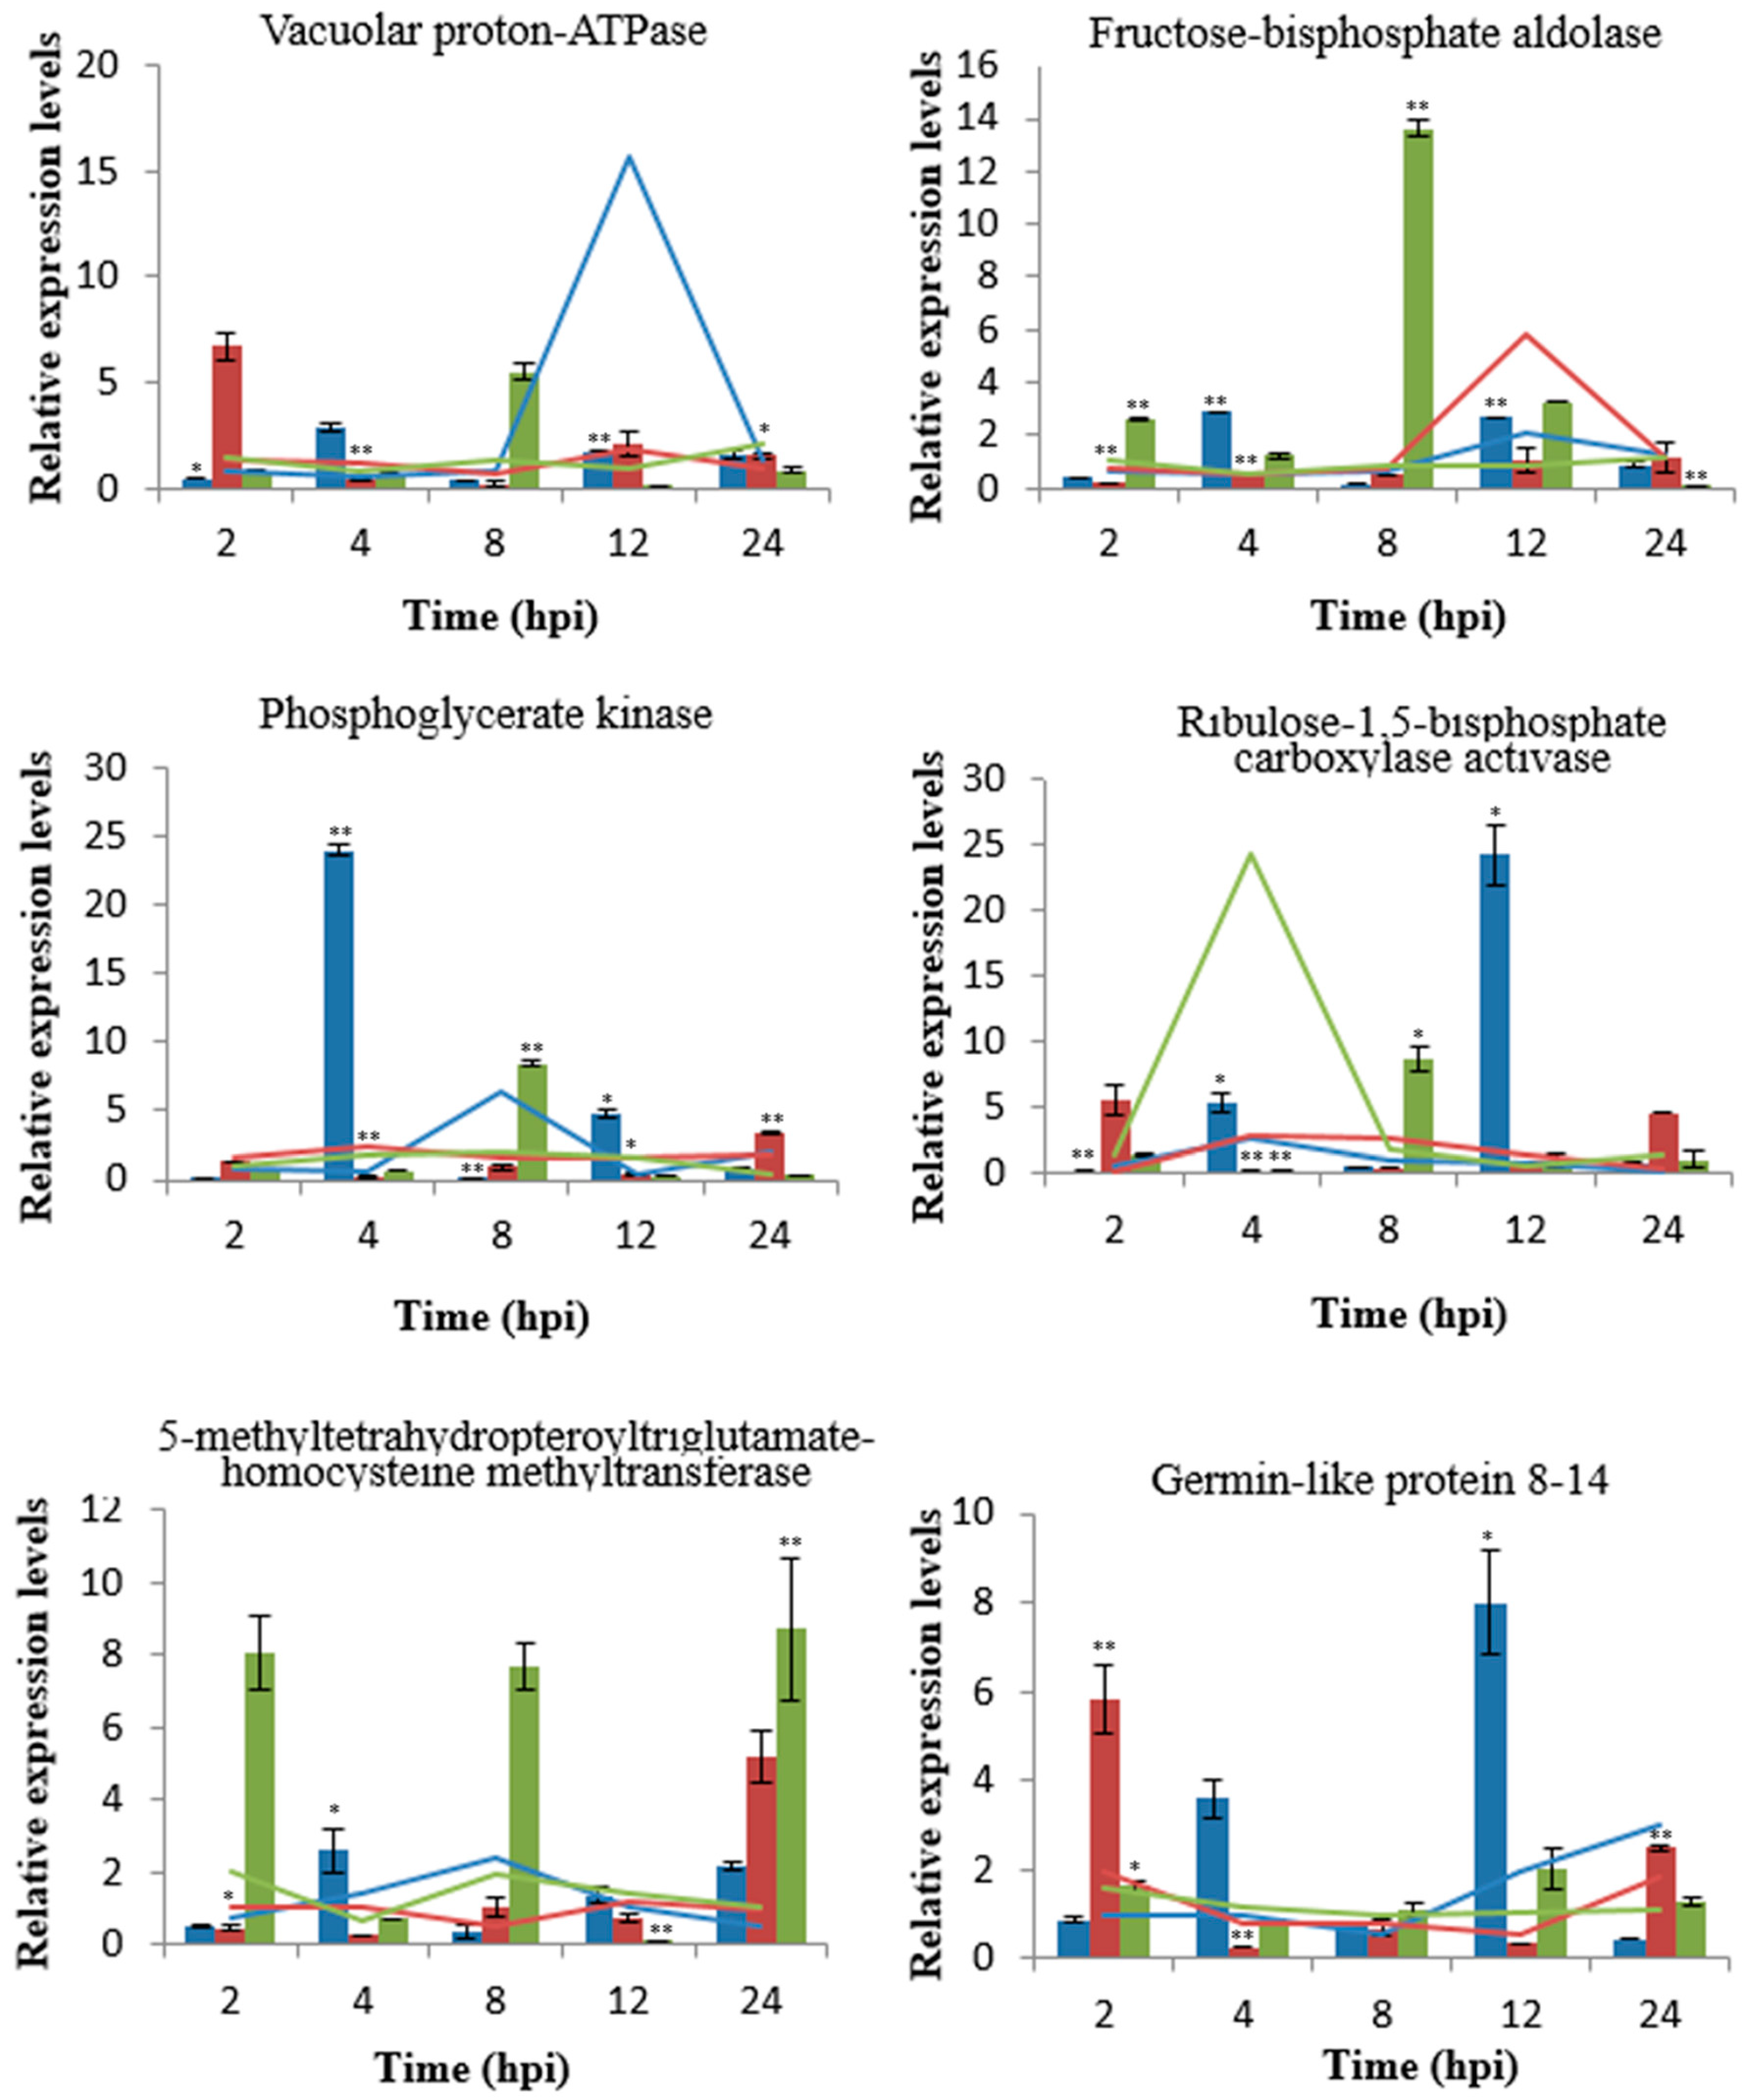
2.5. Validation of Upregulated Proteins by qRT-PCR

To confirm the changes in protein abundance, qRT-PCR was used to analyze the mRNA expression levels of protein-coding genes after inoculation with Bgt in wheat cultivars L699, Neimai836, and Chuannong26. Six upregulated proteins were randomly selected and primers for the mRNAs of these proteins were specifically designed (shown in Table 2). The mRNA levels for all the six proteins were significantly increased in at least one sampling time in wheat L699. These changes reflected the increases in proteins and the differentially expressed proteins identified by two-dimensional electrophoresis were validated (Figure 7). However, the mRNAs of four proteins, i.e. fructose-bisphosphate aldolase, phosphoglycerate kinase, 5-methyltetrahydropteroyltriglutamate-homocysteine methyltransferase, and the Germin-like protein (GLP) 8-14, were upregulated earlier than proteins in wheat L699. The protein level of fructose-bisphosphate aldolase increased at 12 hpi, but the mRNA level did not exhibit a significant increase at any sampling time point in wheat Neimai836.

3. Discussion

Plants employ two levels of immunity to encounter pathogen invasion: Pathogen-associated molecular pattern (PAMP)-triggered immunity (PTI) and effector-triggered immunity (ETI). In the early phase of defense, PAPMs are recognized as ‘non-self’ molecules by the host plants. This induces downstream defense signaling, such as the generation of reactive oxygen species (ROS) and the transcription of genes encoding pathogenesis-related proteins (PRs). The pathogens release effector proteins to oppose PTI, and then the plant resistance proteins recognize the effector, which stimulates the plant’s ETI, leading to the hypersensitive response (HR) and activating other plant defense pathways [32,33,34].
However, not only the specific signaling mediated by resistance genes, but also the other basic cellular processes, are involved in the effective defense to support the plant innate immune system [35]. In our results, the differentially expressed proteins, including both resistance proteins against Bgt and other proteins related to the direct and indirect defensive processes. The potential roles of these proteins in the defense response are discussed below.

3.1. Stress- and Defense-Related Proteins

Plants experience a variety of biotic and abiotic stresses during the growth and development periods. Studies on the plant stress response found many stress response related proteins. For example, the Germin-like proteins are important stress-related proteins.
Protein spot 61, with an increasing expression level 24 h after Bgt infection, was identified as GLPs. GLPs as extracellular glycoproteins are important components of the plant PRs [36]. Recently, GLPs were reported to be involved in the stress responses of Arabidopsis, pepper, barely, and rice [37,38,39,40]. GLPs can remove excess ROS generated by plants in the form of enzymes, receptors, or structural proteins in various physiological and biochemical processes. The expression of GLPs increased significantly and potentially catalyzing the production of H2O2, in plants infected by fungi, bacteria, viruses, or other pathogens [41,42,43]. H2O2 can selectively participate in the signaling cascade pathway, which can stimulate plant self-defense reactions. In addition, H2O2 is able to use the cellulose crosslinking action to strengthen the structure of plant cell walls, which is very important in plant defense against oxidative stress. GLPs play an important role in wheat L699 resistance to powdery mildew. This result is consistent with the previous study [43].
Heat shock proteins, as chaperones during the stress response, are very important for the correct folding of newly synthesized proteins [44]. Heat shock proteins were first discovered in Drosophila and were a class of proteins expressed by organisms under high temperature stimulation [45,46]. Recently, heat shock proteins were found to have very important roles in the innate immune response and are indispensable for the function of other defense-related proteins [47,48]. Mandal found that heat shock protein expression was significantly increased in wheat N0308 72 h after Bgt infection [29]. Protein spot 32 was identified as heat shock proteins with an expression level that increased after 8 h with Bgt inoculation. Heat shock proteins are closely related to wheat resistance of powdery mildew, as reported previously [29].
Plant lipoxygenases are members of a class of nonheme iron-containing dioxygenases that catalyze the addition of molecular oxygen to fatty acids containing a cis, cis-l,4-pentadiene system, which produces an unsaturated fatty acid hydroperoxide [49]. Currently, an increasing number of studies show that there are many similarities between the plant defense mechanisms and the animal defense mechanisms under adverse conditions [50]. Lipoxygenases in animals and plants play an important role in withstanding adverse environments. Protein spots 3, 4, 5, and 29, which were identified as lipoxygenase, were upregulated 8 h and 12 h after Bgt inoculation compared to non-inoculated wheat. In the lipoxygenase pathway, the polyunsaturated fatty acids are catalyzed by lipoxygenases to generate hydrogen peroxide and subsequently form compounds with a specific mass of physiological functions by the catalytic reaction of other enzymes, such as jasmonic acid and guaiac acid, which induces the synthesis of resistance proteins against stresses [51,52].

3.2. Proteins Related to Photosynthesis

Plant defense reactions are closely related to photosynthesis. It is generally believed that plant photosynthesis-related protein biosynthesis is reduced and resources are allocated to the defense response when plants are infected by a pathogen. The plant defense responses to pathogens is known as the “hidden costs” defense [53]. Plants affected by pathogens active the HR response, which is considered as another reason for weakening the plant photosynthesis after the original infection. However, protein spots 11, 28, 33, 36, 44 comprise ribulose carboxylase, which is an indicator of photosynthesis. These spots were upregulated 4 h, 8 h, and 12 h after powdery mildew infection, which could indicate that photosynthesis is increased. It was reported that photosynthesis is enhanced in early plant pathogen infections and weakened on later stage during the infection [54].

3.3. Proteins Involved in Carbohydrate Metabolism and Energy Pathways

The expression of several proteins involved in glucose metabolism, including β-d-glucose hydrolase (spot 6), phosphoglycerate kinase (spot 13, 55), glycerol phosphodiester enzyme (spot 14), diphosphate aldolase (spot 18), ribulose kinase (spot 38), glucose phosphate mutase (50, 51), and six-glucose phosphate decarboxylase (spot 54), were increased in response to wheat powdery mildew in wheat L699. Previous studies have shown that hexose can provide extra energy and serve as a signal for activating resistant response. For instance, in response to barley powdery mildew infection, the expression of hexose metabolizing enzymes significantly increased [55].

3.4. Proteins Involved in Gene Expression and Protein Turnover

Each step in the flow of genetic information is very strict, so the error rate of protein synthesis in this process is very low. However, protein synthesis has a certain error rate that is the net result of several processes. Aminoacyl-tRNA synthetases and ribosomes play important roles in protein synthesis [56,57]. Studies have shown that aminoacy-tRNA synthetase is not only involved in protein synthesis, but also participates in other activities, including the regulation of transcription and translation, RNA splicing, signal transduction, and immune response [58]. Current research is focused on the relationship between the function and structure of new amino acid-tRNA synthetases, especially the aminoacyl-tRNA synthetase, which is related to diseases. After powdery mildew infection in wheat L699, the expression levels of alanyl-tRNA synthetase (spot47), lysyl-tRNA synthetase (spot49), and ribosomal protein (spot27) increased, suggesting that these proteins may be important in the wheat anti-powdery mildew responses.

3.5. Proteins Associated with Cell Organization

In powdery mildew-infected wheat L699, actin (spot 12) was upregulated. The actin cytoskeleton is an essential dynamic component for cells and is highly conserved in eukaryotic cells. The cytoskeleton is closely linked with the membrane and is involved in various cellular processes, including defense signaling based on actin cytoskeletal structures after pathogen infection [59].

3.6. The Correlation of mRNA and Protein Expression

The analysis of six proteins and the expression of the protein-coding regions of their genes showed that the proteins and mRNA levels had a certain uniformity in our study. However, there exists post-transcriptional regulation after translational regulation in wheat, which may lead to differences between protein expression levels and mRNA levels.

3.7. The Novel Proteins Potentially Involed in the Response of Wheat Against Bgt

Some of the identified proteins, such as the lipoxygenase, glucan exohydrolase, glucose adenylyltransferasesmall, phosphoribulokinase, and phosphoglucomutase, are first reported during the interaction of wheat-Bgt in this study. These proteins are potentially very critical for the wheat-Bgt interaction at early stage. For future research, the defense functions of these novel proteins deserve further investigation by using the integrative approaches, such as the comparative metabolomics, gene overexpression, and silencing methods. The related study will lead to deeper understanding of the detailed functions of these important proteins and more efficient disease control strategies.

4. Materials and Methods

4.1. Plant Materials and Inoculation

L699, Neimai836, and Chuannong26 were used in this study. L699 carries the resistance gene Pm40 and shows resistance to most powdery mildew isolates in China. Neimai836 carries the resistance gene Pm21, but not Pm40, and also shows resistance to most powdery mildew isolates in China. Nevertheless, Chuannong26 is highly susceptible to powdery mildew without any effective resistance gene. Plants were cultivated in 30 cm pots in a growth chamber at 18 °C under a 12 h/12 h dark photoperiod. These pots were divided into the Bgt-inoculated group and the mock-inoculated group with nonopaque and breathable hoods. Seedlings of the Bgt-inoculated group were artificially inoculated by dusting with Bgt conidia from sporulating seedlings of Chuannong26 at two to three leaf stages. Leaf samples were harvested at 2, 4, 8, 12, and 24 hpi with liquid nitrogen and immediately stored at −80 °C. Samples were collected from three biological replicates at each time point and every sample protein was run on three gels. For the analysis, one best gel was selected from three gels.

4.2. Cytological Observation of the Interaction between Wheat and Bgt

Leaves of the Bgt-inoculated and mock-inoculated wheat were sampled at 2, 4, 8, 12, and 24 hpi and cut into 2–3 cm leaf fragments. The leaf fragments collected at 2, 4, 8, and 12 hpi were destained using isopropanol fumigation. The leaf fragments collected at 24 hpi were destained with AA solution (ethanol:glacial acetic acid = 1:1, v/v). Then the sample were stained with Coomassie blue staining solution (0.15% trichloroacetic acid aqueous solution:0.6% Coomassie brilliant blue R-250 methanol solution = 1:1, v/v) for 4 h. After rinsing with distilled water, the leaves were saved in a mix solution (glacial acetic acid:glycerol:distilled water = 1:4:15, v/v/v). The infection structures including germ tubes, appressoria and haustoria of Bgt were observed under electron microscope (40×, Nikon Eclipse 80i, Nikon Corporation, Tokyo, Japan).

4.3. Protein Extraction

Leaf tissue (1 g) was ground in a prechilled mortar with liquid nitrogen. Then, the powder was transferred to a 1.5 mL centrifuge tube with the addition of 1 mL acetone containing 10% trichloroacetic acid (TCA) and 0.07% β-mercaptoethanol. The samples were vortexed and chilled for 1 h at −20 °C. Then the homogenate was centrifuged at 13,000× g for 30 min at 4 °C. After the supernatant was gently decanted, the pellet was washed four times with chilled acetone containing 0.07% β-mercaptoethanol, then dried until all the acetone was removed by a vacuum drying instrument. The resulting powder was dissolved in 1 mL of IEF buffer (7 M urea, 2 M thiourea, 4% CHAPS, 20 mM DTT, 0.001% bromophenol blue, and 0.5% ampholyte (pH 3–10)). After centrifugation at 13,000× g for 20 min twice, the leaf proteins were obtained from the supernatant, and their concentration was determined using a Bradford dye binding assay [60].

4.4. Two-Dimensional Electrophoresis, Protein Visualization, and Image Analysis

The protein mixture was loaded onto an IPG strip (17 cm, pH 4-7, linear gradient (Bio-Rad, California, CA, USA)) by active rehydration at 50 V for 14 h (20 °C) on a Protein Isoelectric Focusing (IEF) Cell (Bio-Rad). The following conditions were used for the IEF: 20 °C, 50 μA/strip, 250 V for 1 h, 1000 V for 1 h, 10,000 V for 5 h, and 10,000 V, with a total of 60,000 vhs. The focused IPG strips were equilibrated in buffer containing 5 mL 6 M urea, 2% SDS, 20% glycerol, 375 mM Tris-HCl (pH 8.8), and 200 mM DTT for 15 min, then re-equilibrated in a similar buffer whose 200 mM DTT was replaced by 250 mM iodoacetamide for 15 min. Proteins were separated on the second dimension on vertical 12% sodium dodecyl sulfate-polyacrylamide (SDS-PAGE) gel in a Protean II XI Cell (Bio-Rad) at 25 mA/gel. Proteins in the gels were stained by the “blue silver” protocol as described by Candiano et al. [61]. Gels were scanned by a GS-800 scanner (Bio-Rad) and the proteins in the images were analyzed using PDQuest software with version 8.0 (Bio-Rad). There were variations due to sample loading, the 2-DE techniques and staining. To minimize these variations, each spot intensity was normalized according to its percent volume of all protein spots on the gel. The proteins showing at least a twofold change in abundance were considered as differentially expressed proteins (DEPs).

4.5. MS and Database Searches

Protein slices in fresh blue silver-stained gel were excised and plated into a 96-well microtiter plate. Excised slices were first distained twice with 60 μL 50 mM NH4HCO3 and 50% acetonitrile, then dried twice with 60 μL acetonitrile. Afterwards, the dried pieces of gels were incubated in ice-cold digestion solution (12.5 ng/μL trypsin and 20 mM NH4HCO3) for 20 min, then transferred into a 37 °C incubator for digestion overnight. Finally, peptides in the supernatant were collected after extraction twice with 60 μL extraction solution (5% formic acid in 50% acetonitrile).
The peptide solution described above was dried under the protection of N2. A 0.8 μL matrix solution (5 mg/mL α-cyano-4-hydroxy-cinnamic acid diluted in 0.1% TFA, 50% ACN) was pipetted to dissolve the peptides. Then, the mixture was spotted on a MALDI target plate (AB SCIEX, Framingham, Massachusetts, MA, USA). MS analysis of the peptides was performed on an AB SCIEX 5800 TOF/TOF. The UV laser was operated at a 400 Hz repetition rate with a wavelength of 355 nm. The accelerated voltage was operated at 20 kV, and the mass resolution was maximized at 1600 Da. The mass instrument with internal calibration mode was calibrated by myoglobin digested with trypsin. All acquired spectra of samples were processed using TOF/TOF ExplorerTM Software (AB SCIEX) in default mode. The data were searched by GPS Explorer (V3.6) with the search engine MASCOT (V2.3, Matrix Science, London, UK). The search parameters were as follows: dates were compared against the NCBI nr database, trypsin was digested with one missing cleavage, MS tolerance was set at 100 ppm, and MS/MS tolerance was set to 0.6 Da. Functional annotation of identified proteins based on gene ontology was performed using the Protein Information Resource (https://proteininformationresource.org).

4.6. RNA Isolation and qRT-PCR Assays

Total RNA from Bgt-inoculated or mock-inoculated wheat leaves was sampled at 2, 4, 8, 12, and 24 hpi and extracted using Trizol reagent (Tiangen Biotech, Beijing, China). First strand cDNA was synthesized with Transcript One-Step gDNA removal and cDNA Synthesis Supermix (Transgen Biotech, Beijing, China). Primers were specifically designed to anneal to each of the selected genes and the endogenous reference gene 18S rRNA (GenBank accession No. AY049040) [62]. The expression patterns of selected genes were analyzed with a Bio-Rad iQ5 system. Relative gene quantification was calculated by the comparative 2–ΔΔCt method [63] and normalized to the corresponding expression level of the 18S rRNA. All reactions were performed in triplicate, including three no-template controls.

5. Conclusions

In summary, we identified 46 differentially expressed proteins in wheat in response to Bgt inoculation using 2-DE and mass spectrometry. Among these identified proteins, the lipoxygenase, glucan exohydrolase, glucose adenylyltransferasesmall, phosphoribulokinase, and phosphoglucomutase are first reported during the interaction of wheat-Bgt. We inferred that these proteins are not only involved in defense response but also physiology and cellular process for wheat to confer resistance against Bgt. The wheat resistance gene products potentially mediate the immune response and coordinate other physiological and cellular processes during the resistance response to Bgt.

Author Contributions

Y.L., M.Z., G.G. and X.C. designed the research. Y.L., J.Y., Y.H., L.L., T.L. and L.H. performed the research. Y.L., X.C. and Y.H. analyzed the data. Y.L., Y.X., X.C., M.C. and M.Z. wrote the paper. All authors read and approved the final version of the manuscript.

Funding

The work was supported by the special funds from National Key R&D Program of China, No. 2018YFD0200508; Science and Technology Planning Project of Sichuan Province of China, No. 2016NYZ0053-4; and Science and Technology Department of Sichuan Province of China, No. 2017JY0012.

Acknowledgments

We thank Peigao Luo for providing the wheat cultivar L699.

Conflicts of Interest

The authors declare no conflict of interest.

References

  1. Wang, Z.; Li, L. Seedling and adult plant resistance to powdery mildew in Chinese bread wheat cultivars and lines. Plant Dis. 2005, 89, 457–463. [Google Scholar] [CrossRef]
  2. Duveiller, E.; Singh, R. The challenges of maintaining wheat productivity: Pests, diseases, and potential epidemics. Euphytica 2007, 157, 417–430. [Google Scholar] [CrossRef]
  3. Hao, Y.; Parks, R. Molecular characterization of a new powdery mildew resistance gene Pm54 in soft red winter wheat. Theor. Appl. Genet. 2015, 128, 465–476. [Google Scholar] [CrossRef] [PubMed]
  4. Zhang, R.; Sun, B. Pm55, a developmental-stage and tissue-specific powdery mildew resistance gene introgressed from Dasypyrum villosum into common wheat. Theor. Appl. Genet. 2016, 129, 1975–1984. [Google Scholar] [CrossRef] [PubMed]
  5. Hsam, S.; Huang, X. Chromosomal location of genes for resistance to powdery mildew in common wheat (Triticum aestivum L. em Thell.). 5. Alleles at the Pm1 locus. Theor. Appl. Genet. 1998, 96, 1129–1134. [Google Scholar] [CrossRef]
  6. Singrün, C.; Hsam, S. Powdery mildew resistance gene Pm22 in cultivar Virest is a member of the complex Pm1 locus in common wheat (Triticum aestivum L. em Thell.). Theor. Appl. Genet. 2003, 106, 1420–1424. [Google Scholar] [CrossRef] [PubMed]
  7. Hao, Y.; Liu, A. Pm23: A new allele of Pm4 located on chromosome 2AL in wheat. Theor. Appl. Genet. 2008, 117, 1205–1212. [Google Scholar] [CrossRef] [PubMed]
  8. Xie, W.; Ben-David, R. Suppressed recombination rate in 6VS/6AL translocation region carrying the Pm21 locus introgressed from Haynaldia villosa into hexaploid wheat. Mol. Breed. 2012, 29, 399–412. [Google Scholar] [CrossRef]
  9. Zou, S.; Wang, H. The NB-LRR gene Pm60 confers powdery mildew resistance in wheat. New Phytol. 2018, 218, 298–309. [Google Scholar] [CrossRef] [PubMed]
  10. Wiersma, A.T.; Pulman, J.A. Identification of Pm58 from Aegilops tauschii. Theor. Appl. Genet. 2017, 130, 1123–1133. [Google Scholar] [CrossRef]
  11. Tan, C.; Li, G. Characterization of Pm59, a novel powdery mildew resistance gene in Afghanistan wheat landrace PI 181356. Theor. Appl. Genet. 2018, 131, 1145–1152. [Google Scholar] [CrossRef] [PubMed]
  12. Sun, H.; Hu, J. Pm61: A recessive gene for resistance to powdery mildew in wheat landrace Xuxusanyuehuang identified by comparative genomics analysis. Theor. Appl. Genet. 2018, 131, 2085–2097. [Google Scholar] [CrossRef] [PubMed]
  13. Zhang, R.; Fan, Y. Pm62, an adult-plant powdery mildew resistance gene introgressed from Dasypyrum villosum chromosome arm 2VL into wheat. Theor. Appl. Genet. 2018, 131, 2613–2620. [Google Scholar] [CrossRef] [PubMed]
  14. Huang, X.Q.; Hsam, S.L.K. Molecular mapping of the wheat powdery mildew resistance gene Pm24 and marker validation for molecular breeding. Theor. Appl. Genet. 2000, 101, 407–414. [Google Scholar] [CrossRef]
  15. Consortium, I.W.G.S. A chromosome-based draft sequence of the hexaploid bread wheat (Triticum aestivum) genome. Science 2014, 345, 1251788. [Google Scholar]
  16. Yahiaoui, N.; Srichumpa, P. Genome analysis at different ploidy levels allows cloning of the powdery mildew resistance gene Pm3b from hexaploid wheat. Plant J. 2004, 37, 528–538. [Google Scholar] [CrossRef] [PubMed]
  17. Cao, A.; Xing, L. Serine/threonine kinase gene Stpk-V, a key member of powdery mildew resistance gene Pm21, confers powdery mildew resistance in wheat. Proc. Natl. Acad. Sci. USA 2011, 108, 7727–7732. [Google Scholar] [CrossRef]
  18. Hurni, S.; Brunner, S. Rye Pm8 and wheat Pm3 are orthologous genes and show evolutionary conservation of resistance function against powdery mildew. Plant J. 2013, 76, 957–969. [Google Scholar] [CrossRef]
  19. Sánchez-Martín, J.; Steuernagel, B. Rapid gene isolation in barley and wheat by mutant chromosome sequencing. Genome Biol. 2016, 17, 221. [Google Scholar] [CrossRef]
  20. Xing, L.; Hu, P. NLR1-V, a CC-NBS-LRR encoding gene, is a potential candidate gene of the wheat powdery mildew resistance gene Pm21. bioRxiv 2017, 114058. [Google Scholar] [CrossRef]
  21. Luo, P.G.; Luo, H. Characterization and chromosomal location of Pm40 in common wheat: A new gene for resistance to powdery mildew derived from Elytrigia intermedium. Theor. Appl. Genet. 2009, 118, 1059–1064. [Google Scholar] [CrossRef]
  22. Zhong, S.; Ma, L. Collinearity analysis and high-density genetic mapping of the wheat powdery mildew resistance gene Pm40 in PI 672538. PLoS ONE 2016, 11, e0164815. [Google Scholar] [CrossRef] [PubMed]
  23. Liu, Z.H.; Xu, M. Registration of the novel wheat lines L658, L693, L696, and L699, with resistance to Fusarium Head blight, stripe rust, and powdery mildew. J. Plant Registrat. 2015, 9, 121–124. [Google Scholar] [CrossRef]
  24. Li, J.; Yang, X. Proteomic analysis of the compatible interaction of wheat and powdery mildew (Blumeria graminis f. sp. tritici). Plant Physiol. Biochem. 2017, 111, 234–243. [Google Scholar] [CrossRef] [PubMed]
  25. Lim, M.S.; Elenitoba-Johnson, K.S.J. Proteomics in pathology research. Lab. Investig. 2004, 84, 1227–1244. [Google Scholar] [CrossRef] [PubMed] [Green Version]
  26. Marra, R.; Ambrosino, P. Study of the three-way interaction between Trichoderma atroviride, plant and fungal pathogens by using a proteomic approach. Curr. Genet. 2006, 50, 307–321. [Google Scholar] [CrossRef] [PubMed]
  27. Li, Q.; Chen, X. Differences in protein expression and ultrastructure between two wheat near-isogenic lines affected by powdery mildew. Russ. J. Plant Physiol. 2011, 58, 686. [Google Scholar] [CrossRef]
  28. Wang, B.; Xie, C. Comparative proteomic analysis of wheat response to powdery mildew infection in wheat Pm30 near-lsogenic lines. J. Phytopathol. 2012, 160, 229–236. [Google Scholar] [CrossRef]
  29. Mandal, M.S.N.; Fu, Y. Proteomic analysis of the defense response of wheat to the powdery mildew fungus, Blumeria graminis f. sp. tritici. Protein J. 2014, 33, 513–524. [Google Scholar] [CrossRef]
  30. Fu, Y.; Zhang, H. Quantitative proteomics reveals the central changes of wheat in response to powdery mildew. J. Proteom. 2016, 130, 108–119. [Google Scholar] [CrossRef]
  31. Luo, L.Y. Defense Responses Induced by Bgt in The Novel Wheat Line L699 Carrying a Pm40 Gene; Sichuan Agricultural University: Ya’an, China, 2016. [Google Scholar]
  32. Spoel, S.H.; Dong, X. How do plants achieve immunity? Defence without specialized immune cells. Nat. Rev. Immunol. 2012, 12, 89–100. [Google Scholar] [CrossRef] [PubMed]
  33. Chisholm, S.T.; Coaker, G. Host-microbe interactions: Shaping the evolution of the plant immune response. Cell 2006, 124, 803–814. [Google Scholar] [CrossRef] [PubMed]
  34. Hammond-Kosack, K.E.; Jones, J.D. Resistance gene-dependent plant defense responses. Plant Cell 1996, 8, 1773–1791. [Google Scholar] [CrossRef] [PubMed]
  35. Rojas, C.M.; Senthil-Kumar, M. Regulation of primary plant metabolism during plant-pathogen interactions and its contribution to plant defense. Front. Plant Sci. 2014, 5, 1–12. [Google Scholar] [CrossRef] [PubMed]
  36. Bernier, F.; Berna, A. Germins and germin-like proteins: Plant do-all proteins. But what do they do exactly? Plant Physiol. Biochem. 2001, 39, 545–554. [Google Scholar] [CrossRef]
  37. Membré, N.; Bernier, F. Arabidopsis thaliana germin-like proteins: Common and specific features point to a variety of functions. Planta 2000, 211, 345–354. [Google Scholar] [CrossRef] [PubMed]
  38. Park, C.-J.; An, J.-M. Molecular characterization of pepper germin-like protein as the novel PR-16 family of pathogenesis-related proteins isolated during the resistance response to viral and bacterial infection. Planta 2004, 219, 797–806. [Google Scholar] [CrossRef]
  39. Zimmermann, G.; Bäumlein, H. The multigene family encoding germin-like proteins of barley. Regulation and function in basal host resistance. Plant Physiol. 2006, 142, 181–192. [Google Scholar] [CrossRef]
  40. Deeba, F.; Sultana, T. Involvement of WRKY, MYB and DOF DNA-binding proteins in interaction with a rice germin-like protein gene promoter. Acta Physiol. Plant. 2017, 39, 189. [Google Scholar] [CrossRef]
  41. Camejo, D.; Guzmán-Cedeño, Á. Reactive oxygen species, essential molecules, during plant-pathogen interactions. Plant Physiol. Biochem. 2016, 103, 10–23. [Google Scholar]
  42. Dunwell, J.M.; Gibbings, J.G. Germin and germin-like proteins: Evolution, structure, and function. Crit. Rev. Plant Sci. 2008, 27, 342–375. [Google Scholar] [CrossRef]
  43. Schweizer, P.; Christoffel, A. Transient expression of members of the germin-like gene family in epidermal cells of wheat confers disease resistance. Plant J. 1999, 20, 541–552. [Google Scholar] [CrossRef] [PubMed]
  44. Feder, M.E.; Hofmann, G.E. Heat-shock proteins, molecular chaperones, and the stress response: Evolutionary and ecological physiology. Annu. Rev. Physiol. 1999, 61, 243–282. [Google Scholar] [CrossRef] [PubMed]
  45. Ritossa, F. A new puffing pattern induced by temperature shock and DNP in Drosophila. Experientia 1962, 18, 571–573. [Google Scholar] [CrossRef]
  46. Tissiéres, A.; Mitchell, H.K. Protein synthesis in salivary glands of Drosophila melanogaster: Relation to chromosome puffs. J. Mol. Biol. 1974, 84, 389–398. [Google Scholar] [CrossRef]
  47. Neckers, L.; Tatu, U. Molecular chaperones in pathogen virulence: Emerging new targets for therapy. Cell Host Microbe 2008, 4, 519–527. [Google Scholar] [CrossRef] [PubMed]
  48. Bakthisaran, R.; Tangirala, R. Small heat shock proteins: Role in cellular functions and pathology. Biochim. Biophys. Acta (BBA) Proteins Proteom. 2015, 1854, 291–319. [Google Scholar] [CrossRef] [Green Version]
  49. Siedow, J.N. Plant lipoxygenase: Structure and function. Annu. Rev. Plant Biol. 1991, 42, 145–188. [Google Scholar] [CrossRef]
  50. Apel, K.; Hirt, H. Reactive oxygen species: Metabolism, oxidative stress, and signal transduction. Annu. Rev. Plant Biol. 2004, 55, 373–399. [Google Scholar] [CrossRef]
  51. Vick, B.A.; Zimmerman, D. Oxidative systems for modification of fatty acids: The lipoxygenase pathway. Biochem. Plants 1987, 9, 53–90. [Google Scholar]
  52. Feussner, L.; Wasternack, C. The lipoxygenase pathway. Annu. Rev. Plant Biol. 2002, 53, 275–297. [Google Scholar] [CrossRef] [PubMed]
  53. Bilgin, D.D.; Zavala, J.A. Biotic stress globally downregulates photosynthesis genes. Plant Cell Environ. 2010, 33, 1597–1613. [Google Scholar] [CrossRef] [PubMed] [Green Version]
  54. Scholes, J.; Lee, P. Photosynthetic metabolism in leaves infected with powdery mildew. Curr. Res. Photosynth. 1990, 4, 219–222. [Google Scholar]
  55. Swarbrick, P.J.; Schulze-lefert, P. Metabolic consequences of susceptibility and resistance (race-specific and broad-spectrum) in barley leaves challenged with powdery mildew. Plant Cell Environ. 2006, 29, 1061–1076. [Google Scholar] [CrossRef] [PubMed] [Green Version]
  56. Ling, J.; So, B.R. Resampling and editing of mischarged tRNA prior to translation elongation. Mol. Cell 2009, 33, 654–660. [Google Scholar] [CrossRef] [PubMed]
  57. Zaher, H.S.; Green, R. Quality control by the ribosome following peptide bond formation. Nature 2009, 457, 161–166. [Google Scholar] [CrossRef] [PubMed]
  58. Park, S.G.; Ewalt, K.L. Functional expansion of aminoacyl-tRNA synthetases and their interacting factors: New perspectives on housekeepers. Trends Biochem. Sci. 2005, 30, 569–574. [Google Scholar] [CrossRef] [PubMed]
  59. Henty-Ridilla, J.L.; Shimono, M. The plant actin cytoskeleton responds to signals from microbe-associated molecular patterns. PLoS Pathog. 2013, 9, e1003290. [Google Scholar] [CrossRef] [PubMed]
  60. Bradford, M.M. A rapid and sensitive method for the quantitation of microgram quantities of protein utilizing the principle of protein-dye binding. Analy. Biochem. 1976, 72, 248–254. [Google Scholar] [CrossRef]
  61. Candiano, G.; Bruschi, M. Blue silver: A very sensitive colloidal Coomassie G-250 staining for proteome analysis. Electrophoresis 2004, 25, 1327–1333. [Google Scholar] [CrossRef]
  62. Balaji, B.; Bucholtz, D.B. Barley yellow dwarf virus and Cereal yellow dwarf virus quantification by real-time polymerase chain reaction in resistant and susceptible plants. Phytopathology 2003, 93, 1386–1392. [Google Scholar] [CrossRef] [PubMed]
  63. Livaka, K.J.; Schmittgen, T.D. Analysis of relative gene expression data using real-time quantitative PCR and the 2−ΔΔCT method. Methods 2001, 25, 402–408. [Google Scholar] [CrossRef] [PubMed]
Figure 1. Different responses of wheat leaves to Blumeria graminis f. sp. tritici (Bgt) infection after six days. (a) Susceptible wheat cultivar Chuannong26. (b) Resistant wheat cultivar L699. (c) Resistant wheat cultivar Neimai836.
Ijms 20 00933 g001
Figure 2. Microscopic observations of wheat-Bgt interactions on the leaf surface. The development of Bgt at 2, 4, 8, 12, and 24 hpi in wheat cultivars Chuannong26 (A), L699 (B), and Neimai836 (C). PGT: primary germ tube, AGT: appressorium germ tube, APP: appressorium, PP: penetration peg, H: haustorium and L: lobe. Scale bar: 20 μm.
Ijms 20 00933 g002
Figure 3. Number of proteins differentially expressed after powdery mildew infection at different time points.
Ijms 20 00933 g003
Figure 4. Differences in protein expression between resistant wheat cultivar L699 wheat with and without powdery mildew infection. (a) Upregulated proteins are labeled in the representative 2-DE gel of Bgt-inoculated L699 wheat at 24 hpi. (b) Downregulated proteins are labeled in the representative 2-DE gel of mock-inoculated L699 wheat at 24 hpi. Red, 2 hpi; purple, 4 hpi; green, 8 hpi; yellow, 12 hpi; black, 24 hpi.
Ijms 20 00933 g004
Figure 5. Differences in protein expression between resistant wheat cultivar Neimai836 wheat with and without powdery mildew infection. (a) Upregulated proteins are labeled in the representative 2-DE gel of Bgt-inoculated Neimai836 wheat at 12 hpi. (b) Downregulated proteins are labeled in the representative 2-DE gel of mock-inoculated Neimai836 wheat at 12 hpi. Red, 2 hpi; purple, 4 hpi; green, 8 hpi; yellow, 12 hpi; black, 24 hpi.
Ijms 20 00933 g005
Figure 6. Differences in protein expression between susceptible wheat cultivar Chuannong26 wheat with and without powdery mildew infection. (a) Upregulated proteins are labeled in the representative 2-DE gel of Bgt-inoculated Chuannong26 wheat at 24 hpi. (b) Downregulated proteins are labeled in the representative 2-DE gel of mock-inoculated Chuangnong26 wheat at 24 hpi. Red, 2 hpi; purple, 4 hpi; green, 8 hpi; yellow, 12 hpi; black, 24 hpi.
Ijms 20 00933 g006
Figure 7. Quantification of six gene transcripts and protein levels at different time points post inoculation with Bgt in wheat. The bar graph shows the fold changes of the mRNA expression levels in inoculation vs control samples at five time points. The blue, red, and green columns are representatives of wheat L699, Neimai836, and Chuannong26, respectively. The lines show the fold changes of the protein expression levels in inoculation vs control samples at five time points. The blue, red, and green lines are representatives of wheat L699, Neimai836, and Chuannong26, respectively. The mRNA expression levels were quantified by qRT-PCR normalized against 18S rRNA. Asterisks indicate statistically significant differences (*, p < 0.05; **, p < 0.01) of mRNA expression levels between the inoculation and control samples.
Ijms 20 00933 g007
Table 1. Identification of differentially upregulated proteins in wheat resistance cultivar L699 by MALDI-TOF-MS.
SpotProtein NameAccessionMatched PeptidesMW/PIScoreTime (h)
Proteins involved in disease defense response
3Lipoxygenase 2.1, chloroplasticgi|47394812221105625.33/5.7018512
4Lipoxygenase 2.1, chloroplasticgi|47394812241105625.33/5.7059112
5Lipoxygenase 2.1, chloroplasticgi|47394812217105625.33/5.7019612
29Lipoxygenase 1gi|4743991751696333.65/5.912998
32Heat shock cognate 70 kDa protein 1gi|4740125733771123.58/5.066418
61Germin-like protein 8-14gi|473963025421939.25/5.3617424
Photosynthesis-related proteins
11Ribulose-1,5-bisphosphate carboxylase activase, partialgi|377832831022336.08/4.983098, 12
28Ribulose bisphosphate carboxylase small chain, chloroplasticgi|4738823551418526.35/8.6520812
33RuBisCO large subunit-binding protein subunit alpha, chloroplasticgi|4741139693465380.60/5.178648
36Ribulose-1,5-bisphosphate carboxylase activase, partialgi|377832831022336.08/4.983304
37Photosystem II cytochrome b559 alpha subunit (chloroplast)gi|69997601969444.60/4.641964
44Ribulose bisphosphate carboxylase small chain PWS4.3, chloroplasticgi|132087219417.36/8.99924, 8
Proteins involved in Signal transduction
2414-3-3 proteingi|4318225201629264.88/4.8343412
Carbohydrate metabolism-related proteins
6Beta-d-glucan exohydrolasegi|202596851467301.15/6.877412
10Glucose-1-phosphate adenylyltransferasesmall subunit, chloroplastic/amyloplasticgi|4741082932364723.14/7.9126612
13Phosphoglycerate kinasegi|32930431649839.53/6.575808, 12
14Glycerophosphodiester phosphodiesterase GDE1gi|4738479561352899.68/5.694312
18Fructose-bisphosphate aldolase, chloroplasticgi|4738483561542002.99/5.9435812
38Phosphoribulokinasegi|59240302245141.39/5.725878
50Phosphoglucomutase, cytoplasmicgi|4737630331863499.68/5.143022, 24
51Phosphoglucomutase, partialgi|180767901562789.15/5.6621824
546-phosphogluconate dehydrogenase, decarboxylatinggi|4743798722381169.95/8.5660824
55Cytosolic 3-phosphoglycerate kinase, partialgi|281729111631334.35/4.982918, 24
Proteins involved in energy pathway
9Vacuolar proton-ATPase subunit Agi|900250173768454.90/5.2358312
17ATP synthase CF1 beta subunit (chloroplast)gi|6676699973353857.48/5.0612004
39Ferredoxin-NADP(H) oxidoreductasegi|203024731040232.03/6.921208
Proteins involved in gene expression and DNA remodeling
15Guanine nucleotide-binding protein subunit beta-likegi|473957859627150.69/6.2921112
Proteins involved in protein turnover
8ATP-dependent zinc metalloprotease FTSH 1, chloroplasticgi|4743505162954477.49/5.5867312
2750S Ribosomal protein L12-2, chloroplasticgi|4755322451021837.90/5.3545212
30Tyrosine phosphorylation protein Agi|5483193652574252.07/6.614348
345-methyltetrahydropteroyltriglutamate-Homocysteine methyltransferasegi|4739933021484552.49/5.744238
355, 10-methylene-tetrahydrofolate reductasegi|1155897421264875.07/5.86838
4020 kDa chaperonin, chloroplasticgi|4744075121029710.03/6.761548
47Putative alanyl-tRNA synthetase, chloroplasticgi|47414255512111648.20/5.6219824
48ATP-dependent Clp protease ATP-binding subunit ClpA-like protein CD4B, chloroplasticgi|4742417743382735.21/5.1651312, 24
49Lysyl-tRNA synthetasegi|4741477028132545.46/6.289224
52Putative mitochondrial-processing peptidase subunit betagi|4741422813043290.34/5.4148624
53Adenosylhomocysteinasegi|474154141845700.84/6.485624
56Cysteine synthasegi|4743159861335583.27/5.8221612, 24
60Ribosome-recycling factor, chloroplasticgi|4740430781524770.60/8.9250424
Cell structure-related proteins
12Actin-3gi|4742595831844367.62/5.263768, 12
Proteins of unknow function
2Hypothetical protein TRIUR3_05354gi|47375534227104676.25/5.873682, 12
26Unnamed protein productgi|669029445418152.74/5.6024412
58Hypothetical protein TRIUR3_21449gi|4743846871432942.26/9.3112924
59Unnamed protein productgi|6690277041326818.76/5.5733524
63Unnamed protein productgi|669029445518152.74/5.6026924
Table 2. List of primers used for qRT-PCR amplification.
SpotProtein NameAccession No.Primer Sequence 5′-3′
Reference gene18S rRNAAY049040Sense: 5′-GTGACGGGTGACGGAGAATT-3′
Antisense: 5′-GACACTAATGCGCCCGGTAT-3′
9Vacuolar proton-ATPaseABD85016Sense: 5′-TATGAACGTGCTGGGAAGGT-3′
Antisense: 5′-GGGTTGCAGAGGTAACAGGA-3′
18Fructose-bisphosphate aldolaseEMS47455Sense: 5′-TCTTGTCTGGTGGTCAGTCG-3′
Antisense: 5′-CGTCTTGAGGCAGGTGTTCT-3′
13Phosphoglycerate kinaseCAA51931Sense: 5′-AATGGTGCTGTTTTGCTCCT-3′
Antisense: 5′-TGTTCCGAATGCATCGTTTA-3′
36Ribulose-1,5-bisphosphate carboxylase activaseAAP72270Sense: 5′-ACGGACCAGTGACCTTTGAG-3′
Antisense: 5′-ACCAGTCTTCATCGCATCCT-3′
345-methyltetrahydropteroyltriglutamate-homocysteine methyltransferaseEMS51950Sense: 5′-TGTGTTCTGGTCCAAGATGG-3′
Antisense: 5′-CTCAAACCTCGGTTGGTCAT-3′
61Germin-like protein 8-14EMS51159Sense: 5′-TGCAGATCACCGACTACGC-3′
Antisense: 5′-CACGGACTTGAGCTTCTTGAC-3′

