1. Introduction
Wood-colonising fungi are known to have unique biochemical pathways enabling them to assimilate a vast array of simple and complex nutrients and to produce a variety of metabolites. Most wood decay fungi are strictly saprotrophic, utilising dead wood as a food base. However, there are commonly known parasitic species of fungi (pathogens) growing and producing sporophores on living trees [
1]. Elucidation of the mechanism of biological wood decay is not only important ecologically due to the role in the carbon and nitrogen cycle, but also has economic significance and plays a beneficial role in human life [
2]. The environmental impact of saprotrophic fungi arises from their metabolic versatility, which includes the production of a wide range of enzymes directly or indirectly involved in the degradation of organic residues [
3]. Individual wood-decomposing fungus produces various enzymes, degrades different plant material, and colonises diverse ecological niches. Therefore, understanding the physiology of wood-degrading fungi and the ability to affect their metabolic potential may have far-reaching impact for not only future research directions but also human life.
In nature, efficient lignocellulose degradation, which occurs during the process of wood decay, is mainly achieved by the activity of white rot basidiomycetes. As known, environmental factors greatly influence decay caused by white rot fungi [
4], and light is one of the most important signals for every living cell. Sunlight serves as either a source of energy or information from the environment and can be considered crucial for successful competition, survival, and development in nature [
5]. In fungi, light controls developmental decisions, stress response, and physiological adaptations as well as the circadian clock. To sense light, only a few photoreceptor systems have developed during evolution, comprising flavin-based blue-light, retinal-based green-light (such as rhodopsin), and linear tetrapyrrole-based red-light sensors [
6]. All these major classes of photoreceptors are found in fungi suggesting that they can detect specific wavelengths by discrete receptor proteins [
7].
The emergence of high throughput next-generation sequencing (NGS) techniques has accelerated the discovery of novel genes and has provided an opportunity to further explore and understand the differential gene expression at the genomic and transcriptional level. Since the first published transcriptome study [
8], an increasing number of transcriptomes of wood decay basidiomycetes have been reported [
9,
10,
11,
12,
13,
14]. In contrast to the static genome, the transcriptome reflects the differential gene expression in response to developmental or environmental factors, which constitute a dynamic link between an organism’s genome and its physical characteristics [
15,
16,
17]. Transcriptome analysis performed recently for
Cerrena unicolor, a wood-degrading basidiomycete with great importance in biotechnology and medicine [
18,
19,
20], revealed differential expression of genes coding for proteins engaged in degradation of various kinds of wood [
14]. Moreover, the dependence of
C. unicolor cultivation in different lighting conditions and synthesis of certain enzymes has also been demonstrated [
21].
Here, we report a comparative transcriptome analysis based on high throughput RNA sequencing experiment of C. unicolor FCL139 cultivated in different lighting conditions. Our results provide a comprehensive dataset for analysis of transcriptional profile changes occurring in fungal cells in response to variable lighting conditions, contributing to better understanding of C. unicolor photobiology and light dependent metabolism and behaviour of this environmentally and commercially important fungus.
3. Discussion
Reaction of fungi to illumination is multidirectional, and light can significantly enhance their fitness [
5]. Despite the knowledge about the prevalence of photoreceptors in fungi, the influence of light on metabolic processes has not been investigated in detail in most cases. The analyses of fungi response to light is predominantly restricted to white light or daylight effects vs. darkness as the most extreme values [
5,
7]. In this work, transcriptomic response to the different wavelengths of light was studied in
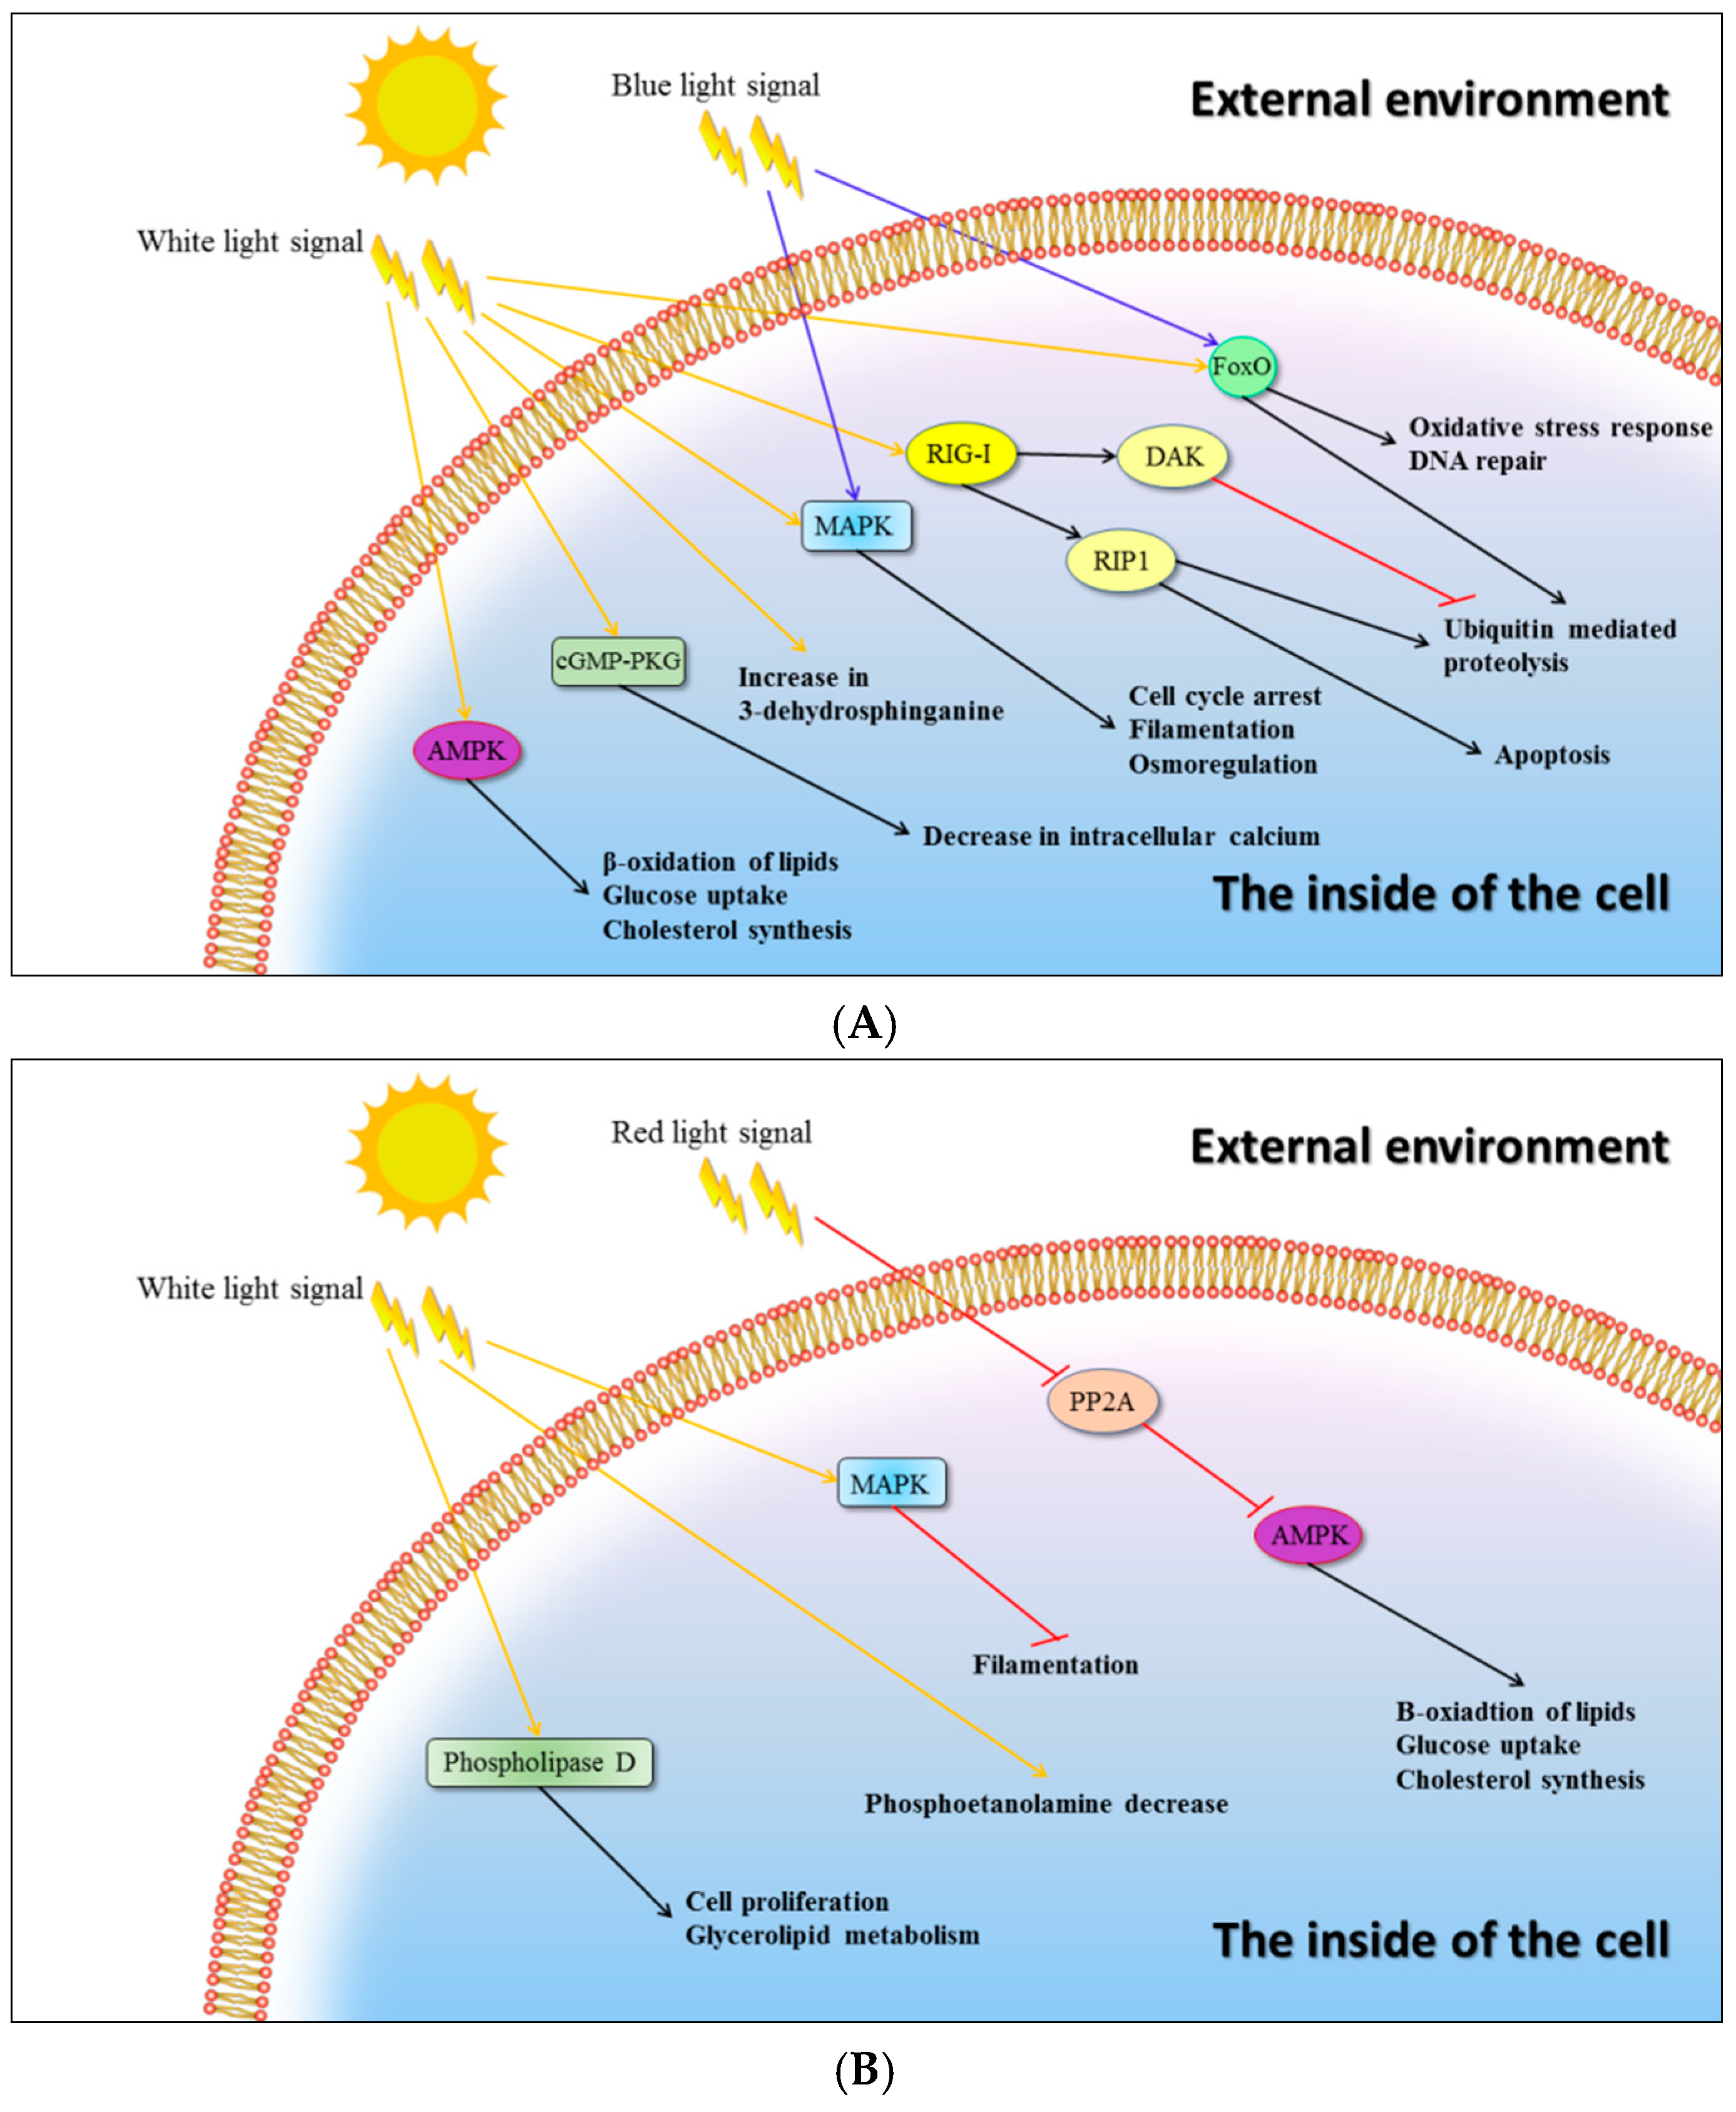
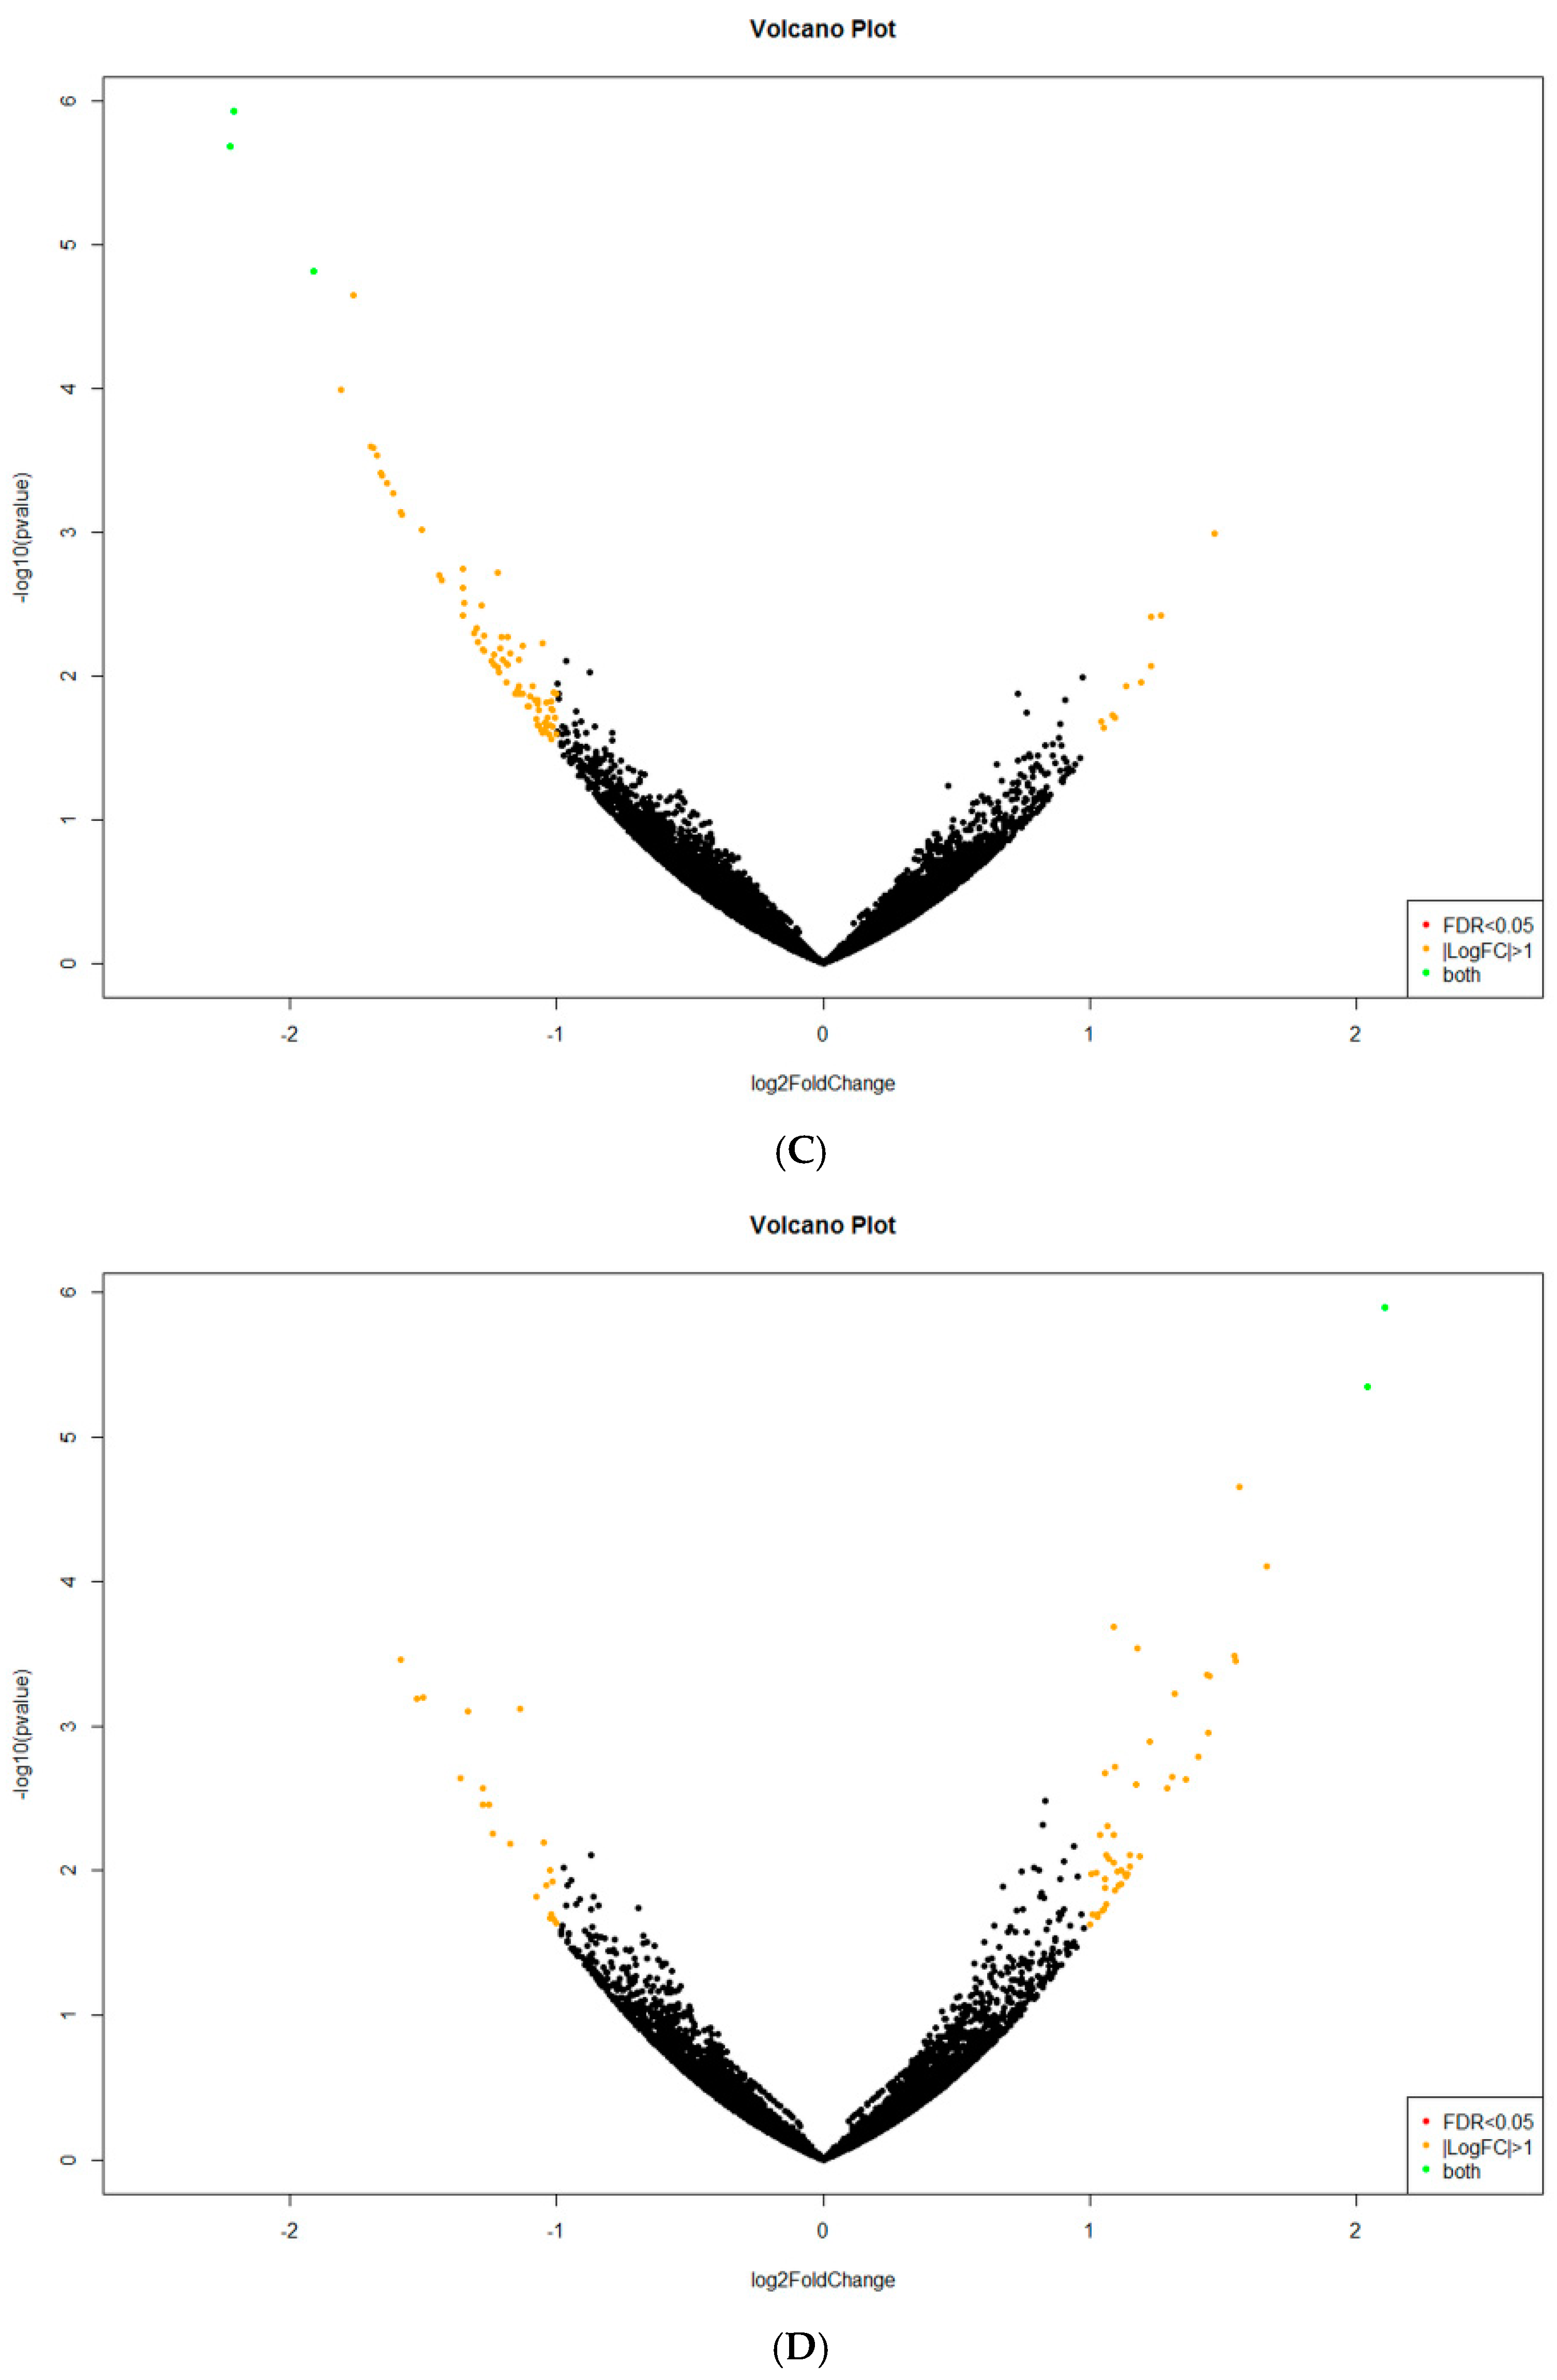
C. unicolor FCL139. From 20 to 112 transcripts were found to be specific to one of the culturing conditions, suggesting that
C. unicolor can respond to specific light wavelengths in different manner. This observation is in agreement with the previous studies and the finding that even significant number of transcribed genes of organisms may be engaged in response to light [
5,
23]. In
N. crassa, 31% of the expressed genes were affected two-fold or more by exposure to light [
24]. Among all assigned unigenes of
C. unicolor, those coding for putative photoreceptor proteins were found. The presence of transcripts coding for putative proteins similar to
N. crassa white collar proteins and cryptochromes,
C. purpureus phytochromes, and
T. versicolor opsins suggests that
C. unicolor is able to sense from blue to far-red light. The similarity of
C. unicolor receptors to plant phytochromes may be surprising. It should be noticed that no phytochrome-like light sensor protein has been characterised in basidiomycetes, and plants and fungi share the same structure of the conserved photosensing region of the receptor [
25], which may suggest an unusual structure of the carboxy-terminal domain in
C. unicolor.
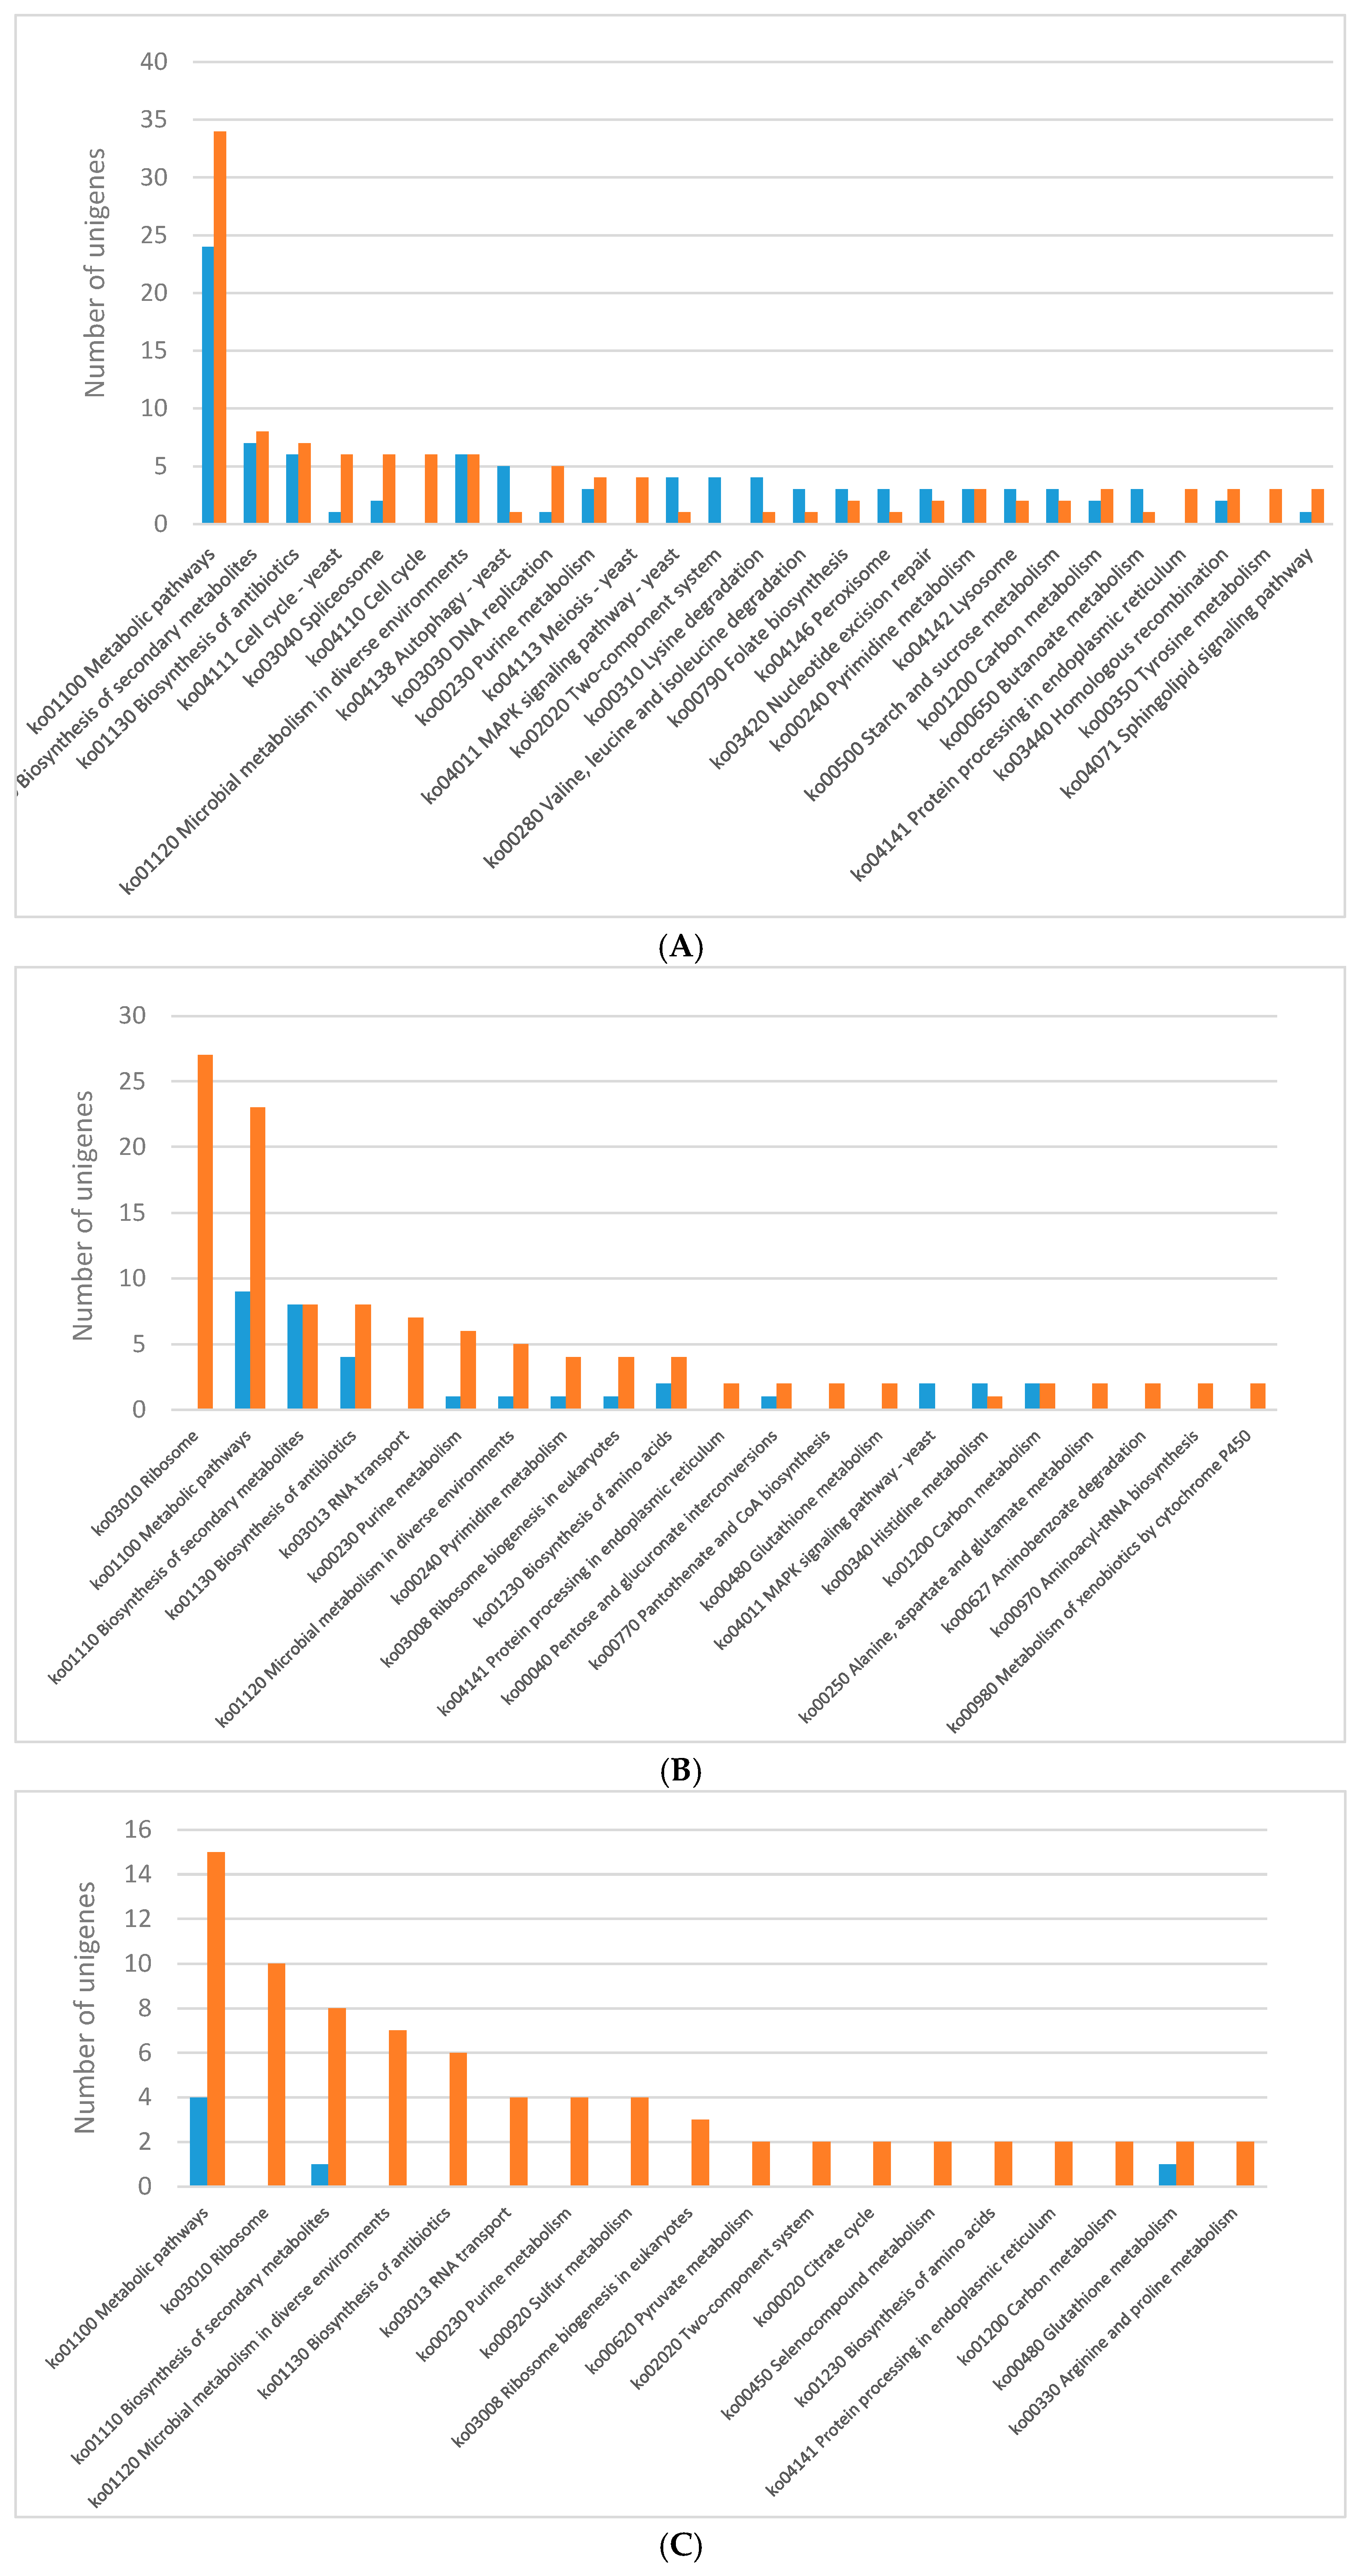
The analysis of DEGs performed for
C. unicolor revealed numerous genes whose expression varies considerably during fungus growth. The KEGG pathway analysis of differentially expressed genes revealed significant enrichment of metabolic pathways indicating that light influenced mainly primary metabolism of
C. unicolor. The expression of genes engaged in metabolic pathway was mostly down-regulated in each of the analysed lighting variant except for blue light. Concomitantly, in white light conditions, up-regulation of genes engaged in amino acid degradation, autophagy, nucleotide repair systems, signalling pathways, and carotenoid metabolism was observed. In turn, 319 differentially expressed carbohydrate-active enzymes participated in carbon metabolism were identified in
Pleurotus eryngii under blue light stimulation [
26]. In
N. crassa, light increased cellular metabolism causing simultaneously significant oxidative stress to the organism. In response to this stress, protective photopigments and antioxidants were produced, and genes involved in ribosome biogenesis were transiently repressed [
24]. The number of down-regulated genes related to ribosome biogenesis was also observed in the
C. unicolor mycelia grown in the blue and green light. In
Aspergillus ornatus, glucose metabolism was decreased by light prior to production of conidia [
5]. While blue light is a commonly known signal triggering up-regulation of carotenogenesis [
27], the red light induction of genes related to respective pathway was observed in
C. unicolor. Transcriptome analysis of
Cordyceps militaris albino mutant and its sibling strain revealed that the previously identified photoreceptors were expressed similarly in response to light. Both strains shared 235 DEGs after the light treatment and all DEGs were grouped into three functional categories: biological processes, cellular components, and molecular functions [
28]. Similar discrepancies in the metabolism in different fungal species were previously reported in two model organisms:
N. crassa and
Aspergillus nidulans [
29]. Light triggers significant expressional changes within the first 24–48 h in
A. nidulans and darkness results in a massive transcriptional reprogramming of gene expression [
30].
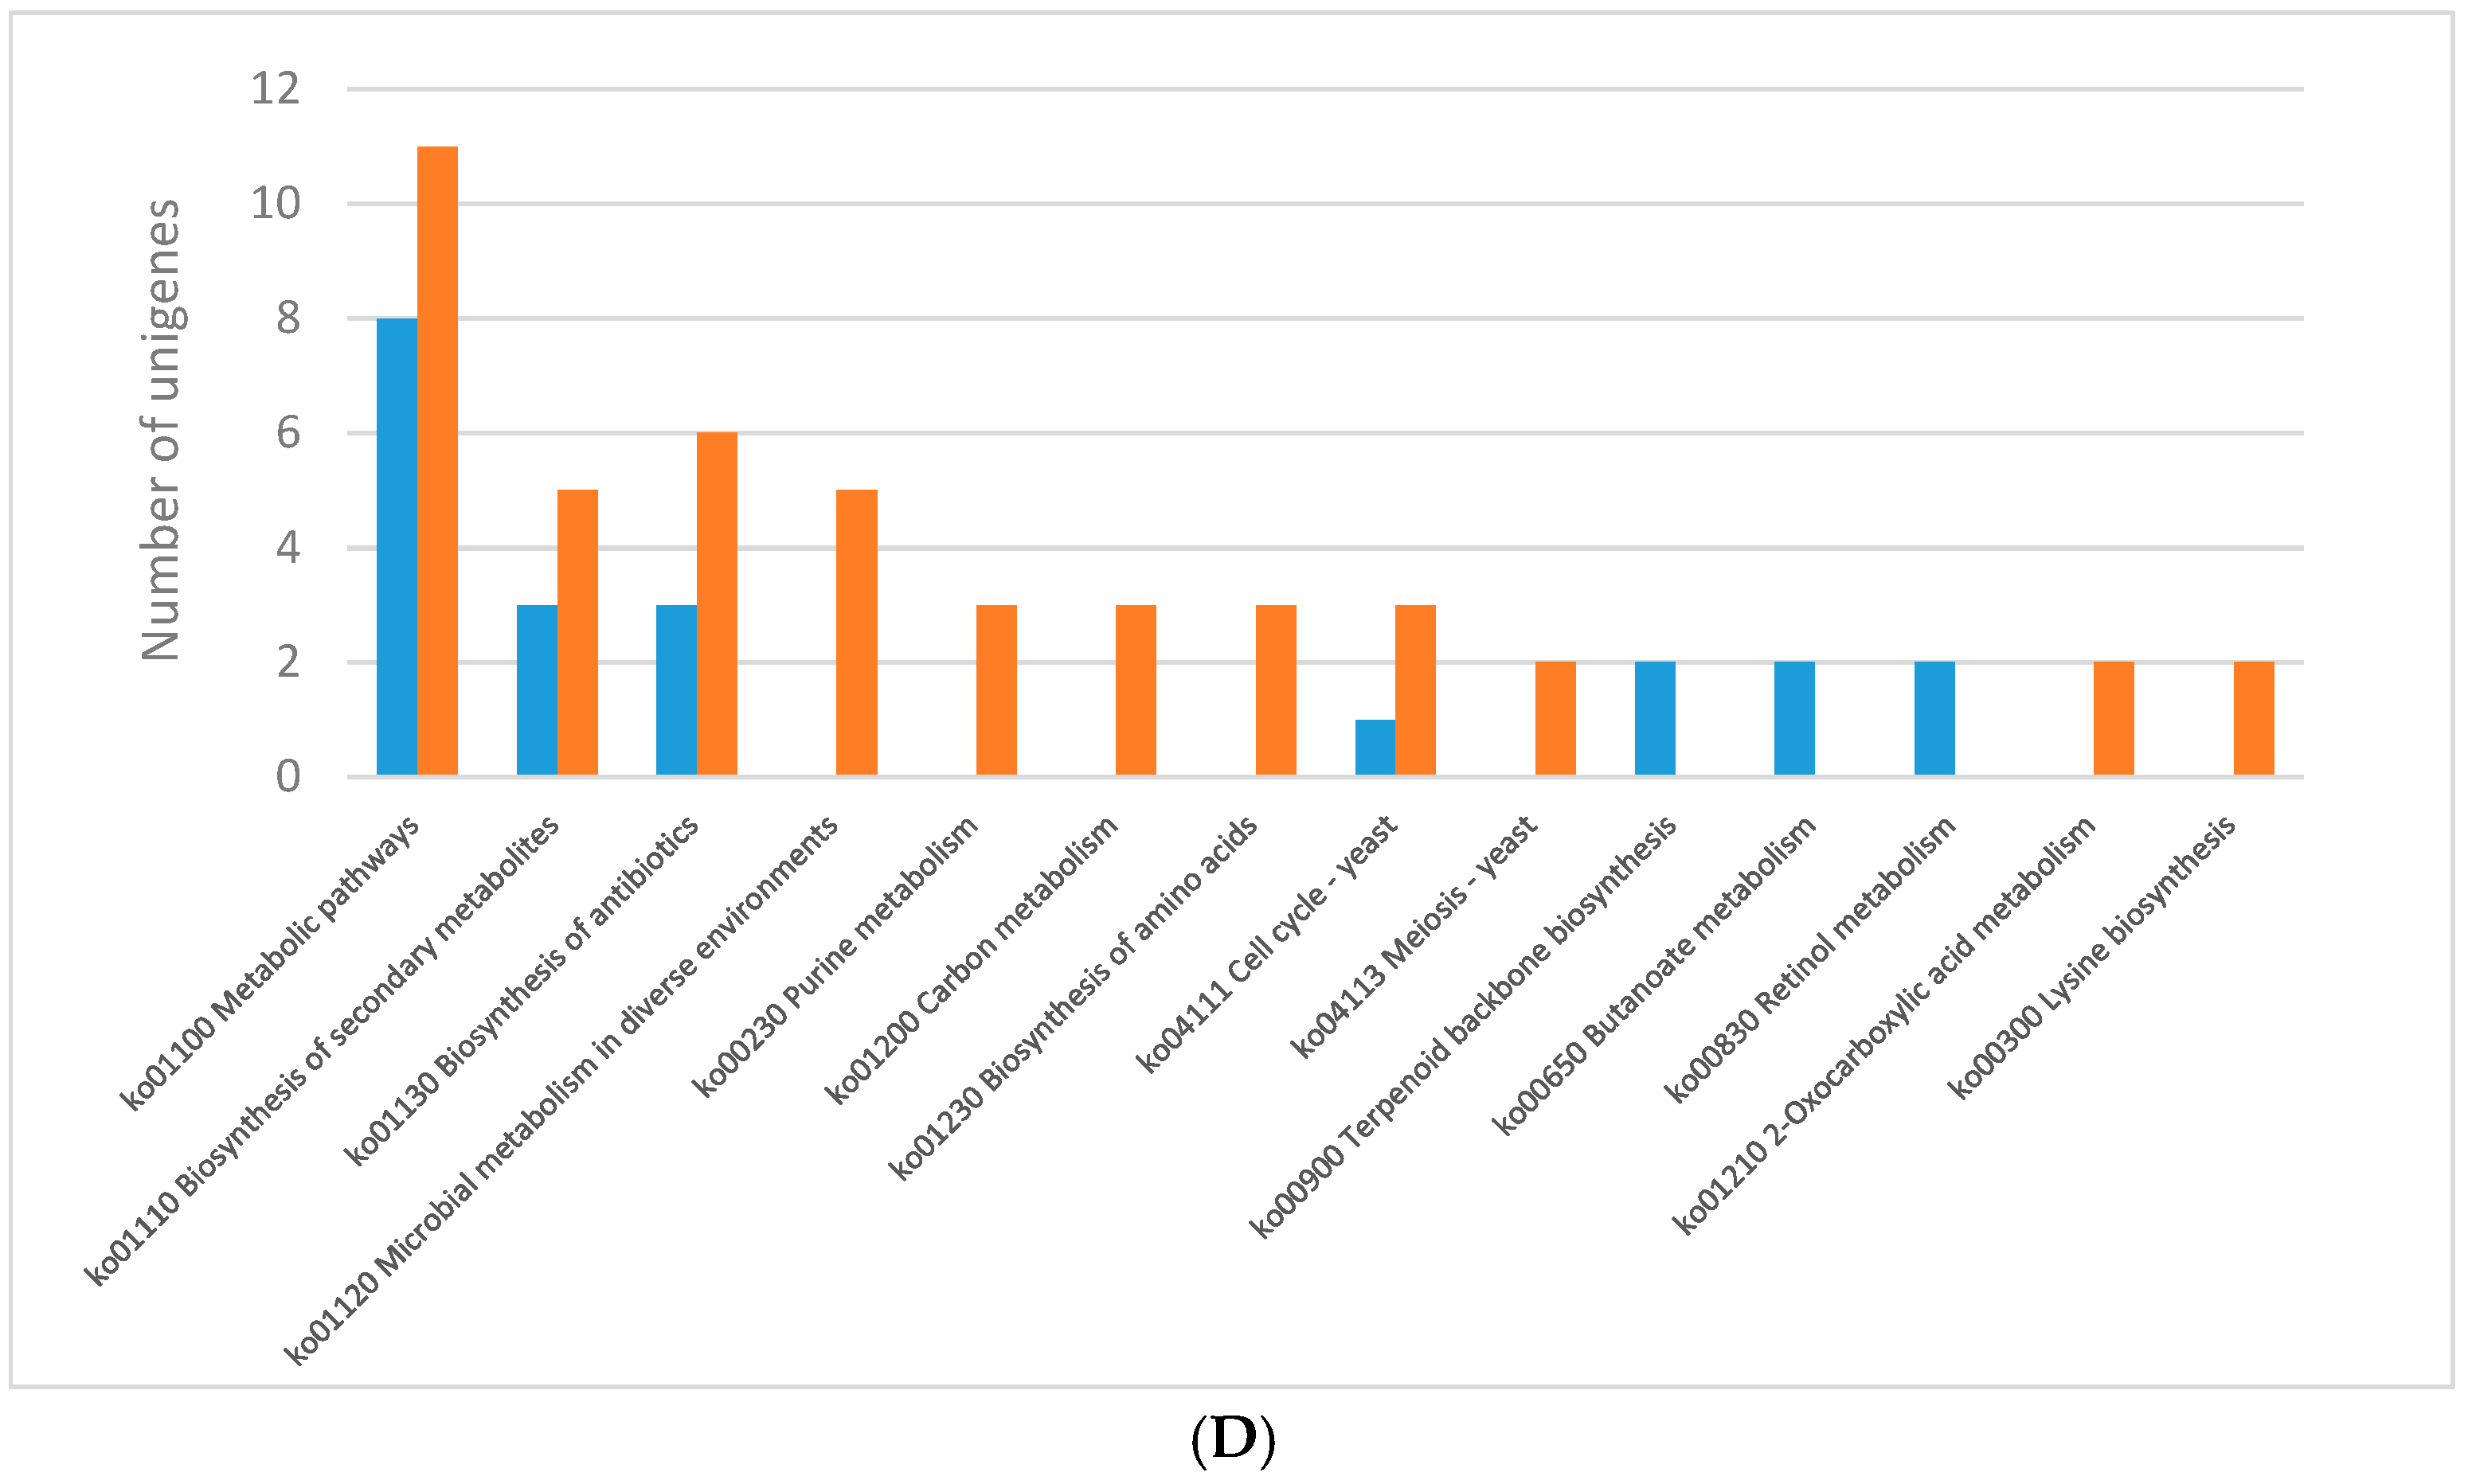
In
Trichoderma reesei cultivated in darkness, significant increase in transcripts coding for cellulases was observed [
31]. This phenomenon may be regulated by cAMP-dependent protein kinase (PKA), which influences cellulase synthesis positively in light and negatively in dark conditions. In
C. unicolor positive changes in the number of transcripts involved in the AMPK pathway was observed in white lighting. However, only one transcript coding for cellulase was found to be up-regulated in these conditions. Tang et al. [
32] proved that light-induced brown film formation in
Lentinula edodes occurred via MAPK and a two-component system, with possible engagement of white collar proteins or phytochromes. Our results show that both pathways (AMPK and MAPK based) were induced by the white light in
C. unicolor. Moreover, up-regulation of genes coding for cytochrome P-450 and monooxygenase by the red and blue light, respectively, which was observed in our analysis, seem to support the role of putative white collar proteins or phytochromes in AMPK and MAPK based signal transduction. Phytochromes as red light receptors were also reported to be involved in regulation of secondary metabolism in
A. nidulans [
33] and our data suggest that synthesis of several enzymes involved in secondary metabolism was induced by the light of same wavelength. Furthermore, in
C. unicolor, the MAPK pathway induction by the white light resulted in enhanced filamentation, which was proved to be a stress response in bacteria to DNA damage [
34]. MAPK was suggested to play an important role as part of the DNA repair system in
Trichoderma atroviride [
35]. In turn, PP2A was proved to be part of the FREQUENCY(FRQ)-based oscillator with circadian properties in
N. crassa [
36]. PP2A expression was down-regulated by red light in our experiment, raising the possibility that
C. unicolor is sensitive to day-night changes.
Recently reported comparative transcriptomic analysis of
C. unicolor performed in uncontrolled lighting conditions revealed differential expression of genes engaged in wood degradation during fungus growth on ash, maple, and birch sawdust, and significant differences were observed for cellulase-coding genes [
14]. Currently, transcripts of genes coding for cellulases, hemicellulases, and lignin-modifying enzymes were found during fungus growth on ash sawdust medium in all lighting conditions, which may suggest that wood-degradation properties of
C. unicolor depend on the medium applied rather than lighting conditions [
14,
37]. The high number of transcripts related to wood degradation observed during fungus growth in the white light may have resulted from the overall stimulation of its metabolism by daylight [
38]. It has been demonstrated recently that blue light efficiently boosted laccase synthesis in
C. unicolor and
Pycnoporus sanguineus, whereas in
Phlebia lindtneri the highest laccase activity were observed in green lighting conditions in LH or cellulose-based medium [
21]. Laccase was also up-regulated 10 h after blue light exposure in
Coprinopsis cinerea [
39]. On the contrary, green light efficiently inhibited laccase in other
P. sanguineus strains and maximum enzyme activity was noticed in the darkness [
40].
In conclusion, understanding how C. unicolor and other fungi sense the environment is of intellectual, industrial, and medicinal importance. The detection of transcripts encoding for putative fungal photoreceptors in C. unicolor transcriptome strongly suggests that the fungus can sense light and respond to various wavelength of light in a slightly diverse manner, by changing its overall metabolism. The up-regulation of gene expression of several signalling pathways, which can be considered as a hub integrating and transducing various environmental signals, implies that light together with other factors may affect cellular processes of the fungus.

 ,
, 


