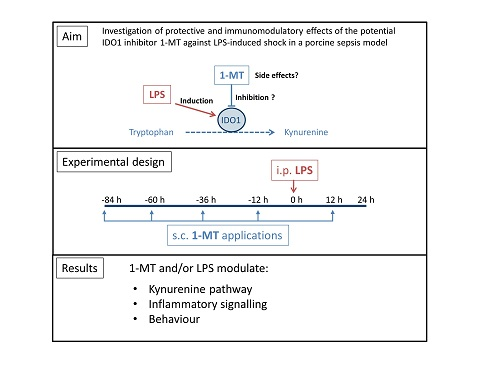
Effects of 1-Methyltryptophan on Immune Responses and the Kynurenine Pathway after Lipopolysaccharide Challenge in Pigs

 , , , , ,
Abstract
: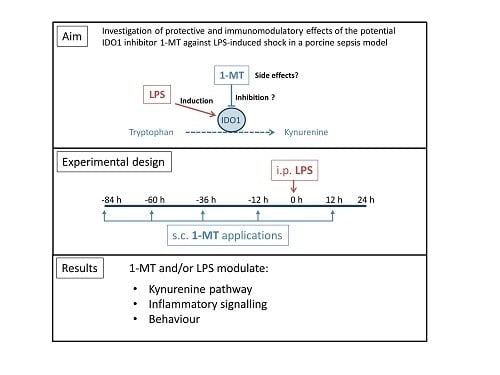
1. Introduction
2. Results
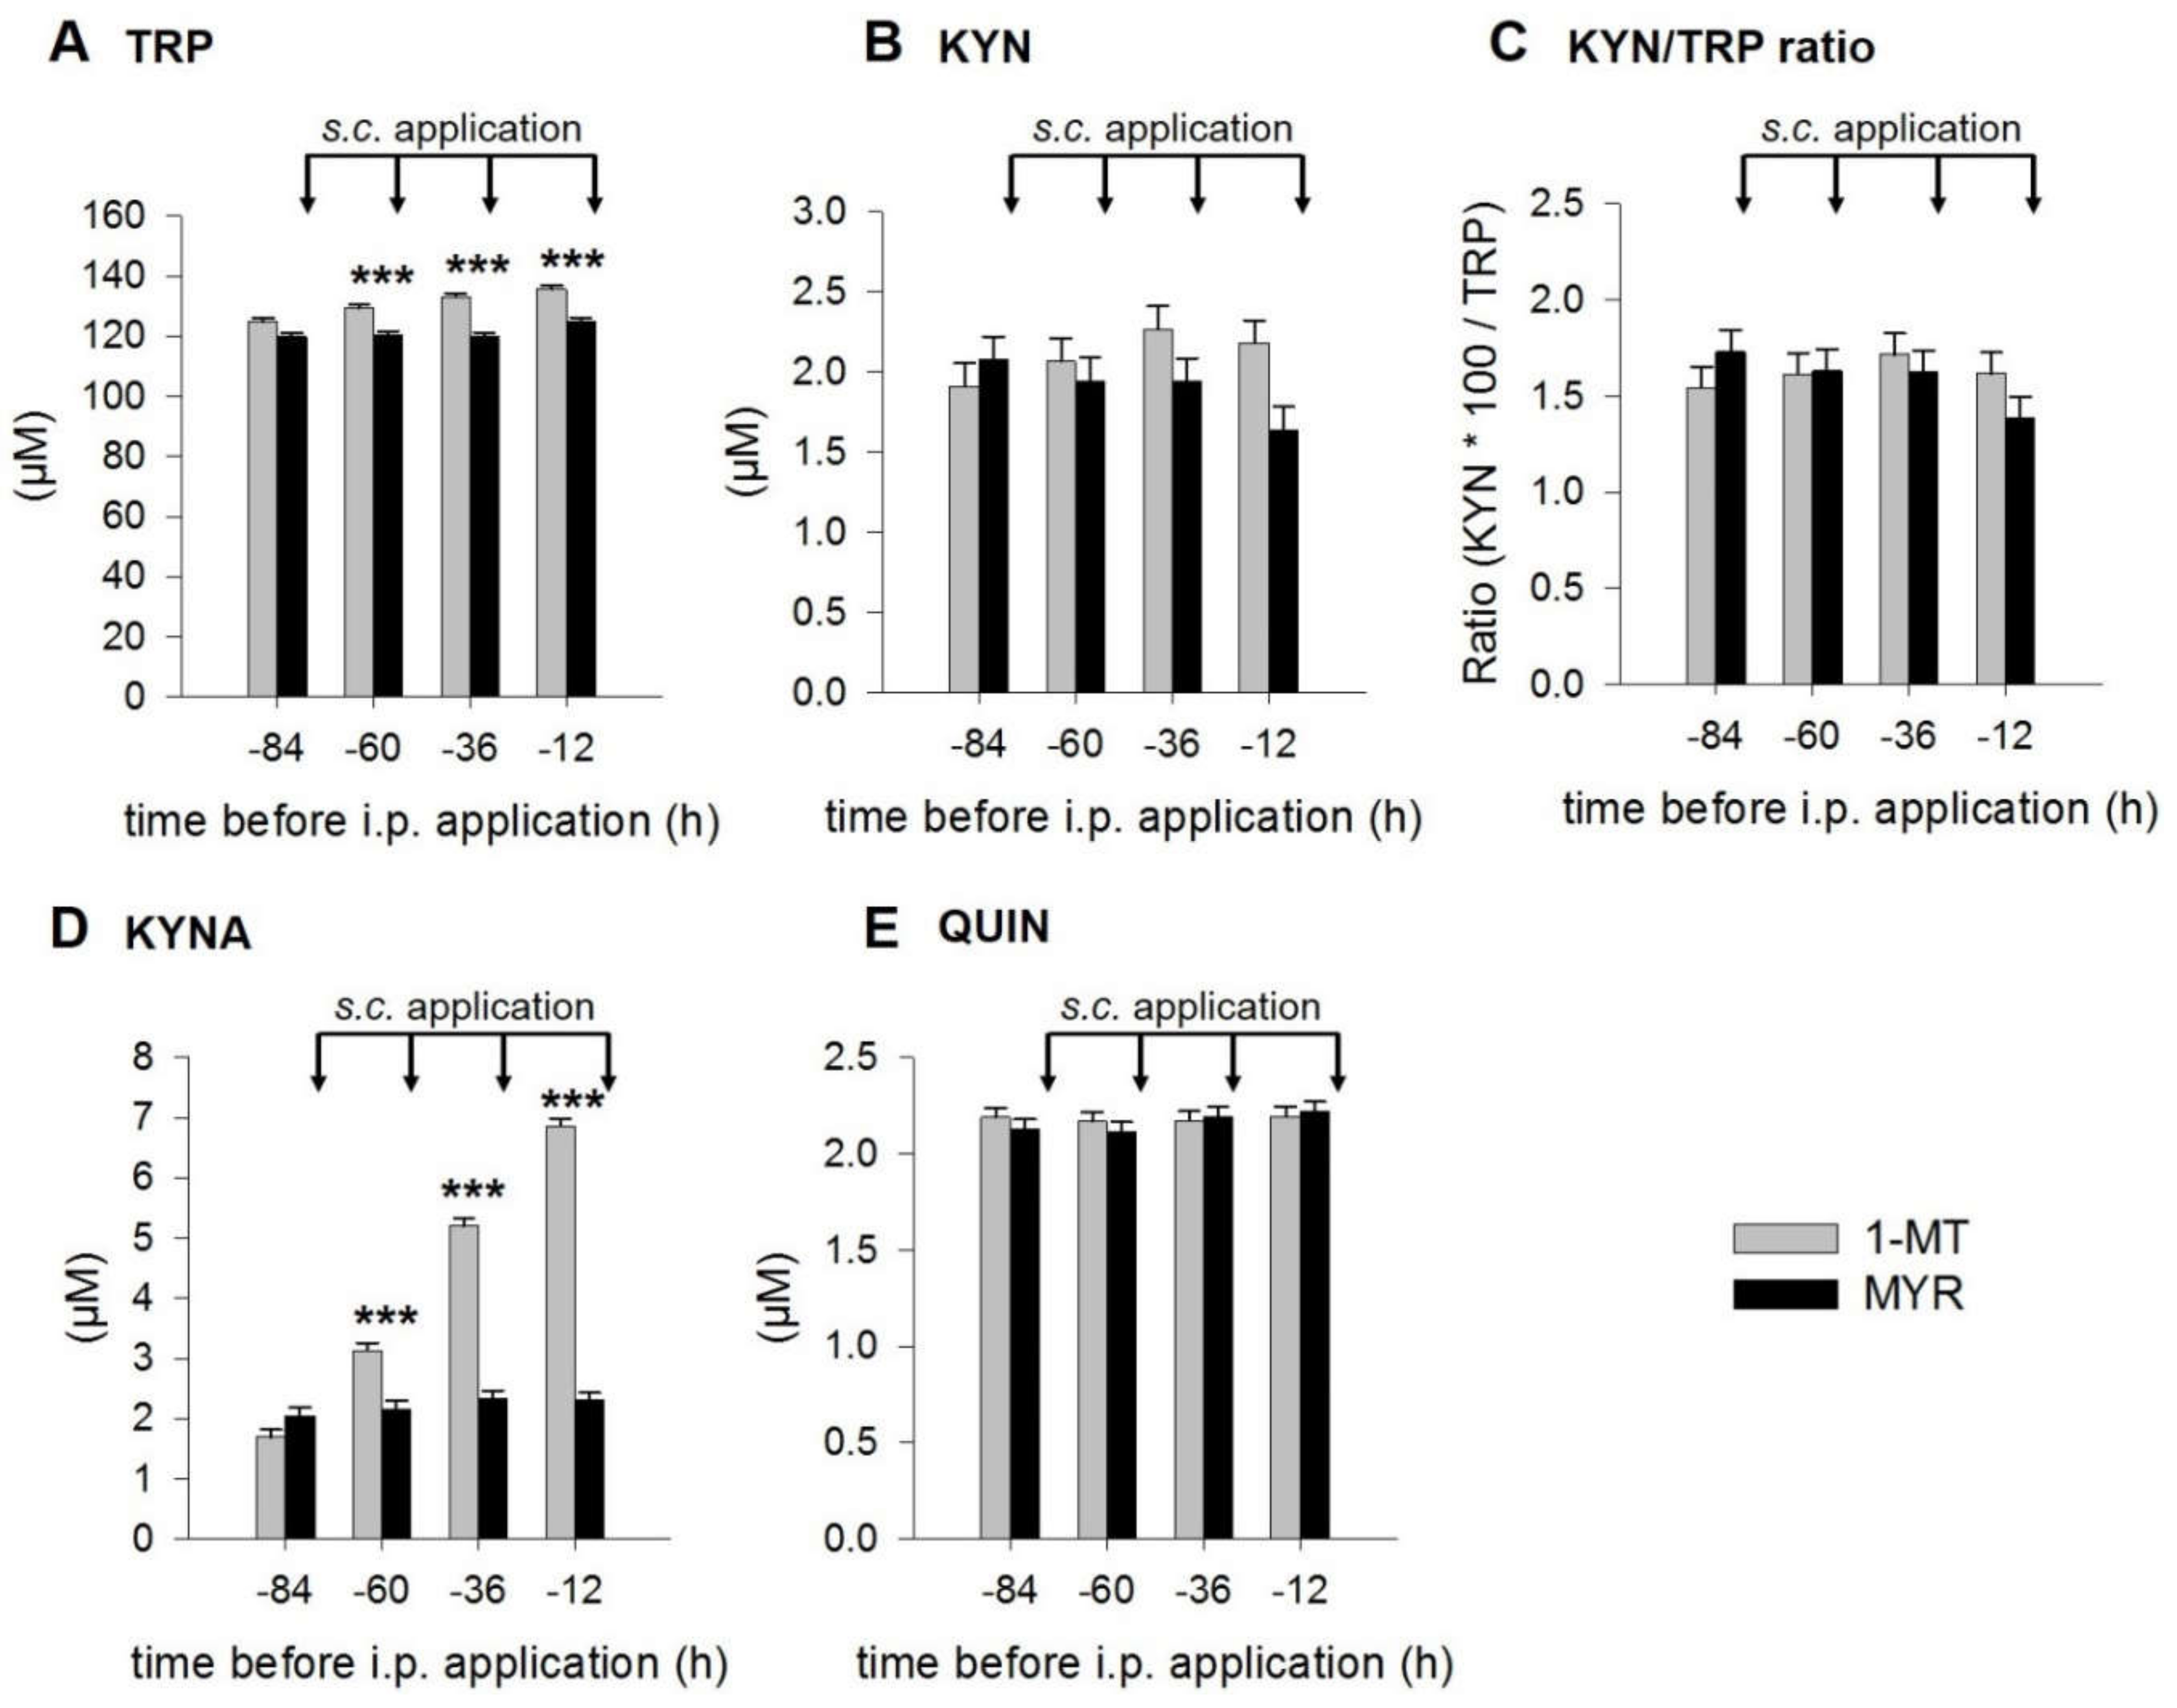
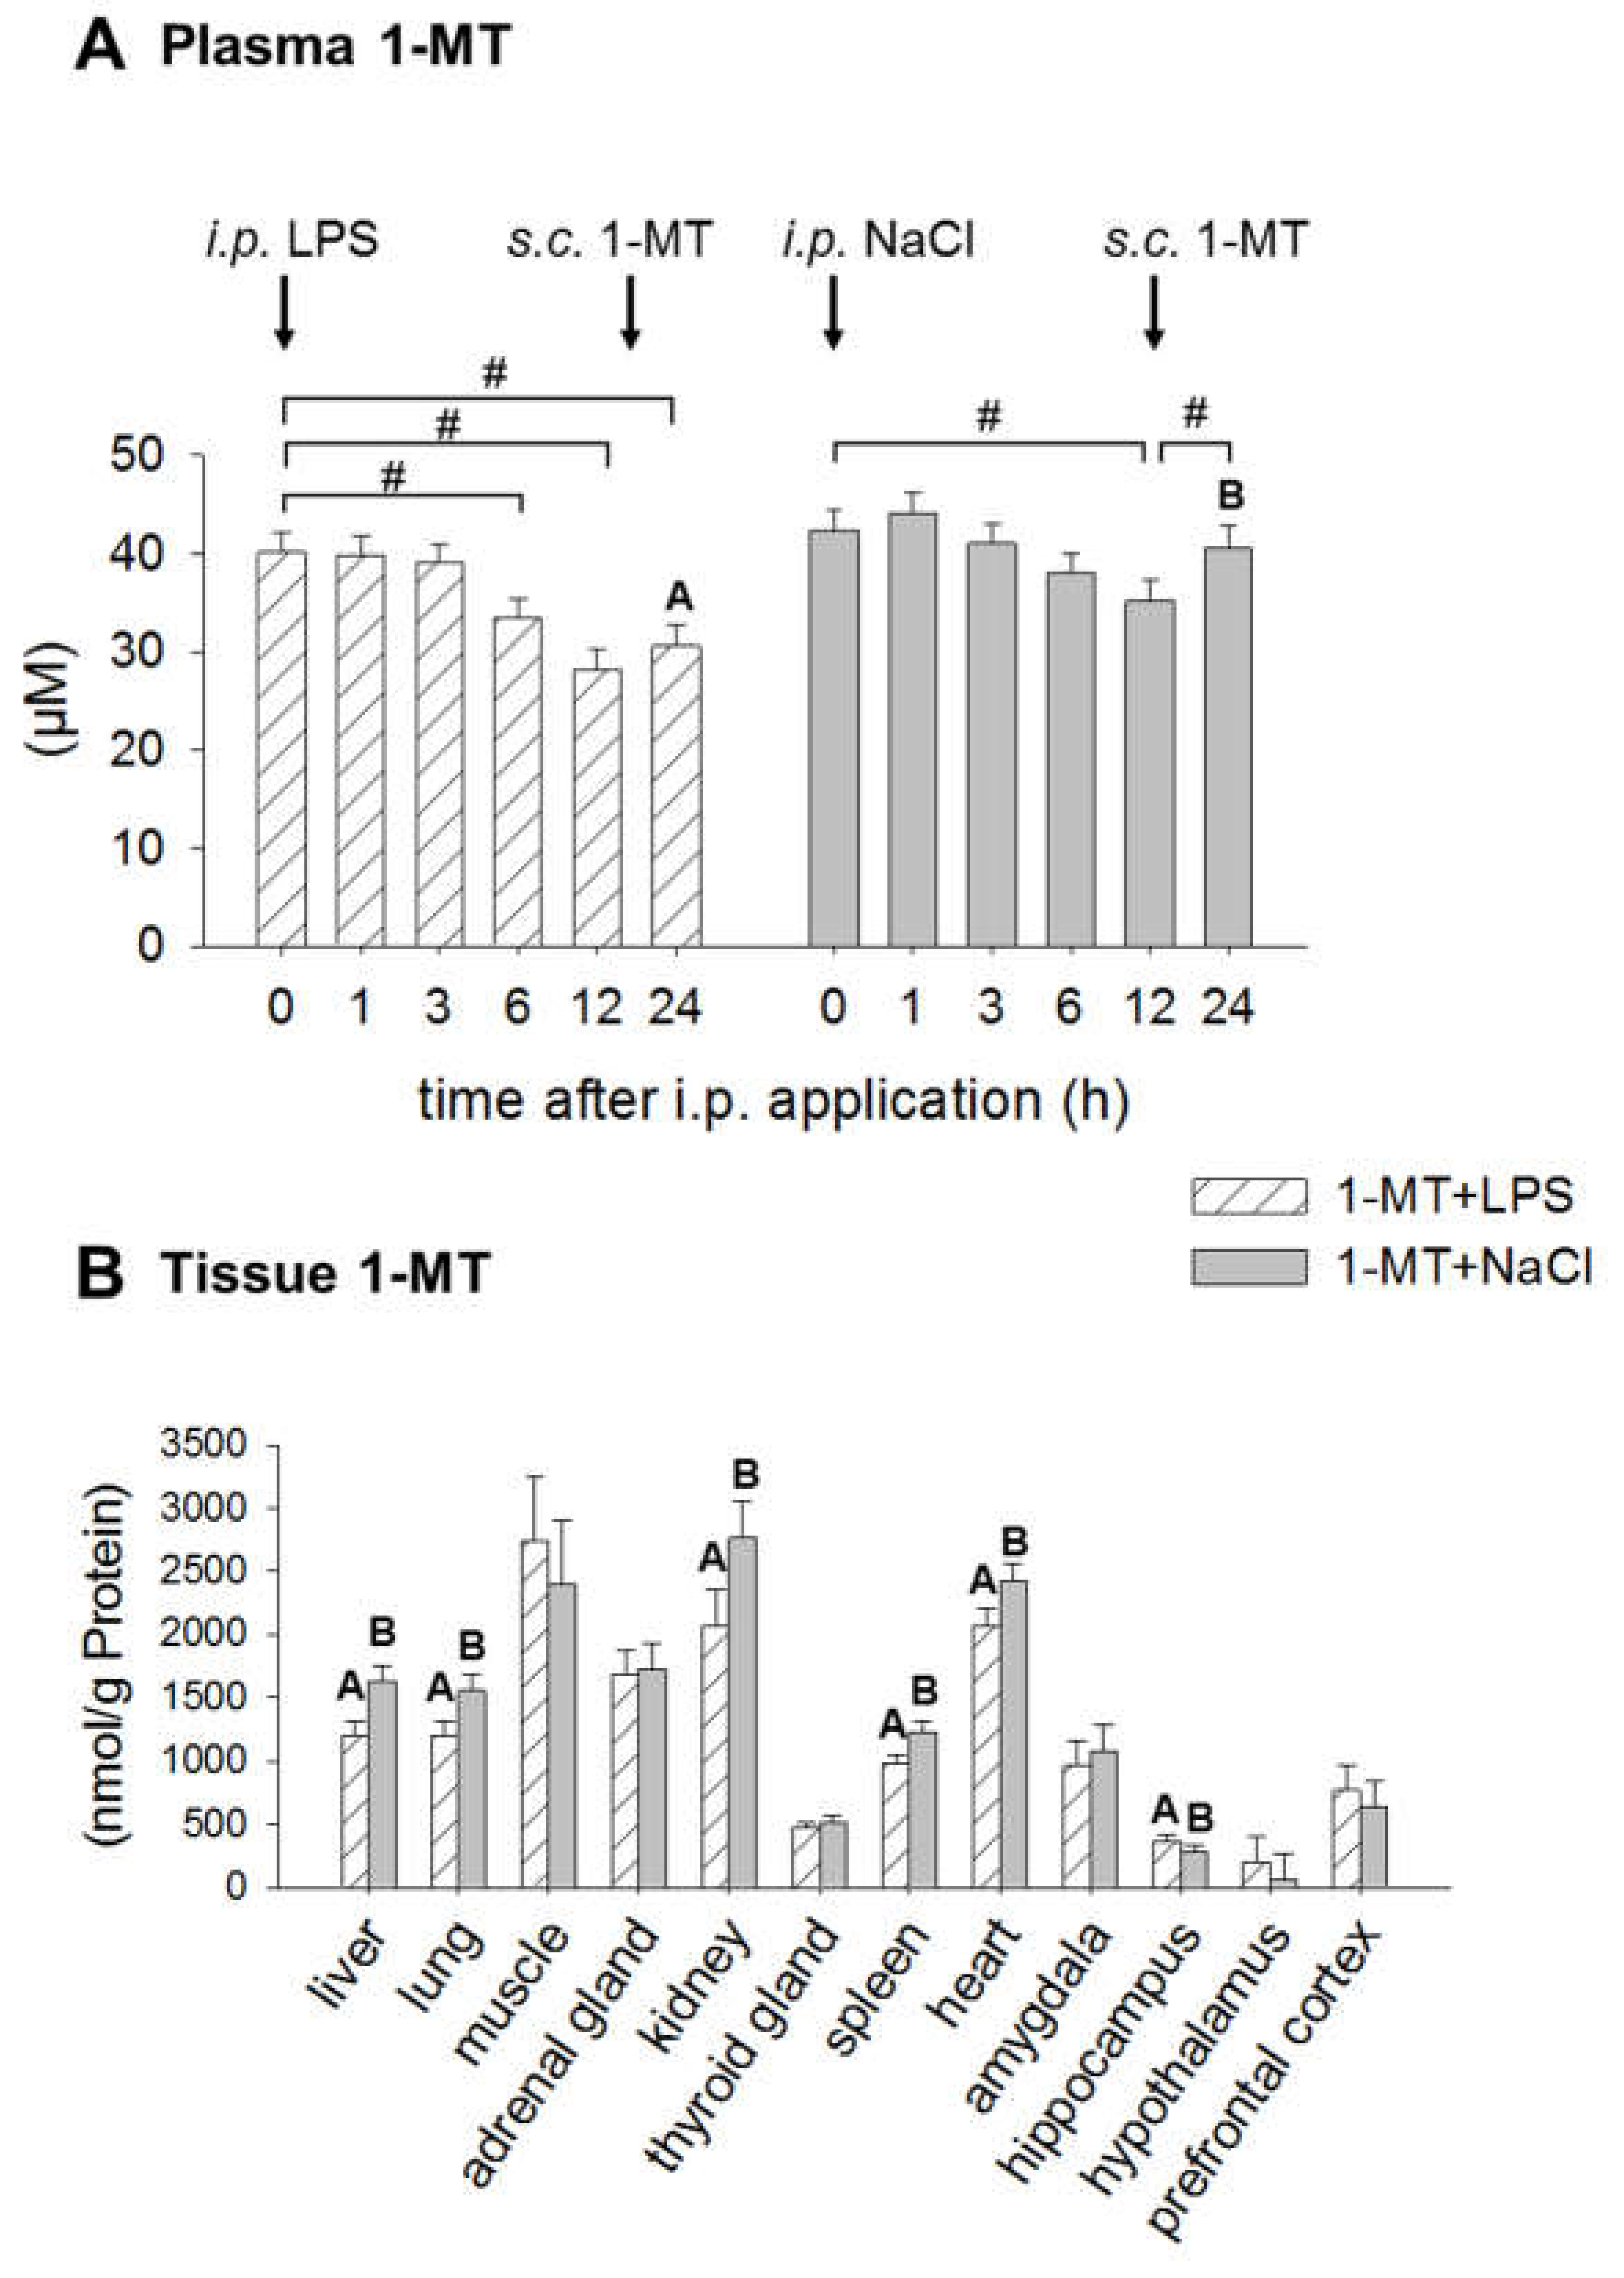
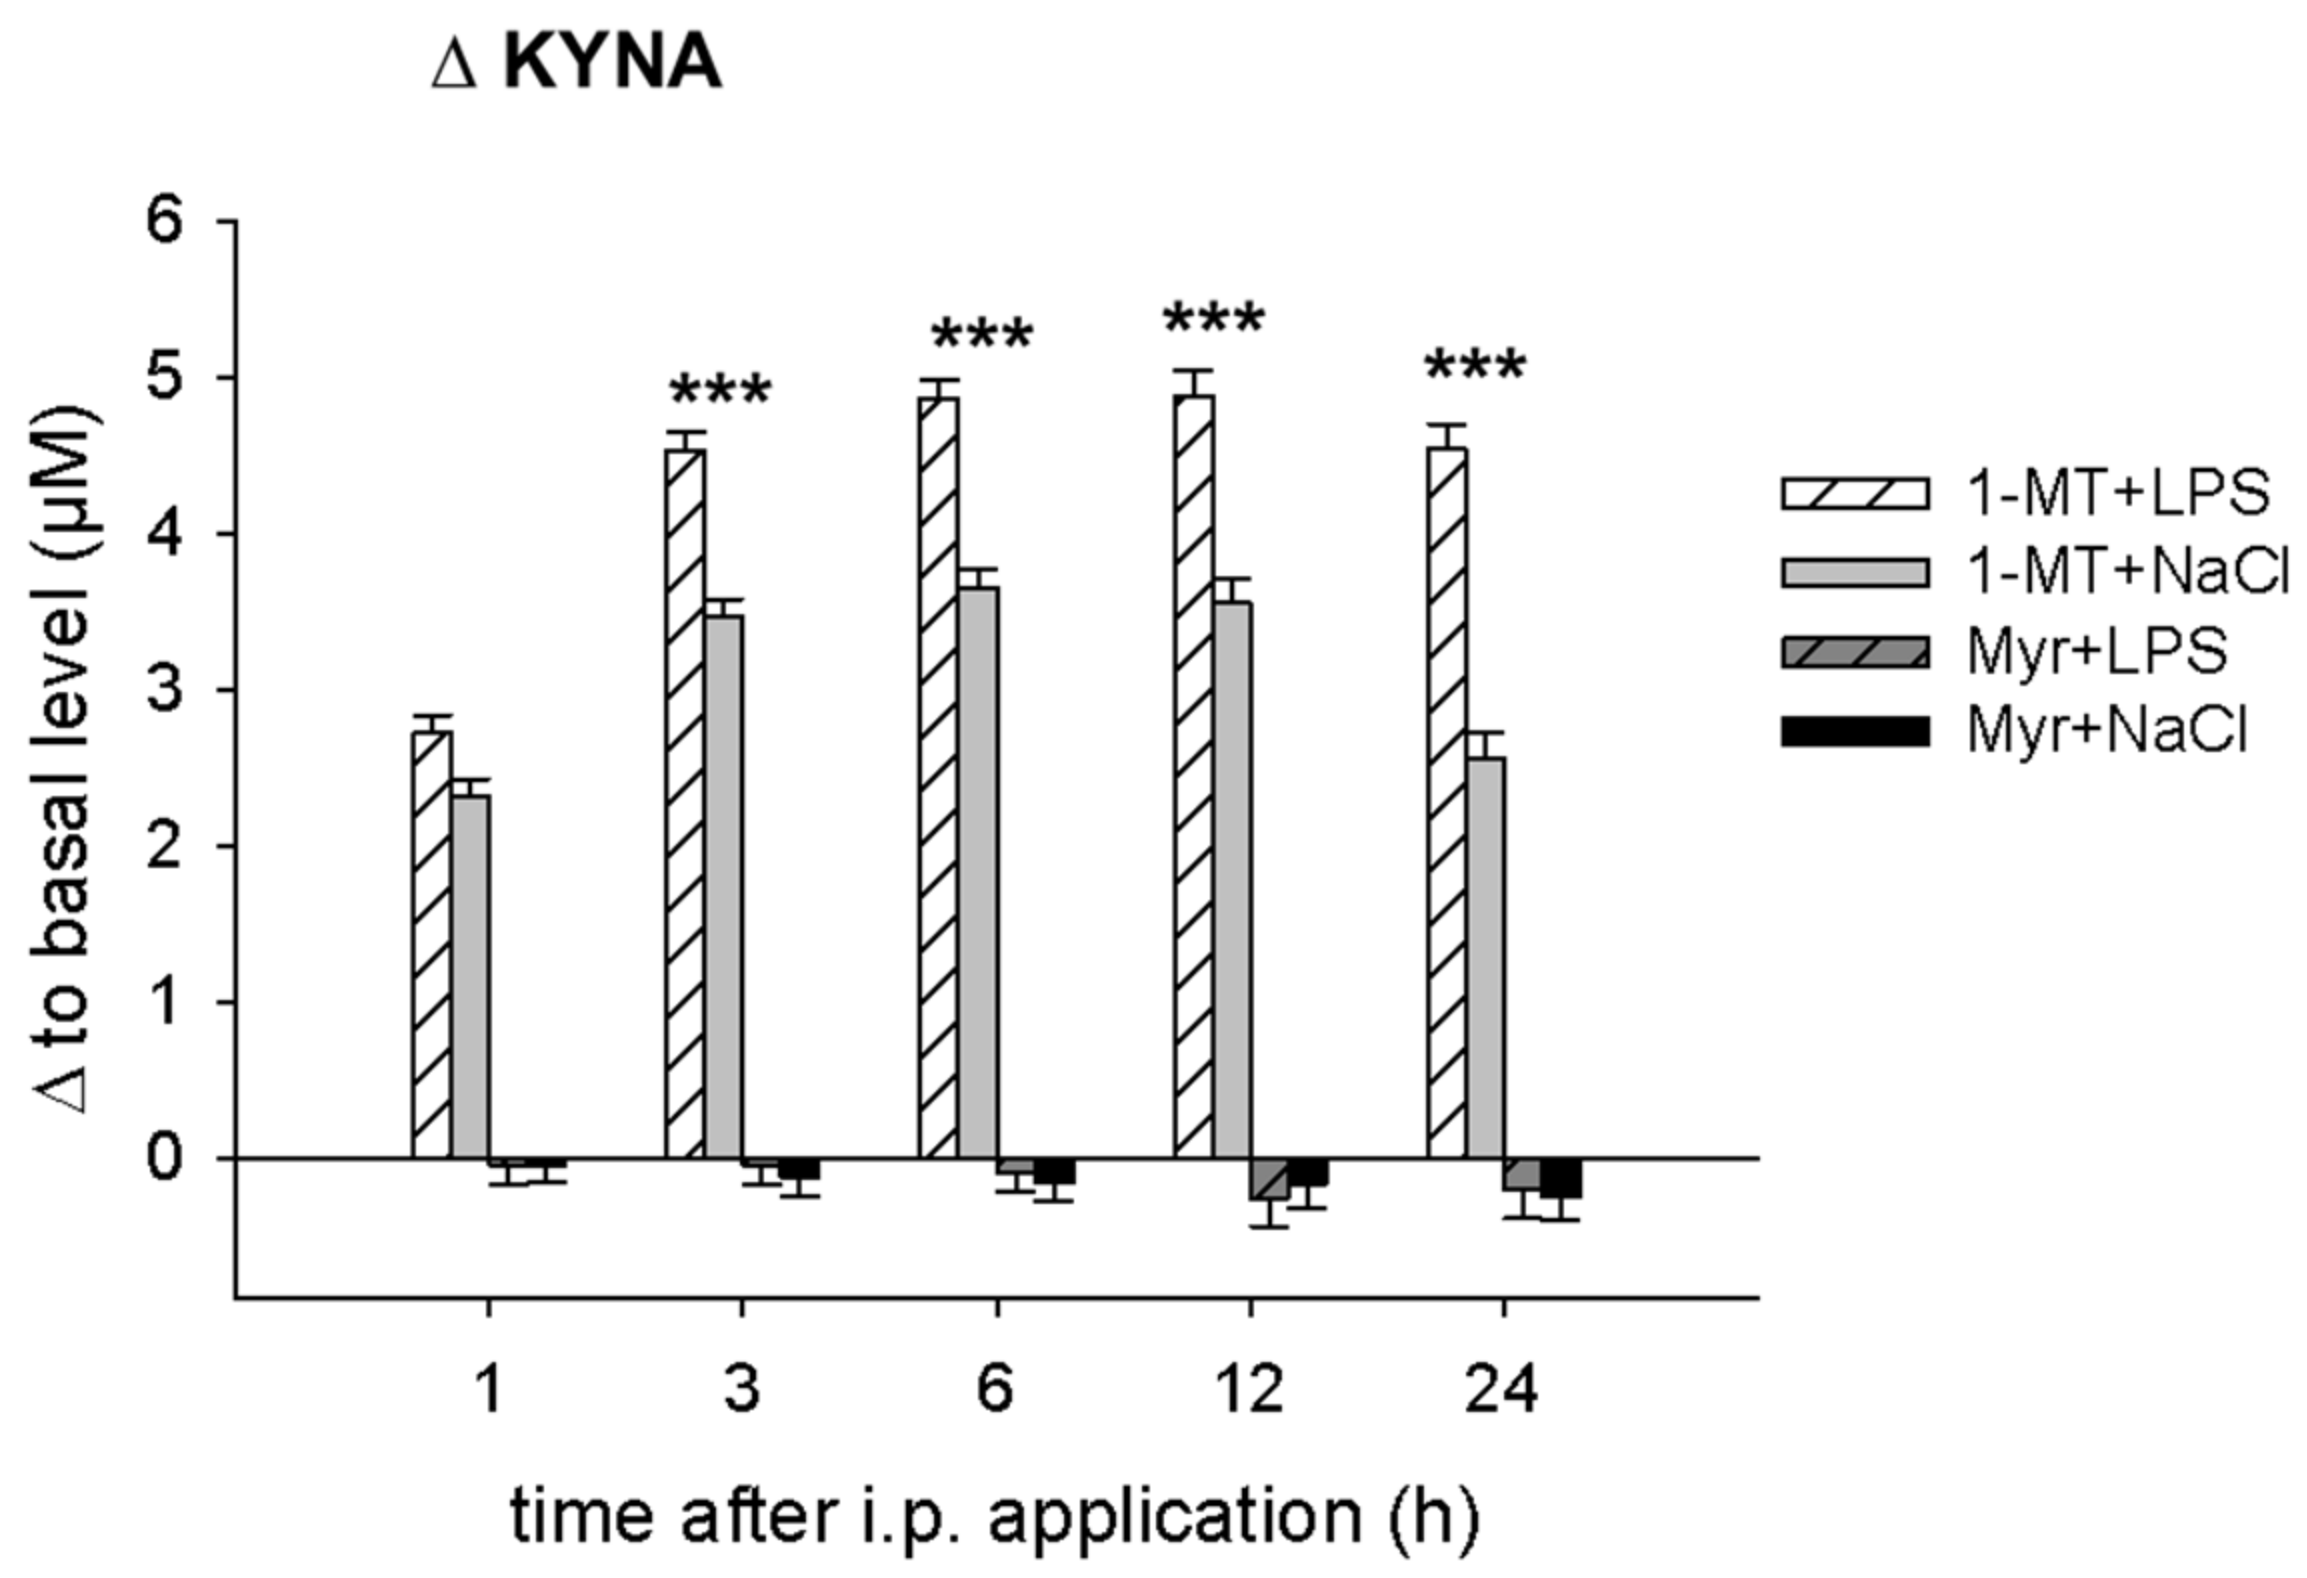
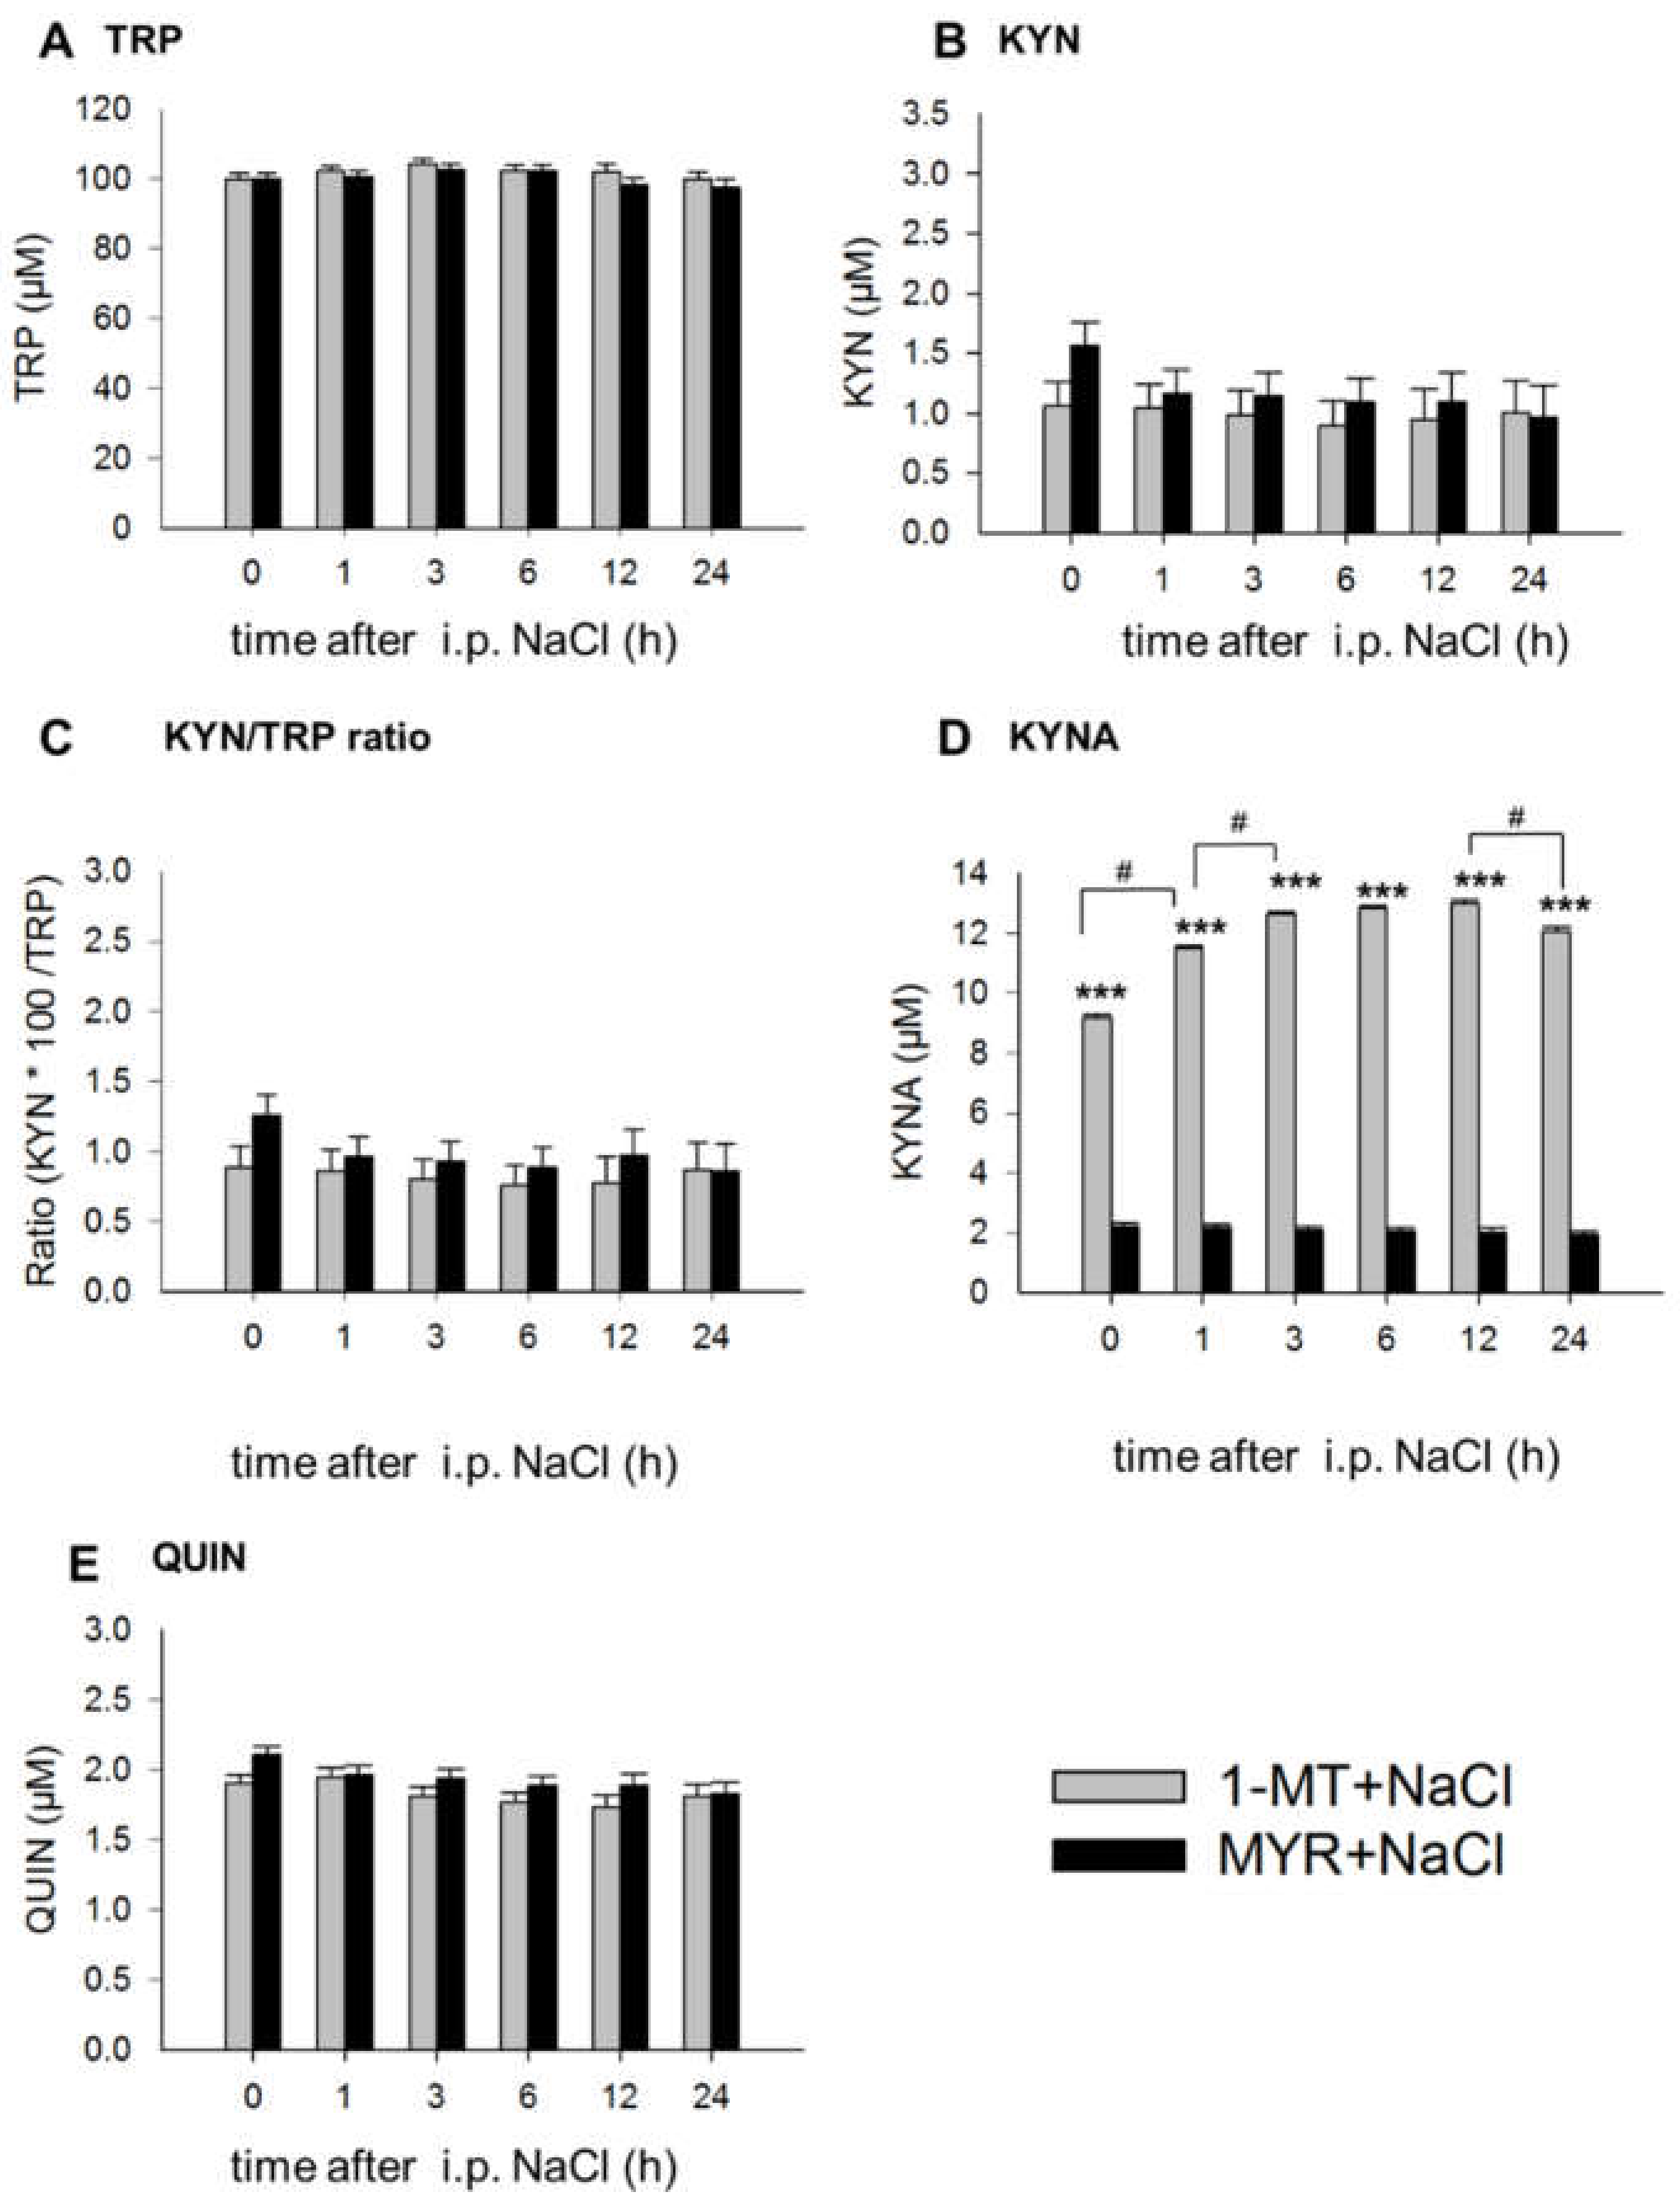
2.1. 1-MT Modifies TRP and Its Metabolites in Plasma
2.2. 1-MT Modifies TRP Metabolites in Tissues
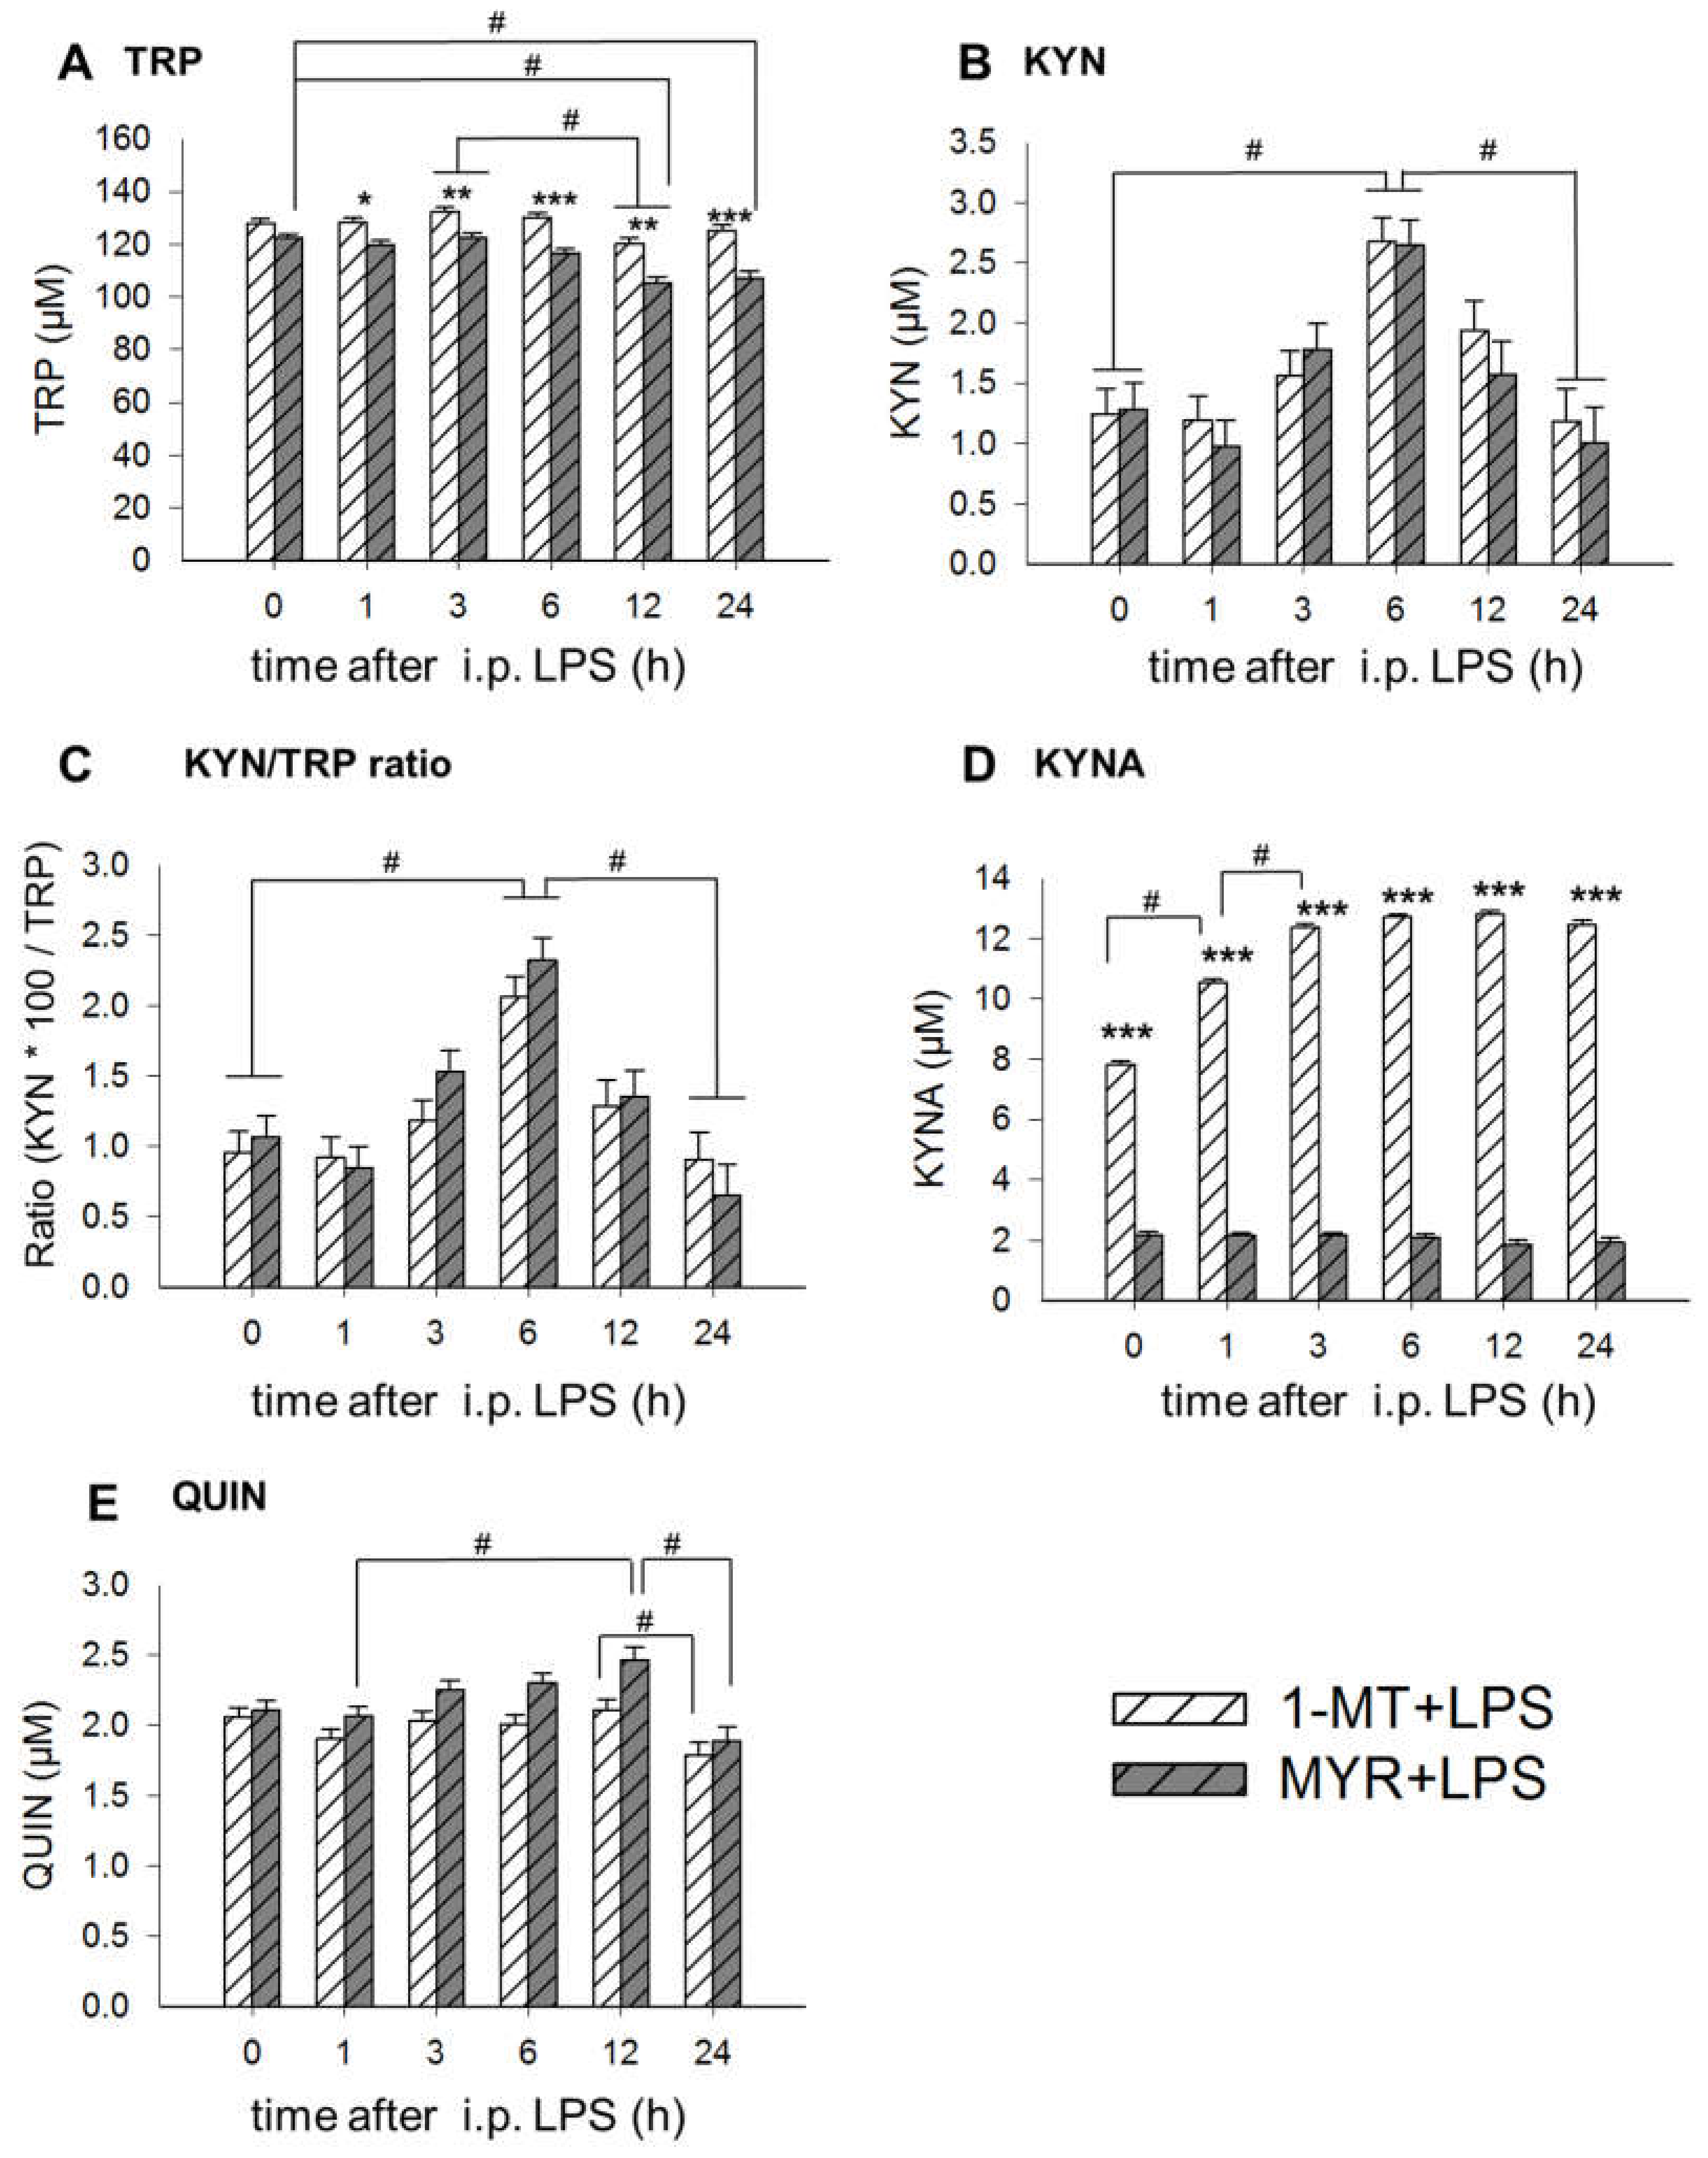
2.3. Application of LPS Induces A Reduction of 1-MT in Plasma and Tissue
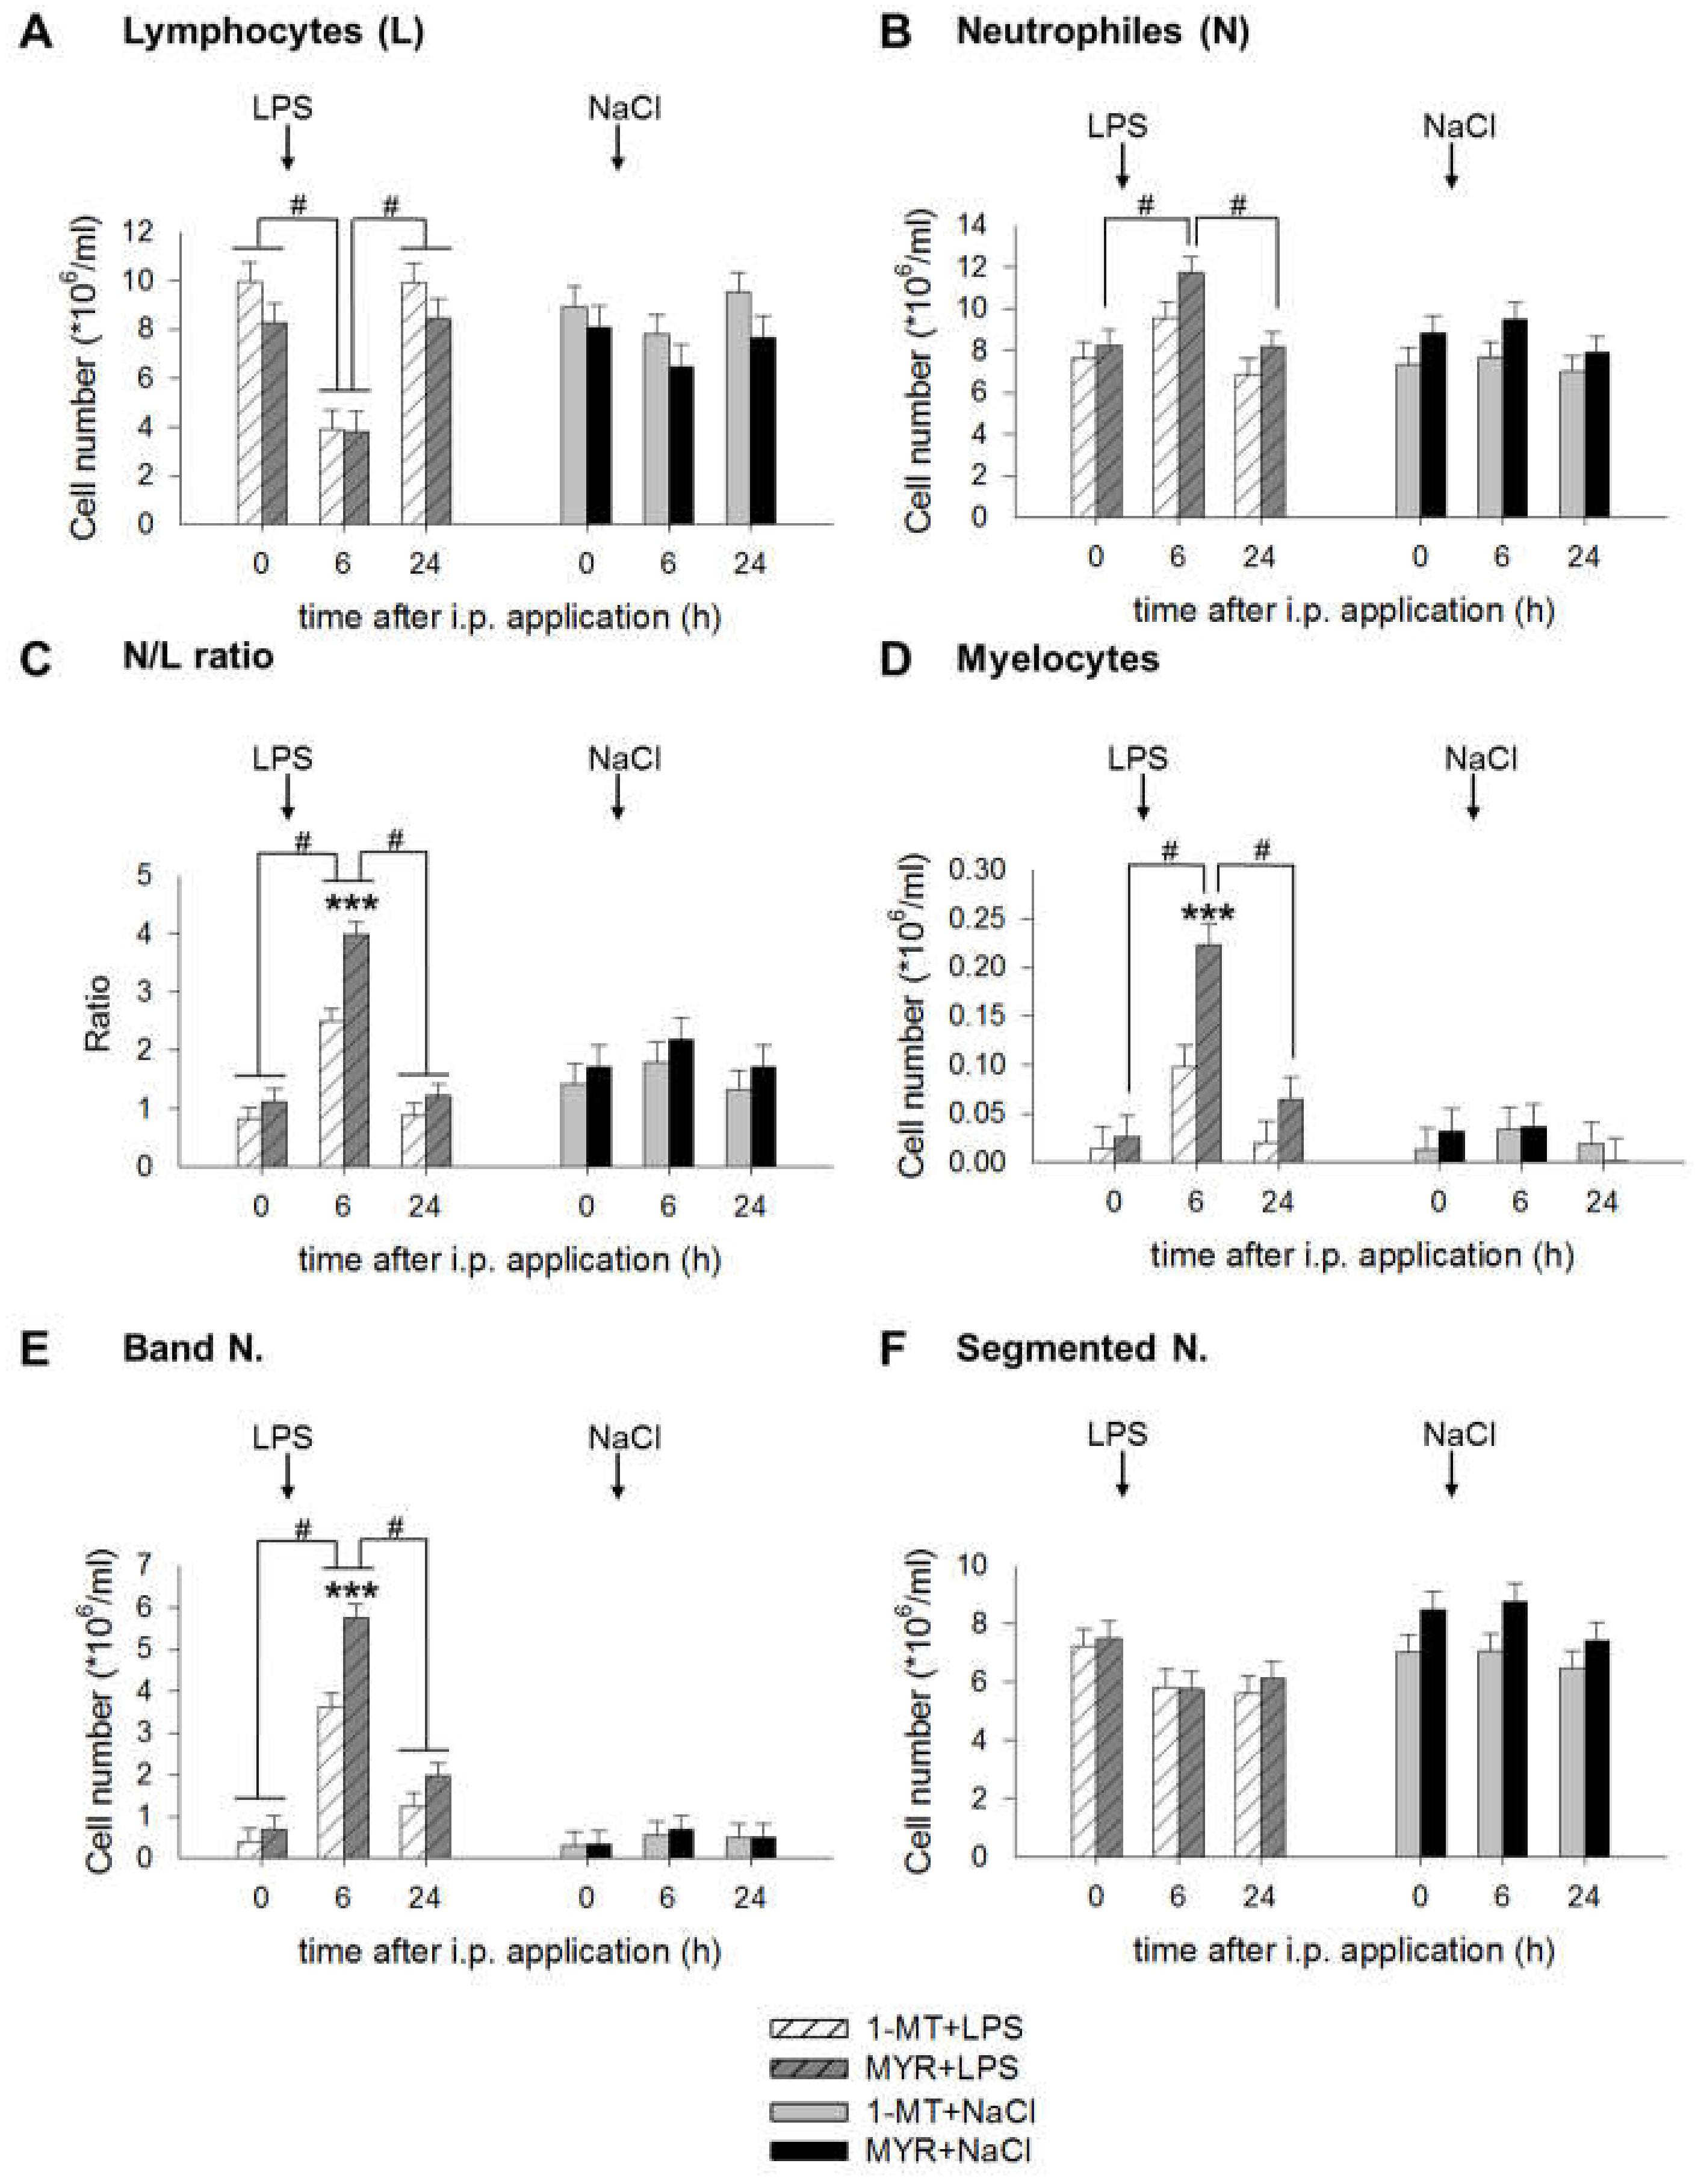
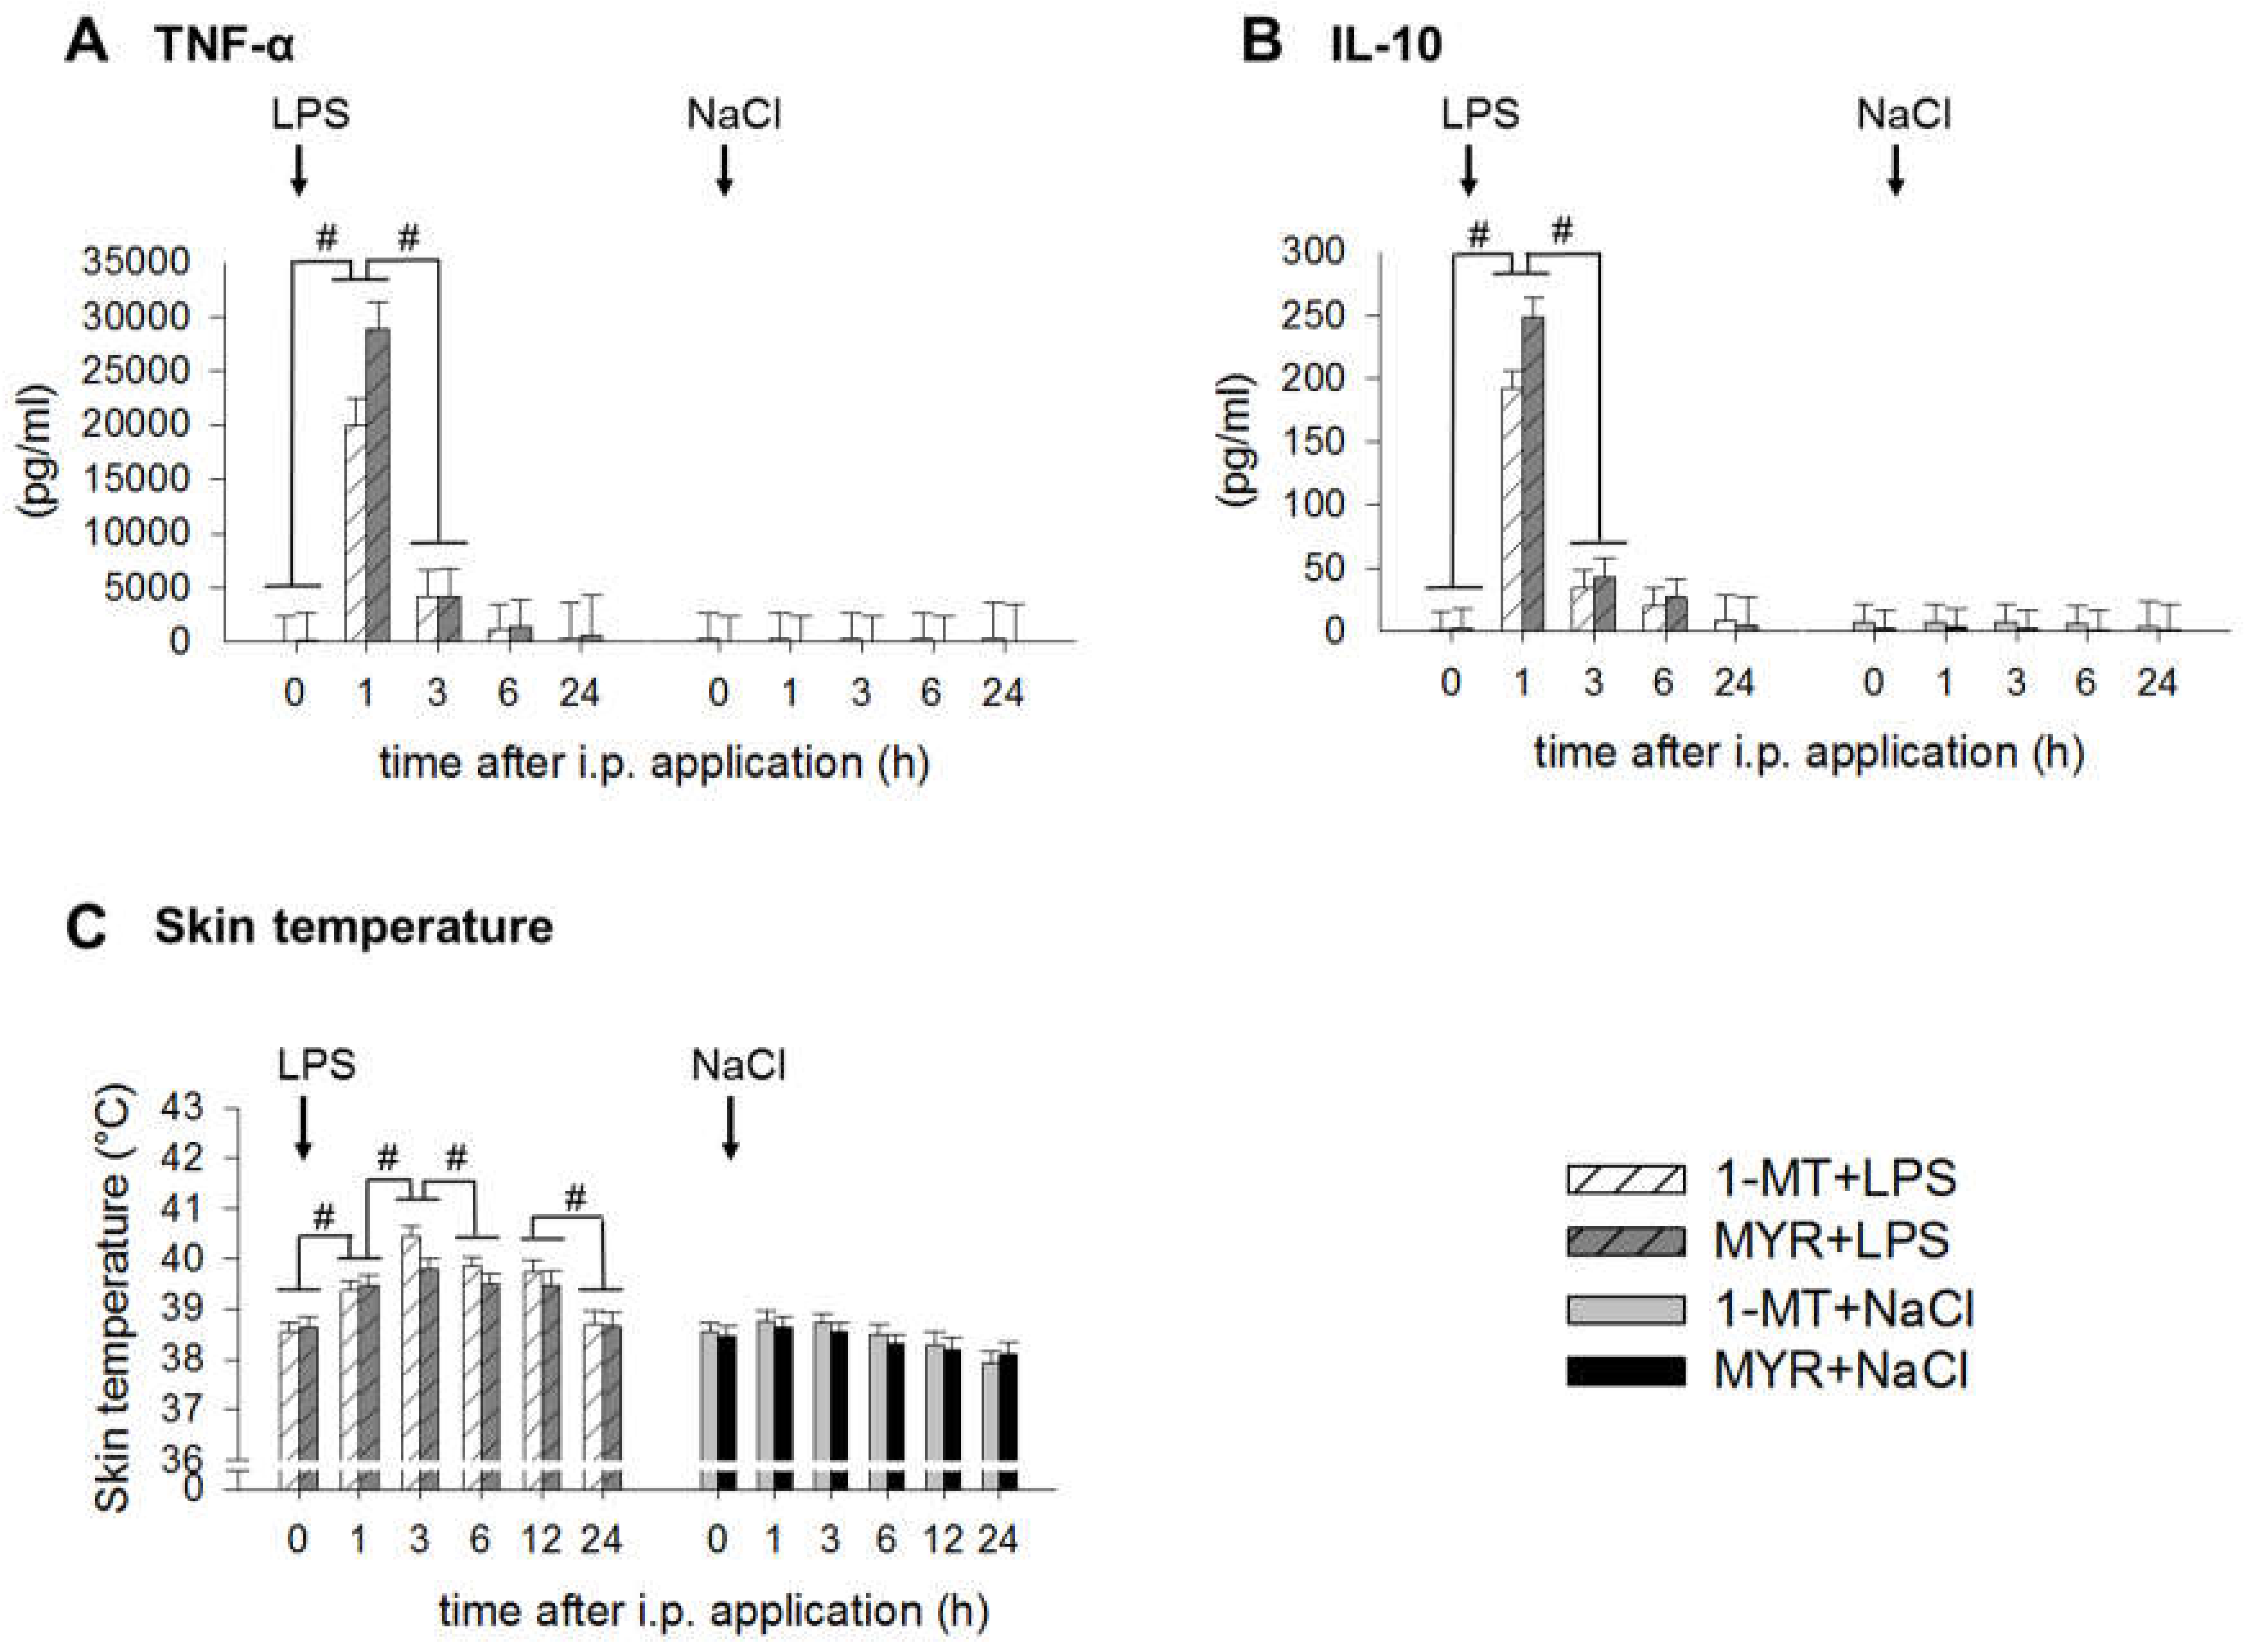
2.4. 1-MT Modulates Inflammatory Response after LPS Application
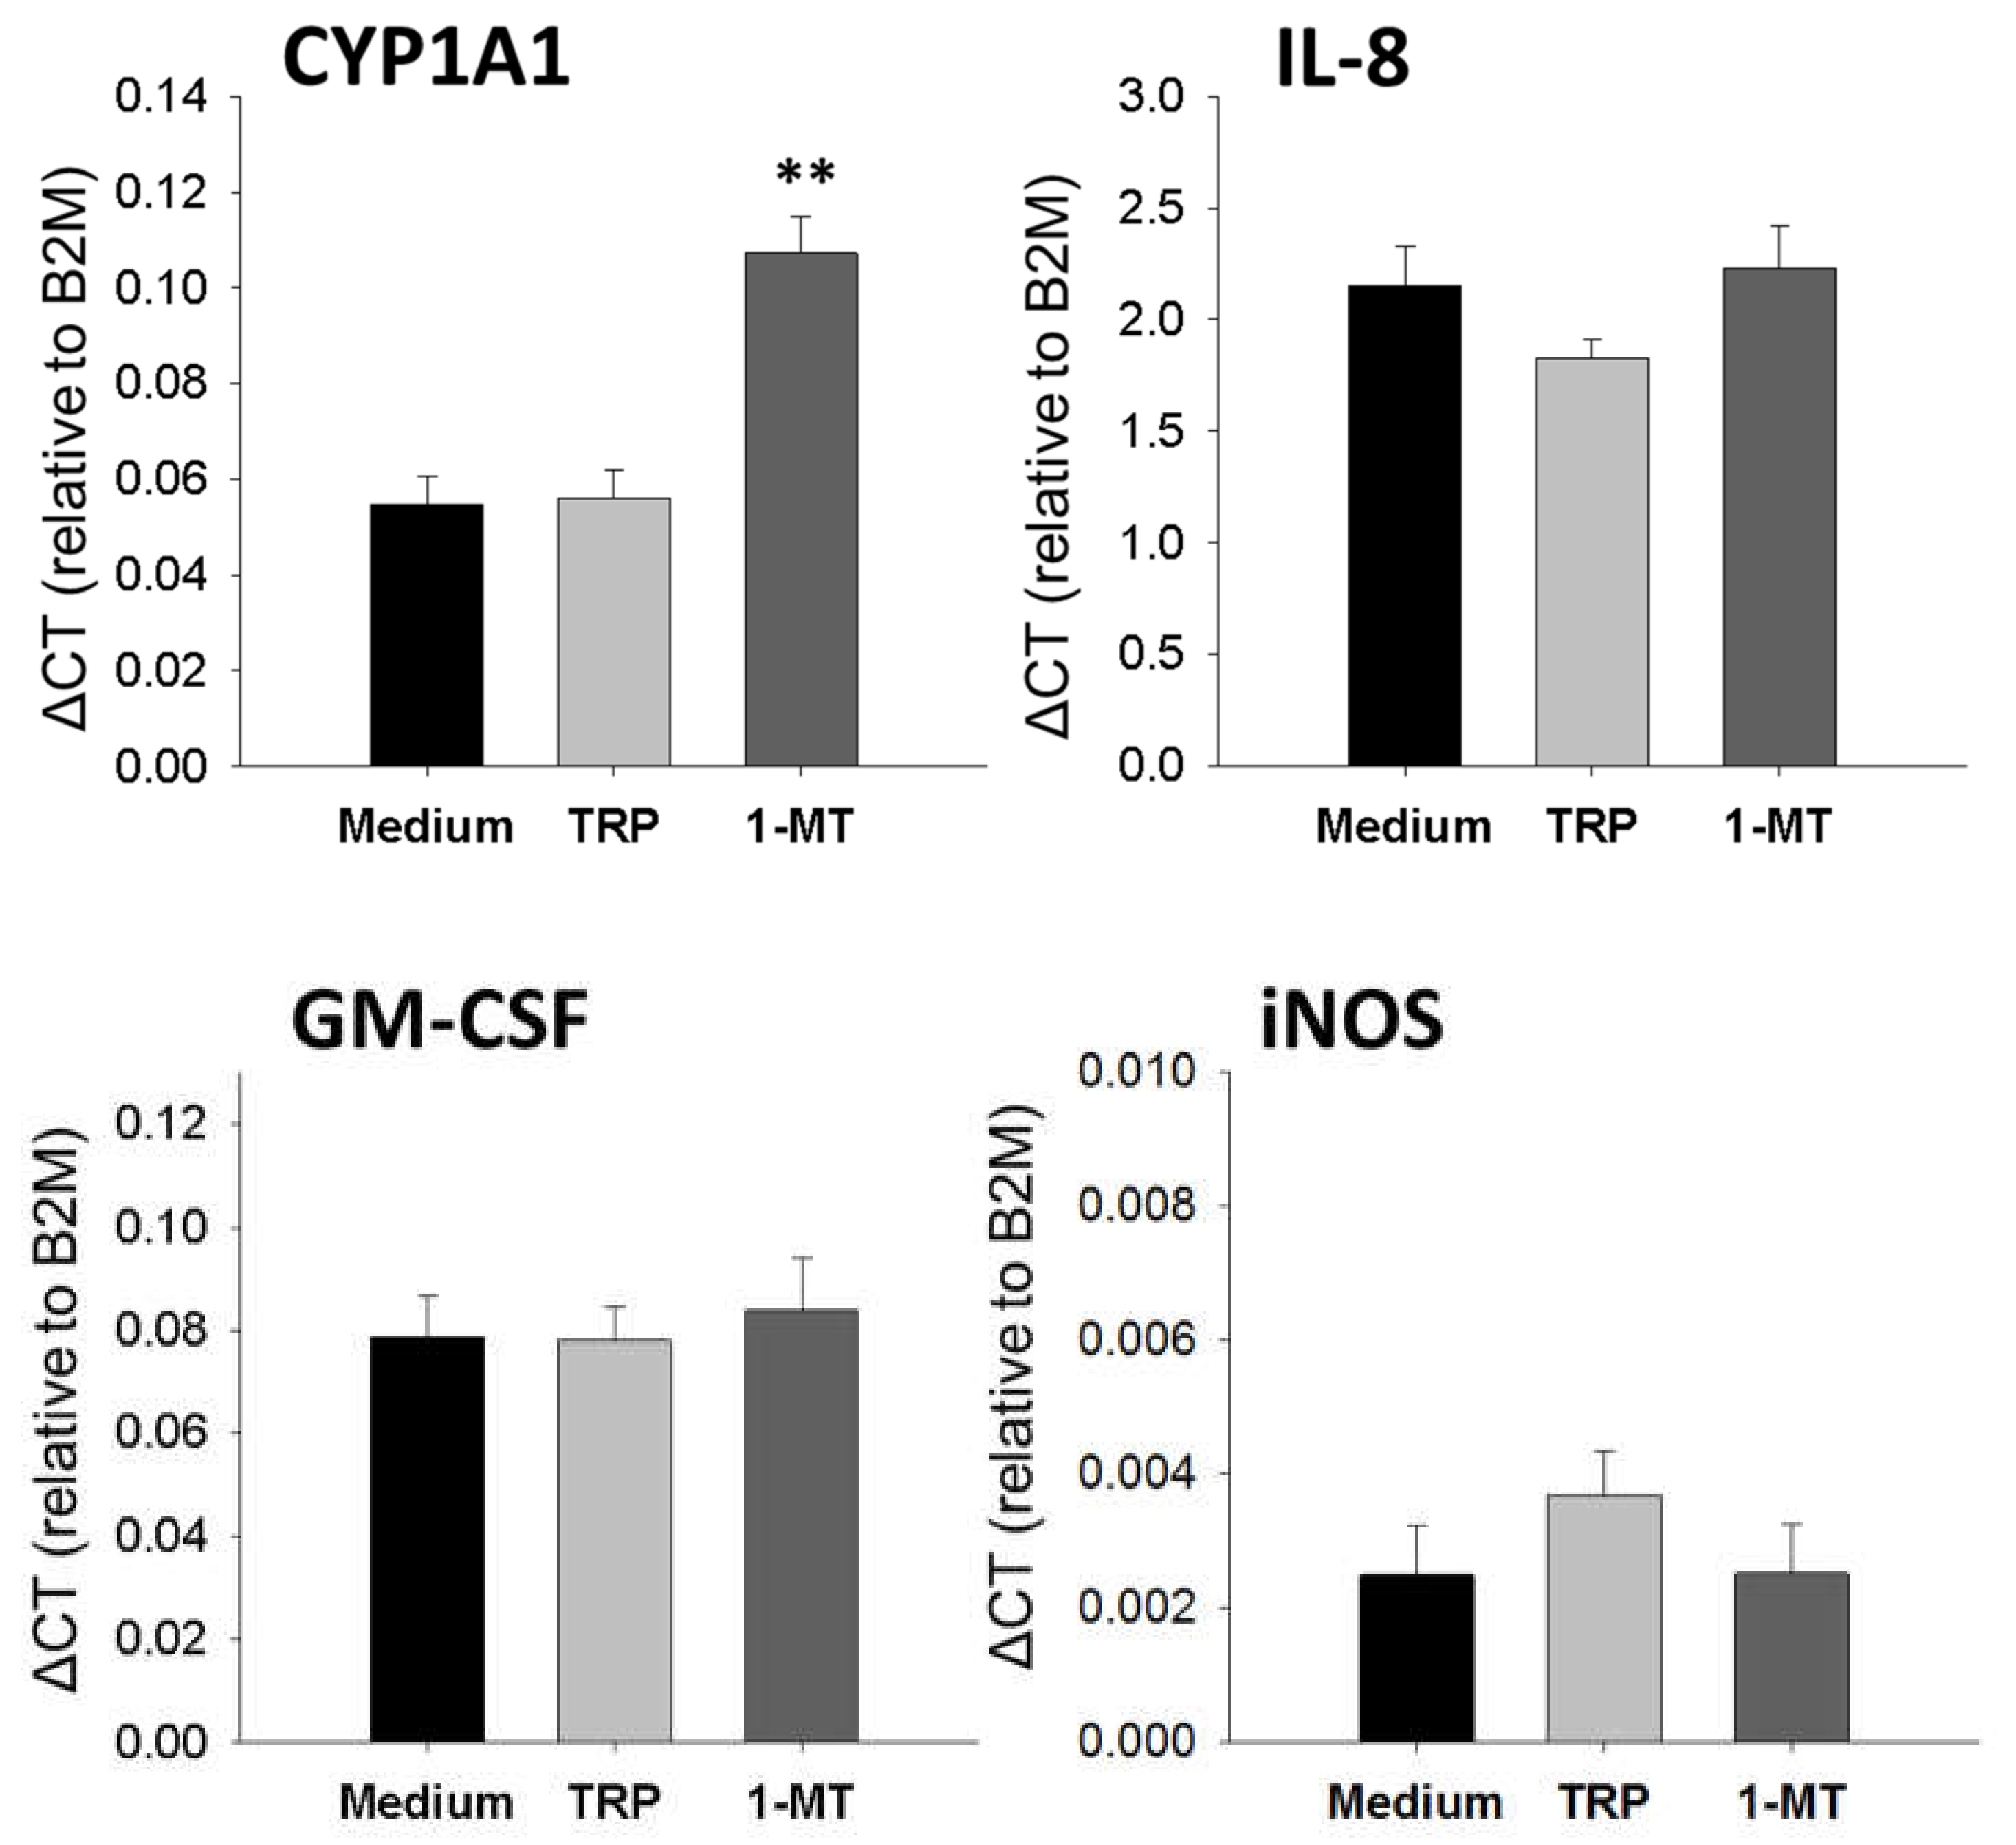
2.5. 1-MT Modifies mRNA Expression of Porcine Lung Fibroblasts
3. Discussion
3.1. 1-MT-Induced Increases in TRP and KYNA
3.2. 1-MT Does Not Inhibit the Production of KYN But Is Diminished after LPS Treatment
3.3. 1-MT Mediates Immunomodulatory Effects
4. Materials and Methods
4.1. Animals
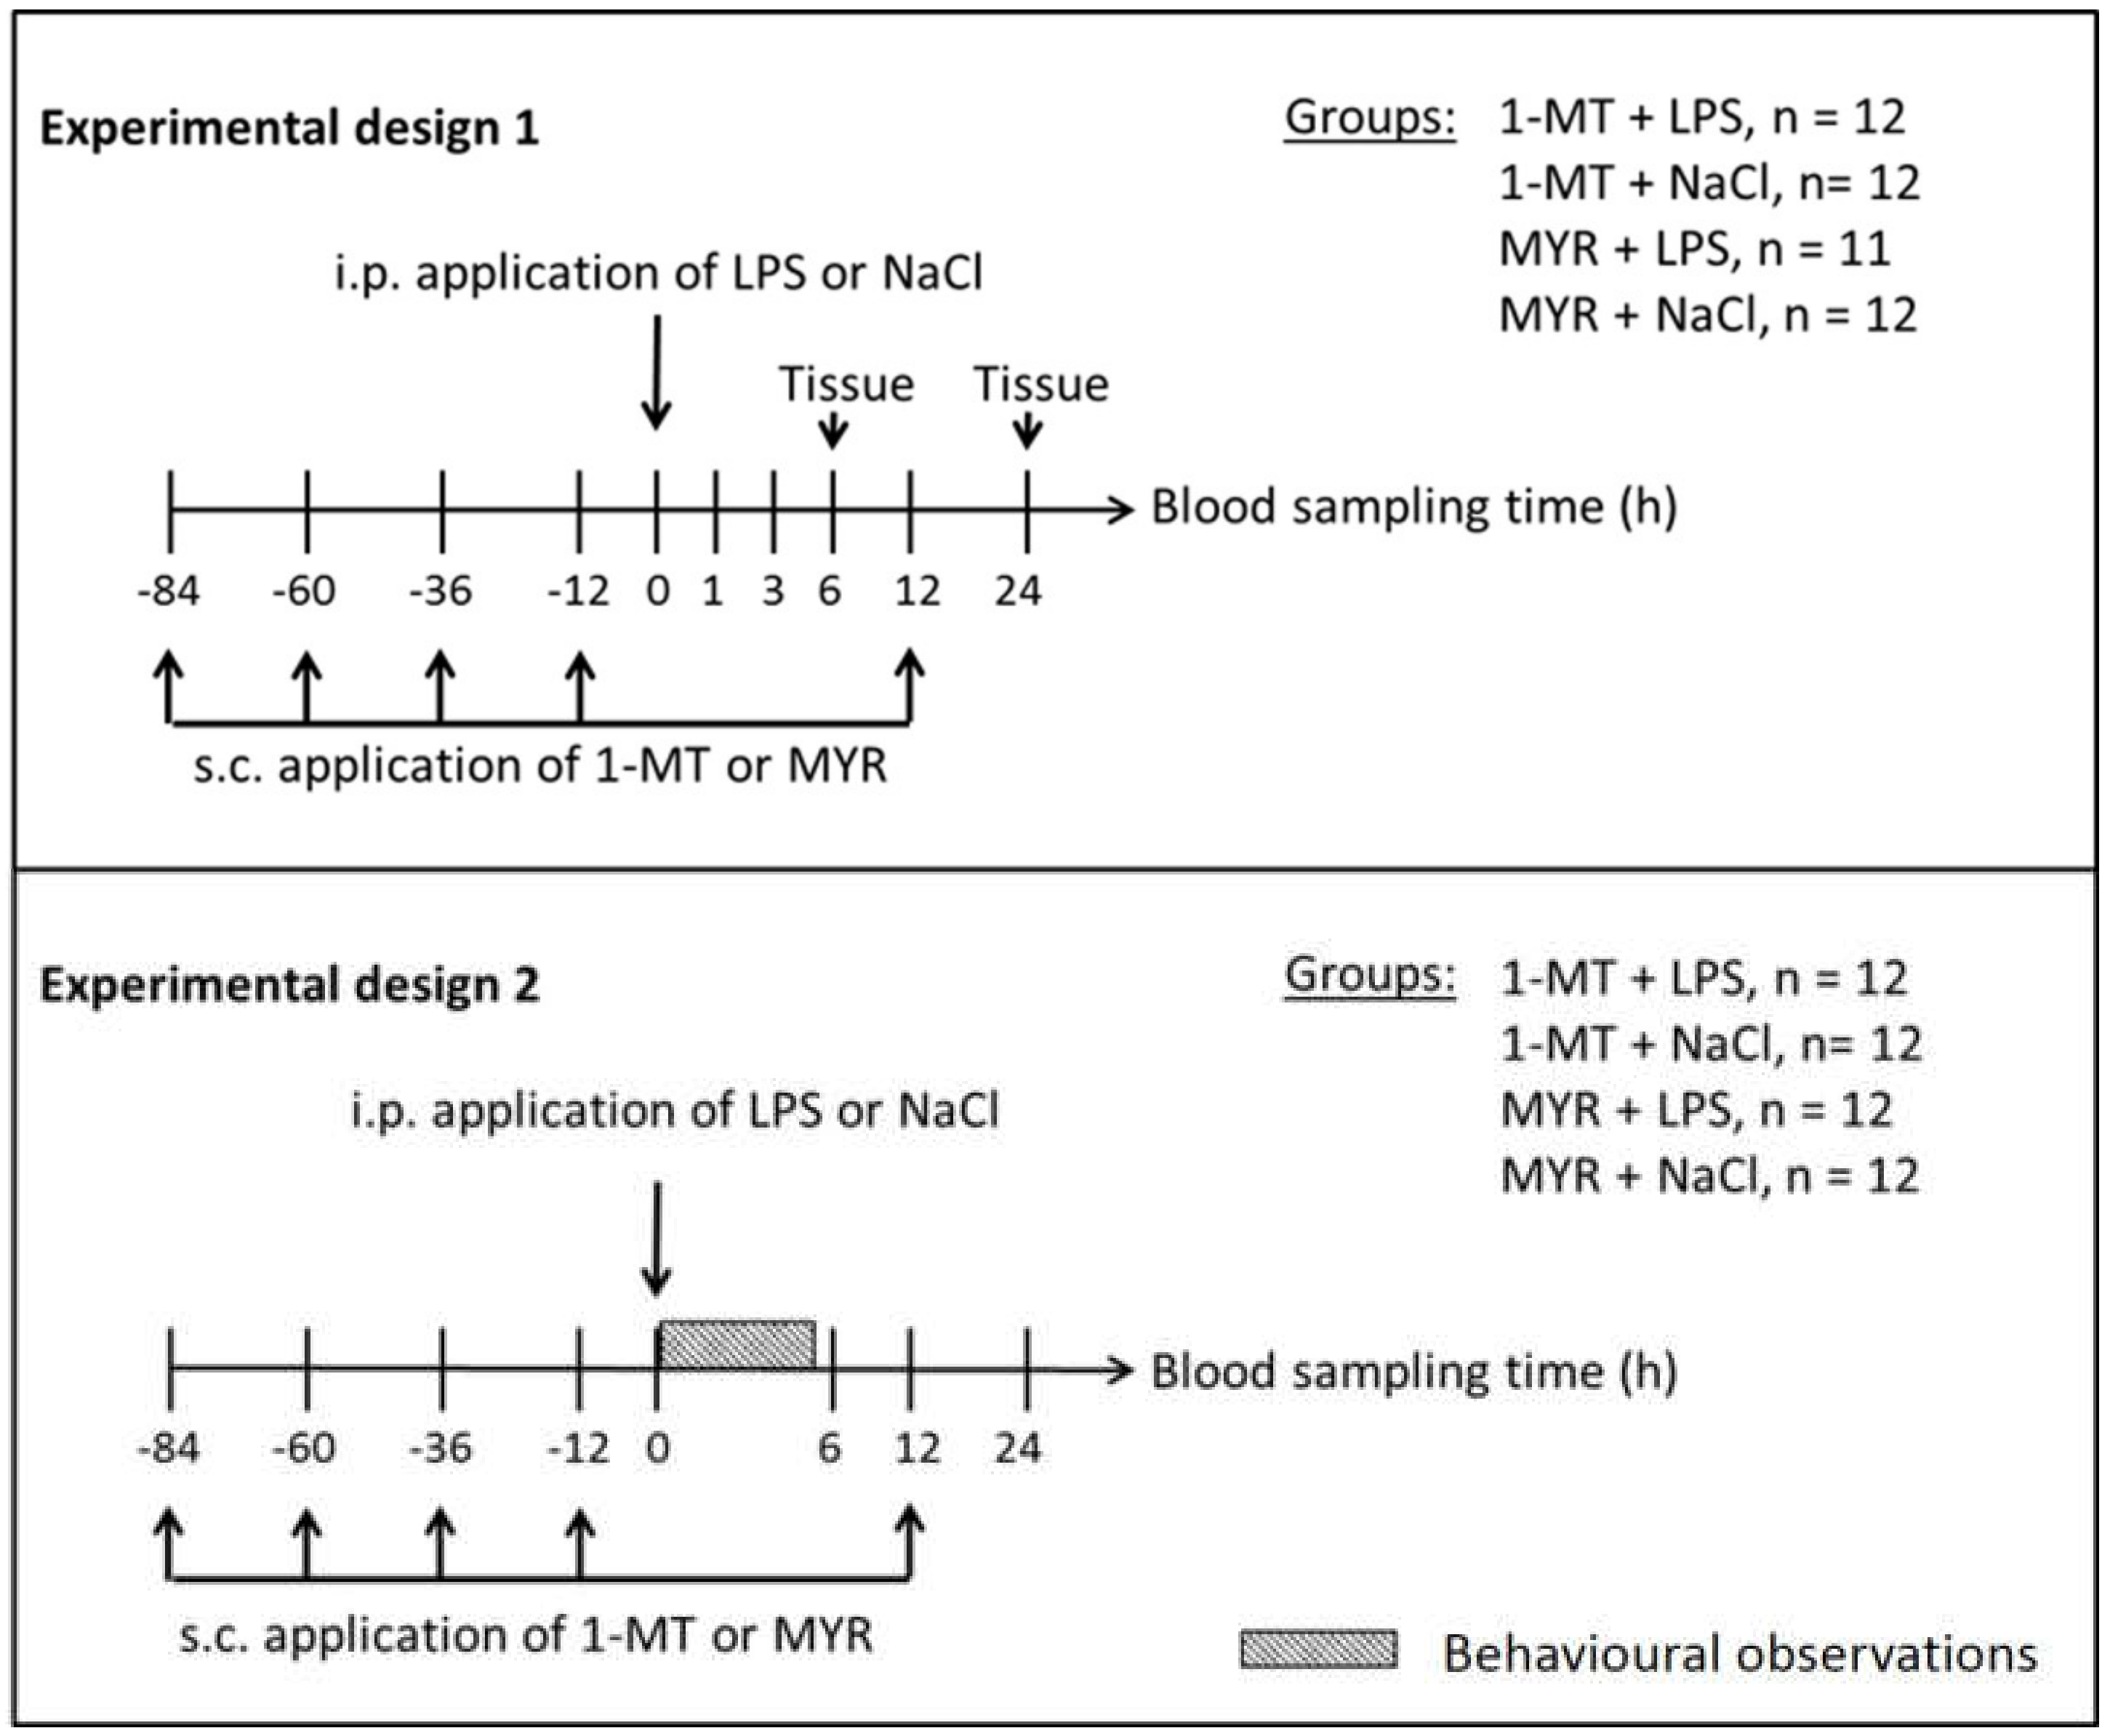
4.2. Experimental Design
4.2.1. Experiment 1: Effects of 1-MT on Inflammatory Response and KYN Pathway
4.2.2. Experiment 2: Effects of 1-MT on Behaviour and Haematopoiesis
4.3. Analyses
4.3.1. Quantification of 1-MT and TRP Metabolites
4.3.2. TNF-α and IL-10 Assays
4.3.3. Differential Leukocyte Counts
4.3.4. Behavioural Observations
4.4. Statistics
5. Conclusions
Author Contributions
Funding
Acknowledgments
Conflicts of Interest
Abbreviations
| IDO1 | Indoleamine 2,3-dioxygenase |
| 1-MT | 1-Methyltryptophan |
| LPS | Lipopolysaccharide |
| TRP | Tryptophan |
| KYNA | Kynurenic acid |
| KYN | Kynurenine |
| QUIN | Quinolinic acid |
| MYR | Myritol |
| N/L ratio | Neutrophil to lymphocyte count ratio |
| TDO2 | Tryptophan 2,3-dioxygenase |
| AhR | Aryl hydrocarbon receptor |
| CYP1A1 | Cytochrome P450, family 1, subfamily A, polypeptide 1 |
| GM-CSF | Granulocyte-macrophage colony-stimulating factor |
| iNOS | Inducible nitric oxide synthase |
Appendix A


Appendix B
Appendix B.1. Supplementary Experiment
Appendix B.2. Methods

| Primer | Sequence Forward | Sequence Reverse |
|---|---|---|
| CYP1A1 | GATCTCTTCAAGGACCTGAATCA | GCTGGATATTGGCATTCTCGTC |
| TNF-α | CACCACGCTCTTCTGCCTACT | GCTGTCCCTCGGCTTTGACAT |
| IL-8 | GCTGTTGCCTTCTTGGCAGT | CTGCACCCACTTTTCCTTGG |
| GM-CSF | GCAGACTCGCCTGAACCTGT | CAGCAGTCAAAGGGGATGGT |
| iNOS | CTGCGTTATGCCACCAACAA | TTTCCAGCCCAGGTCGATAC |
| B2M | CGTGACTCTCGATAAGCCCAAG | GATTCATCCAACCCAGATGCAG |
References
- Wirthgen, E.; Hoeflich, A. Endotoxin-induced tryptophan degradation along the kynurenine pathway: The role of indolamine 2,3-dioxygenase and aryl hydrocarbon receptor-mediated immunosuppressive effects in endotoxin tolerance and cancer and its implications for immunoparalysis. J. Amino Acids 2015, 2015, 973548. [Google Scholar] [CrossRef] [PubMed]
- Barth, M.C.; Ahluwalia, N.; Anderson, T.J.T.; Hardy, G.J.; Sinha, S.; Alvarez-Cardona, J.A.; Pruitt, I.E.; Rhee, E.P.; Colvin, R.A.; Gerszten, R.E. Kynurenic acid triggers firm arrest of leukocytes to vascular endothelium under flow conditions. J. Biol. Chem. 2009, 284, 19189–19195. [Google Scholar] [CrossRef] [PubMed]
- Kiank, C.; Zeden, J.-P.; Drude, S.; Domanska, G.; Fusch, G.; Otten, W.; Schuett, C. Psychological stress-induced, IDO1-dependent tryptophan catabolism: implications on immunosuppression in mice and humans. PLoS ONE 2010, 5, e11825. [Google Scholar] [CrossRef] [PubMed]
- Terness, P.; Bauer, T.M.; Röse, L.; Dufter, C.; Watzlik, A.; Simon, H.; Opelz, G. Inhibition of allogeneic T cell proliferation by indoleamine 2,3-dioxygenase–expressing dendritic cells mediation of suppression by tryptophan metabolites. J. Exp. Med. 2002, 196, 447–457. [Google Scholar] [CrossRef] [PubMed]
- Wang, J.; Simonavicius, N.; Wu, X.; Swaminath, G.; Reagan, J.; Tian, H.; Ling, L. Kynurenic acid as a ligand for orphan G protein-coupled receptor GPR35. J. Biol. Chem. 2006, 281, 22021–22028. [Google Scholar] [CrossRef] [PubMed]
- Schulte, W.; Bernhagen, J.; Bucala, R. Cytokines in sepsis: potent immunoregulators and potential therapeutic targets—An updated view. Mediators Inflamm. 2013, 2013, 165974. [Google Scholar] [CrossRef] [PubMed]
- Tattevin, P.; Monnier, D.; Tribut, O.; Dulong, J.; Bescher, N.; Mourcin, F.; Uhel, F.; Le Tulzo, Y.; Tarte, K. Enhanced indoleamine 2,3-dioxygenase activity in patients with severe sepsis and septic shock. J. Infect. Dis. 2010, 201, 956–966. [Google Scholar] [CrossRef] [PubMed]
- Changsirivathanathamrong, D.; Wang, Y.; Rajbhandari, D.; Maghzal, G.J.; Mak, W.M.; Woolfe, C.; Duflou, J.; Gebski, V.; dos Remedios, C.G.; Celermajer, D.S. Tryptophan metabolism to kynurenine is a potential novel contributor to hypotension in human sepsis. Crit. Care Med. 2011, 39, 2678–2683. [Google Scholar] [CrossRef] [PubMed]
- Ploder, M.; Spittler, A.; Kurz, K.; Neurauter, G.; Pelinka, L.E.; Roth, E.; Fuchs, D. Accelerated tryptophan degradation predicts poor survival in trauma and sepsis patients. Int. J. Tryptophan Res. 2010, 3, 61–67. [Google Scholar] [CrossRef] [PubMed]
- Zeden, J.; Fusch, G.; Holtfreter, B.; Schefold, J.; Reinke, P.; Domanska, G.; Haas, J.; Gruendling, M.; Westerholt, A.; Schuett, C. Excessive tryptophan catabolism along the kynurenine pathway precedes ongoing sepsis in critically ill patients. Anaesth. Intensive Care 2010, 38, 307–316. [Google Scholar] [PubMed]
- Jung, I.D.; Lee, M.G.; Chang, J.H.; Lee, J.S.; Jeong, Y.I.; Lee, C.M.; Park, W.S.; Han, J.; Seo, S.K.; Lee, S.Y.; et al. Blockade of indoleamine 2,3-dioxygenase protects mice against lipopolysaccharide-induced endotoxin shock. J. Immunol. 2009, 182, 3146–3154. [Google Scholar] [CrossRef] [PubMed]
- Greco, F.A.; Coletti, A.; Camaioni, E.; Carotti, A.; Marinozzi, M.; Gioiello, A.; Macchiarulo, A. The Janus-faced nature of IDO1 in infectious diseases: challenges and therapeutic opportunities. Future Med. Chem. 2016, 8, 39–54. [Google Scholar] [CrossRef] [PubMed]
- Hou, D.Y.; Muller, A.J.; Sharma, M.D.; DuHadaway, J.; Banerjee, T.; Johnson, M.; Mellor, A.L.; Prendergast, G.C.; Munn, D.H. Inhibition of indoleamine 2,3-dioxygenase in dendritic cells by stereoisomers of 1-methyl-tryptophan correlates with antitumor responses. Cancer Res. 2007, 67, 792–801. [Google Scholar] [CrossRef] [PubMed]
- Wirthgen, E.; Tuchscherer, M.; Otten, W.; Domanska, G.; Wollenhaupt, K.; Tuchscherer, A.; Kanitz, E. Activation of indoleamine 2, 3-dioxygenase by LPS in a porcine model. Innate Immun. 2014, 20, 30–39. [Google Scholar] [CrossRef] [PubMed]
- Wirthgen, E.; Kanitz, E.; Tuchscherer, M.; Tuchscherer, A.; Domanska, G.; Weitschies, W.; Seidlitz, A.; Scheuch, E.; Otten, W. Pharmacokinetics of 1-methyl-L-tryptophan after single and repeated subcutaneous application in a porcine model. Exp. Anim. 2016, 65, 147–155. [Google Scholar] [CrossRef] [PubMed] [Green Version]
- Bendixen, E.; Danielsen, M.; Larsen, K.; Bendixen, C. Advances in porcine genomics and proteomics—A toolbox for developing the pig as a model organism for molecular biomedical research. Brief. Funct. Genom. 2010, 9, 208–219. [Google Scholar] [CrossRef] [PubMed]
- Martinez, M.N. Factors influencing the use and interpretation of animal models in the development of parenteral drug delivery systems. AAPS J. 2011, 13, 632–649. [Google Scholar] [CrossRef] [PubMed]
- Roth, W.J.; Kissinger, C.B.; McCain, R.R.; Cooper, B.R.; Marchant-Forde, J.N.; Vreeman, R.C.; Hannou, S.; Knipp, G.T. Assessment of juvenile pigs to serve as human pediatric surrogates for preclinical formulation pharmacokinetic testing. AAPS J. 2013, 15, 763–774. [Google Scholar] [CrossRef] [PubMed]
- Le Floc’h, N.; Otten, W.; Merlot, E. Tryptophan metabolism, from nutrition to potential therapeutic applications. Amino Acids 2011, 41, 1195–1205. [Google Scholar] [CrossRef] [PubMed]
- Cady, S.G.; Sono, M. 1-Methyl-dl-tryptophan, β-(3-benzofuranyl)-dl-alanine (the oxygen analog of tryptophan), and β-[3-benzo (b) thienyl]-dl-alanine (the sulfur analog of tryptophan) are competitive inhibitors for indoleamine 2, 3-dioxygenase. Arch. Biochem. Biophys. 1991, 291, 326–333. [Google Scholar] [CrossRef]
- Forouhar, F.; Anderson, J.R.; Mowat, C.G.; Vorobiev, S.M.; Hussain, A.; Abashidze, M.; Bruckmann, C.; Thackray, S.J.; Seetharaman, J.; Tucker, T. Molecular insights into substrate recognition and catalysis by tryptophan 2, 3-dioxygenase. Proc. Natl. Acad. Sci. USA 2007, 104, 473–478. [Google Scholar] [CrossRef] [PubMed]
- Schmidt, S.K.; Siepmann, S.; Kuhlmann, K.; Meyer, H.E.; Metzger, S.; Pudelko, S.; Leineweber, M.; Daubener, W. Influence of tryptophan contained in 1-Methyl-Tryptophan on antimicrobial and immunoregulatory functions of indoleamine 2,3-dioxygenase. PLoS ONE 2012, 7, e44797. [Google Scholar] [CrossRef] [PubMed]
- Okuno, A.; Fukuwatari, T.; Shibata, K. Urinary excretory ratio of anthranilic acid/kynurenic acid as an index of the tolerable amount of tryptophan. Biosci. Biotechnol. Biochem. 2008, 72, 1667–1672. [Google Scholar] [CrossRef] [PubMed]
- DiNatale, B.C.; Murray, I.A.; Schroeder, J.C.; Flaveny, C.A.; Lahoti, T.S.; Laurenzana, E.M.; Omiecinski, C.J.; Perdew, G.H. Kynurenic acid is a potent endogenous aryl hydrocarbon receptor ligand that synergistically induces interleukin-6 in the presence of inflammatory signaling. Toxicol. Sci. 2010, 115, 89–97. [Google Scholar] [CrossRef] [PubMed]
- De Luca, A.; Montagnoli, C.; Zelante, T.; Bonifazi, P.; Bozza, S.; Moretti, S.; D’Angelo, C.; Vacca, C.; Boon, L.; Bistoni, F. Functional yet balanced reactivity to Candida albicans requires TRIF, MyD88, and IDO-dependent inhibition of Rorc. J. Immunol. 2007, 179, 5999–6008. [Google Scholar] [CrossRef] [PubMed]
- Kerkvliet, N.I. AHR-mediated immunomodulation: the role of altered gene transcription. Biochem. Pharmacol. 2009, 77, 746–760. [Google Scholar] [CrossRef] [PubMed]
- Mulero-Navarro, S.; Fernandez-Salguero, P.M. New trends in aryl hydrocarbon receptor biology. Front. Cell Dev. Biol. 2016, 4, 45. [Google Scholar] [CrossRef] [PubMed]
- Okamoto, T.; Toné, S.; Kanouchi, H.; Miyawaki, C.; Ono, S.; Minatogawa, Y. Transcriptional regulation of indoleamine 2, 3-dioxygenase (IDO) by tryptophan and its analogue. Cytotechnology 2007, 54, 107–113. [Google Scholar] [CrossRef] [PubMed]
- Qian, F.; Villella, J.; Wallace, P.K.; Mhawech-Fauceglia, P.; Tario, J.D.; Andrews, C.; Matsuzaki, J.; Valmori, D.; Ayyoub, M.; Frederick, P.J. Efficacy of levo-1-methyl tryptophan and dextro-1-methyl tryptophan in reversing indoleamine-2, 3-dioxygenase–mediated arrest of T-cell proliferation in human epithelial ovarian cancer. Cancer Res. 2009, 69, 5498–5504. [Google Scholar] [CrossRef] [PubMed]
- Soliman, H.H.; Jackson, E.; Neuger, T.; Dees, E.C.; Harvey, R.D.; Han, H.; Ismail-Khan, R.; Minton, S.; Vahanian, N.N.; Link, C. A first in man phase I trial of the oral immunomodulator, indoximod, combined with docetaxel in patients with metastatic solid tumors. Oncotarget 2014, 5, 8136. [Google Scholar] [CrossRef] [PubMed]
- Basran, J.; Rafice, S.A.; Chauhan, N.; Efimov, I.; Cheesman, M.R.; Ghamsari, L.; Raven, E.L. A kinetic, spectroscopic, and redox study of human tryptophan 2,3-dioxygenase. Biochemistry 2008, 47, 4752–4760. [Google Scholar] [CrossRef] [PubMed]
- Chauhan, N.; Thackray, S.J.; Rafice, S.A.; Eaton, G.; Lee, M.; Efimov, I.; Basran, J.; Jenkins, P.R.; Mowat, C.G.; Chapman, S.K. Reassessment of the reaction mechanism in the heme dioxygenases. J. Am. Chem. Soc. 2009, 131, 4186–4187. [Google Scholar] [CrossRef] [PubMed]
- Bilandžić, N.; Žurić, M.; Lojkić, M.; Šimić, B.; Milić, D.; Barač, I. Cortisol and immune measures in boars exposed to three-day administration of exogenous adrenocorticotropic hormone. Vet. Res. Commun. 2006, 30, 433–444. [Google Scholar] [CrossRef] [PubMed]
- Ljungstrom, L.R.; Jacobsson, G.; Andersson, R. Neutrophil-lymphocyte count ratio as a biomarker of severe sepsis in Escherichia coli infections in adults. Crit. Care 2013, 17, P25. [Google Scholar] [CrossRef]
- Agaugué, S.; Perrin-Cocon, L.; Coutant, F.; André, P.; Lotteau, V. 1-Methyl-tryptophan can interfere with TLR signaling in dendritic cells independently of IDO activity. J. Immunol. 2006, 177, 2061–2071. [Google Scholar] [CrossRef] [PubMed]
- Opitz, C.A.; Litzenburger, U.M.; Opitz, U.; Sahm, F.; Ochs, K.; Lutz, C.; Wick, W.; Platten, M. The indoleamine-2, 3-dioxygenase (IDO) inhibitor 1-methyl-D-tryptophan upregulates IDO1 in human cancer cells. PLoS ONE 2011, 6, e19823. [Google Scholar] [CrossRef] [PubMed]
- Dantzer, R.; O’Connor, J.C.; Freund, G.G.; Johnson, R.W.; Kelley, K.W. From inflammation to sickness and depression: when the immune system subjugates the brain. Nat. Rev. Neurosci. 2008, 9, 46–56. [Google Scholar] [CrossRef] [PubMed] [Green Version]
- Schettler, G.; Andrassy, K. Innere Medizin: Verstehen-Lernen-Anwenden, 9th ed.; Thieme: Stuttgart, Germany, 1998; ISBN 3135522091. [Google Scholar]
- Moyer, B.J.; Rojas, I.Y.; Murray, I.A.; Lee, S.; Hazlett, H.F.; Perdew, G.H.; Tomlinson, C.R. Indoleamine 2,3-dioxygenase 1 (IDO1) inhibitors activate the aryl hydrocarbon receptor. Toxicol. Appl. Pharmacol. 2017, 323, 74–80. [Google Scholar] [CrossRef] [PubMed] [Green Version]
- Hu, W.; Sorrentino, C.; Denison, M.S.; Kolaja, K.; Fielden, M.R. Induction of cyp1a1 is a nonspecific biomarker of aryl hydrocarbon receptor activation: results of large scale screening of pharmaceuticals and toxicants in vivo and in vitro. Mol. Pharmacol. 2007, 71, 1475–1486. [Google Scholar] [CrossRef] [PubMed]
- Tuchscherer, M.; Kanitz, E.; Puppe, B.; Tuchscherer, A.; Stabenow, B. Effects of postnatal social isolation on hormonal and immune responses of pigs to an acute endotoxin challenge. Physiol. Behav. 2004, 82, 503–511. [Google Scholar] [CrossRef] [PubMed]
- Félix, B.; Léger, M.-E.; Albe-Fessard, D.; Marcilloux, J.-C.; Rampin, O.; Laplace, J.-P.; Duclos, A.; Fort, F.; Gougis, S.; Costa, M. Stereotaxic atlas of the pig brain. Brain Res. Bull. 1999, 49, 1–137. [Google Scholar] [CrossRef]
- EMA, Committee for Medicinal Products for Human Use (CHMP). Guideline on Bioanalytical Method Validation; European Medicines Agency: London, UK, 2011. [Google Scholar]
- US Food and Drug Administration. Guidance for Industry: Bioanalytical Method Validation; U.S. Department of Health and Human Services: Silver Spring, MD, USA, September 2013; pp. 4–10. [Google Scholar]
- Suzuki, Y.; Suda, T.; Asada, K.; Miwa, S.; Suzuki, M.; Fujie, M.; Furuhashi, K.; Nakamura, Y.; Inui, N.; Shirai, T.; et al. Serum indoleamine 2,3-dioxygenase activity predicts prognosis of pulmonary tuberculosis. Clin. Vaccine Immunol. 2012, 19, 436–442. [Google Scholar] [CrossRef] [PubMed]
- Tuchscherer, M.; Otten, W.; Kanitz, E.; Gräbner, M.; Tuchscherer, A.; Bellmann, O.; Rehfeldt, C.; Metges, C.C. Effects of inadequate maternal dietary protein: carbohydrate ratios during pregnancy on offspring immunity in pigs. BMC Vet. Res. 2012, 8, 232. [Google Scholar] [CrossRef] [PubMed]
- Niepage, H. Methoden der praktischen Hämatologie für Tierärzte, 2nd ed.; Verlag Paul Parey: Berlin, Germany, 1989. [Google Scholar]
- Lehner, P.N. Sampling methods in behavior research. Poult. Sci. 1992, 71, 643–649. [Google Scholar] [CrossRef] [PubMed]
- Brenmoehl, J.; Lang, M.; Hausmann, M.; Leeb, S.N.; Falk, W.; Schölmerich, J.; Göke, M.; Rogler, G. Evidence for a differential expression of fibronectin splice forms ED-A and ED-B in Crohn’s disease (CD) mucosa. Int. J. Colorectal Dis. 2007, 22, 611–623. [Google Scholar] [CrossRef] [PubMed]
- Livak, K.J.; Schmittgen, T.D. Analysis of relative gene expression data using real-time quantitative PCR and the 2−ΔΔCt method. Methods 2001, 25, 402–408. [Google Scholar] [CrossRef] [PubMed]


| 1-MT | MYR | SE | p Value | |||||
|---|---|---|---|---|---|---|---|---|
| LPS LSM | NaCl LSM | LPS LSM | NaCl LSM | 1-MT vs. MYR | LPS vs. NaCl | Interaction | ||
| TRP (µM) | 127.38 A | 129.67 A | 115.63 B | 122.29 C | 1.10 | <0.001 | <0.001 | <0.05 |
| KYN (µM) | 1.64 A | 0.99 B | 1.54 A,B | 1.17 A,B | 0.16 | 0.78 | <0.01 | 0.40 |
| KYN/TRP ratio | 1.22 A | 0.83 B | 1.30 A | 0.98 A,B | 0.11 | 0.22 | <0.001 | 0.69 |
| KYNA (µM) | 11.9 A | 11.5 B | 2.1 C | 2.1 C | 0.07 | <0.001 | <0.001 | <0.01 |
| QUIN (µM) | 1.98 A | 1.83 A | 2.18 B | 1.98 A | 0.05 | <0.01 | <0.001 | 0.36 |
| 1-MT LSM | MYR LSM | SE | p Value | LPS LSM | NaCl LSM | SE | p Value | |
|---|---|---|---|---|---|---|---|---|
| TRP (nmol/g protein) | ||||||||
| Amygdala | 1094 | 1067 | 88 | 0.83 | 892 | 1269 | 88 | <0.01 |
| Prefrontal cortex | 563 | 416 | 29 | <0.001 | 477 | 502 | 29 | 0.47 |
| Adrenal gland | 1062 | 855 | 46 | <0.001 | 926 | 992 | 46 | 0.22 |
| Muscle | 484 | 385 | 19 | <0.001 | 397 | 472 | 18 | <0.01 |
| Lung | 489 | 393 | 32 | <0.05 | 396 | 486 | 31 | <0.05 |
| Liver | 715 | 619 | 33 | <0.05 | 597 | 737 | 32 | <0.01 |
| Heart | 685 | 569 | 41 | <0.05 | 569 | 685 | 39 | <0.05 |
| Hippocampus | 224 | 178 | 11 | <0.01 | 189 | 213 | 11 | 0.12 |
| Hypothalamus | 79 | 67 | 4 | <0.05 | 70 | 76 | 4 | 0.19 |
| Spleen | 746 | 636 | 31 | <0.05 | 687 | 696 | 32 | 0.84 |
| Kidney | 1337 | 1249 | 42 | 0.10 | 1211 | 1375 | 42 | <0.01 |
| Thyroid gland | 459 | 495 | 30 | 0.31 | 469 | 485 | 29 | 0.67 |
| KYN (nmol/g protein) | ||||||||
| Liver | 604.86 | 590.86 | 35.62 | 0.64 | 586.74 | 608.98 | 34.99 | 0.48 |
| Lung | 123.16 | 156.84 | 21.97 | 0.29 | 180.15 | 99.85 | 22.08 | <0.05 |
| Spleen | 12.83 | 11.45 | 1.79 | 0.58 | 18.28 | 6.00 | 1.80 | <0.001 |
| Hippocampus | 19.69 | 19.74 | 1.78 | 0.98 | 19.50 | 19.93 | 1.78 | 0.87 |
| KYNA (nmol/g protein) | ||||||||
| Lung | 3.83 | 2.4 | 0.34 | <0.01 | 3.34 | 2.90 | 0.005 | 0.30 |
| Kidney | 0.71 | 0.57 | 0.05 | <0.05 | 0.65 | 0.63 | 0.05 | 0.80 |
| Liver | 5.84 | 4.75 | 0.46 | 0.06 | 5.64 | 4.95 | 0.47 | 0.23 |
| Analyte | Accuracy (%) | Precision (%) | Range (µM) | Linearity (R) |
|---|---|---|---|---|
| 1-MT | −7.8–4.0 | 2.3–7.0 | 2.3−69 | 0.9966–0.9992 |
| TRP | −5.9–3.3 | 1.7–9.9 | 1.2–49 | 0.9986–0.9995 |
| KYN | −9.5–13.5 | 3.9–14.5 | 0.24–24 | 0.9969–0.9990 |
| KYNA | −9.9–15.7 | 6.8–14.9 | 0.01–0.32 | 0.9931–0.9946 |
| QUIN | −19.8–18.4 | 7.6–19.8 | 18–359 | 0.9590–0.9957 |
| Category | Behaviour |
|---|---|
| Symptoms of Sickness | Shivering; impeded respiration; vomiting; diarrhoea; circulatory insufficiency |
| Activity | Walking; drinking; employment with feed, bedding, trough, toy or piglet from neighbouring pen |
| Inactivity | Lying; sitting; standing without movement |
© 2018 by the authors. Licensee MDPI, Basel, Switzerland. This article is an open access article distributed under the terms and conditions of the Creative Commons Attribution (CC BY) license (http://creativecommons.org/licenses/by/4.0/).
Share and Cite
Wirthgen, E.; Otten, W.; Tuchscherer, M.; Tuchscherer, A.; Domanska, G.; Brenmoehl, J.; Günther, J.; Ohde, D.; Weitschies, W.; Seidlitz, A.; et al. Effects of 1-Methyltryptophan on Immune Responses and the Kynurenine Pathway after Lipopolysaccharide Challenge in Pigs. Int. J. Mol. Sci. 2018, 19, 3009. https://doi.org/10.3390/ijms19103009
Wirthgen E, Otten W, Tuchscherer M, Tuchscherer A, Domanska G, Brenmoehl J, Günther J, Ohde D, Weitschies W, Seidlitz A, et al. Effects of 1-Methyltryptophan on Immune Responses and the Kynurenine Pathway after Lipopolysaccharide Challenge in Pigs. International Journal of Molecular Sciences. 2018; 19(10):3009. https://doi.org/10.3390/ijms19103009
Chicago/Turabian StyleWirthgen, Elisa, Winfried Otten, Margret Tuchscherer, Armin Tuchscherer, Grazyna Domanska, Julia Brenmoehl, Juliane Günther, Daniela Ohde, Werner Weitschies, Anne Seidlitz, and et al. 2018. "Effects of 1-Methyltryptophan on Immune Responses and the Kynurenine Pathway after Lipopolysaccharide Challenge in Pigs" International Journal of Molecular Sciences 19, no. 10: 3009. https://doi.org/10.3390/ijms19103009