
Effect of γ-Cyclodextrin Inclusion Complex on the Absorption of R-α-Lipoic Acid in Rats

Abstract
:1. Introduction
2. Results
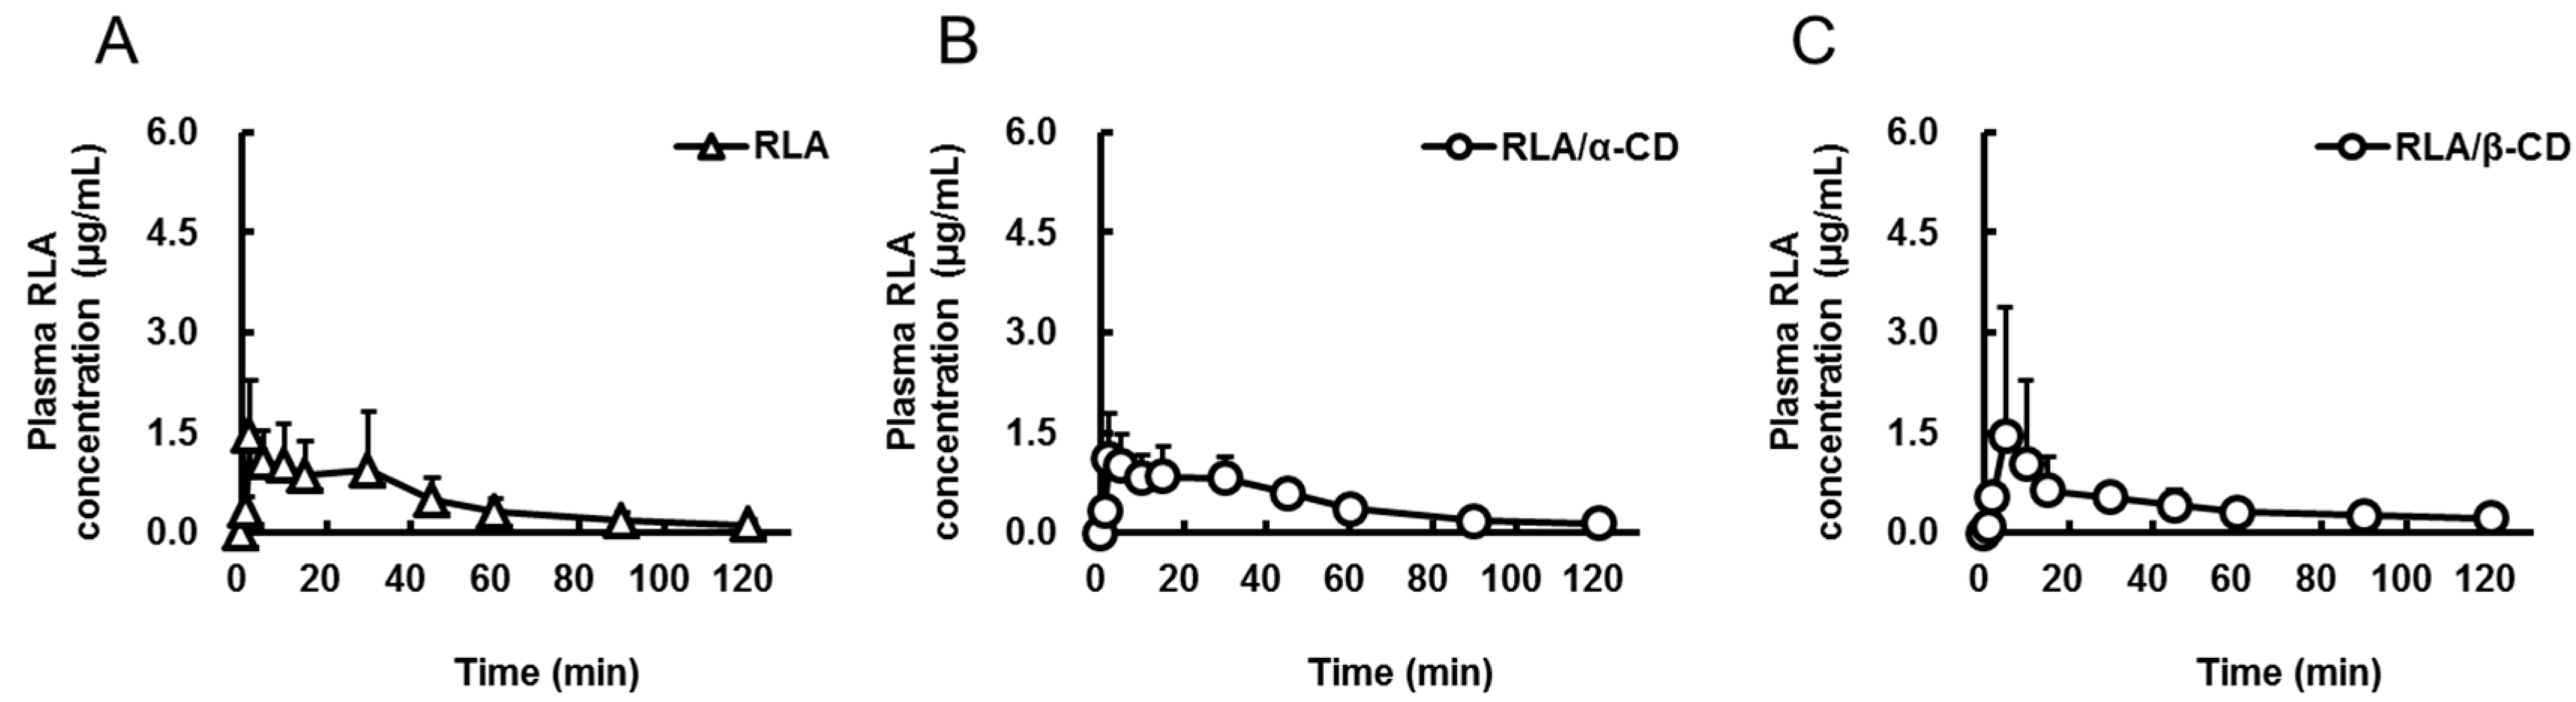
2.1. Absorption after Oral Administration of RLA and Its CD Inclusion Complexes


| Formulation | RLA | RLA/α-CD | RLA/β-CD | RLA/γ-CD | RLA-Na |
|---|---|---|---|---|---|
| Route | po | po | po | po | iv |
| Dose as amount of RLA (mg/kg) | 20 | 20 | 20 | 20 | 5 |
| Cmax or C0 (µg/mL) | 1.7 ± 0.9 | 1.4 ± 0.6 | 1.6 ± 1.9 | 3.4 ± 2.5 | 19.5 ± 3.3 |
| Tmax (min) | 11.8 ± 14.1 | 10.7 ± 10.7 | 33.3 ± 44.0 | 9.0 ± 10.7 | not determined |
| AUC0-t (µg·min/mL) | 56 ± 35 * | 56 ± 12 * | 50 ± 19 * | 121 ± 24 | 96 ± 19 |
| AUCpo/AUCiv (%) | 14.6 | 14.6 | 13 | 31.5 | not calculated |
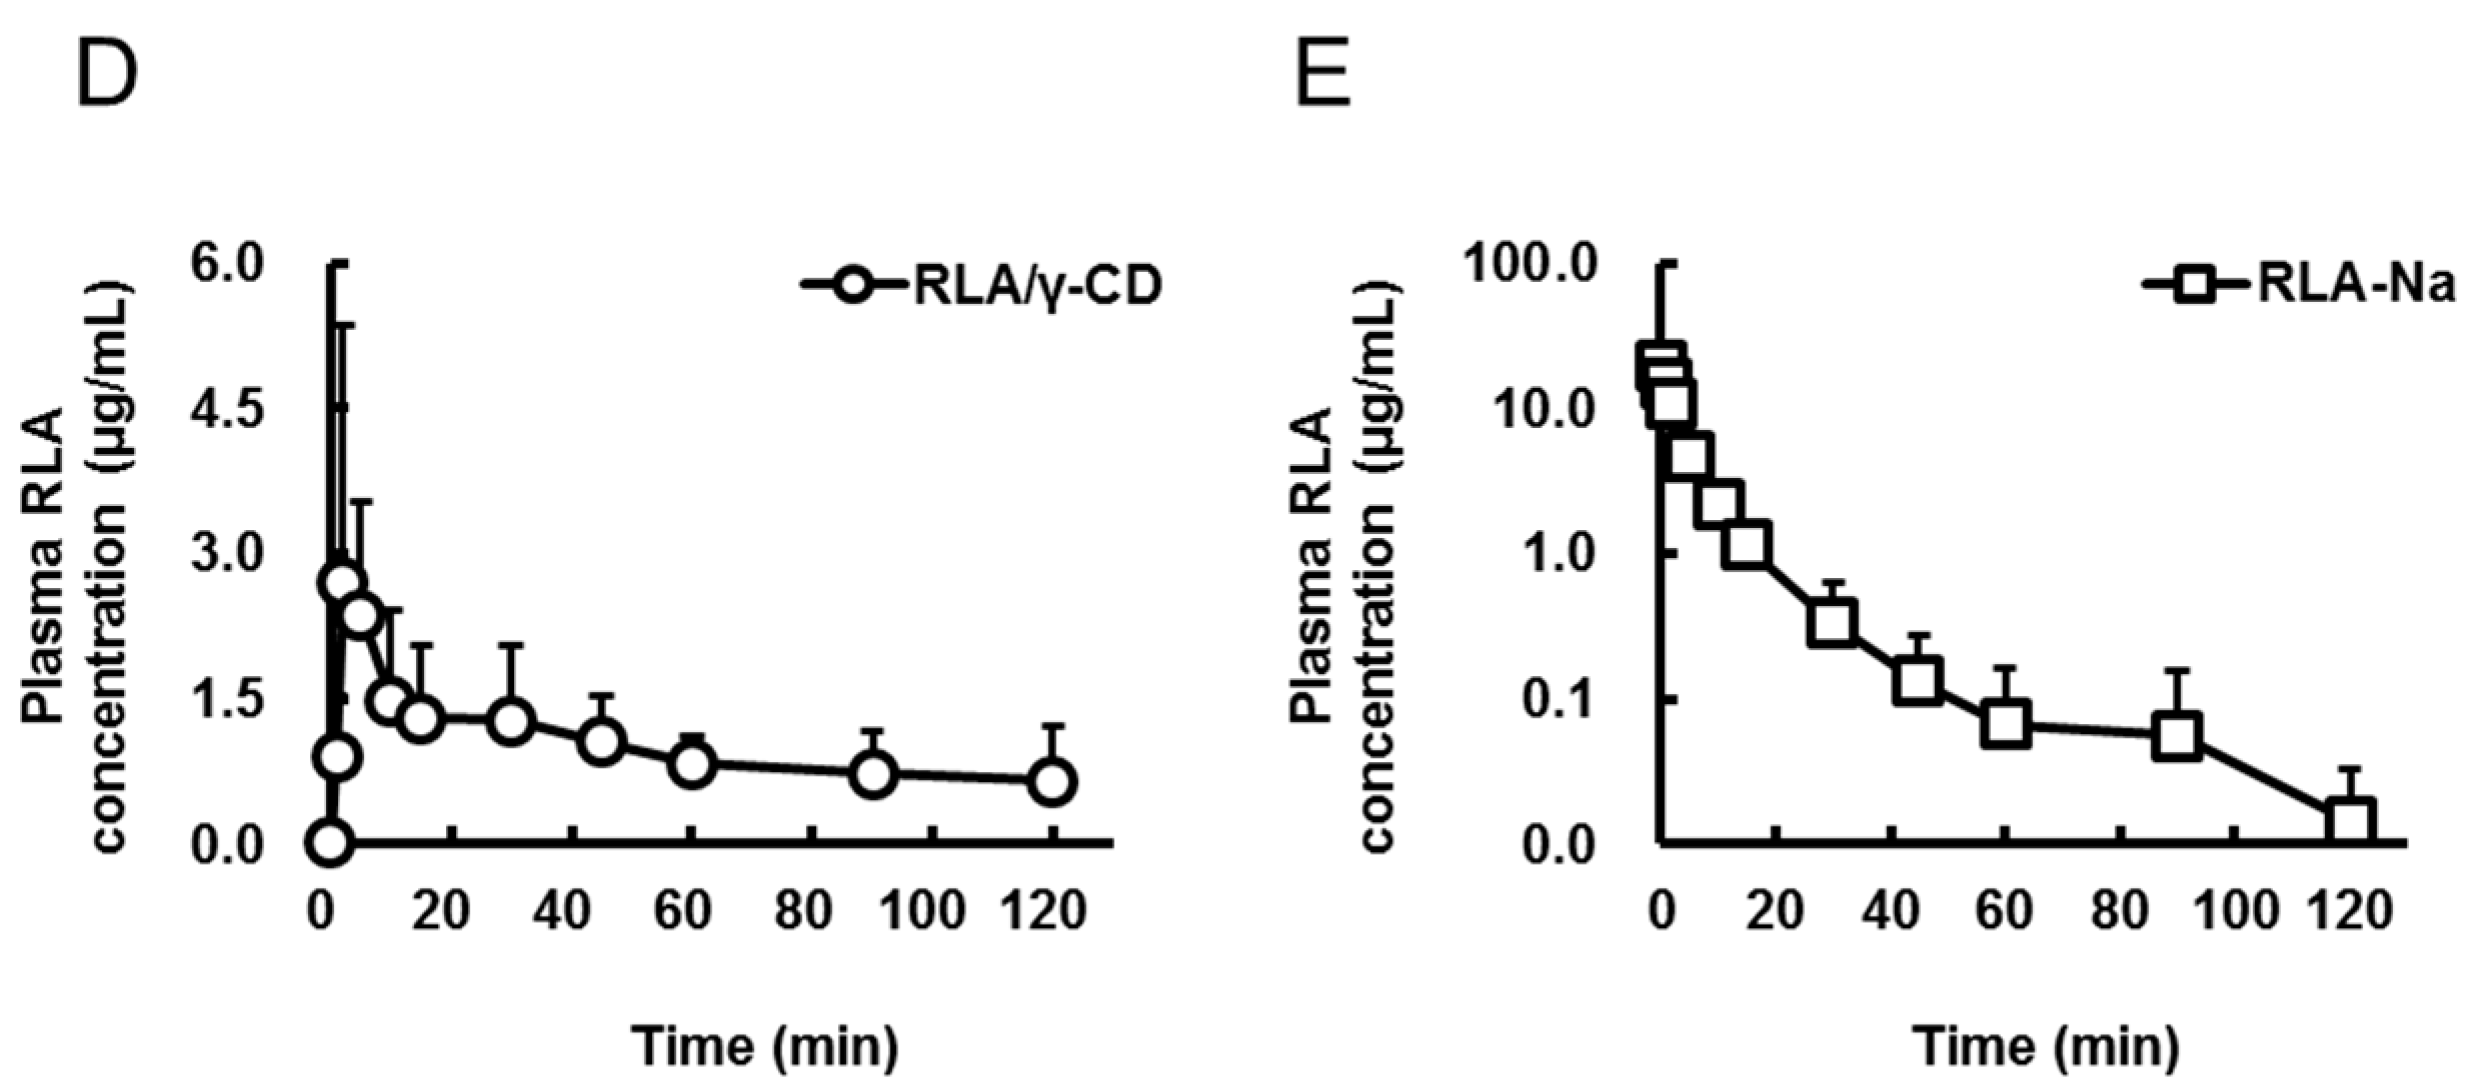
2.2. Absorption Site of RLA after Administration as RLA/γ-CD

| Formulation | RLA | RLA/γ-CD | RLA | RLA/γ-CD |
|---|---|---|---|---|
| Route | po under PL | po under PL | id | id |
| Group number | 1 | 2 | 3 | 4 |
| Cmax (µg/mL) | 1.1 ± 0.4 *, a,b | 1.3 ± 0.6 *, c,d | 5.4 ± 0.6 *, a,c,e | 14.9 ± 3.9 *, b,d,e |
| Tmax (min) | 5.7 ± 4.4 | 2.5 ± 1.1 | 1.7 ± 0.5 | 5.2 ± 2.6 |
| AUC0–t (µg·min/mL) | 32 ± 14 *, b | 33 ± 16 *, d | 46 ± 15 *, e | 235 ± 45 *, b,d,e |
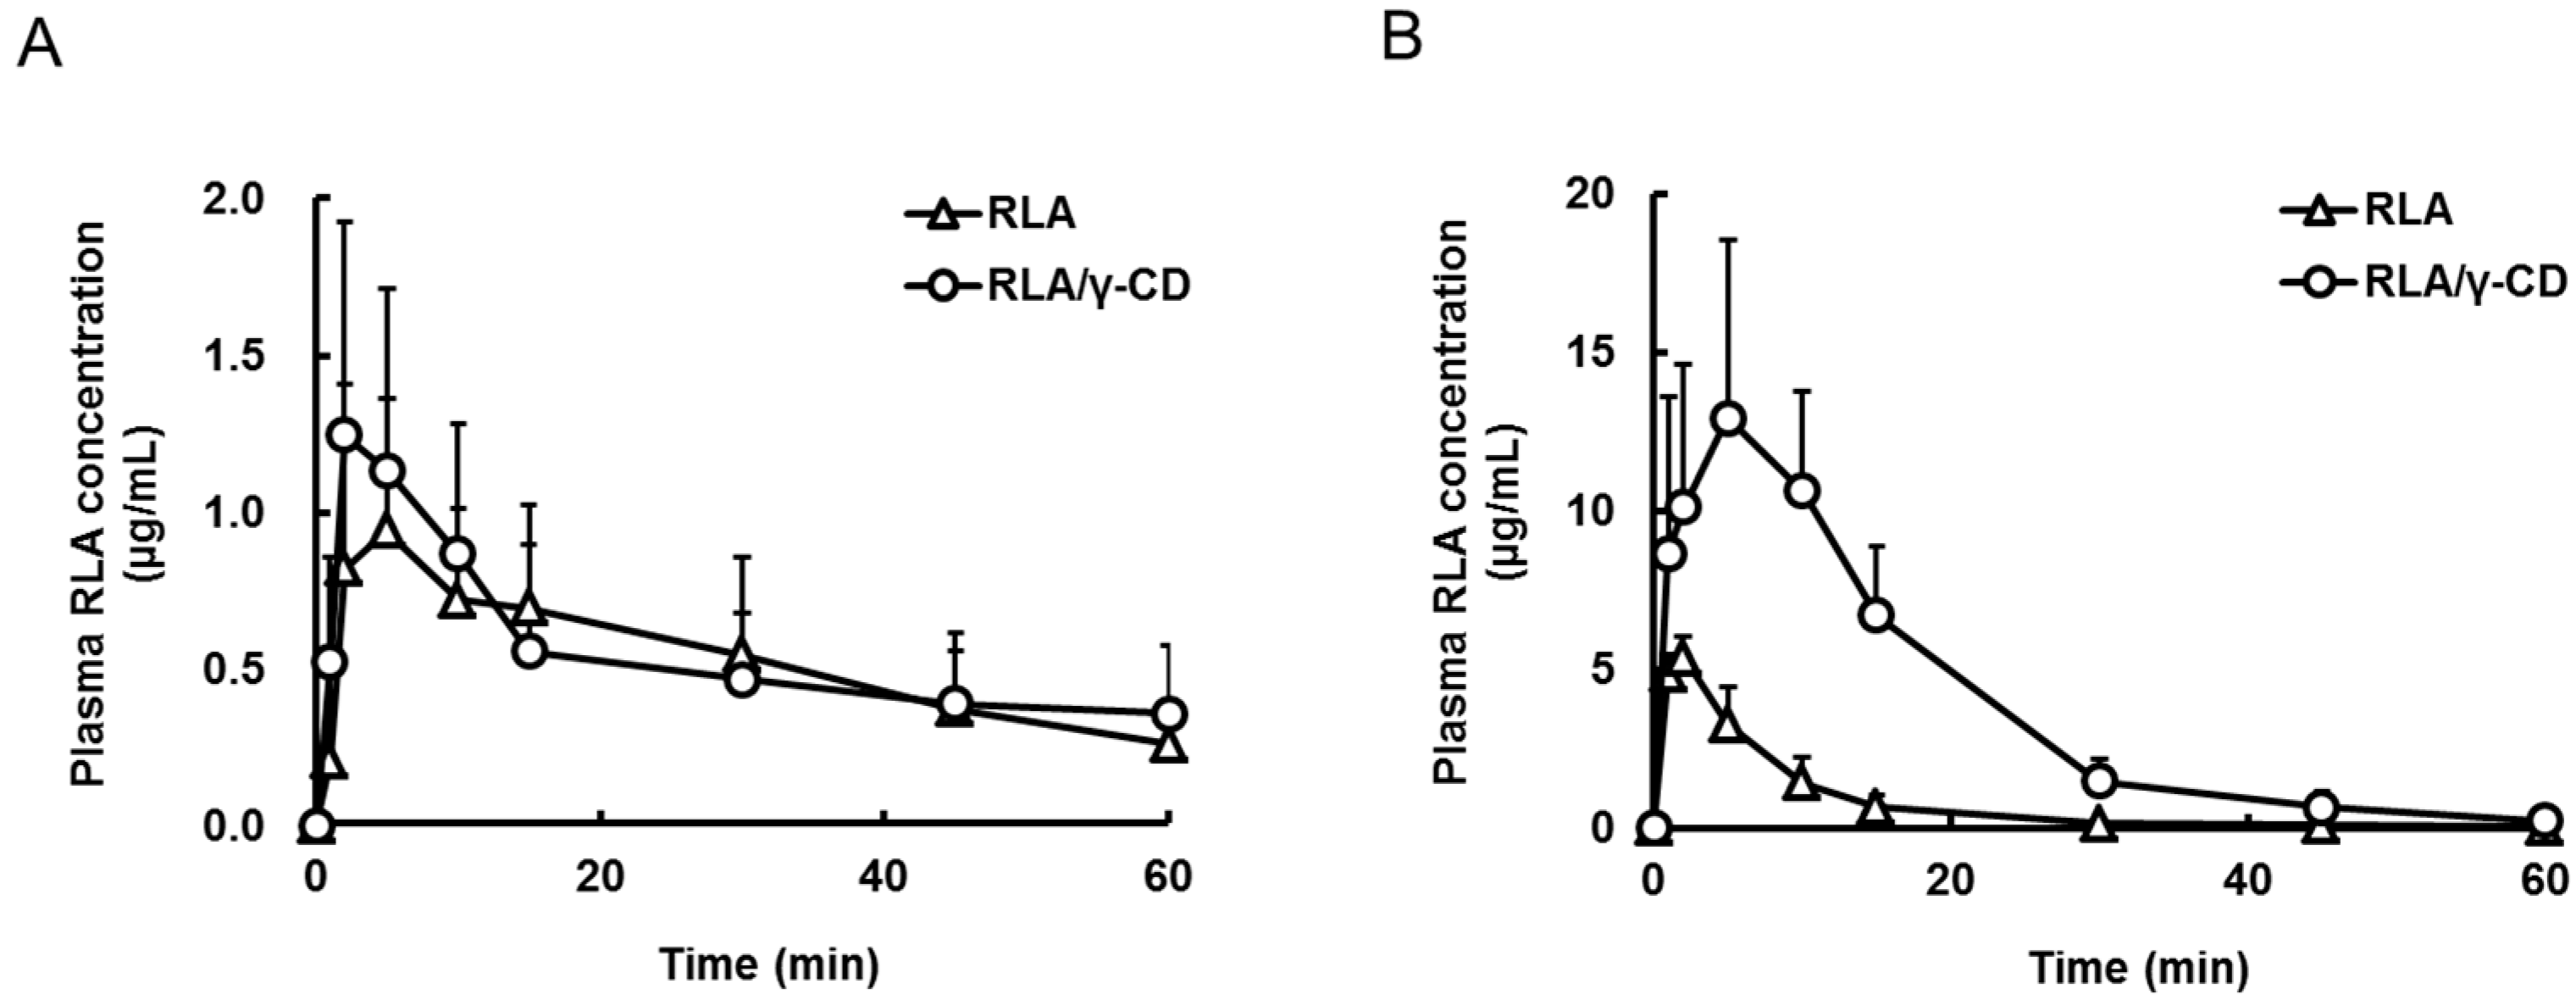
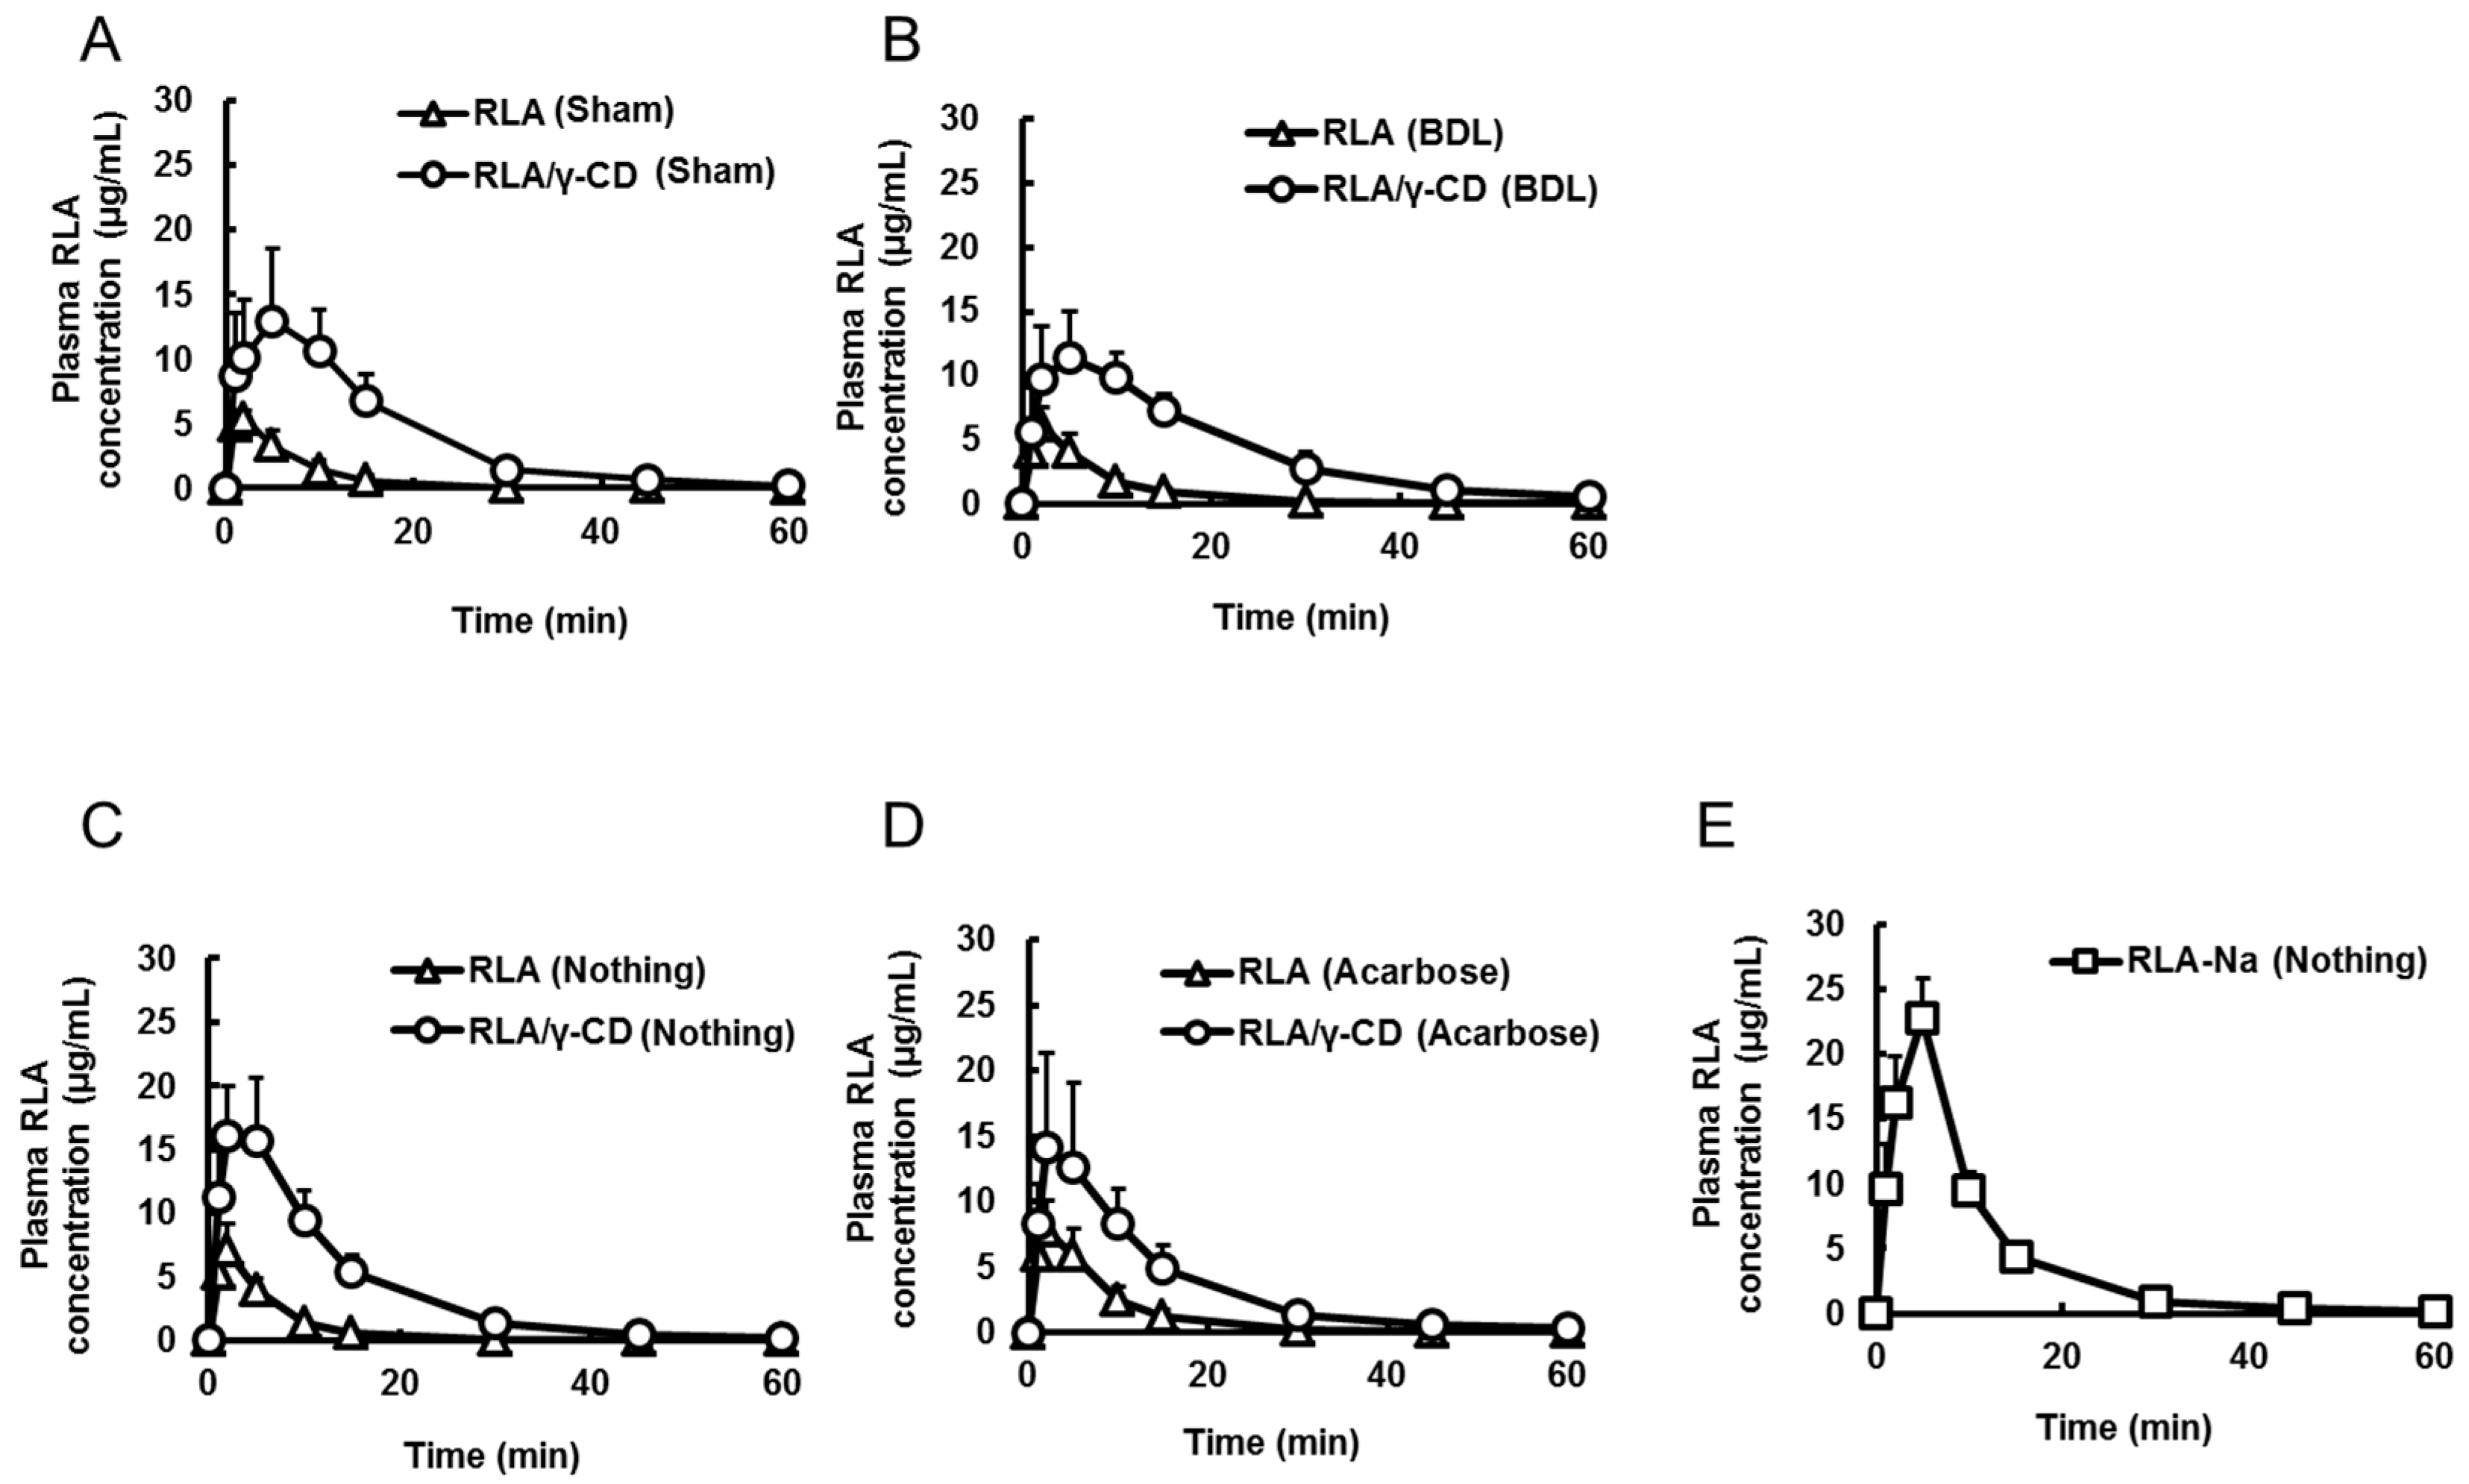
2.3. Effects of Bile Acid, α-Amylase, and Dissolution on RLA Absorption after Administration as RLA/γ-CD

| Formulation | RLA | RLA/γ-CD | RLA | RLA/γ-CD | RLA-Na | RLA-Na |
|---|---|---|---|---|---|---|
| Route | id | id | id | id | iv | iv |
| Group number | 1 | 2 | 3 | 4 | not determined | not determined |
| Operation | Sham | Sham | BDL | BDL | Sham | BDL |
| Cmax or C0 (µg/mL) | 5.7 ± 0.8 *,a,b | 16.9 ± 5.2 *,a,c | 5.8 ± 1.7 *,c,b | 11.9 ± 3.5 *,b,d | 79.4 ± 20.9 | 79.2 ± 10.9 |
| Tmax (min) | 1.8 ± 0.4 *,b | 5.2 ± 2.9 | 1.8 ± 0.4 *,b | 6.2 ± 3.2 *,b,d | not determined | not determined |
| AUC0–t (µg·min/mL) | 49 ± 16 *,a,b | 260 ± 50 *,a,c | 54 ± 17 *,c,d | 259 ± 55 *,b,d | 516 ± 87 | 540 ± 79 |
| Formulation | RLA | RLA/γ-CD | RLA | RLA/γ-CD | RLA-Na |
|---|---|---|---|---|---|
| Route | id | id | id | id | id |
| Group number | 1 | 2 | 3 | 4 | 5 |
| Combined-drug | Nothing | Nothing | Acarbose | Acarbose | Nothing |
| Cmax (µg/mL) | 7.0 ± 2.1 *,a,b,c | 17.1 ± 4.3 *,a,d | 8.3 ± 1.9 *,d,e | 14.6 ± 7.2 *,b,f | 23.8 ± 1.2 *,c,e,f |
| Tmax (min) | 1.8 ± 0.4 *,c | 2.8 ± 1.7 | 3.5 ± 1.6 | 2.5 ± 1.2 | 4.5 ± 1.2 *,c |
| AUC0-t (µg·min/mL) | 49 ± 10 *,a,b,c | 234 ± 47 *,a,d | 76 ± 20 *,d,e,g | 210 ± 57 *,b,g | 245 ± 24 *,c,e |
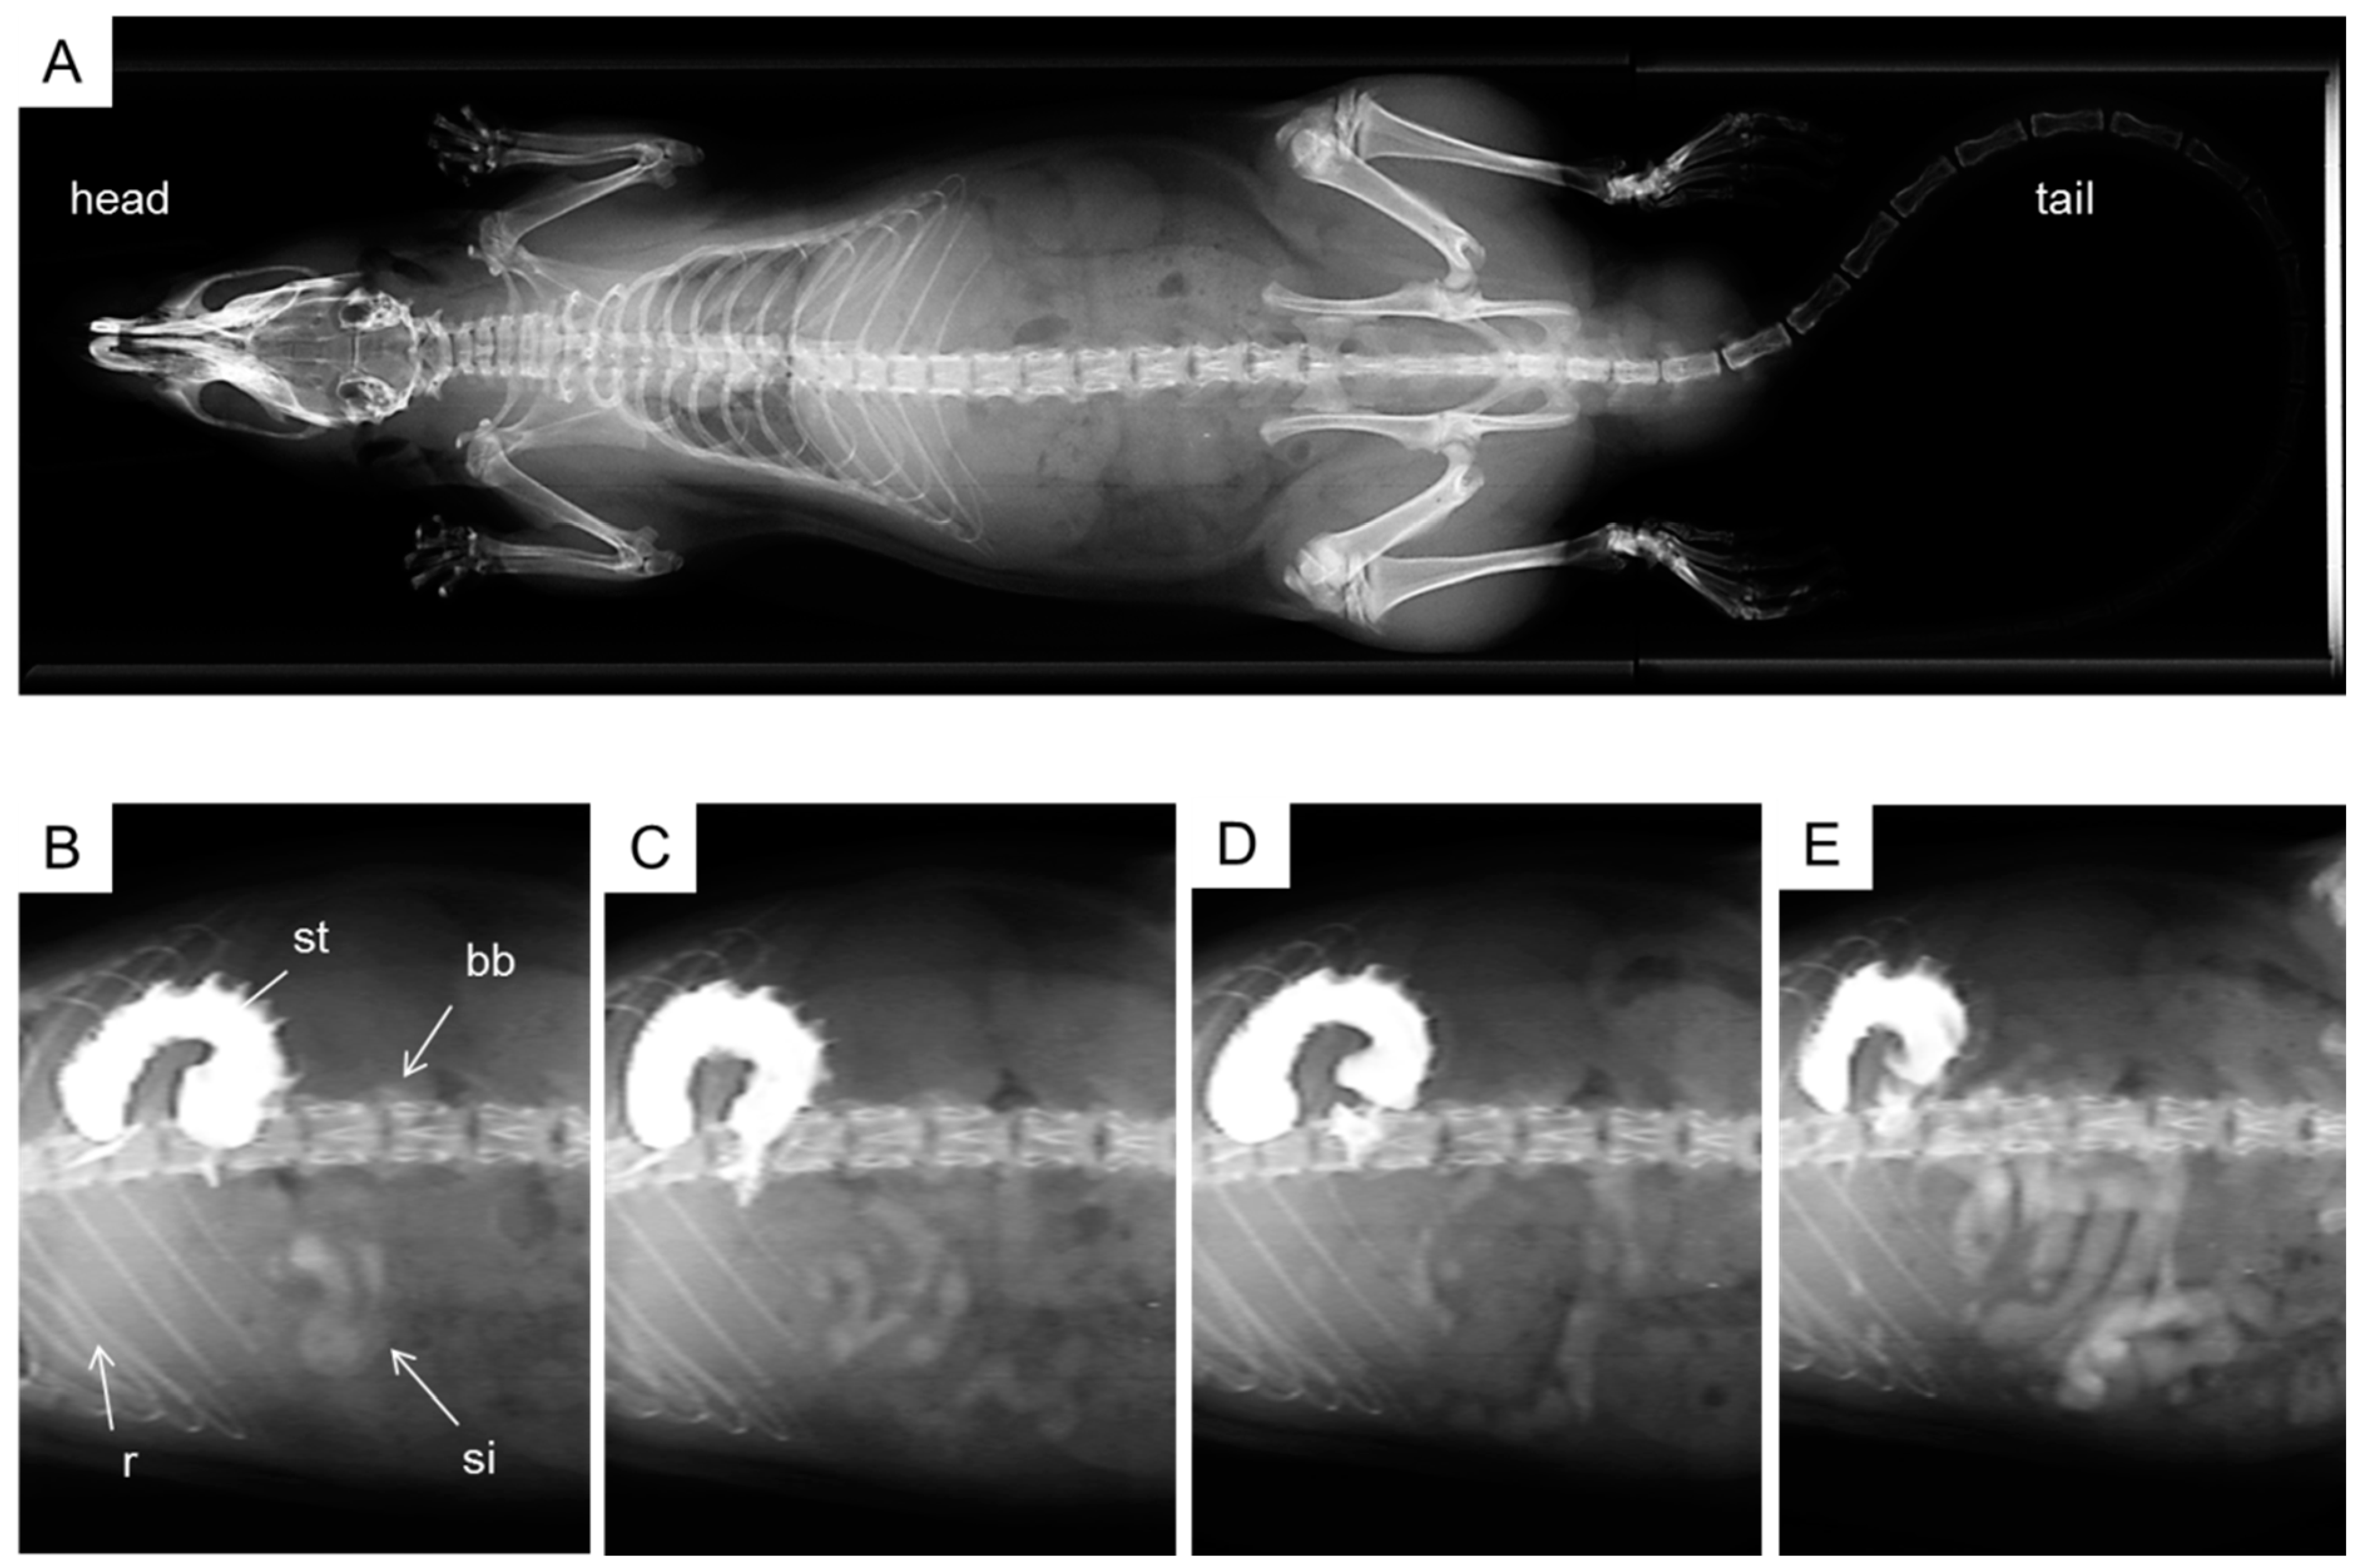
2.4. X-ray Imaging
3. Discussion

4. Experimental Section
4.1. Chemicals and Reagents
4.2. Animals
4.3. Drug Administration
4.4. Bile Duct Ligation
4.5. Assay of α-Amylase Activity in the Intestinal Lumen
4.6. Blood Collection
4.7. Determination of Plasma RLA Concentration by LC-MS/MS
4.8. X-ray Imaging
4.9. Measurement of Viscosity
4.10. Pharmacokinetics Analysis
4.11. Statistical Analysis
5. Conclusions
Acknowledgments
Author Contributions
Conflicts of Interest
References
- Parry, R.J. Biosynthesis of lipoic acid. 1. Incorporation of specifically tritiated octanoic acid into lipoic acid. J. Am. Chem. Soc. 1977, 99, 6464–6466. [Google Scholar] [CrossRef]
- Parry, R.J.; Trainor, D.A. Biosynthesis of lipoic acid. 2. Stereochemistry of sulfur introduction at C-6 of octanoic acid. J. Am. Chem. Soc. 1978, 100, 5243–5244. [Google Scholar] [CrossRef]
- Bramanti, V.; Tomassoni, D.; Bronzi, D.; Grasso, S.; Curro, M.; Avitabile, M.; Li Volsi, G.; Renis, M.; Ientile, R.; Amenta, F.; et al. α-Lipoic acid modulates GFAP, vimentin, nestin, cyclin D1 and MAP-kinase expression in astroglial cell cultures. Neurochem. Res. 2010, 35, 2070–2077. [Google Scholar] [CrossRef] [PubMed]
- Grasso, S.; Bramanti, V.; Tomassoni, D.; Bronzi, D.; Malfa, G.; Traini, E.; Napoli, M.; Renis, M.; Amenta, F.; Avola, R. Effect of lipoic acid and α-glyceryl-phosphoryl-choline on astroglial cell proliferation and differentiation in primary culture. J. Neurosci. Res. 2014, 92, 86–94. [Google Scholar] [CrossRef] [PubMed]
- Wada, H.; Shintani, D.; Ohlrogge, J. Why do mitochondria synthesize fatty acids? Evidence for involvement in lipoic acid production. Proc. Natl. Acad. Sci. USA 1997, 94, 1591–1596. [Google Scholar] [CrossRef] [PubMed]
- Morikawa, T.; Yasuno, R.; Wada, H. Do mammalian cells synthesize lipoic acid?: Identification of a mouse cDNA encoding a lipoic acid synthase located in mitochondria. FEBS Lett. 2001, 498, 16–21. [Google Scholar] [CrossRef] [PubMed]
- Reed, L.J. From lipoic acid to multi-enzyme complexes. Protein Sci. 1998, 7, 220–224. [Google Scholar] [CrossRef] [PubMed]
- Brookes, M.H.; Golding, B.T.; Howes, D.A.; Hudson, A.T. Proof that the absolute configuration of natural α-lipoic acid is R by the synthesis of its enantiomer [(S)-(−)-α-lipoic acid] from (S)-malic acid. J. Chem. Soc. Chem. Commun. 1983, 1051, 1051–1053. [Google Scholar] [CrossRef]
- Khanna, S.; Roy, S.; Packer, L.; Sen, C.K. Cytokine-induced glucose uptake in skeletal muscle: Redox regulation and the role of alpha-lipoic acid. Am. J. Physiol. 1999, 276, R1327–R1333. [Google Scholar] [PubMed]
- Femiano, F.; Scully, C.; Gombos, F. Idiopathic dysgeusia; an open trial of α lipoic acid (ALA) therapy. Int. J. Oral Maxillofac. Surg. 2002, 31, 625–628. [Google Scholar] [CrossRef] [PubMed]
- Sola, S.; Mir, M.Q.; Cheema, F.A.; Khan-Merchant, N.; Menon, R.G.; Parthasarathy, S.; Khan, B.V. Irbesartan and lipoic acid improve endothelial function and reduce markers of inflammation in the metabolic syndrome: Results of the irbesartan and lipoic acid in endothelial dysfunction (island) study. Circulation 2005, 111, 343–348. [Google Scholar] [CrossRef] [PubMed]
- Vincent, H.K.; Bourguignon, C.M.; Vincent, K.R.; Taylor, A.G. Effects of α-lipoic acid supplementation in peripheral arterial disease: A pilot study. J. Altern. Complement. Med. 2007, 13, 577–584. [Google Scholar] [CrossRef] [PubMed]
- Bustamante, J.; Lodge, J.K.; Marcocci, L.; Tritschler, H.J.; Packer, L.; Rihn, B.H. α-lipoic acid in liver metabolism and disease. Free Radic. Biol. Med. 1998, 24, 1023–1039. [Google Scholar] [CrossRef] [PubMed]
- Khamaisi, M.; Potashnik, R.; Tirosh, A.; Demshchak, E.; Rudich, A.; Tritschler, H.; Wessel, K.; Bashan, N. Lipoic acid reduces glycemia and increases muscle GLUT4 content in streptozotocin-diabetic rats. Metabolism 1997, 46, 763–768. [Google Scholar] [CrossRef] [PubMed]
- Singh, H.P.; Bowman, R.H. Effect of DL-α-lipoic acid on the citrate concentration and phosphofructokinase activity of perfused hearts from normal and diabetic rats. Biochem. Biophys. Res. Commun. 1970, 41, 555–561. [Google Scholar] [CrossRef] [PubMed]
- Koh, E.H.; Lee, W.J.; Lee, S.A.; Kim, E.H.; Cho, E.H.; Jeong, E.; Kim, D.W.; Kim, M.S.; Park, J.Y.; Park, K.G.; et al. Effects of α-lipoic acid on body weight in obese subjects. Am. J. Med. 2011, 124, 85e1–85e8. [Google Scholar] [CrossRef]
- Jörg, J.; Metz, F.; Scharafinski, H. Zur medikamentösen behandlung der diabetischen polyneuropathie mit der α-Liponsäure oder bitamin B-präparaten. Eine klinische und neurophysiologische studie. Nervenarzt 1988, 59, 36–44. [Google Scholar] [PubMed]
- Cremer, D.R.; Rabeler, R.; Roberts, A.; Lynch, B. Safety evaluation of α-lipoic acid (ALA). Regul. Toxicol. Pharmacol. 2006, 46, 29–41. [Google Scholar] [CrossRef] [PubMed]
- Ziegler, D.; Schatz, H.; Conrad, F.; Gries, F.A.; Ulrich, H.; Reichel, G. Effects of treatment with the antioxidant α-lipoic acid on cardiac autonomic neuropathy in NIDDM patients. A 4-month randomized controlled multicenter trial (DEKAN study). Diabetes Care 1997, 20, 369–373. [Google Scholar] [CrossRef] [PubMed]
- Reljanovic, M.; Reichel, G.; Rett, K.; Lobisch, M.; Schuette, K.; Moller, W.; Tritschler, H.J.; Mehnert, H. Treatment of diabetic polyneuropathy with the antioxidant thioctic acid (α-lipoic acid): A two year multicenter randomized double-blind placebo-controlled trial (ALADIN II). Free Radic. Res. 1999, 31, 171–179. [Google Scholar] [CrossRef] [PubMed]
- Ziegler, D.; Hanefeld, M.; Ruhnau, K.J.; Hasche, H.; Lobisch, M.; Schutte, K.; Kerum, G.; Malessa, R. Treatment of symptomatic diabetic polyneuropathy with the antioxidant α-lipoic acid. A 7-month multicenter randomized controlled trial (ALADIN III study). Diabetes Care 1999, 22, 1296–1301. [Google Scholar] [CrossRef] [PubMed]
- Ziegler, D.; Ametov, A.; Barinov, A.; Dyck, P.J.; Gurieva, I.; Low, P.A.; Munzel, U.; Yakhno, N.; Raz, I.; Novosadova, M.; et al. Oral treatment with α-lipoic acid improves symptomatic diabetic polyneuropathy. The SYDNEY 2 trial. Diabetes Care 2006, 29, 2365–2370. [Google Scholar] [CrossRef] [PubMed]
- Gal, E.M. Reversal of selective toxicity of (−)-α-lipoic acid by thiamine in thiamine-deficient rats. Nature 1965, 207, 535. [Google Scholar] [CrossRef] [PubMed]
- Ikuta, N.; Sugiyama, H.; Shimosegawa, H.; Nakane, R.; Ishida, Y.; Uekaji, Y.; Nakata, D.; Pallauf, K.; Rimbach, G.; Terao, K.; et al. Analysis of the enhanced stability of r(+)-α lipoic acid by the complex formation with cyclodextrins. Int. J. Mol. Sci. 2013, 14, 3639–3655. [Google Scholar] [CrossRef] [PubMed]
- Szejtli, J. Cyclodextrins. In Chemical and Functional Properties of Food Saccharides; Tomasik, P., Ed.; CRC Press: Boca Raton, FL, USA, 2003; pp. 271–289. [Google Scholar]
- Lina, B.A.; Bar, A. Subchronic oral toxicity studies with α-cyclodextrin in rats. Regul. Toxicol. Pharmacol. 2004, 39, 14–26. [Google Scholar] [CrossRef]
- Carrier, R.L.; Miller, L.A.; Ahmed, I. The utility of cyclodextrins for enhancing oral bioavailability. J. Control. Release 2007, 123, 78–99. [Google Scholar] [CrossRef] [PubMed]
- Uekama, K.; Fujinaga, T.; Otagiri, M.; Seo, H.; Tsuruoka, M. Enhanced bioavailability of digoxin by γ-cyclodextrin complexation. J Pharmacobiodyn. 1981, 4, 735–737. [Google Scholar] [CrossRef] [PubMed]
- Uekama, K.; Narisawa, S.; Hirayama, F.; Otagiri, M. Improvement of dissolution and absorption characteristics of benzodiazepines by cyclodextrin complexation. Int. J. Pharm. 1983, 16, 327–338. [Google Scholar] [CrossRef]
- Wong, J.W.; Yuen, K.H. Improved oral bioavailability of artemisinin through inclusion complexation with β- and γ-cyclodextrins. Int. J. Pharm. 2001, 227, 177–185. [Google Scholar] [CrossRef] [PubMed]
- Terao, K.; Nakata, D.; Fukumi, H.; Schmide, G.; Arima, H.; Hirayama, F.; Uekama, K. Enhancement of oral bioavailability of coenzyme Q10 by complexation with γ-cyclodextrin in healthy adults. Nutr. Res. 2006, 26, 503–508. [Google Scholar] [CrossRef]
- Chng, H.T.; New, L.S.; Neo, A.H.; Goh, C.W.; Browne, E.R.; Chan, E.C. Distribution study of orally administered lipoic acid in rat brain tissues. Brain Res. 2009, 1251, 80–86. [Google Scholar] [CrossRef] [PubMed]
- Peter, G.; Borbe, H.O. Absorption of [7,8–14C]rac-α-lipoic acid from in situ ligated segments of the gastrointestinal tract of the rat. Arzneimittel-Forschung 1995, 45, 293–299. [Google Scholar] [PubMed]
- Ward, F.W.; Coates, M.E. Gastrointestinal pH measurement in rats: Influence of the microbial flora, diet and fasting. Lab. Anim. 1987, 21, 216–222. [Google Scholar] [CrossRef] [PubMed]
- McConnell, E.L.; Basit, A.W.; Murdan, S. Measurements of rat and mouse gastrointestinal ph, fluid and lymphoid tissue, and implications for in-vivo experiments. J. Pharm. Pharmacol. 2008, 60, 63–70. [Google Scholar] [CrossRef] [PubMed]
- Uekaji, Y.; Jo, A.; Ohnishi, M.; Nakata, D.; Terao, K. A new generation of nutra-ceuticals and cosme-ceuticals complexing lipophilic bioactives with γ-cyclodextrin. Trans. Mater. Res. Sci. Jpn. 2012, 3, 89–94. [Google Scholar] [CrossRef]
- Connors, K.A. The stability of cyclodextrin complexes in solution. Chem. Rev. 1997, 97, 1325–1358. [Google Scholar] [CrossRef] [PubMed]
- Trentin, M.; Carofiglio, T.; Fornasier, R.; Tonellato, U. Capillary zone electrophoresis study of cyclodextrin-lipoic acid host-guest interaction. Electrophoresis 2002, 23, 4117–4122. [Google Scholar] [CrossRef] [PubMed]
- Tokihiro, K.; Arima, H.; Tajiri, S.; Irie, T.; Hirayama, F.; Uekama, K. Improvement of subcutaneous bioavailability of insulin by sulphobutyl ether β-cyclodextrin in rats. J. Pharm. Pharmacol. 2000, 52, 911–917. [Google Scholar] [CrossRef] [PubMed]
- Marttin, E.; Verhoef, J.C.; Spies, F.; van der Meulen, J.; Nagelkerke, J.F.; Koerten, H.K.; Merkus, F.W. The effect of methylated β-cyclodextrins on the tight junctions of the rat nasal respiratory epithelium: Electron microscopic and confocal laser scanning microscopic visualization studies. J. Control. Release 1999, 57, 205–213. [Google Scholar] [CrossRef] [PubMed]
- Blair, D.W.; Williams, M.J.; Carr, A.J.; Kilpatrick, S.J. Effect of L-thyroxine on gastric secretion in the pylorus-ligated rat. Gut 1965, 6, 343–348. [Google Scholar] [CrossRef] [PubMed]
- Cameron, G.R.; Oakley, C.L. Ligation of the common bile duct. J. Pathol. Bacteriol. 1932, 35, 769–798. [Google Scholar] [CrossRef]
- Tønsberg, H.; Holm, R.; Mu, H.; Boll, J.B.; Jacobsen, J.; Müllertz, A. Effect of bile on the oral absorption of halofantrine in polyethylene glycol 400 and polysorbate 80 formulations dosed to bile duct cannulated rats. J. Pharm. Pharmacol. 2011, 63, 817–824. [Google Scholar] [CrossRef] [PubMed]
- Jin, L.Z.; Ho, Y.W.; Abdullah, N.; Jalaludin, S. Digestive and bacterial enzyme activities in broilers fed diets supplemented with Lactobacillus cultures. Poult. Sci. 2000, 79, 886–891. [Google Scholar] [CrossRef] [PubMed]
- Chen, J.; Jiang, W.; Cai, J.; Tao, W.; Gao, X.; Jiang, X. Quantification of lipoic acid in plasma by high-performance liquid chromatography-electrospray ionization mass spectrometry. J. Chromatogr. B 2005, 824, 249–257. [Google Scholar] [CrossRef]
© 2015 by the authors; licensee MDPI, Basel, Switzerland. This article is an open access article distributed under the terms and conditions of the Creative Commons Attribution license (http://creativecommons.org/licenses/by/4.0/).
Share and Cite
Uchida, R.; Iwamoto, K.; Nagayama, S.; Miyajima, A.; Okamoto, H.; Ikuta, N.; Fukumi, H.; Terao, K.; Hirota, T. Effect of γ-Cyclodextrin Inclusion Complex on the Absorption of R-α-Lipoic Acid in Rats. Int. J. Mol. Sci. 2015, 16, 10105-10120. https://doi.org/10.3390/ijms160510105
Uchida R, Iwamoto K, Nagayama S, Miyajima A, Okamoto H, Ikuta N, Fukumi H, Terao K, Hirota T. Effect of γ-Cyclodextrin Inclusion Complex on the Absorption of R-α-Lipoic Acid in Rats. International Journal of Molecular Sciences. 2015; 16(5):10105-10120. https://doi.org/10.3390/ijms160510105
Chicago/Turabian StyleUchida, Ryota, Kosuke Iwamoto, Suetada Nagayama, Atsushi Miyajima, Hinako Okamoto, Naoko Ikuta, Hiroshi Fukumi, Keiji Terao, and Takashi Hirota. 2015. "Effect of γ-Cyclodextrin Inclusion Complex on the Absorption of R-α-Lipoic Acid in Rats" International Journal of Molecular Sciences 16, no. 5: 10105-10120. https://doi.org/10.3390/ijms160510105