1. Introduction
User-generated content is rapidly being recognized as a complementary source of data for traditional spatial datasets [
1]. Among other forms of user-generated geographic information, location-based social media provide constant feeds of content-rich data generated by users of different platforms sharing their experiences and observations online. These data have the potential to enrich existing data collection methods for mapping spatio-temporal activity patterns and location-based experiences of people. The potential of geotagged social media for mapping people’s activities and movements has been mainly illustrated in urban environments [
2,
3,
4,
5,
6,
7]. There are also promising results for utilizing spatio-temporal information of social media posts for visitor monitoring in recreational areas [
8,
9,
10,
11,
12,
13]. However, it still needs to be validated whether social media data can be used as a complementary data source for spatial decision making.
Social media, in general, refers to computer-based applications used for networking and sharing digital content. Here, we focus specifically on location-based social media data that contains spatial information (location), temporal information (time), and relevant content (text and photos) generated by users of different social media platforms (e.g., Flickr, Instagram, and Twitter). The data can be often accessed in large quantities through Application Programming Interfaces (APIs) which allow queries and retrievals of publicly shared information from the platforms. Users can link the shared content (a post) to a location by using place names within the text, linking the post to a pre-defined point-of-interest, or by sharing the coordinates of their device. Users often also share the same content via multiple platforms (for example, sharing an Instagram post via Facebook). All sources of social media data are not the same, as platforms differ in purpose, popularity, user profiles, and terms of usage regarding data retrieval and sharing [
14]. Social media presents only a selected representation of reality and in order to use these data properly, it is critical to acknowledge inherent biases in social media data including gender, age, socioeconomic status, and motivations of potential data contributors [
7,
15,
16]. Comparisons with ancillary data sources have been suggested as one way of overcoming some of the limitations of social media data [
17]. For example, census data in urban areas [
5,
7] and visitation rates in recreational areas [
9] provide valuable reference information for geotagged social media posts in different environments.
In contrast to other forms of user-generated geographic information, social media data is often generated for other purposes than specific planning or mapping efforts. Consequently, location-based social media can be categorized as a source of passive and non-authoritative crowdsourced geographic information [
1]. Social media data, among other forms of ‘crowdsensing’, are also recognized as a source of primary sensor data in remote sensing literature [
18,
19]. For example, geolocated twitter data and unsupervised clustering have been used for mapping urban land use patterns [
20]. Georeferenced social media data is often discussed in parallel with different sources of Volunteered Geographic Information (VGI) referring to the role of citizens as sensors [
21,
22]. However, due to the passive role of data contributors, social media data is not purely ‘volunteered’ [
1], and even when shared openly, taking advantage of these data in academic research requires special considerations of ethical use [
23]. On the other hand, data collection from social media is less intrusive compared to active forms of crowdsourcing such as collaborative mapping [
1] or public participatory GIS (PPGIS) campaigns [
24], as people do not need to make an extra effort to participate in the generation of data. Therefore, due to its passive nature, social media data can potentially capture a different view on peoples’ activities and opinions in space and time in comparison to active data collection campaigns.
Establishing an understanding of people’s activities and opinions is needed in the sectors of planning and management, for example, in conservation areas [
14,
25]. Nature-based tourism to protected areas is increasing globally [
26] and plays a crucial role in generating much needed funding to support biodiversity conservation [
27] and promoting environmental awareness [
28]. An important limitation in assessing the potential role of nature-based tourism to support biodiversity conservation is, for many protected areas, the lack of data on visitor counts, as well as the activities and preferences of visitors in order to direct management and marketing efforts [
29,
30,
31]. As in many other fields, there is a growing interest towards using new technology, social media in particular, both as a communication channel and a data source in nature conservation [
32,
33]. Traditionally, information on protected area visitors has been collected using visitor surveys and counting. In countries with the most advanced visitor monitoring systems, such as in Finland, visitor surveys are usually being carried out systematically at a certain time interval. An important limitation is that such surveys are time consuming and expensive to carry out. Therefore, social media could be combined with, or sometimes even replace, traditional surveys in order to bridge some of the information gaps in conservation science and practice [
14]. In the context of nature-based tourism, the spatial and temporal attributes of social media data have been used for the quantification of visitation rates [
8,
9], tourism revenues [
10], landscape values [
11], and travel patterns [
34]. Social media content (text and/or photos) have also been used for mapping cultural ecosystem services [
12] and to assess visitors’ preferences for biodiversity [
35]. Now, there is a need to test to what extent social media content reflects the reported experiences and activities of visitors in different environments and cultural contexts. Specifically, there is need to assess how social media data can be used to infer visitors’ activities in protected areas that have been created for recreational purposes, rather than with biodiversity conservation objectives in mind. Such information is very important to inform protected area management and marketing anywhere in the world, but particularly in areas that lack resources to monitor visitors’ experiences.
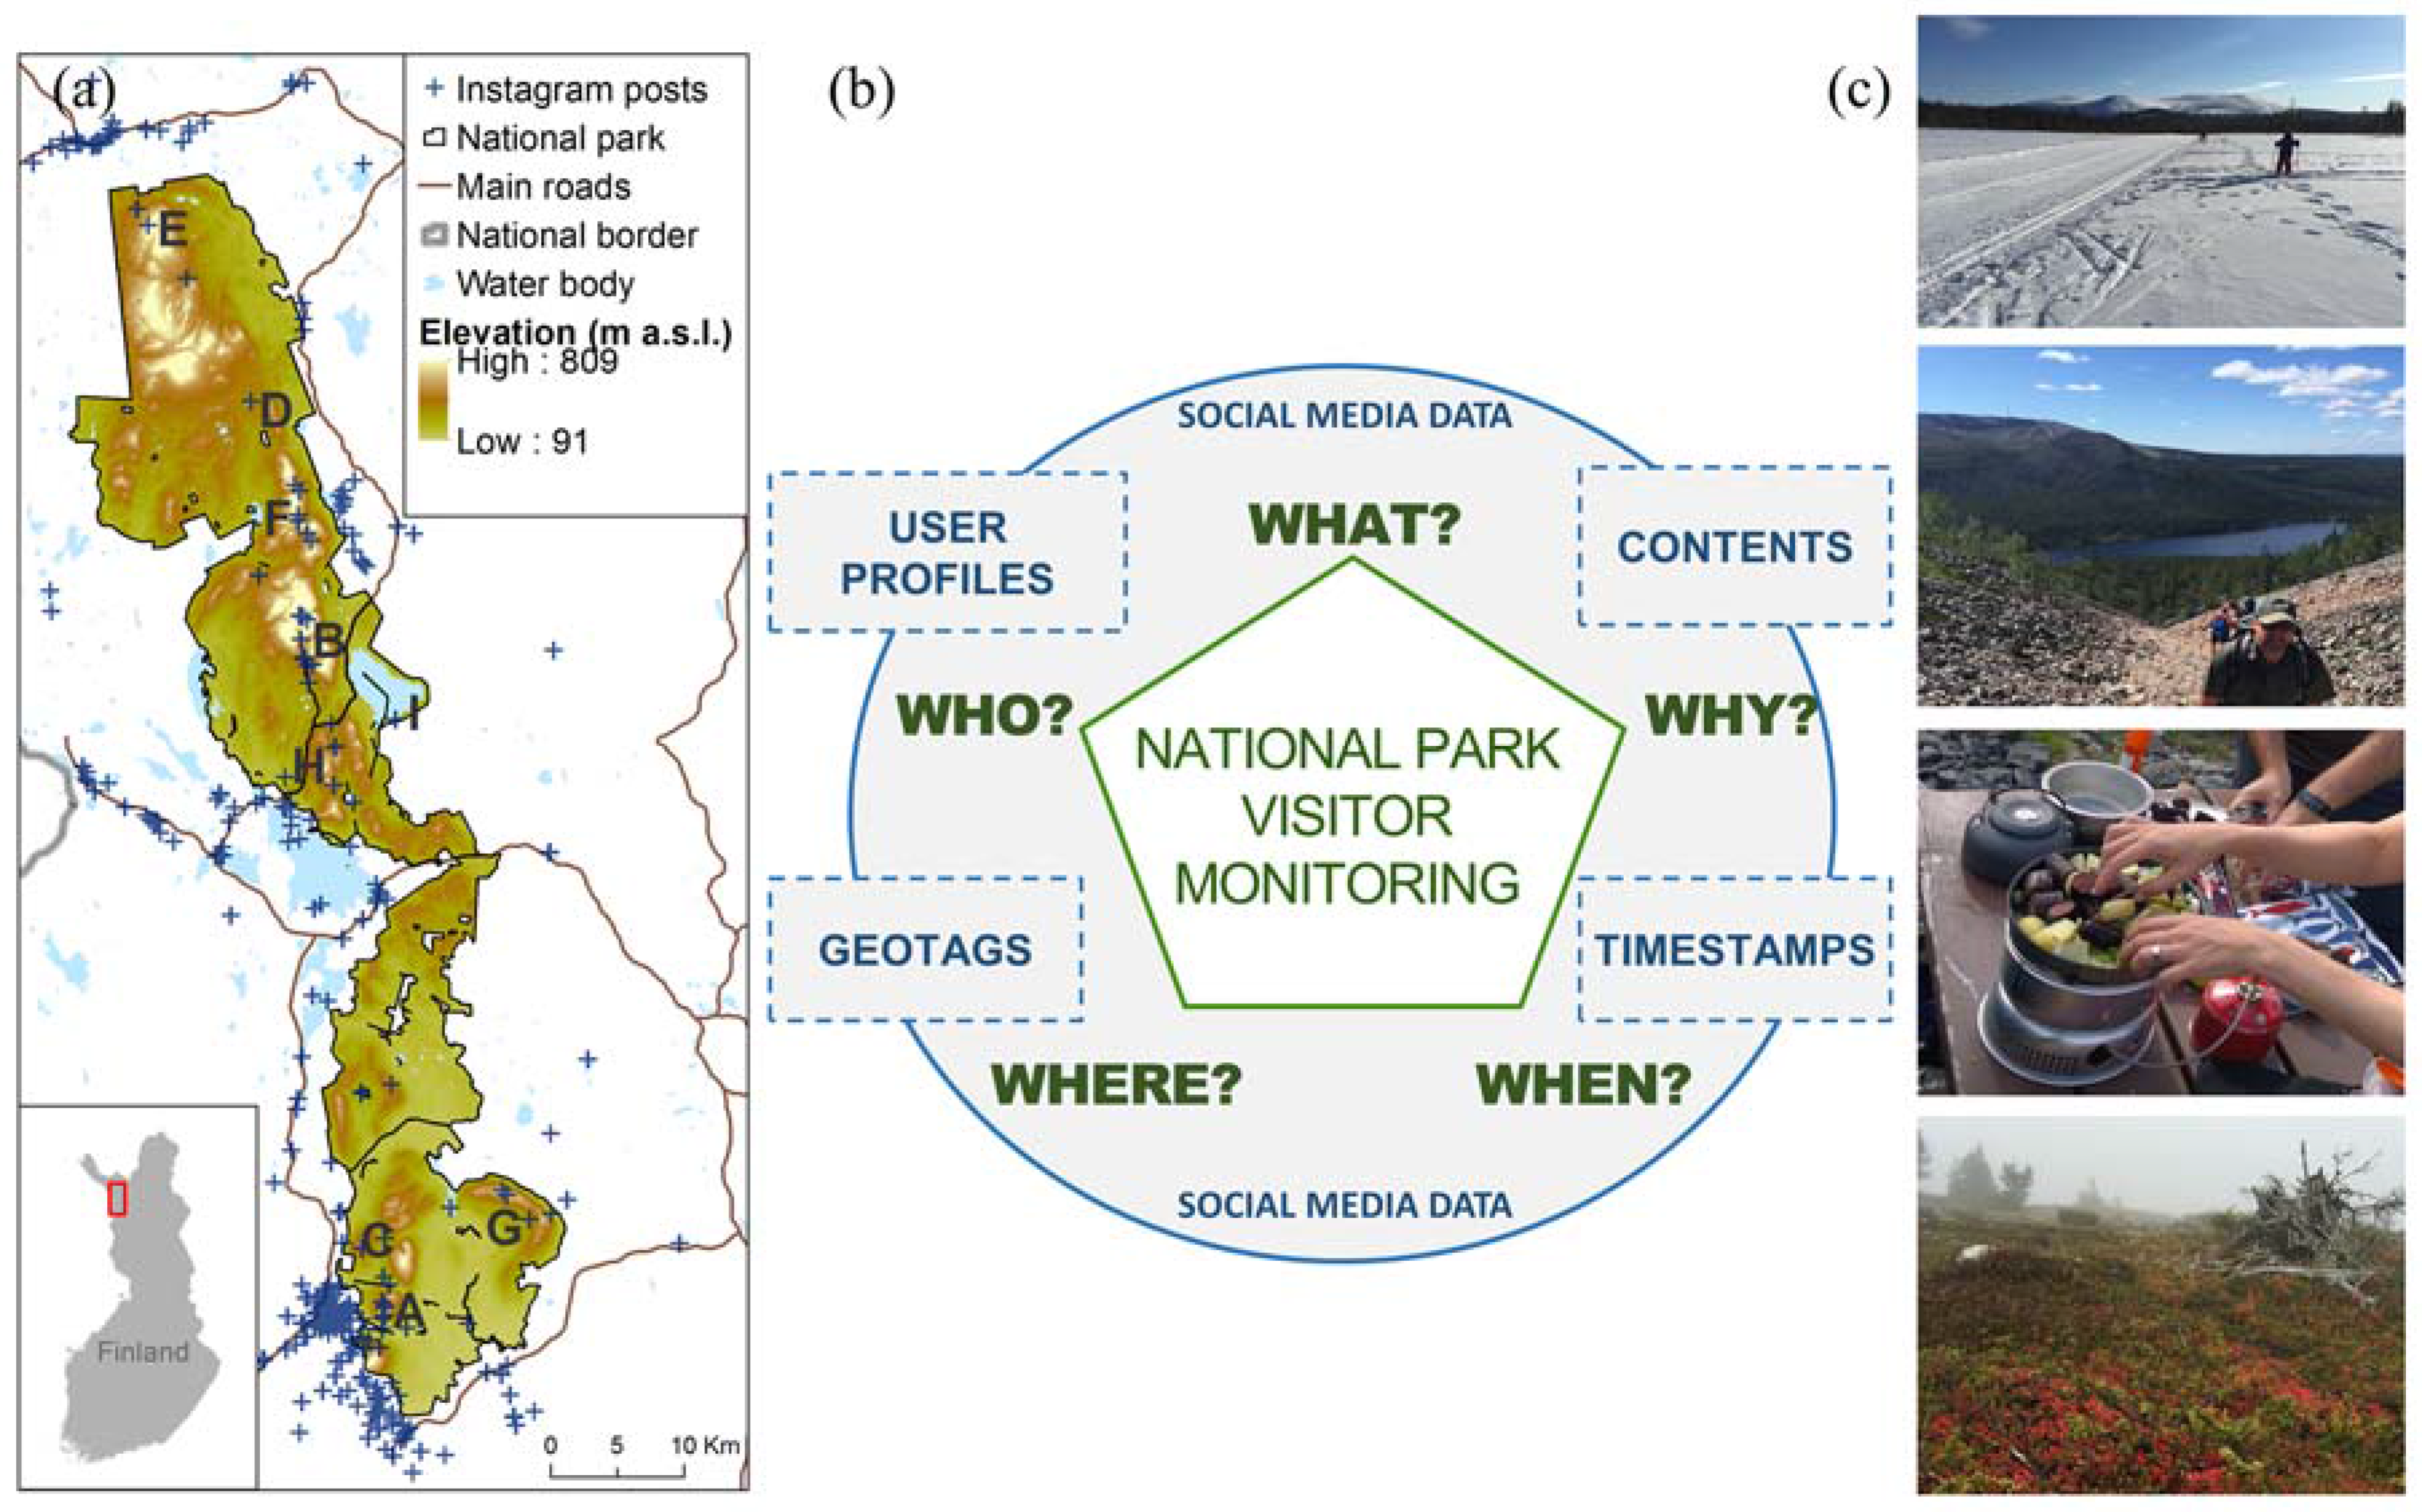
In this paper, we examine the potential of social media data in providing relevant information about visitation to a national park (
Figure 1). As a case study area, we use the most popular national park in Finland, the Pallas-Yllästunturi National Park (hereafter PY). PY provides a suitable test site for social media data, as it has long been studied using standardized visitor surveys of the Finnish national park authority Metsähallitus—Parks & Wildlife Finland. The most recent survey was carried out in the area in 2016 including questions about visitors’ social media usage.
The objective of this study was to see how well social media data content corresponds to results derived from traditional national park visitor surveys. Moreover, we wish to understand what complementary information could be derived from social media data regarding visitation patterns and activities in the park. We apply the framework in
Figure 1 by exploring if and how the following questions could be answered based on the social media data and visitor survey data: (i) where do people go within the park; (ii) what are their activities; (iii) when do people visit the park and are there are temporal patterns in the activities; (iv) who are the visitors; (v) why do people visit the national park; and (vi) what complementary information can social media provide in addition to the results from the traditional survey. To our knowledge, no previous study has compared social media data to extensive visitor survey data from a similar environment.
2. Materials and Methods
2.1. Study Area and Visitor Survey
There are 39 National Parks in Finland managed by Parks & Wildlife Finland, a unit of Metsähallitus, which is a state-owned enterprise that provides services related to Finland’s natural resources (
www.metsa.fi/web/en). PY is the most visited National Park in Finland with 538,853 visitors in 2016 (3% increase from 2015) (
www.metsa.fi/web/en/visitationnumbers). PY covers an area of 1020 km
2 in the Lapland region close to the Swedish border. The highest peak Taivaskero reaches an elevation of 809 m above sea level and the landscape of the park is a unique combination of Lappish mountains (fells) surrounded by a mosaic of natural peat-bogs and forests. Vegetation in the park ranges from tundra in the fells to herb-rich forests in sheltered gullies. The area has a long land use history by the indigenous Sámi people and traditional practices such as reindeer herding still take place in the park. The national park was established in two phases; the northern part has been a national park since 1938 and the southern part, a former nature reserve, has been included since 2005. In the park, there are year-round services for various recreational activities, such as hiking and cross-country skiing (
www.nationalparks.fi/en/pallas-yllastunturinp). Visitor surveys have been conducted in the park since 1998, following the 5-year scheme of Parks & Wildlife Finland. The first two surveys (1998 and 2003) covered only the northern part of the park. After the southern part was added to the national park, the visitor surveys (2010 and 2016) have also been carried out in the entire region.
An on-site visitor survey was conducted in PY during January–October 2016 by Metsähallitus—Parks & Wildlife Finland. The survey form included questions for collecting basic information about the national park visitors—length of stay, activities in the park, visited locations, expenditures, opinions about services, and socio-economic background information including age, gender, and home location [
31] (see
Supplementary Materials, Figure S1).
In addition to the standard survey questions, respondents were asked to fill in a questionnaire about social media usage (
Figure S2). There, respondents were asked whether or not they are a member of any social media platform and if they have shared/intend to share their national park experience in social media. The questionnaire also included more detailed questions about their use of different platforms and motivations for sharing content.
Face-to face interviews were conducted by the park personnel in 23 locations across the park, during 142 days, distributed throughout the popular seasons from winter/spring to autumn. The survey’s sampling effort was spatially balanced across the park according to visitation rates of the park’s different sections, based on information obtained from continuous visitor counting. Forms were also available in selected wilderness huts so that visitors could answer the survey independently. The survey was available both in Finnish and in English and the target group of the survey was all visitors over the age of 15.
We used Pearson’s Chi-square test to compare the likelihood of sharing national park experiences in social media between different types of users. One-way ANOVA was used for testing the statistical difference in age between different social media user groups. Statistical tests were implemented using the R software (Version 3.2.3) [
36].
2.2. Social Media Data Collection
Metadata for geotagged social media posts were collected from the Instagram API (
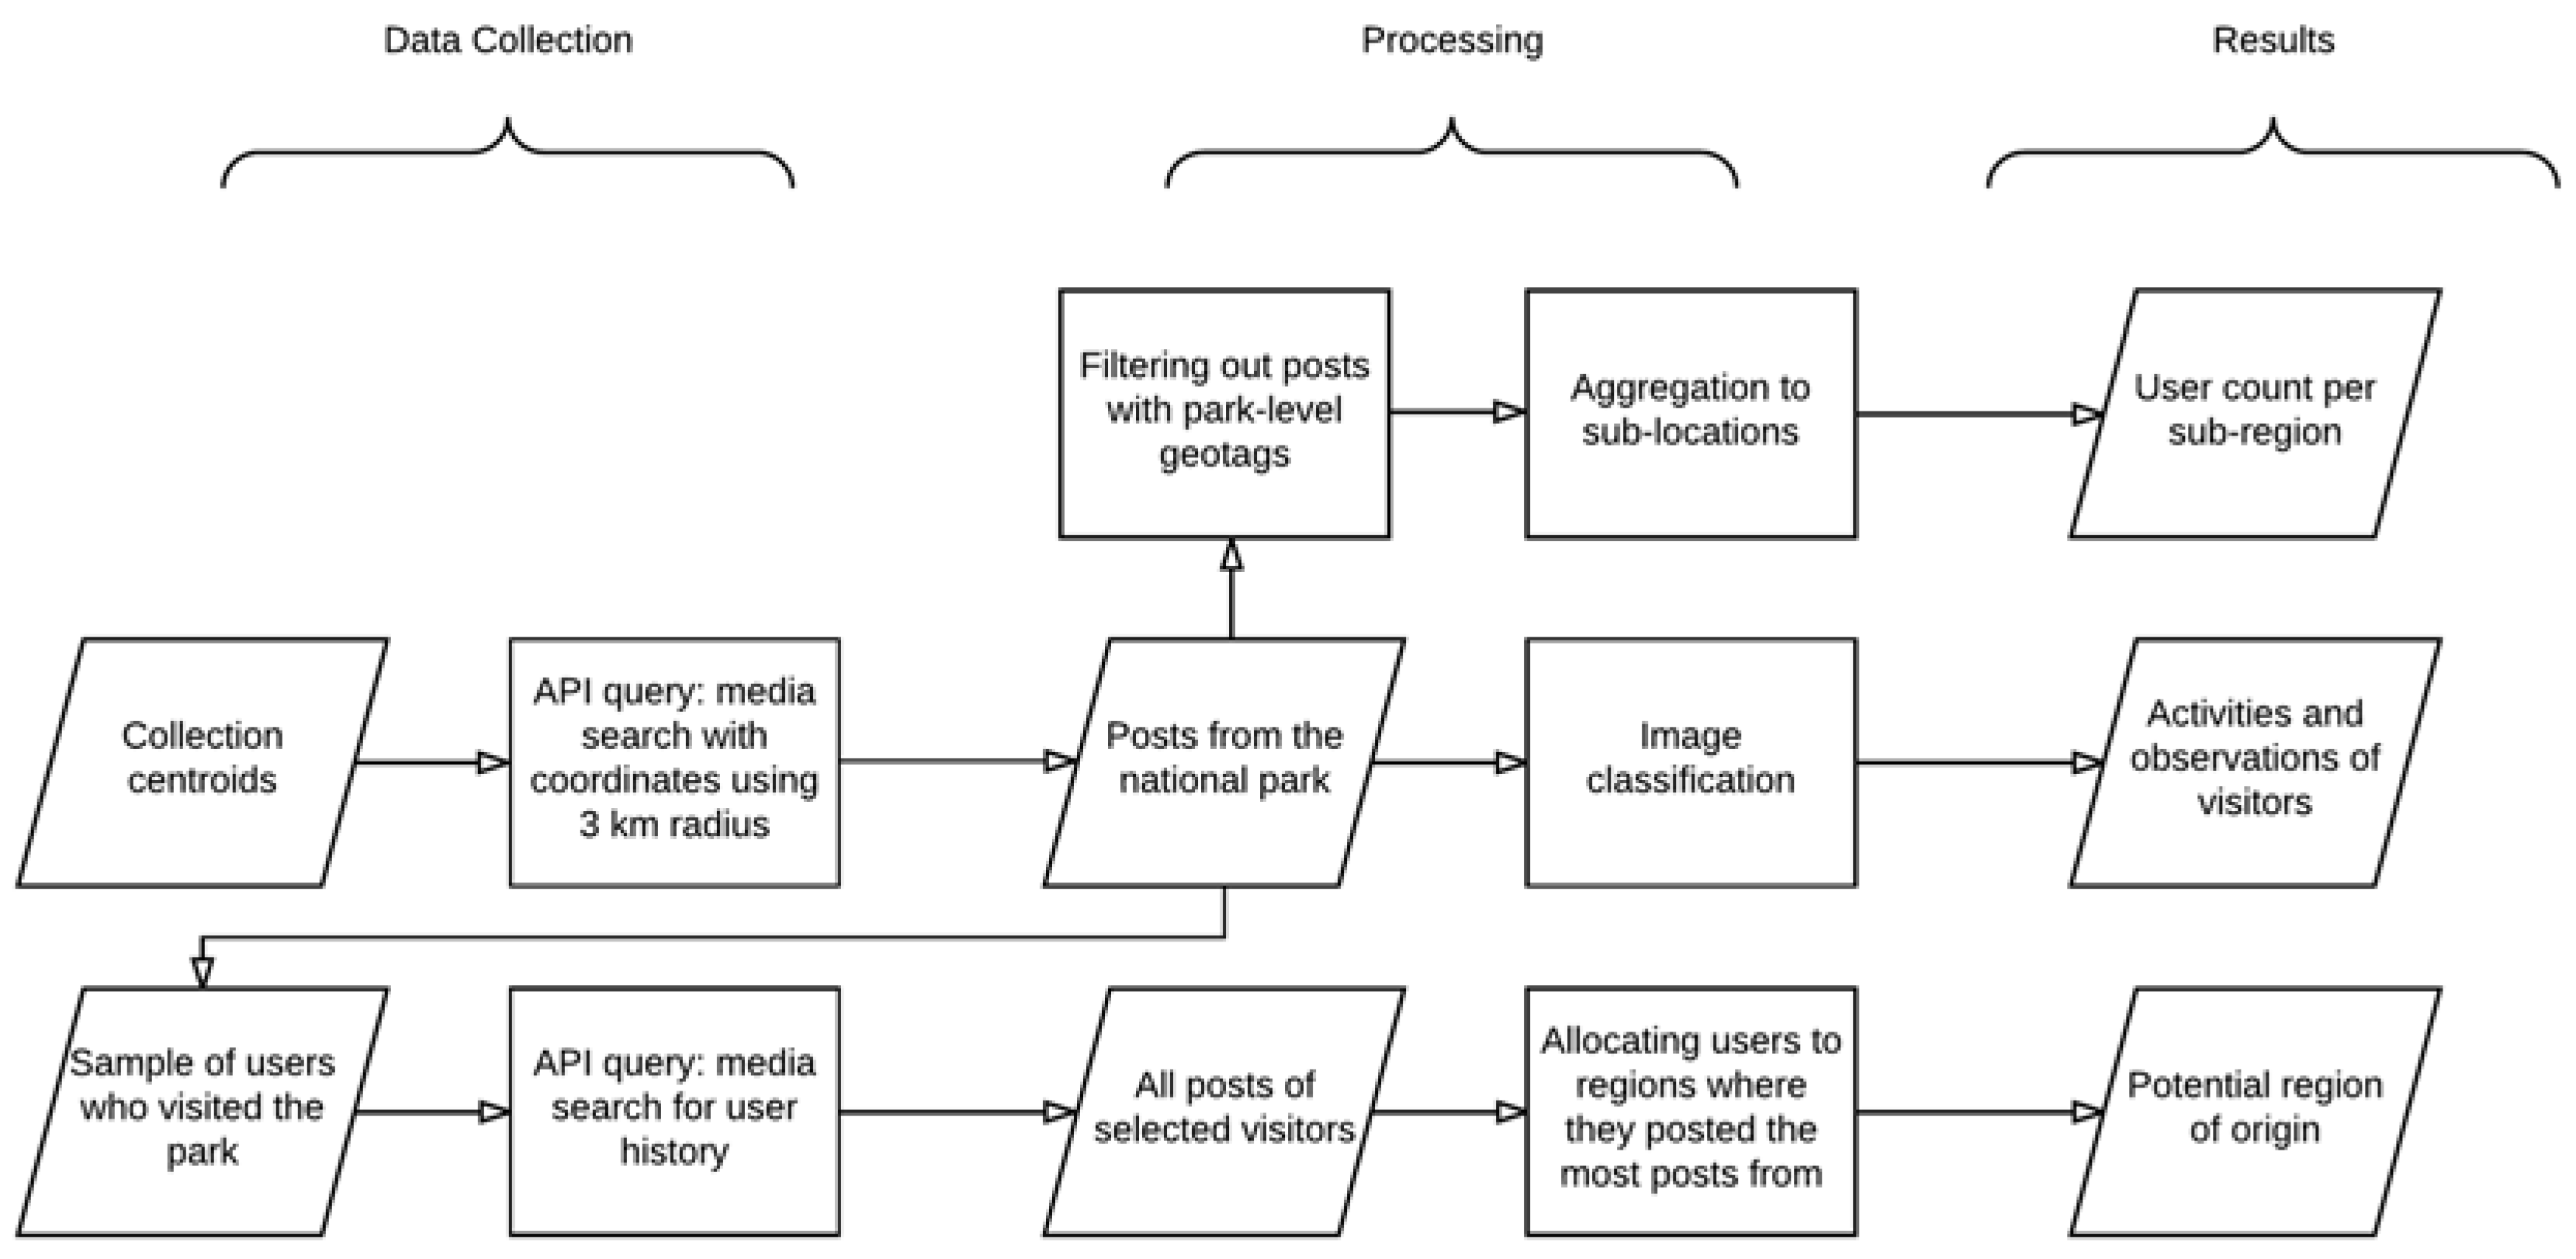
www.instagram.com/developer) using the media search endpoint in spring 2016. Data collection was conducted using a custom-made tool written for the Python programming language. All publicly available posts geotagged within a 10-km buffer zone of the Pallas-Yllästunturi National Park from the period of January 2014–May 2016 were requested from the API using the center points of 2 × 2 km grid cells (collection centroids) as input coordinates in the query. All posts geotagged inside or within 100 m radius from the National Park border were taken into account for within-park analysis and were subject to manual classification. In addition, there were 246 posts geotagged to location ‘Pallas-Yllästunturin kansallispuisto/Pallas-Yllästunturi National Park’ which was attached to coordinates 4 km outside the park borders. These posts were included in park-level statistics, but filtered out when detecting most tagged sub-regions within the park. The main steps of data collection and processing are illustrated in
Figure 2.
The location information of the Instagram posts at the time of data collection was attached to pre-defined points-of-interest. In practice, Instagram-users have chosen a pre-defined location from a list when geotagging their photo and thus, the exact coordinates in the dataset are aggregated to these points-of-interest (not the exact coordinates of the user’s mobile device).
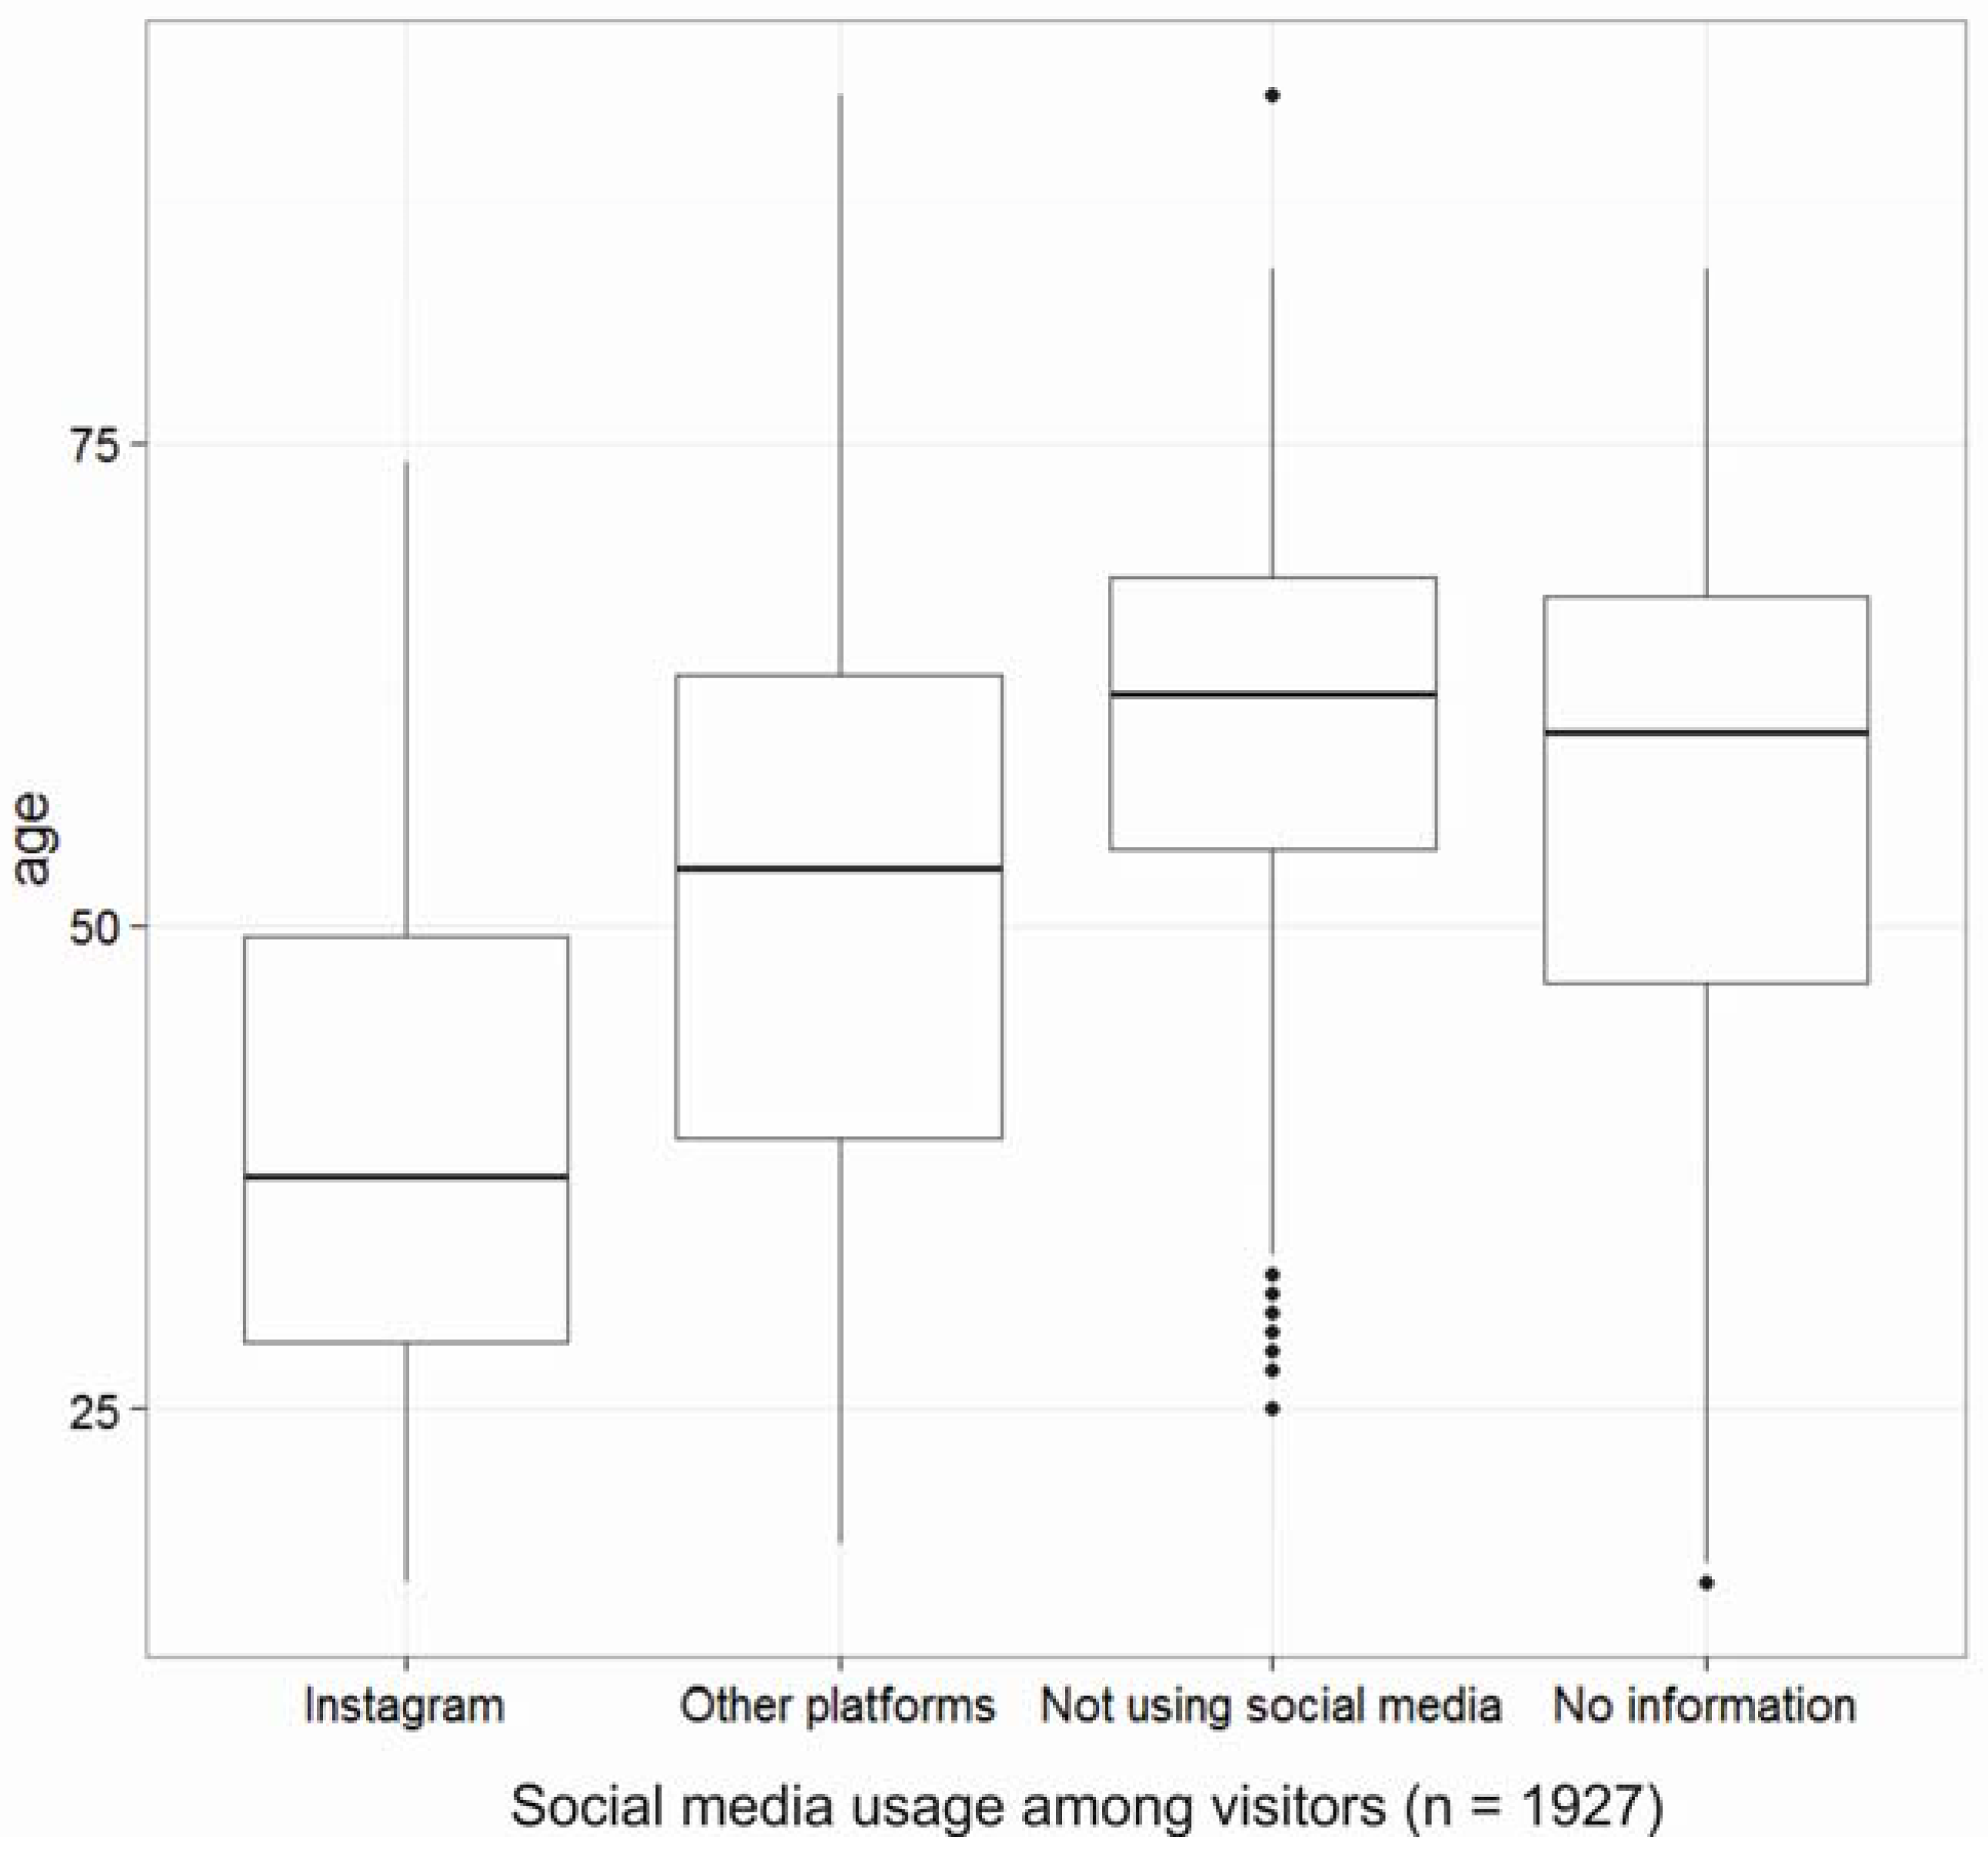
Instagram was chosen as the source of social media data because of its popularity in the study area and data availability at the time of designing the study. However, due to recent changes in the API policy in June 2016, gathering information from openly shared Instagram posts has become more difficult. According to the visitor survey, 85% of Instagram-users had shared/intended to share their national park experiences online, which further supports the use of Instagram as a data source for visitor monitoring. The number of active Instagram users in Finland has been estimated as 740,000 (13% of population) in 2015, with young adults aged 18–34 (36% of estimated users) as the most active ones (napoleoncat.com/blog/en/instagram-user-demographics-in-selected-european-countries).
2.3. Mapping Most Popular Places within the Park from Social Media Data
Geotagged social media data were aggregated to surveyed sub-regions based on their coordinates. Posts that were tagged with location names referring to the park as a whole were filtered out: Inside the park, 310 photos were geotagged to the park-level with geotags such as ‘Pallas-Yllästunturi National Park’ referring to the park as a whole, but these posts were technically positioned in one single coordinate location. After filtering out ambiguous geotags, the social media data was aggregated to the same spatial units as in the survey (question 4 in
Figure S1) and the resulting rankings were compared using the Spearman rank correlation test.
2.4. Activities and Social Media Content Analysis
The content of pictures posted on Instagram was manually classified according to main subject of the picture (see illustration of classification scheme in
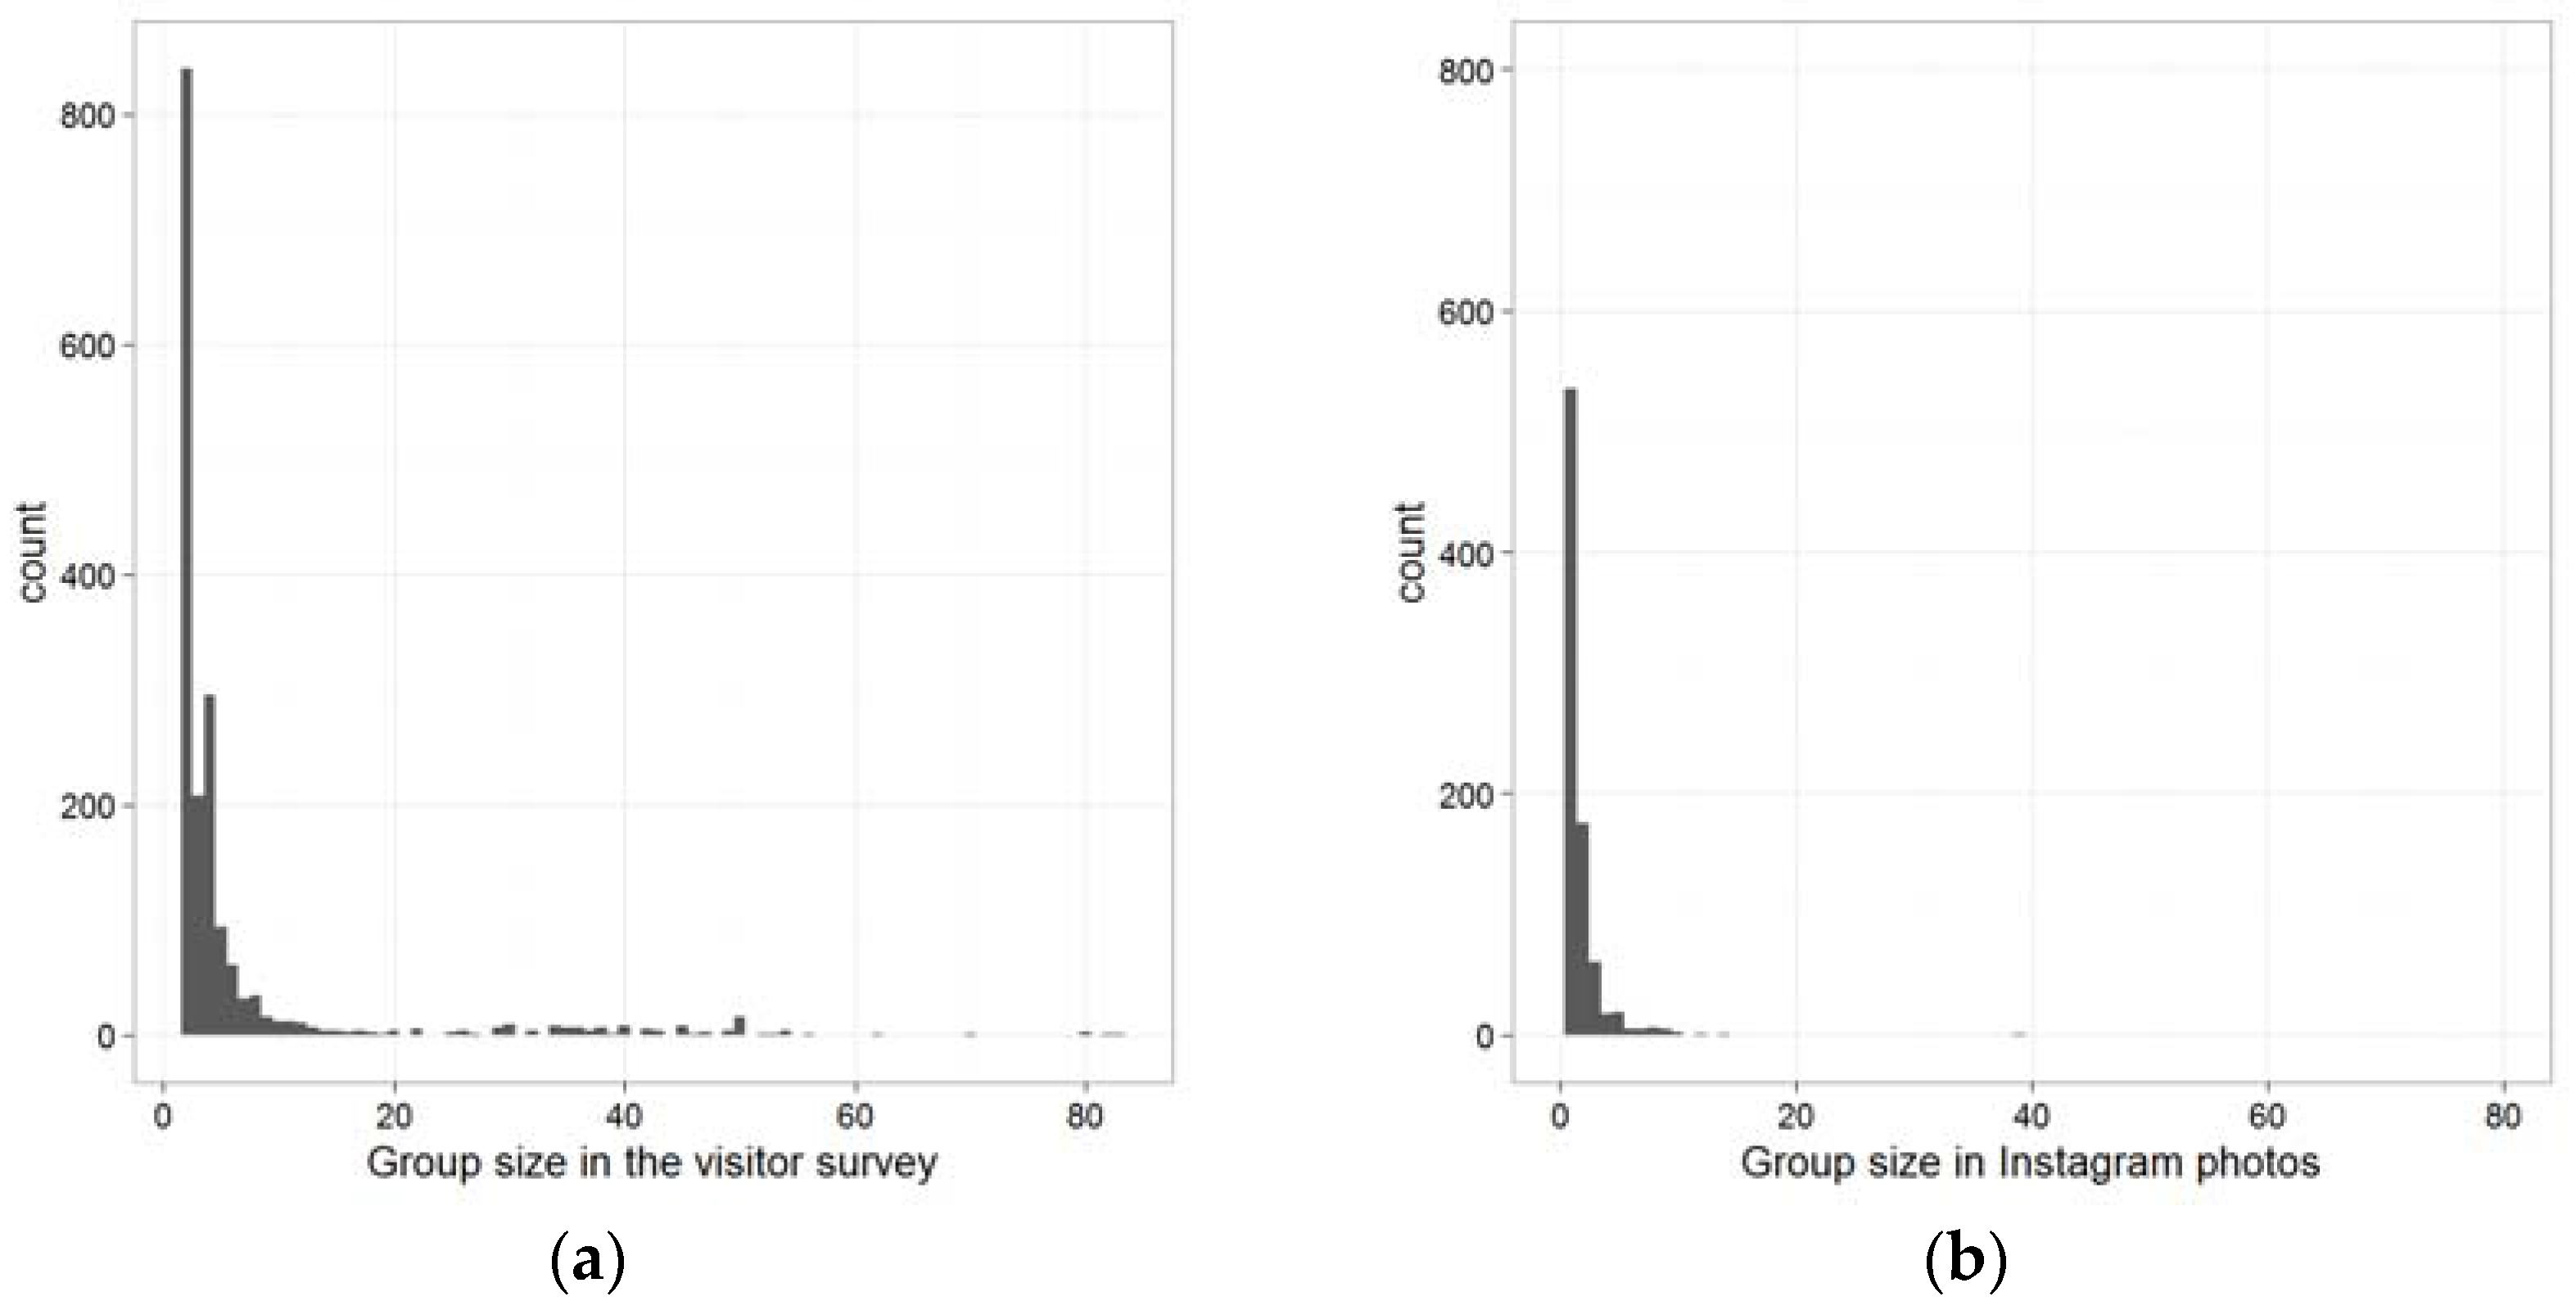
Supplementary Materials, Figure S3). Firstly, we checked if the photo content was relevant for the study area. For example, advertisement and other images clearly not posted by PY visitors were discarded. Secondly, photos were classified according to six main categories defined by the presence or absence of people, activities, landscape, animals, and infrastructure. Thirdly, a more detailed classification was made under each of the main categories. Pictures showing people were further classified according to the number of people present in the photo for detecting the group size. In order to take into account the whole group, the person taking the photo was added to the count of people in the picture if they were not visible in the photo. Photos marked as ‘activities’ included pictures showing either people engaged in an activity, the equipment directly used in such activity (e.g., skis, photo cameras), or the outcome (e.g., berries, ski tracks) of performing it. Pictures showing activities were further classified according to types of activities indicated in the visitor’s survey (question 9a,
Figure S1). This was in order to be able to compare information extracted from social media with results from the survey. Subjective categories included in the visitor survey, such as ‘observing nature’, were excluded from the manual classification of photos. All other activities observed in the pictures but not included in the visitor survey were aggregated as ‘other activities’. These included, for example, reindeer ride, husky ride, sledging, snow scootering, kayaking, kiteboarding, and swimming.
Landscape photos were further classified by indicating the presence or absence of landscape features, such as snow, water, trees, aurora borealis, or other special weather or light conditions. Pictures showing animals were more specifically classified into wild animals and domestic animals. Finally, infrastructure was also further classified according to the type of building (e.g., wilderness huts). It was also noted if the photo was taken indoors.
The classification was performed and double checked for consistency by two people using a form in Microsoft Access 2013. Photo content was accessed online through url-links. Photos which were not publicly available or removed by the user were marked as ‘not available’. The classification was finalized after consultation with members of Parks & Wildlife Finland during a joint workshop in October 2016.
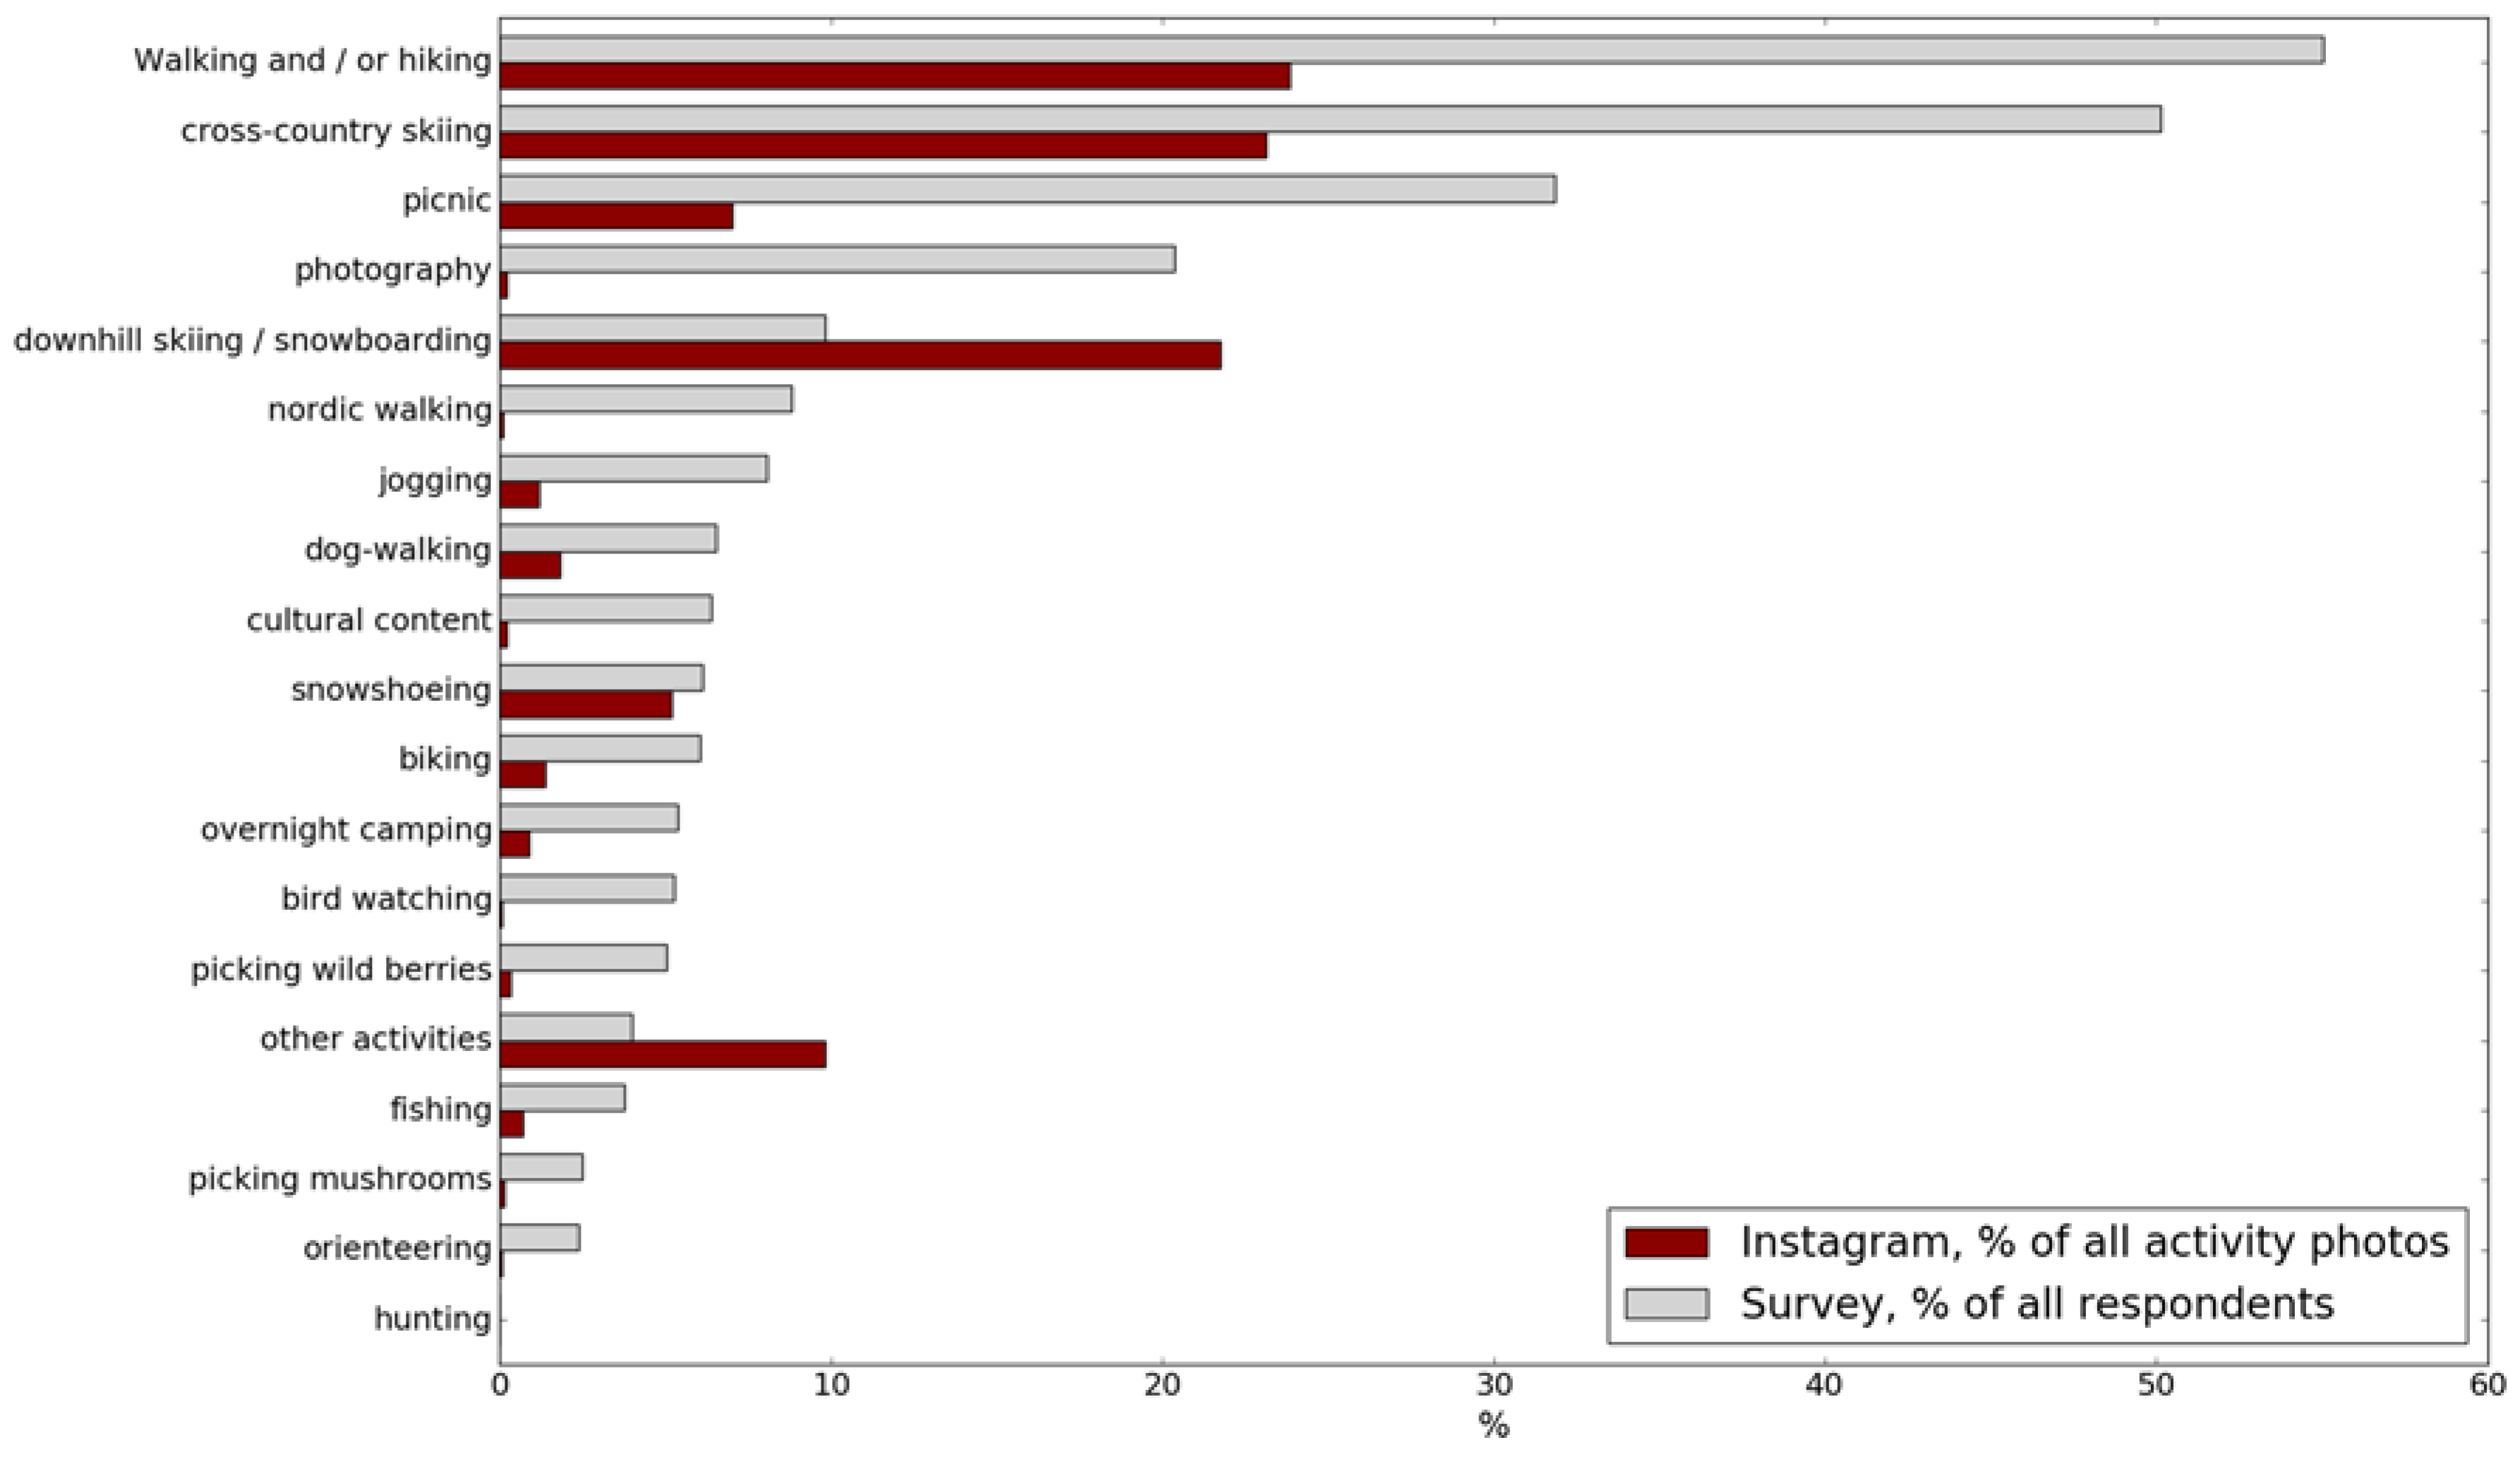
We used a Pearson’s Chi-square test for assessing the likelihood that the frequency distribution of activities detected from social media (observed activities) were consistent with activities reported in the survey (surveyed activities).
2.5. Detecting Home Location from Social Media Data
Potential home location was estimated for a sample of 291 Instagram users who had visited PY National Park by detecting the country or region from which the user had posted the most photos from. For the 291 users, we collected metadata from all publicly posted content (
Figure S4) available from the Instagram API in May 2016. Posts that were geotagged in PY National Park and its surroundings were excluded from the analysis. After excluding posts from the proximity of PY, each user was allocated to the region from which they had posted the most pictures from.
We used a Pearson’s Chi-square test in order to assess the likelihood that the frequency distribution of potential home locations of social media users (observed locations) were consistent with visitors' home locations as obtained by the survey (surveyed locations).
4. Discussion
In this study, we compared social media data and systematically collected visitor survey data from the most popular national park in Finland (Pallas-Yllästunturi National Park). This multifaceted comparison suggested that data derived from social media could be used both as an additional and complementary source of information to traditional survey data. In comparison to snap-shot like surveys, social media can provide a source for continuous monitoring of what is happening in the area. It may reveal changes in trends and bring up emerging activities in the park. Such information is crucial for conservation authorities to inform marketing and management. Our comparison also shows that social media data may be able to provide information that is comparable to that collected by traditional surveys.
Social media data was successfully used to detect the most popular sub-regions in the park. However, in areas with lower number of social media posts the results were not as significant. The number of respondents and social media users in less popular locations was relatively small and might have been affected by the survey locations and coordinate accuracy of the social media data. Visitors might be more prone to tag their photos with park-level references (for example, ‘Pallas-Yllästunturi National Park’) instead of more precise location names within the park in the absence of local knowledge or available pre-defined tags in the social media platform. Other potential reasons for error and bias include poor mobile phone coverage in remote parts of the park (which would influence the amount of social media posts), distance from infrastructure (people might be more prone to post from their accommodation), and activity profile of the sub-region (there were more post in the proximity of ski slopes which are popular destinations among younger age groups).
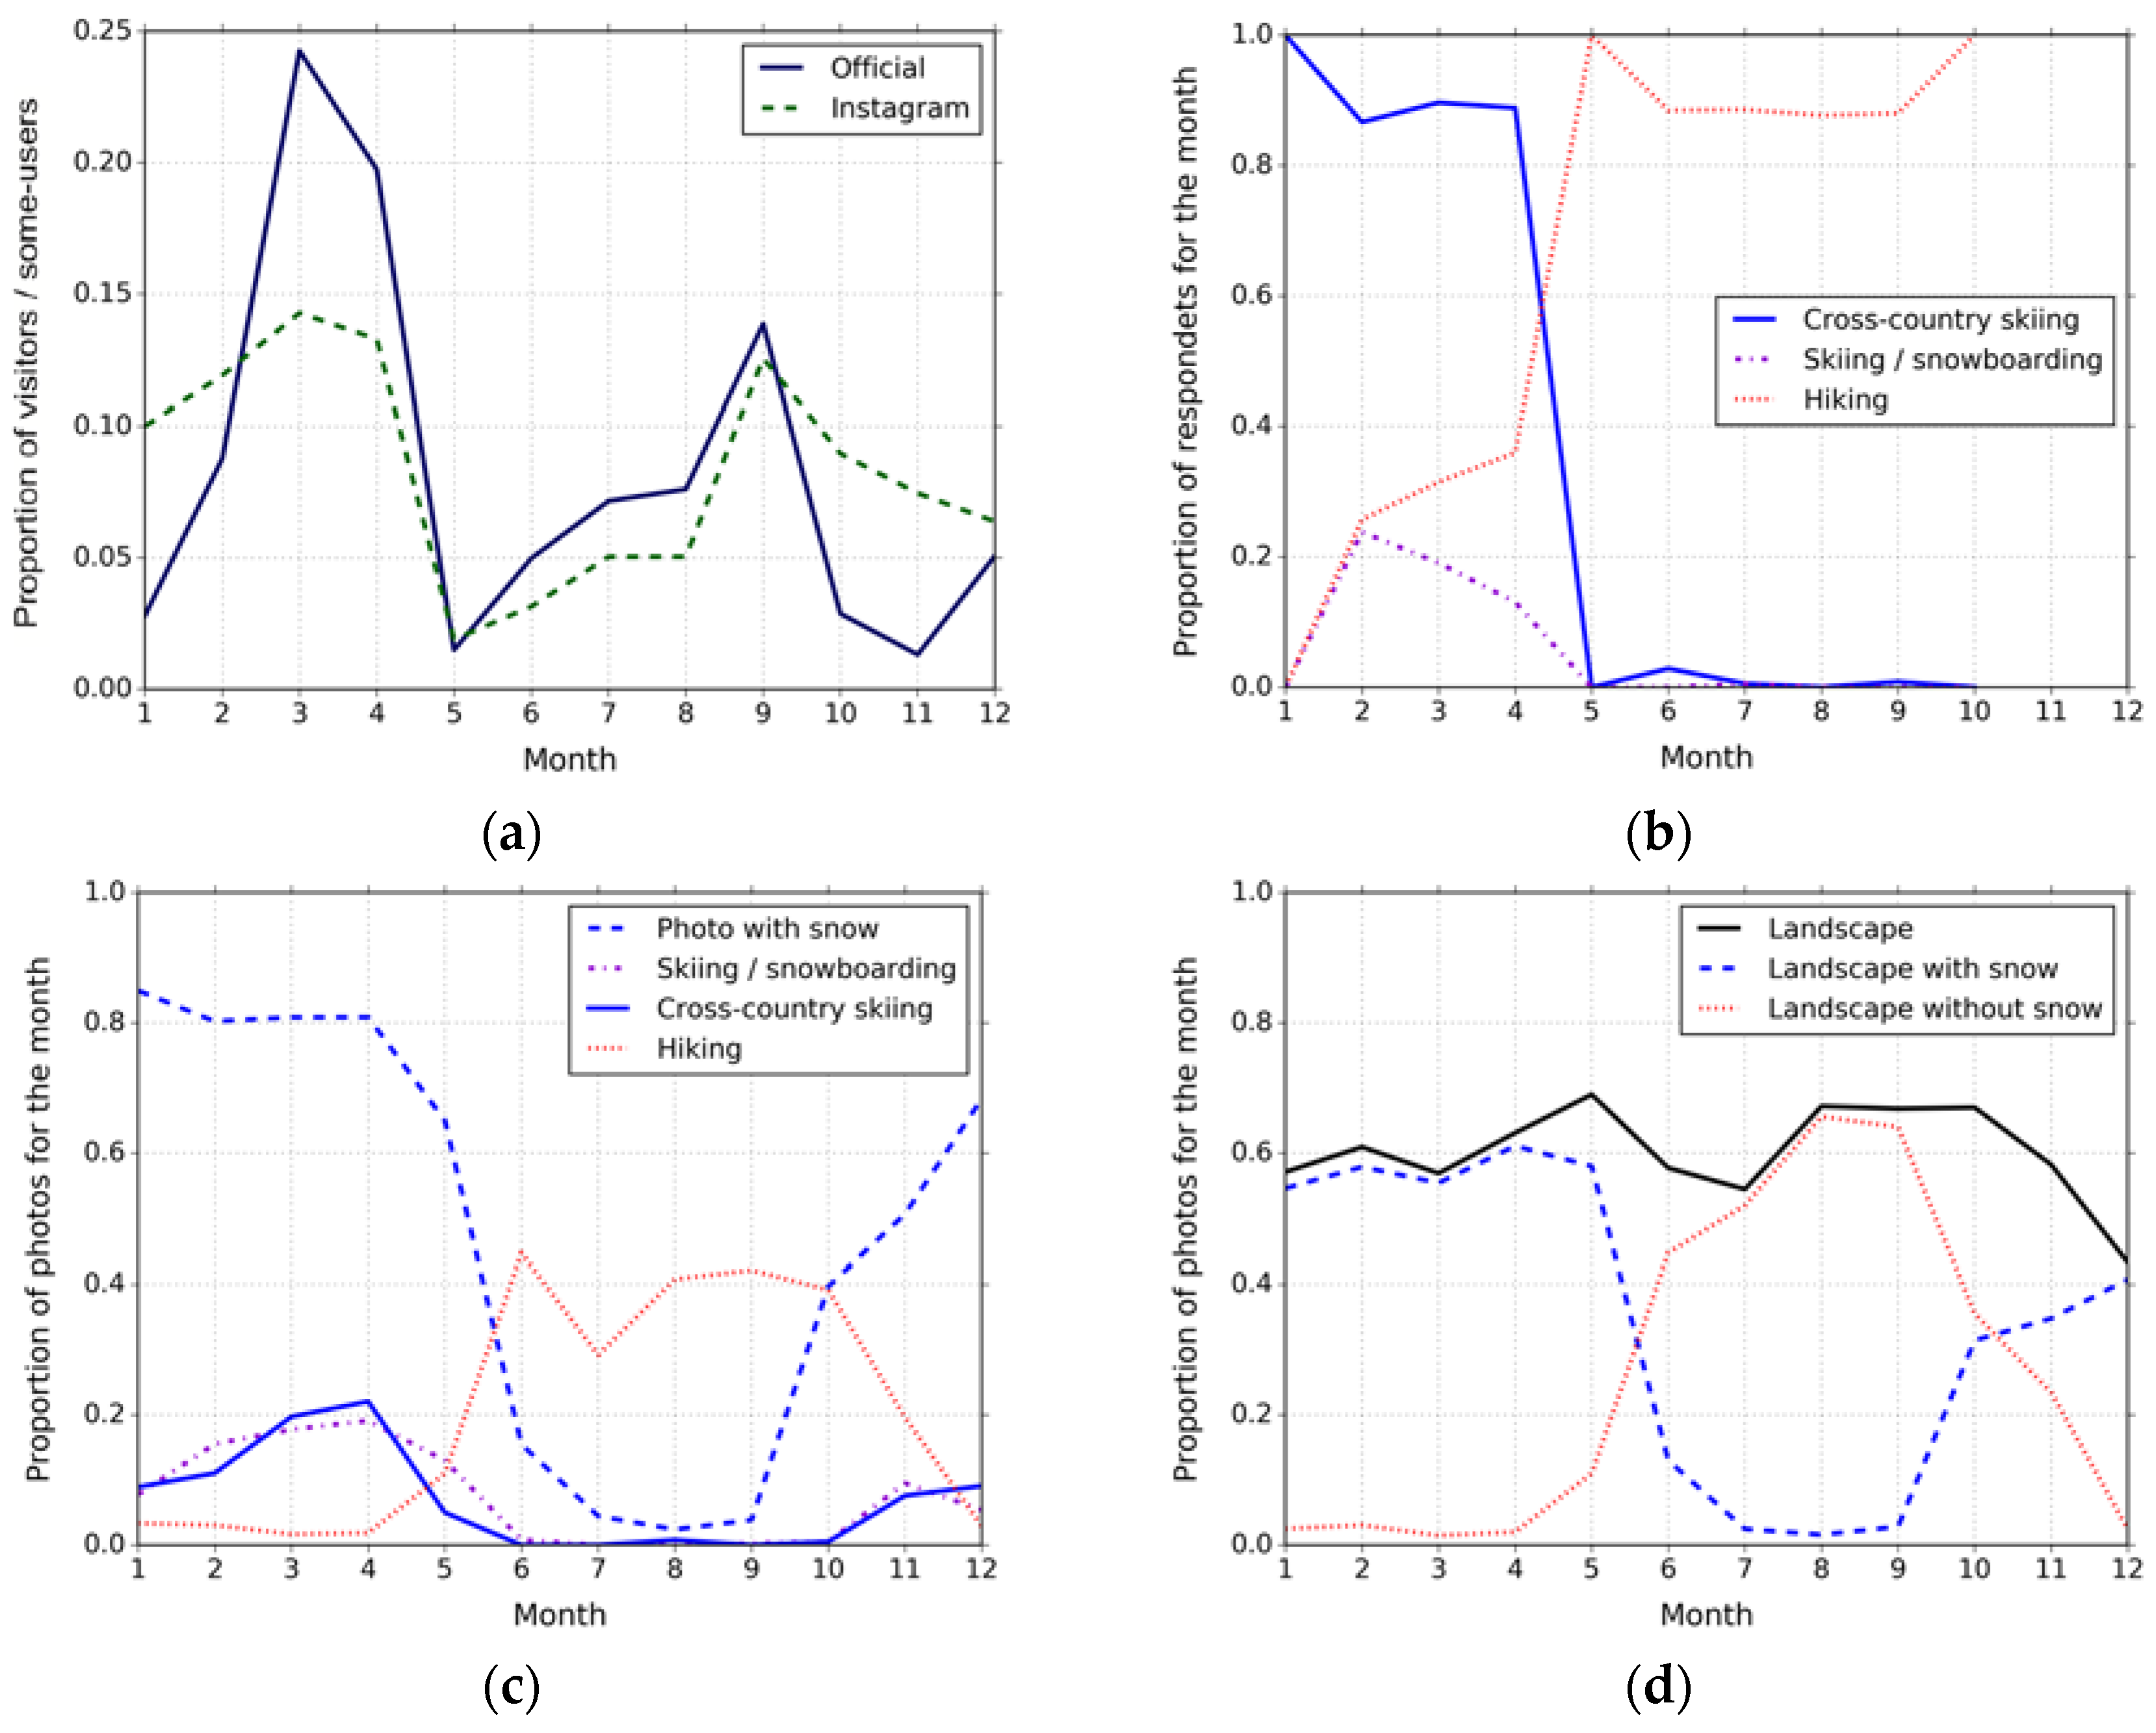
Social media data could be used to detect some of the most popular activities and their temporal patterns, as well as present new and emerging activities. The most popular activities were the same both in the survey results and in social media. However, less popular activities could be captured only by using either the traditional survey (e.g., Nordic walking and birdwatching) or social media data (e.g., kitesurfing and snow scootering). Considering the dominant age group for Instagram posts, social media content could possibly be used to get a broader and more dynamic picture of emerging activities practiced by younger people in different parts of the national park. Also, social media was able to reveal emerging activities (such as winter biking) not taken into account in repeated surveys.
General patterns of visitors’ home locations were also the same both on social media and in the survey results. Most of the visitors were from Finland and Europe. Of course, our approach assumed that users posted more pictures from their home region, which might not be true for users with lower number of posted photos (one might only post a photo from a special trip). However, in the absence of home location information in the user profiles, this method provides an overall picture of the areas in which each user has been most active. Other platforms might have additional profile information available for estimating the ethnicity or home location of users and the use of such information has been demonstrated in studies from urban environments using Twitter [
7].
Understanding the inherent biases in the geographies and user base of data samples from social media have been recognized as key areas of further research in recent literature [
15,
17]. There are several examples of comparisons of Twitter data against official census data in inhabited areas [
5,
7], and similar validation efforts can be made using visitor statistics [
9,
10]. In this paper, we aimed at comparing the spatio-temporal activity patterns presented in social media to surveyed activities in order to make a further validation effort on social media content from our study area. Our results suggest that social media provides comparable information with visitor surveys from areas with adequate amount of data representing the most popular activities. For less popular places and activities, the data sources can be seen as complementary. In PY, despite rigorous sampling efforts across the park, the visitor survey may be somewhat biased towards more elderly visitors. Results from social media are affected by the fact that the sample is self-selected and probably skewed towards younger age groups. As social media data brings in the view of younger visitors and the survey captures more traditional visitors, the two sources of information can actually be considered as complementary to each other.
In conclusion, we believe that social media data can potentially have important implications in informing visitor monitoring and protected area management. As even the best functioning conservation authorities lack both human and financial resources to carry out continuous and repetitive user surveys required to keep protected area management up-to-date, our study highlights that social media data may provide a rapid and cost-efficient alternative to traditional surveys. Continuous monitoring of social media would, for example, allow conservation authorities to better understand spatio-temporal changes in visitor preferences; help assess visitors’ profiles and socio-economic backgrounds; understand visitors’ sentiments via content analysis; and identify emerging activities, which cannot be captured by pre-defined surveys. The potential of social media is even broader for the practical park management (e.g., to map traffic hotspots or littering in the park) and could be actively used as a source of VGI. In practice, the use of social media data would be facilitated by (1) the development of easy to use tools for the purpose; (2) capacity building of park personnel (as accessing and using social media data requires different expertise than those needed to collect and analyze survey data); and (3) increasing the number of posts and users of social media in the parks through, for example, promoting specific hashtags related to place names, activities, or nature sightings. All in all, more research and practical development is needed before social media data can operationally be used in monitoring visitors of recreational areas. Meanwhile, social media data provides an additional dynamic view of the users and use of parks.


 ,
, 


