Article

Geographic Situational Awareness: Mining Tweets for Disaster Preparedness, Emergency Response, Impact, and Recovery

1
Department of Geography, University of Wisconsin-Madison, Madison, WI 53706, USA
2
Department of Landscape Architecture & Urban Planning, Hazard Reduction and Recovery Center, Texas A&M University, College Station, TX 77843, USA
*
Author to whom correspondence should be addressed.
ISPRS Int. J. Geo-Inf. 2015, 4(3), 1549-1568; https://doi.org/10.3390/ijgi4031549
Submission received: 1 April 2015 / Revised: 27 July 2015 / Accepted: 12 August 2015 / Published: 24 August 2015
(This article belongs to the Special Issue Geoinformation for Disaster Risk Management)

Abstract

:
Social media data have emerged as a new source for detecting and monitoring disaster events. A number of recent studies have suggested that social media data streams can be used to mine actionable data for emergency response and relief operation. However, no effort has been made to classify social media data into stages of disaster management (mitigation, preparedness, emergency response, and recovery), which has been used as a common reference for disaster researchers and emergency managers for decades to organize information and streamline priorities and activities during the course of a disaster. This paper makes an initial effort in coding social media messages into different themes within different disaster phases during a time-critical crisis by manually examining more than 10,000 tweets generated during a natural disaster and referencing the findings from the relevant literature and official government procedures involving different disaster stages. Moreover, a classifier based on logistic regression is trained and used for automatically mining and classifying the social media messages into various topic categories during various disaster phases. The classification results are necessary and useful for emergency managers to identify the transition between phases of disaster management, the timing of which is usually unknown and varies across disaster events, so that they can take action quickly and efficiently in the impacted communities. Information generated from the classification can also be used by the social science research communities to study various aspects of preparedness, response, impact and recovery.

1. Introduction

For several decades, disaster researchers and emergency managers have typically relied on a four-phase categorization (mitigation, preparedness, response, and recovery) to understand and manage disasters [1]. The categorization provides a common framework for the researchers to organize, compare, and share research findings. It serves as a time reference for practitioners to predict challenges and damage, prioritize functions, and streamline activities during the course of disaster management [2,3]. Although it has been acknowledged that public source data can help in all phases of disaster management [4], and social media mining for disaster response and coordination has been receiving an increasing level of attention from the research community (e.g., [5,6,7,8,9,10,11,12], no effort has been devoted to identifying and categorizing information from social media into these phases that are typically referenced by both researchers and practitioners.
Using social media data has several advantages over traditional means of data collection to understand multiple phases of disaster management. Previously, methodologies, such as phone calls, direct observations, or personal interviews, were commonly practiced by disaster responders and damage evaluators to gain situational awareness and investigate impacted populations. A typical social survey at the city level demands years of dedicated investment of resources to be successful [9]. Even with the research at rudimentary level, social media data has presented interesting snapshots about human society at a macro scale with agility that could only be dreamed of by traditional surveys [13]. Moreover, the timing of transitions between various disaster phases is usually unknown. The four disaster management phases do not always occur in isolation or in this precise order. Often phases of the cycle overlap and the length of each phase greatly depends on the severity of the disaster [14]. Social media data can provide “real-time” information for the emergency managers to understand the transitions and make effective decisions through multiple phases of disaster management.
The content categories (or topics) defined in previous studies [5,10,11,15] mostly focus on the “actionable data” involved in the disaster response phases, while the useful information that could be posted before and after a disaster event are not discussed and included in their studies. Vieweg [14] defined a complete list of categories for coding social media message including Caution, Advice, Fatality, Injury, Offers of Help, Missing, and General Population Information. Other scholars [10,11] separated the messages into fewer categories depending on the purpose of the study. Imran et al. [10], for instance, extracted tweets during a natural disaster into several categories, such as caution and advice, casualty and damage, donation and offer, and information source. Purohit et al. [11] examined the messages that belong to Request and Offer (of resources or volunteer services) categories. Within those coding schema, the information about when, how, and where to prepare for the disaster, for example, and recovery from the disaster are not fully considered and less recognized.
The goal of this article is to investigate the nature of tweet content generated within the time span of a disaster, and define a list of content categories taking into consideration the information involved in disaster phases including preparedness, emergency response, and recovery. In our work, tweets are separated into 47 themes, which, to our best knowledge, is the most detailed and complete coding schema for categorizing social media into different themes. The coding schema could be potentially useful to extract social media effectively during different disaster stages and gain a better picture of the complex environment in a time of crisis. We also identified keywords and topics for disaster impact, which is often useful for emergency response and recovery. Additionally, a list of keywords associated with messages of each class are manually extracted for each category and presented as the basis for similar research in the future. Those keywords can be used as a reference for other scholars that apply text pattern match method to mine tweets that belong to a specific category. This paper also introduces a framework that can process and mine social media data for disaster analysis of different stages. Using this framework, relevant tweets for each category can be extracted from the raw data.
The following section of this paper is a general review of the research on using social media in a disaster to provide the broader context for our empirical study, followed by the third section describing the methodology for preparing and mining tweets for disaster analysis. Section four demonstrates how to apply the classification results for the disaster analysis. The paper is concluded with a discussion of the issues, challenges and future research directions of using social media data for disaster analysis and study.

2. Related Works

Recently, many studies have applied social media data to understand various aspects of human behavior, the physical environment, and social phenomena. Studies of using social media for disaster related analysis focus on the following areas: (1) situational awareness and social media message coding during a disaster; (2) event detection and sentiment tracking; (3) disaster response and relief coordination; and (4) damage assessment.

2.1. Situational Awareness and Message Coding

According to Viewveg et al. [5], situational awareness (SA) “describes the idealized state of understanding what is happening in an event with many actors and other moving parts, especially with respect to the needs of command and control operations”. More simply, it is knowing what is happening in the affected communities during an event. In our work, we define geographic situational awareness (GSA) as knowing what is happening in space. Users with location services enabled on smart mobile devices can post content (e.g., text messages or photos) with locations, which typically are represented as a pair of coordinates (latitude and longitude). As a result, users can report information about the events (e.g., flooded roads, closure of bridges, shelters, or donation sites) they witnessed and experienced at the locations where these events occurred during a disaster. The locations along with the place names mentioned in the content text are then used to identify the areas of damaged infrastructure, affected people, evacuation zones, and the communities of great needs of resources.
As the messages broadcasted and shared through the social media network are extremely varied, a coding schema is needed to separate the messages into different categories before we can use them to produce a crisis map or extract “actionable data” as information that contributes to situational awareness. During the Typhoon Bopha, volunteers through the PyBossa, a micro-tasking platform, manually annotated the tweets into various themes, such as damaged vehicle, flooding, etc., and a crisis map was then produced to be used by humanitarian organizations [16]. A few attempts [15] have been made to uncover and explain the information Twitter users communicate during mass emergencies. Information about causalities and damage, donation efforts, and alerts are more likely to be used and extracted to improve situational awareness during a time-critical event. As a result, messages are typically categorized into these major categories. Imran et al. [10], for instance, extracted tweets published during a natural disaster into several categories, including caution and advice, casualty and damage, donation and offer, and information source. The content categories (or topics) defined in those studies [5,10,15], are very useful to explore and extract the actionable data involved in the disaster response and recovery phases. However, useful information that could be posted before or after a disaster event may not be revealed by these coding schemes.

2.2. Event Detection and Tracking

The network of social media users is considered a low-cost, effective “geo-sensor” network for contributed information. Twitter, for instance, has more than 190 million registered users, and 55 million tweets are posted per day. As an example, Asiana Flight 214 from Seoul, Korea crashed while landing at San Francisco International Airport on 6 July 2013. News of the crash spread quickly on the Internet through social media. With eyewitnesses sending tweets of their stories, posting images of the plumes of smoke rising above the bay and uploading video of passengers escaping the burning plane to the Internet, the event was quickly acknowledged globally.
As a result of the rapid or even immediate availability of information in social media, the data are widely applied for the detection of significant events. Sakaki et al. [17], for instance, investigated the real-time interaction of events, such as earthquakes and Twitter. Their research produced a probabilistic spatiotemporal model for the target event that can find the center and the trajectory of the event location. Signorini et al. [18] examined the use of tweets to (1) track rapidly-evolving public sentiment with respect to swine flu; and (2) track and measure actual disease activity. This work also showed that Twitter can be used as a measure of public interest or concern about health-related events and that estimates of influenza-like illness derived from Twitter users accurately track reported disease levels. Kent and Capello [19] collected and synthesized user-generated data extracted from multiple social networks during a fire. Regression analysis was used to identify relevant demographic characteristics that reflect the portion of the impacted community that will voluntarily contribute meaningful data about the fire. Using Hurricane Irene as example, Mandel et al. [20] concluded that the number of Twitter messages correlate with the peaks of the event, the level of concern dependent on location and gender, with females being more likely to express concern than males during the crisis.

2.3. Disaster Response and Relief

During a disaster, affected citizens are on the ground before the first responders arrive and become active contributors and distributors of information by providing near real-time situation updates [21]. In fact, it has been widely acknowledged that Humanitarian Aid and Disaster Relief (HADR) responders can gain valuable insights and situational awareness by monitoring social media-based feeds, from which tactical, actionable data can be extracted from the text [15]. As a result, an increasing level of attention has been attracted by mining social media data for disaster response and relief from the research community [6,10,12,21]. Aiming to help HADR responders to track, analyze, and monitor tweets, and to help first responders gain situational awareness immediately after a disaster or crisis, Kumar et al. [6] presented a tool with data analytical and visualization functionalities, such as near real-time trending, data reduction, and historical review. Gao et al. [22] described the advantages and disadvantages of social media applied to disaster relief coordination and discussed the challenges of making such crowdsourcing data a useful tool that can effectively facilitate the relief process in coordination, accuracy, and security.
Recent findings also indicate that actionable data can be extracted from social media to help emergency responders act quickly and efficiently. Ashktorab et al. [12], for example, introduced Tweedr, a Twitter-mining tool that extracts actionable information for disaster relief workers during natural disasters. The Tweedr pipeline consists of three main parts: classification, clustering, and extraction. Purohit et al. [11] presented machine-learning methods to automatically identify and match needs and offers communicated via social media for items and services, such as shelter, money, clothing, etc.

2.4. Damage Assessment

During emergencies in urban areas, it is paramount to assess damage to people, property, and environment in order to coordinate evacuations and relief operations. Remote sensing capable of collecting massive amounts of dynamic and geographically distributed spatiotemporal data daily is often used for disaster assessment. However, despite the quantity of big data available, gaps are often present due to the specific limitations of the instruments or their carrier platforms. Several attempts [23,24,25], therefore, have made to illustrate how volunteered geographical data (VGI) can be used to augment traditional remote sensing data and methods to estimate flood extent and identify affected roads during a flood disaster. In those work, a variety of non-authoritative, multi-sourced data, such as tweets, geolocated photos from Google search engine, traffic data from cameras, OpenStreetMap, videos from Youtube, and news, are collected to assess the damage of transportation infrastructure and to construct an estimate of the advancement and recession of the flood event.
To sum up, the applications of using social media messages for detecting and tracking events, exploring public opinions or sentiments towards to a disaster event, and even extracting actionable information to support disaster response and relief have been intensively investigated and demonstrated. The intent of this paper, however, is to help gain a more thorough situational awareness of a disaster event for HADR responders and to explore the spatiotemporal pattern of people’s behaviors and reactions by coding and separating social media data messages into detailed categories during different disaster phases and map them over space and time. Considering the nature of tweet content generated during the whole time span of a disaster, this paper defines a list of message categories that are involved in each disaster phase. By mapping the geographic locations of tweets of a specific category, we can understand “where” events (e.g., flooded zones) occurred. A framework to separate social media messages into these categories for disaster analysis in different stages is also introduced. Within this framework, relevant tweets for each category can be categorized from the raw data based on the predefined keywords and manually annotated tweets that are used to train and build the classification models.

3. Methodology

3.1. Data

Hurricane Sandy, which struck the Northwestern US on 29 October 2012, is selected as a case study, and downtown New York is chosen as the study area. Since the paper aims to establish geographical situational awareness, only tweets with geo-tags are examined. To retrieve all geo-tagged messages posted on Twitter during 10 October and 27 November 2012, from Gnip (http://gnip.com/), we sent a geographic query with the boundary of the selected study area. A total of 1,763,141 tweets were collected. In addition to the message text content, each tweet includes metadata, such as the timestamp of posting, geo-tag (location), and author profile information, which includes author location, profile description, number of tweets, number of followers and friends, etc.

3.2. Tweet Categories and Keywords during Different Disaster Phases

Emergency management typically consists of four phases: mitigation, preparedness, response, and recovery [1]. However, mitigation is not included in this work because it concerns the long-term measures or activities to prevent future disasters or minimize their effects. Examples include any action that prevents a disaster, reduces the chance of a disaster happening, or reduces the damaging effects of a disaster, e.g., building levies or elevating a building for a potential hurricane. Therefore, this paper focuses on the other three phases. We additionally identified tweets on impact, which is crucial for disaster response. During a disaster, only some of the messages posted by Twitter users contribute to situational awareness. Therefore, we first need to filter out the messages that are irrelevant to the disaster before mining useful information from the massive social media data for disaster analysis. We start by listing all hashtags from the collected data using a program we developed using Java, which can automatically extract the hashtags of the tweets and count the word frequency of each hashtag. Top hashtags related to Hurricane Sandy are then selected and provided as follows:
beprep, blackoutnyc, breakingstorm, franken-storm, frankenstorm, frankenstormsupplies, hurricane, hurricaneny, hurricanenyc, hurricaneprep, hurricanepreparation, hurricanerelief, hurricanes, hurricanesandy, hurricanesandyaftermath, hurricanesandyproblems, hurricanesandysuppprt, newyorkhurricane, newyorksandy, njpower, nychurricane, nycsandy, nycsandyneeds, nycstorm, nyhurricane, nysandy, nystorm, sandy, sandyaftermath, sandyaid, sandycommute, sandyhelp, sandyhuracan, sandyinny, sandyisknockingatmydoor, sandylove, sandyny, sandynyc, sandyprep, sandypreparation, sandyproblems, sandyrecovery, sandyregistry, sandyrelief, sandyshurricane, sandysucks, sandyvolunteer, storm, stormprep, storms, superstorm, superstorms
We then filter out messages that are not relevant to the disaster by using those hashtags. If a tweet does not contain any predefined hashtag keyword in either the messages or hashtags, it will be excluded in the following analysis. Since the keyword lists include some common keywords relevant to hurricanes, such as “sandy”, “hurricane”, “storm”, and “superstorm”, and these keywords are used to match the tweet text messages in addition to the hashtags, the filter can keep most of tweets mentioning Hurricane Sandy for our further study. After performing this filter, 38,224 tweets are included for the next step analysis.
Once we obtain the relevant tweets, we need to determine and separate the messages into different categories within each disaster phase. Users are expected to send different categories of message in different disaster phases. For instance, people would post messages about how to prepare for the coming storm during the preparedness phase. In order to determine the categories of messages for different disaster phases, we use a bottom-up approach to develop the coding scheme. An empty coding scheme is created first. We then sample 2000 relevant messages, manually examine the characteristics of each message and let the scheme grow from the data set. Additionally, while developing our coding schema, we also reference disaster management related literature [5,10,14] and official government procedures for different disaster stages [2,3]. In order to capture all different categories as much as possible, we repeat the process of tweet sampling and examination for two more times until no new category can be discovered from the sampling datasets. Therefore, more than 6000 tweets are manually examined during this process to develop the coding schema. Additionally, we continue to tune the schema during the annotation process, which more than 10,000 tweets are checked.
Finally, 47 message categories are created, and 8, 6, 20, and 13 sub-categories are defined for Preparedness, Response, Impact and Recovery four major categories respectively (Table 1). The Appendix 1 includes the message examples for each sub-category. Using hashtags can help filter out most of irrelevant data. However, there are still many tweets include the predefined hashtags and keywords in the text but do not contribute to situational awareness. Therefore, “other” category is defined to describe such type of messages. By examining the text, words, and sentence pattern used in each message, we also manually extract keywords that could be associated with different categories (Table 1). Such keywords could serve as a good reference for other scholars if they want to use text pattern match based methods to extract the tweets associated with a specific category.
Table 1. Tweet classes and keywords during different disaster phase.
PhaseCategoryKeywordsReport Information about
Preparednesspreparebeprep, gear up, get ready, hurricaneprep, hurricanepreparation, in ready for, prep for, preparation, prepare, prepared, preparedness, preparing, prepping, readiness, ready for, sandyprep, sandypreparation, stormpreppreparation, getting ready, etc., without mentioning specific actions(such as heading to a store)
plansemergency planemergency plans
shelter in placesnuggled up safely inside, stay home, stay inside, stay safe, staysafestaying home and keeping safe
stock upchecklist, fill up tub, frankenstorm supplies, go to PLACE, groceries, grocery shopping, head to PLACE, hurricane necessities, hurricane shop, hurricane supplies, kits, pick up PLACE, prep kit, sandy essentials, sandy necessities, sandy provisions, sandy supplies, sandybags, shopping, stock, stocked, stocking, storm necessities, storm supplies, survival kit, tool kit, trip to PLACEactions in stocking up goods, food, tools, etc., in a store
prepare for outagecandle, candles, charge power, flashlight, flashlights, generator, generators, in case of power outagecharging electrical products (e.g., phones and notebooks), or purchasing generators, candles, flashlights, etc., in case of power outage
evacuationevacuate, evacuated, evacuating, evacuation, evacuee, head away from, leave home, leaving city, police ask leave, seeking refuge, sleep outside, stay with friendsleaving the home or city, seeking refuge, sleeping outside, or staying with friends or involving police asking citizens to evacuate the potential flooding zone.
tipfrankenstorm tip, hurricane tips, storm tipadvice for behavior during the disaster
event trackingcrisis response map, following news, Google’s map of resources and information, hurricane sandy live air travel updates, map, service alert, track, tracking, watch nbc, weather channelmonitoring and tracking the status of the disaster event by watching the news from TV or other sources
Responseorganizationemergency medical services, ems, federal emergency management agency, fema, nypd, oem, office of emergency management, official new york city police department, red cross, red-cross, redcross, salvation armydisaster response and recovery organizations, such as Red Cross, EMS, FEMA, OEM, NYPD, Salvation Army, etc.
housinghotel, housing, shelterstaying in a hotel or shelter
foodfeed victims, food trucks, free lunch, free meals, get meals, refugee meal, sandyrelief mealgetting free meals, or seeing a FEMA food truck
utilities.poweremergency power, emergency generatoremergency power or emergency generators
rescueambulance, emergency response, escape, escaped, escaping, first aid, rescue, rescued, rescuingrescues of disaster victims
Impactbusinessboard up BUSINESS, BUSINESS closedclosing stores, parks, businesses, office, malls, or restaurants or the delay or cancellation of planned events or schedules, etc.
casualtydead, death, death toll, drowned, killdisaster-caused deaths
workdays off, days off work, don’t go to office, don’t go to work, laid off, lost job, no workclosed offices, losing jobs, or time off work
communicationcable went out, cell service out, COMMUNICATION down, COMMUNICATION withdraw, internet failure, internet not working, internet out, no COMMUNICATION, there goes the COMMUNICATIONthe failure of or disaster impact on internet, cable, and wifi
utilities.heatingno ac, no heat, no heaterproblems with heating
utilities.gasgas long line, no gas, wait for gasgas shortages
utilities.waterno water, wait water return, water shortage, without waterwater problems
utilities.powerblack out, blackout, blackoutnyc, con ed, con edison, coned, dark, darker, downed electrical wires, POWER down, POWER not expected, POWER off, POWER out, POWER outage, goodbye POWER, knock out POWER, lose POWER, losing POWER, lost POWER, njpower, no POWER, noPOWER, off the grid, powerless, shut off POWER, taken POWER, transformer exploding, transformer explosion, w/o POWER, wait POWER return, without POWER, without powpower outages
damagecatastrophe, collapse, damage, damaged, damaging, debris, destroy, destroyed, destruct, destructed, destructing, destruction, destroying, devastate, devastation, rip off, ruin, ruined, ruining, wreck, wreckinginfrastructure damage caused by the disaster
floodflood, flooded, flooding, spill over, surge overflow, under water, underwater, wash away, washing away, water over the roof, water overflow, water rushing, drownflooding
general impactaffect, affected, airport with no planes, blocked, blocking, cancel, cancelled, cancelling, cancels, close, closed, closes, closing, closure, commutingproblems, delay, delayed, delaying, delays, falling, falls, fell, flipped over, homeless, hurricanesandyproblems, impact, mess up, messy, no commuter vechicle, sandycommute, sandyproblems, short of, shortage, shut down, strand people, subway lines down, tear apart, things flying, torn apart, traffic, what sandy did in harlemthings or people affected by the disaster
schoolclose school, days off school, don’t go to school, no school, no schools, no skool, not waking up for school, school closedschool closures
aftermathafter hurricanesandy, after sandy, aftermath, hurricanesandyaftermath, post sandy, post-hurricane, post-sandy, sandyaftermath,messes after the disaster; typically a photo is attached with the message to show the mess
treedowned tree, fallen branches, fallen stick, fallen tree, fallensoldier, tree came down, car crusher, tree down, tree downed, tree fall, tree fallen apart, tree fell, tree got knocked down, tree meet, tree meet car, tree ripped down, uprooted treetree damage
transportation in generalTransportation, MTAcommuting problems or damage to transportation systems and infrastructure
transportation.traffictraffic, jam, congestiontraffic status
transportation.subwayTRANSIT closed, TRANSIT delayed, TRANSIT shut downthe impact on or damage to the subway system or delay, congestion, or cancellation of subway services
transportation.busbus line, megabus, strand peoplethe impact on or damage to the bus system or delay, congestion or cancellation of bus services
transportation.ferryferry suspendthe delay, congestion, or shutdown of ferry services
transportation.roadROAD closethe closure of a road, street, bridge, or tunnel.
transportation.airportairport, airplane, flight, JFK, John F. Kennedy International Airport, LGA, LaGuardia Airport, EWR, Newark International Airportthe impact, damage, or shutdown of airports, or delays and cancellations of flights
Recoverybusinessback BUSINESS, open BUSINESS, reopen BUSINESSthe reopening or return to normal of stores, parks, businesses, offices, malls, restaurants, etc.
cleanupClean up, cleanup, demolite, demolition, removal, remove, tree cutting, tree trimmingremoving debris caused by the disaster
workback office, back work, go to work, head officegetting back to office or work
schoolopen school, back school, reopen school, school reopenreturn to or reopen of school
housingback home, be back, head homereturn back to home after being evacuated
communicationCOMMUNICATION back, COMMUNICATION return, have steady cell servicereturn of internet and cable services
utilities.heatingheat or heater back, heat or heather returnreturn of heating services
utilities.gashave gas, on long linesreturn of gas availability
utilities.waterwater back, water returnreturn of water
utilities.powerPOWER up, POWER back, POWER returnreturn of electricity
restorerestock, restoration, restore, restored, restoringrestoration of goods and services
fund raising/donationaid, auction benefit sandy, donate, donation, fund raising, fundraiser, funds, grant, nycsandyneeds, programs, sandyaid, sandylove, sandyregistry, drop offdonation of money or goods or fund raising activities
repairrenovate, renovating, renovation, repair, repaired, repairingthe repair of infrastructure that was damaged during the disaster
rebuildbuild back, building back, built back, rebuild, rebuilding, rebuilt, reconstructrebuilding infrastructure or neighborhoods and communities that were destroyed by the disaster
recoverback after sandy, back after storm, bounce back, bounced back, first time since sandy, first time since storm, recover, recovering, recovery, sandyrecovery, store shelves fullthe recovery of life and the city after the disaster
humanityhelp, help and serve, help neighbor, help out, help victims, help with, offer goods, sandyhelp, sandyvolunteer, teaforhumanity, volunteer, volunteering,relief actions and efforts around the disaster
reliefhurricanerelief, relief, sandyreliefoffering or asking for help and volunteers
transportation in generalTransportation reopen/open, MTA reopen/openthe restoration of transportation services
transportation.trafficno traffic, no jam, no congestionrecovery of traffic
transportation.subwayTRANSIT reopen/openrestoration of subway systems
transportation.busbus line reopen/open, megabus reopen/openrestoration and availability of the bus system
transportation.ferryferry reopen/openreopen and availability of the ferry services
transportation.roadROAD reopen/openreopen of closed roads, streets, bridges and tunnels
transportation.airportairport, JFK, John F. Kennedy International Airport, LGA, LaGuardia Airport, EWR, or Newark International Airport open/reopenreopen of airports or the restoration of normal flights
stockpost-sandy stock upstocking up on supplies after sandy
OthersothersN/A
Note: PLACE could be grocery, grocery store, market, shop, store, supermarket, and specific store and retail brands, such as costco, home depot, target, trader joe, wal-mart, walmart, whole foods, etc.; POWER represents either power or electricity; COMMUNICATION means internet, phone, cable, TV, wifi, wi-fi and network; ROAD could be road, roadway, street, bridge, drive, and avenue; TRANSIT could be metro, subway, sub, trains, train, and transit; BUSINESS could be restaurant, business, store, starbucks, coffeeShop, coffee shop, coffeehouse, coffee house, etc.

3.3. Data Annotation

After defining the coding schema, a subset of tweets (5000) is randomly sampled and manually annotated into different themes. During the initial annotation process, we notice that most of the tweets are annotated as the others category, and some categories only contain a very small number of tweets. To ensure that we have enough tweets to build a classification model for the predefined categories, more tweets from each category should be included into the sampling sets which will then be used for the subsequent model training and validation processes. Therefore, an automatic program using a simple text match approach is developed to categorize the remaining tweets into different themes. A tweet is attributed to a specific category if it contains associated keywords defined in Table 1. We look into the tweets of each initial category except for the others category, and annotate those for which we are confident of their true categories, which are then added into our sampling sets. In order to reduce the duplicated tweets on the classifier, all retweets are discarded. In the end, 8807 tweets are included to train and test the multi-label classifier that will be presented in the following section.

3.4. Data Preprocessing and Classification

Several classic classification algorithms for text mining are tested and compared, including K-nearest neighbors (KNN), naïve Bayes, and logistic regression. Those algorithms all have been implemented in Apache Mahout [26], an open source machine-learning package. To get the tweets ready for training process, a set of standard text preprocessing operations are performed. For each tweet entry, we first remove all non-words (punctuation, special characters, URLs, emotions, and whitespace). Then Apache Lucene (https://lucene.apache.org/), an open source information retrieval software library, is used to tokenize (separate) the remaining text into single words, and stop words (e.g., a, an, and, are, as, etc.) are removed. Using the rest tokens, we can generate a set of standard unigrams with each unigram corresponding to a sequence of one token (word). These unigrams in turn can be used to create a unigram feature vector to train the classifiers. After extensive experimentation with different text mining algorithms, we found that logistic regression outperforms other algorithms for our classification tasks and therefore is selected to classify the messages into different categories.

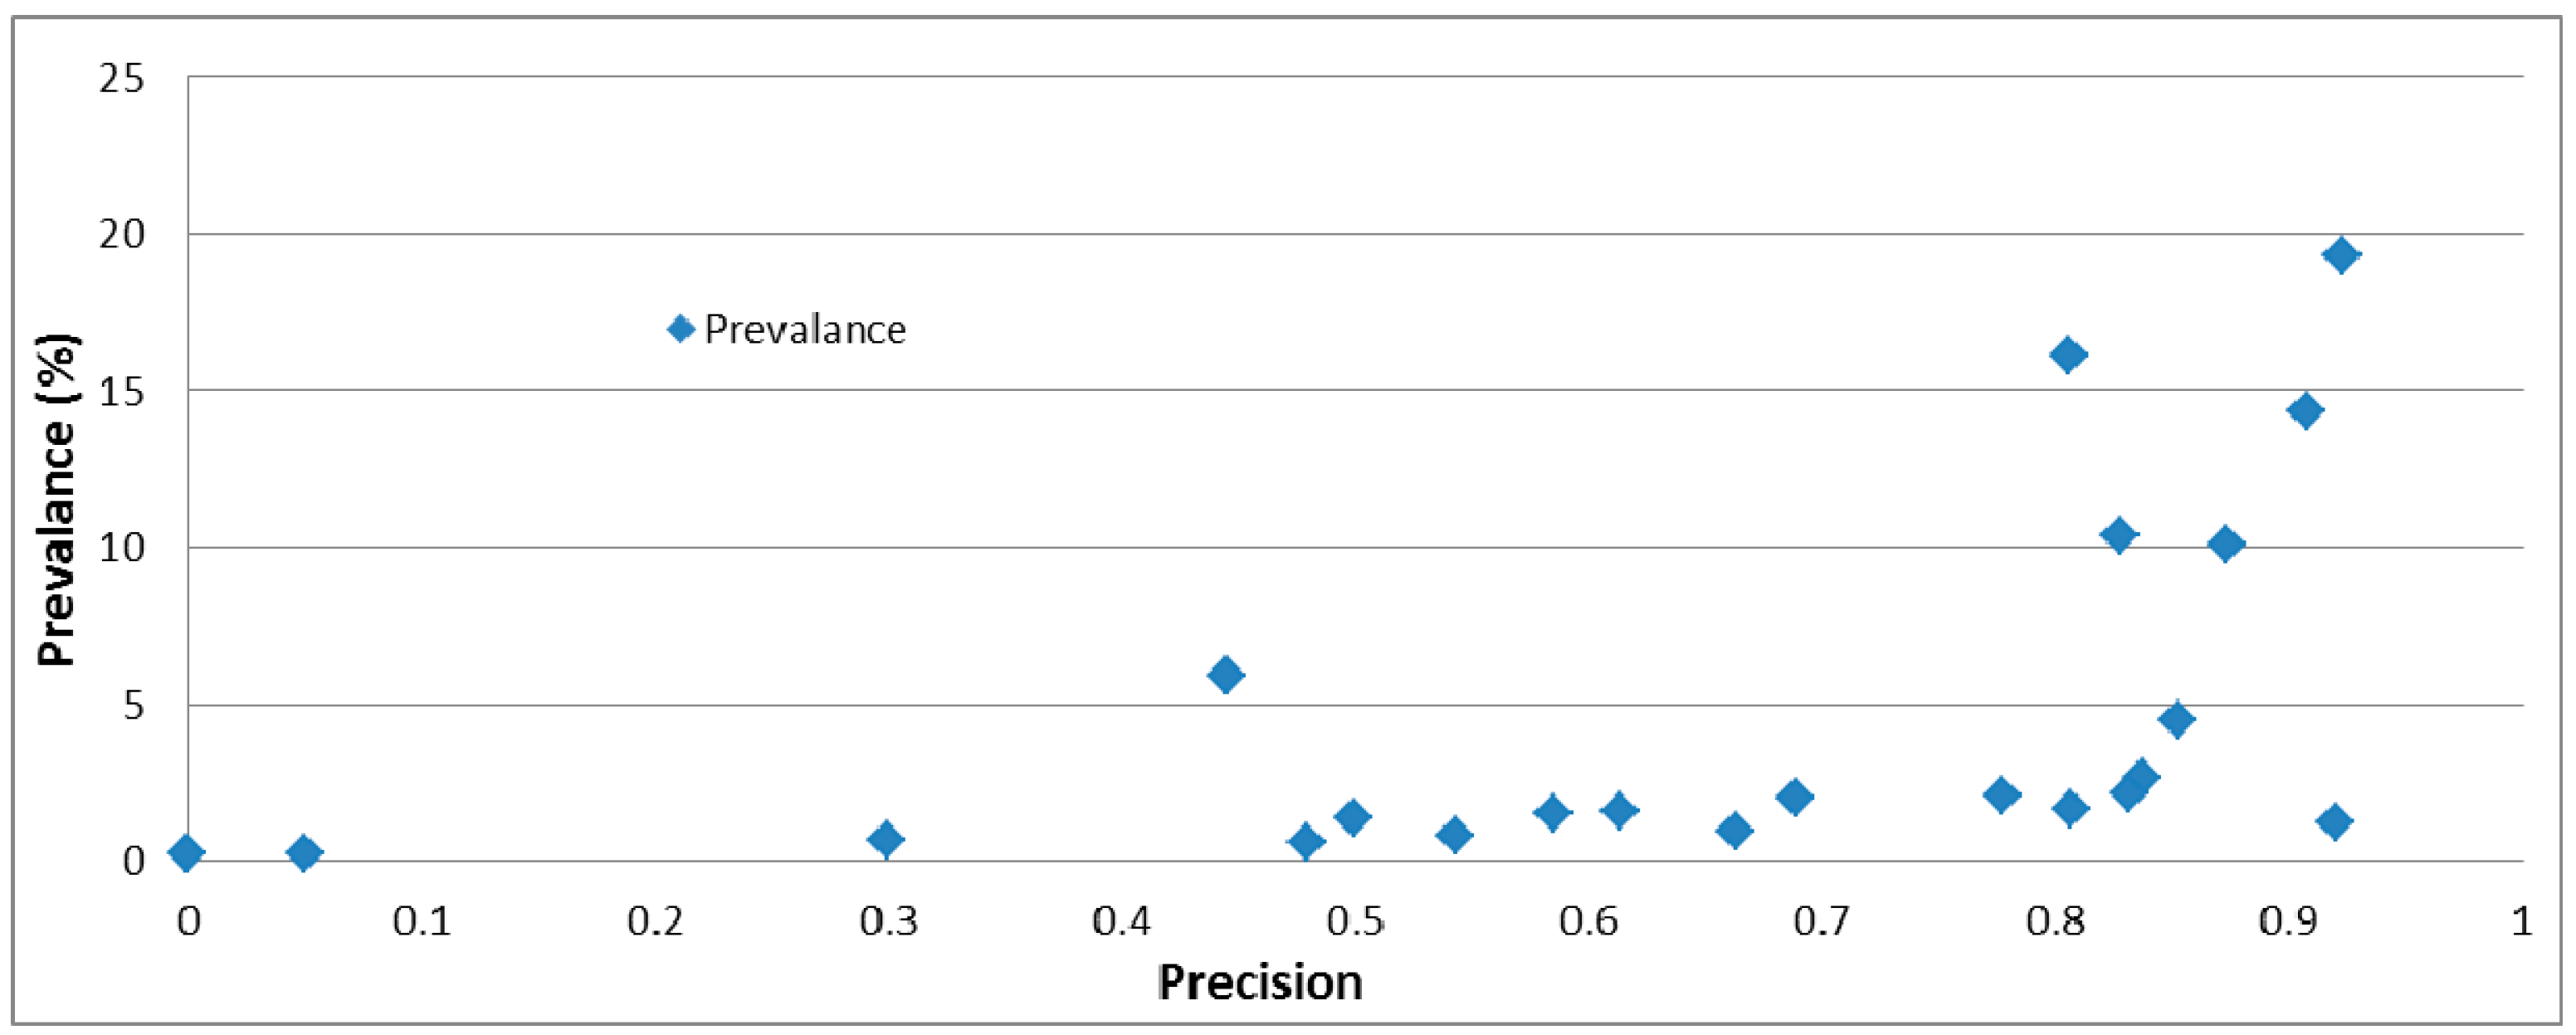
3.5. Experimental Results

Ten-fold cross-validation is performed to test the classifier. During the initial classification test, we notice that the produced classifier confused several classes due to topic similarity and imbalance in training sets assigned to each category. To address this issue, we combine similar categories. Table 2 column 1 and 5 shows the merged categories and their corresponding sub-categories. The number of annotated messages for each category is displayed in the last column. Additionally, we also discard several categories with training samples less than a predefined threshold (e.g., 20) since we are unable to train the classier to accurately assign tweets to those categories based on the small size of the training set. Examples include preparedness.plans, preparedness.tip, recovery.school, recovery.restore, recovery.housing, recovery.repair, recovery.stock, recovery.utilities.power, recovery.utilities.gas, and impact.housing.
Table 2. Precision, recall, and F1-Score for the various classification tasks.
CategoryPrecisionRecallF1-ScoreSub-CategoryNumber
recovery.relief0.9230.9230.923recovery.relief, recovery.humanity, recovery.funding 1751
impact.utilities.gas0.9200.8490.880impact.utilities.gas110
preparedness.prepare0.9080.8870.897preparedness.prepare, preparedness.Stock, preparedness.prepareforoutage1304
impact.utilities0.8740.8310.851impact.communication, impact.utilities.heating, impact.utilities.water, impact.utilities.power912
impact.flood0.8530.8690.856impact.flood404
preparedness.shelter_in_place0.8380.8400.832preparedness.shelter_in_place237
impact.school0.8320.8310.826impact.school196
impact.postsandy0.8280.8170.822impact.damage939
response.clearnup0.8070.8320.813response.clearnup151
others.others0.8060.6640.726others.others1464
response.housing0.7780.8350.800response.housing187
recovery.recover0.6890.7330.704recovery.recover181
recovery.work0.6630.7550.687recovery.work86
recovery.utilities0.6140.7500.664recovery.communication, recovery.utilities.heating, recovery.utilities.water, recovery.utilities.power143
preparedness.evacuation0.5850.7230.644preparedness.evacuation, response.escape134
impact.work0.5430.5590.526impact.work74
recovery.business0.5000.6340.550recovery.business, recovery.transportation, recovery.transportation.airport, recovery.transportation.bus, recovery.transportation.ferry, recovery.transportation.road, recovery.transportation.subway, recovery.transportation.traffic, recovery.transportation.train120
impact.casualty0.4800.7580.572impact.casualty55
impact.business0.4450.8070.569impact.business, impact.impact, impact.work, impact.transportation, impact.transportation.airport, impact.transportation.bus, impact.transportation.ferry, impact.transportation.road, impact.transportation.subway, impact.transportation.traffic, impact.transportation.train535
preparedness.event_tracking0.3000.6550.399preparedness.event_tracking61
response.rescue0.0500.1000.067response.rescue20
recovery.rebuild0.0000.0000.000recovery.rebuild21
Several accuracy measurements are used to evaluate the performance of the message classification, including precision (p), recall (r), and F1 score. Precision is the percentage of correctly predicted tweets for a class to the total predicted tweets for that class in the testing examples. Recall is a ratio of the percentage of correctly predicted tweets for a class to the total number of tweets in that class in the testing examples. F1 score, known as a weighted average of the precision and recall, reaches its best value at 1 and worst score at 0.
After 10-fold cross-validation, the classifier achieved an overall precision of 0.647, recall of 0.711, and F1-score of 0.664. Table 2 shows the performance of the classifier for classifying each category. Based on the results, it can be observed that the classifier performs well on most of categories as demonstrated by a relatively high value for each evaluation index. Especially, the top three categories, including recovery.relief, impact.utilities.gas, are preparedness.prepare, obtains a precision of above 0.9. Several categories, recovery.rebuild, response.rescue and preparedness.eventmonitoring, stand out with majority of messages being miscategorized, especially the recovery.rebuild category, where none of the messages are properly assigned. The reason behind this is that we do not have enough training data for those categories (Table 2). About two third of the messages from impact.business and recovery.business are not categorized correctly.
We also calculated the prevalence of each category to test the correlation between the performance and the prevalence of a category (Figure 1). The results further demonstrate the effects of an unbalanced training set and overlapping examples. In general, better precision is achieved for a category classification when the prevalence of the category is higher. In fact, if the prevalence of a category is more than 5%, the precision of the category classification can obtain more than 80% with one exception for the impact.business category. This is because much content from impact.business and recovery.business are overlapping.
Figure 1. Correlation between the precision and prevalence of a category.
Ijgi 04 01549 g001

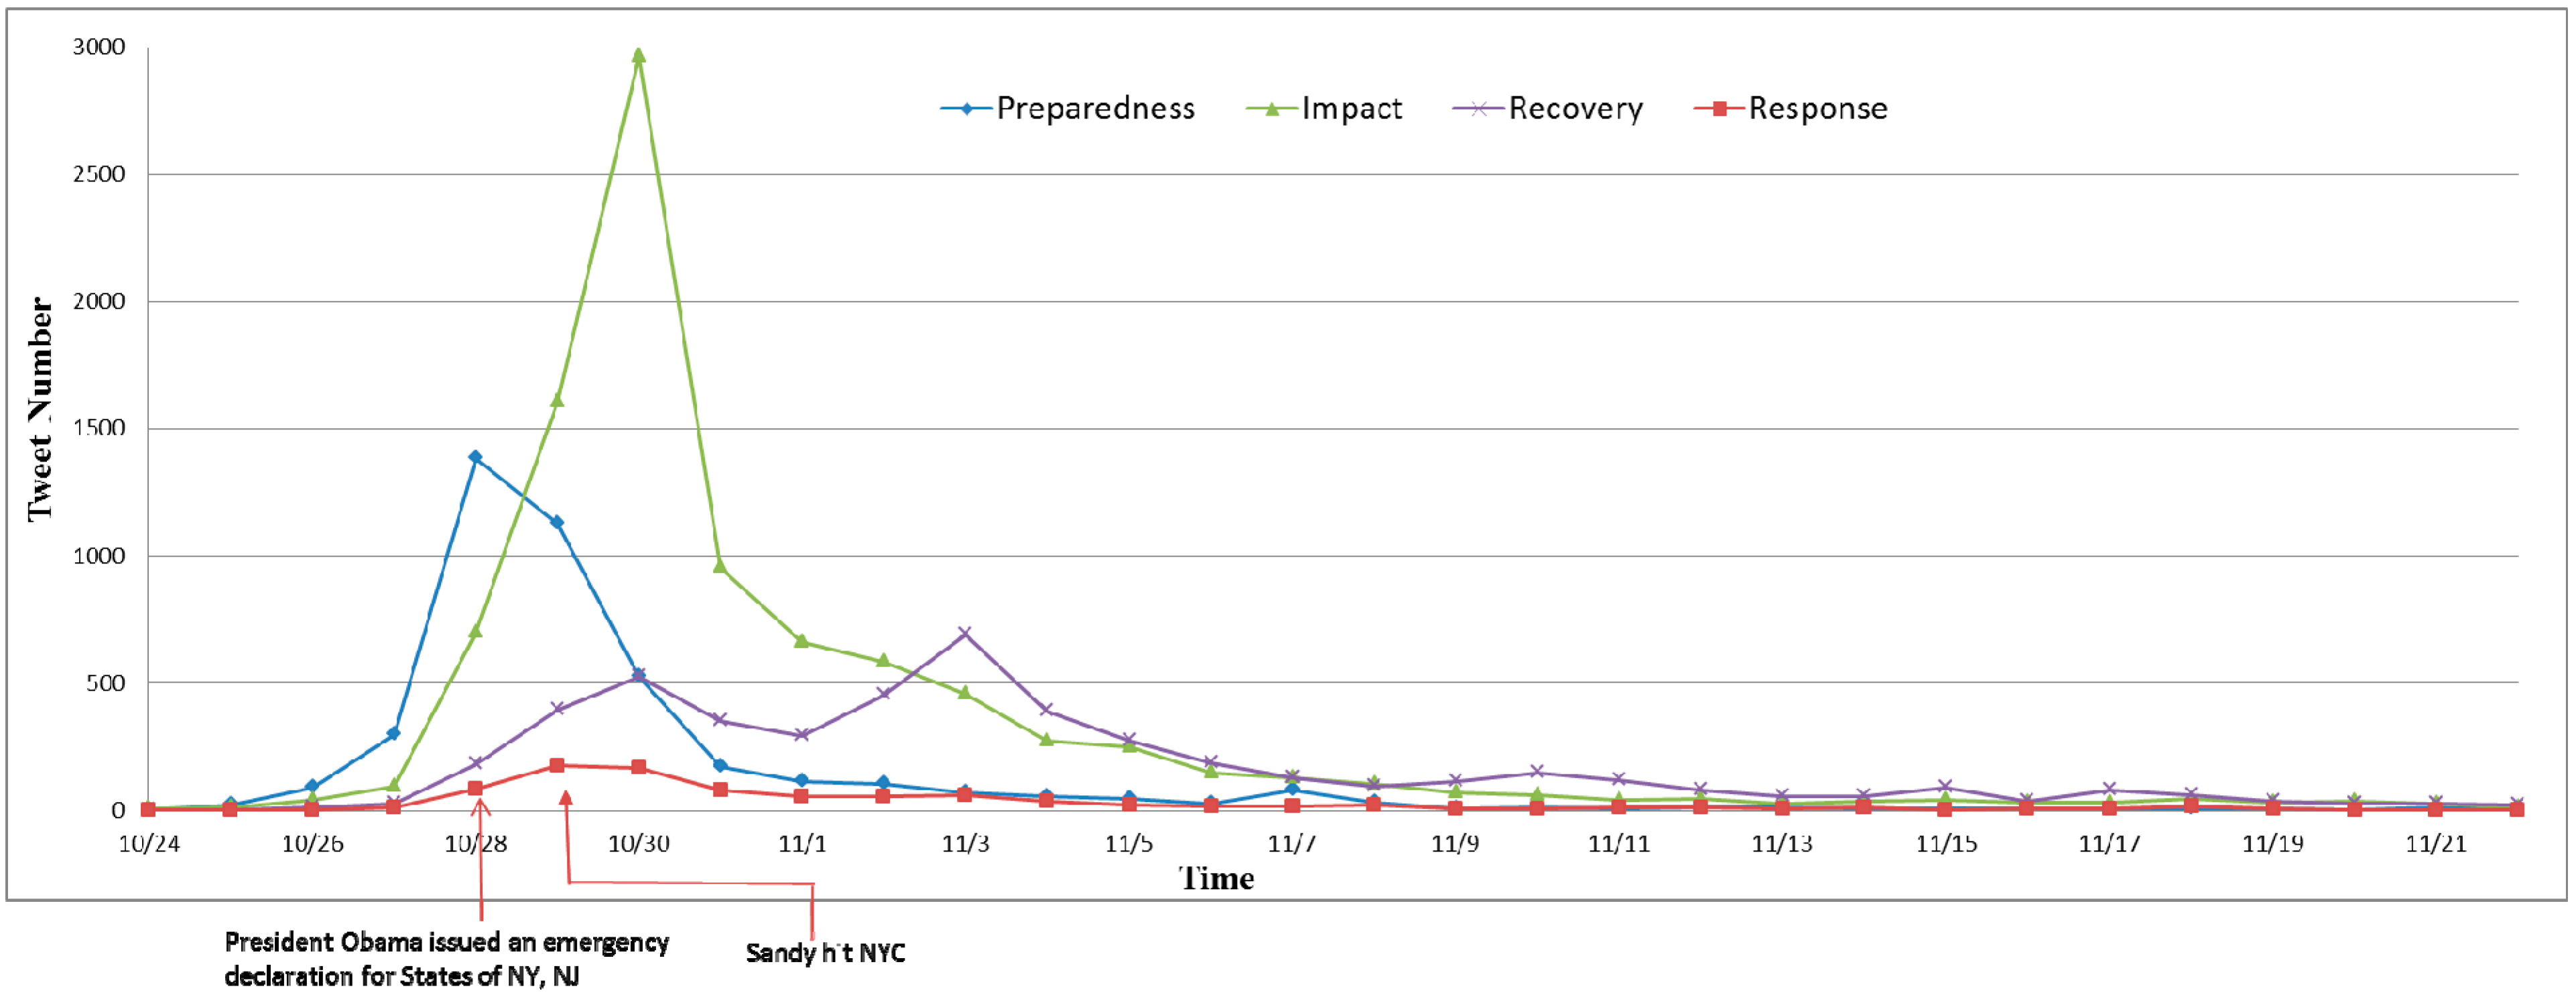
4. Disaster Situation Analysis

By studying the spatiotemporal distributions of messages, we can understand citizens’ behaviors and reactions towards a disaster event. In this section, we apply the predicted results to explore the spatiotemporal patterns of different topics. We report on how the topics have changed over time and where the topics are spatially distributed.

4.1. Topic Trend over Time

Because Twitter users would likely post different types of messages, shifting from preparedness-related topics during a disaster’s initial stages to recovery related content after a crisis, we compare the topics in different disaster stages over time.
Figure 2 shows the temporal trend of topics in different disaster phases. It can be observed that before 24 October, and after 21 November, only limited tweets are disaster relevant. Several days before Hurricane Sandy struck New York, it was widely reported by news media that wind, rain, and flooding would pound the city throughout the night of 29 October. We saw an increase in tweets regarding preparedness that reached its peak on 28 October, the day President Obama issued an emergency declaration for New York. Alerted by the media, citizens began to prepare for the coming storm. Such actions are reflected by the reports of grocery shopping, charging cell phones, getting emergency tool kits, purchasing candles, flashlights, and generators for power outrage, evacuating, etc., on Twitter. Before the disaster, we can see that preparedness dominated among all topics before 29 October. Notice that there are not too many tweets regarding response-related topics in the categories of housing and rescue, which reached its peak on 29 November mostly spread across 29 October and 1 November.
Figure 2. Tweet number in different disaster phases over time.
Ijgi 04 01549 g002
The impact of the disaster is captured by the social media data, where a large portion of tweets are related to impact categories from 29 October to 3 November. The impact topic reaches its maximum on 30 October, the day after Sandy moved away from New York. When the hurricane dissipated, on the other hand, it can be observed that an increasing number of tweets are related to recovery topics, especially after 2 November, when recovery was the primary disaster-related topic and messages related to the other disaster topics were dwindling.
The number of tweets on disaster recovery had several peaks. The first one was on 30 October, the day after Sandy hit the area. Many people posted messages about returning home and going back to work. The largest peak appeared on Nov 3, the first Saturday after Sandy, when many people went out to donate to disaster relief and volunteer their time to help communities clean up the mess. A small peak showed up on the subsequent Saturday, 10 November. These tweets were also related to volunteering and helping communities recover.

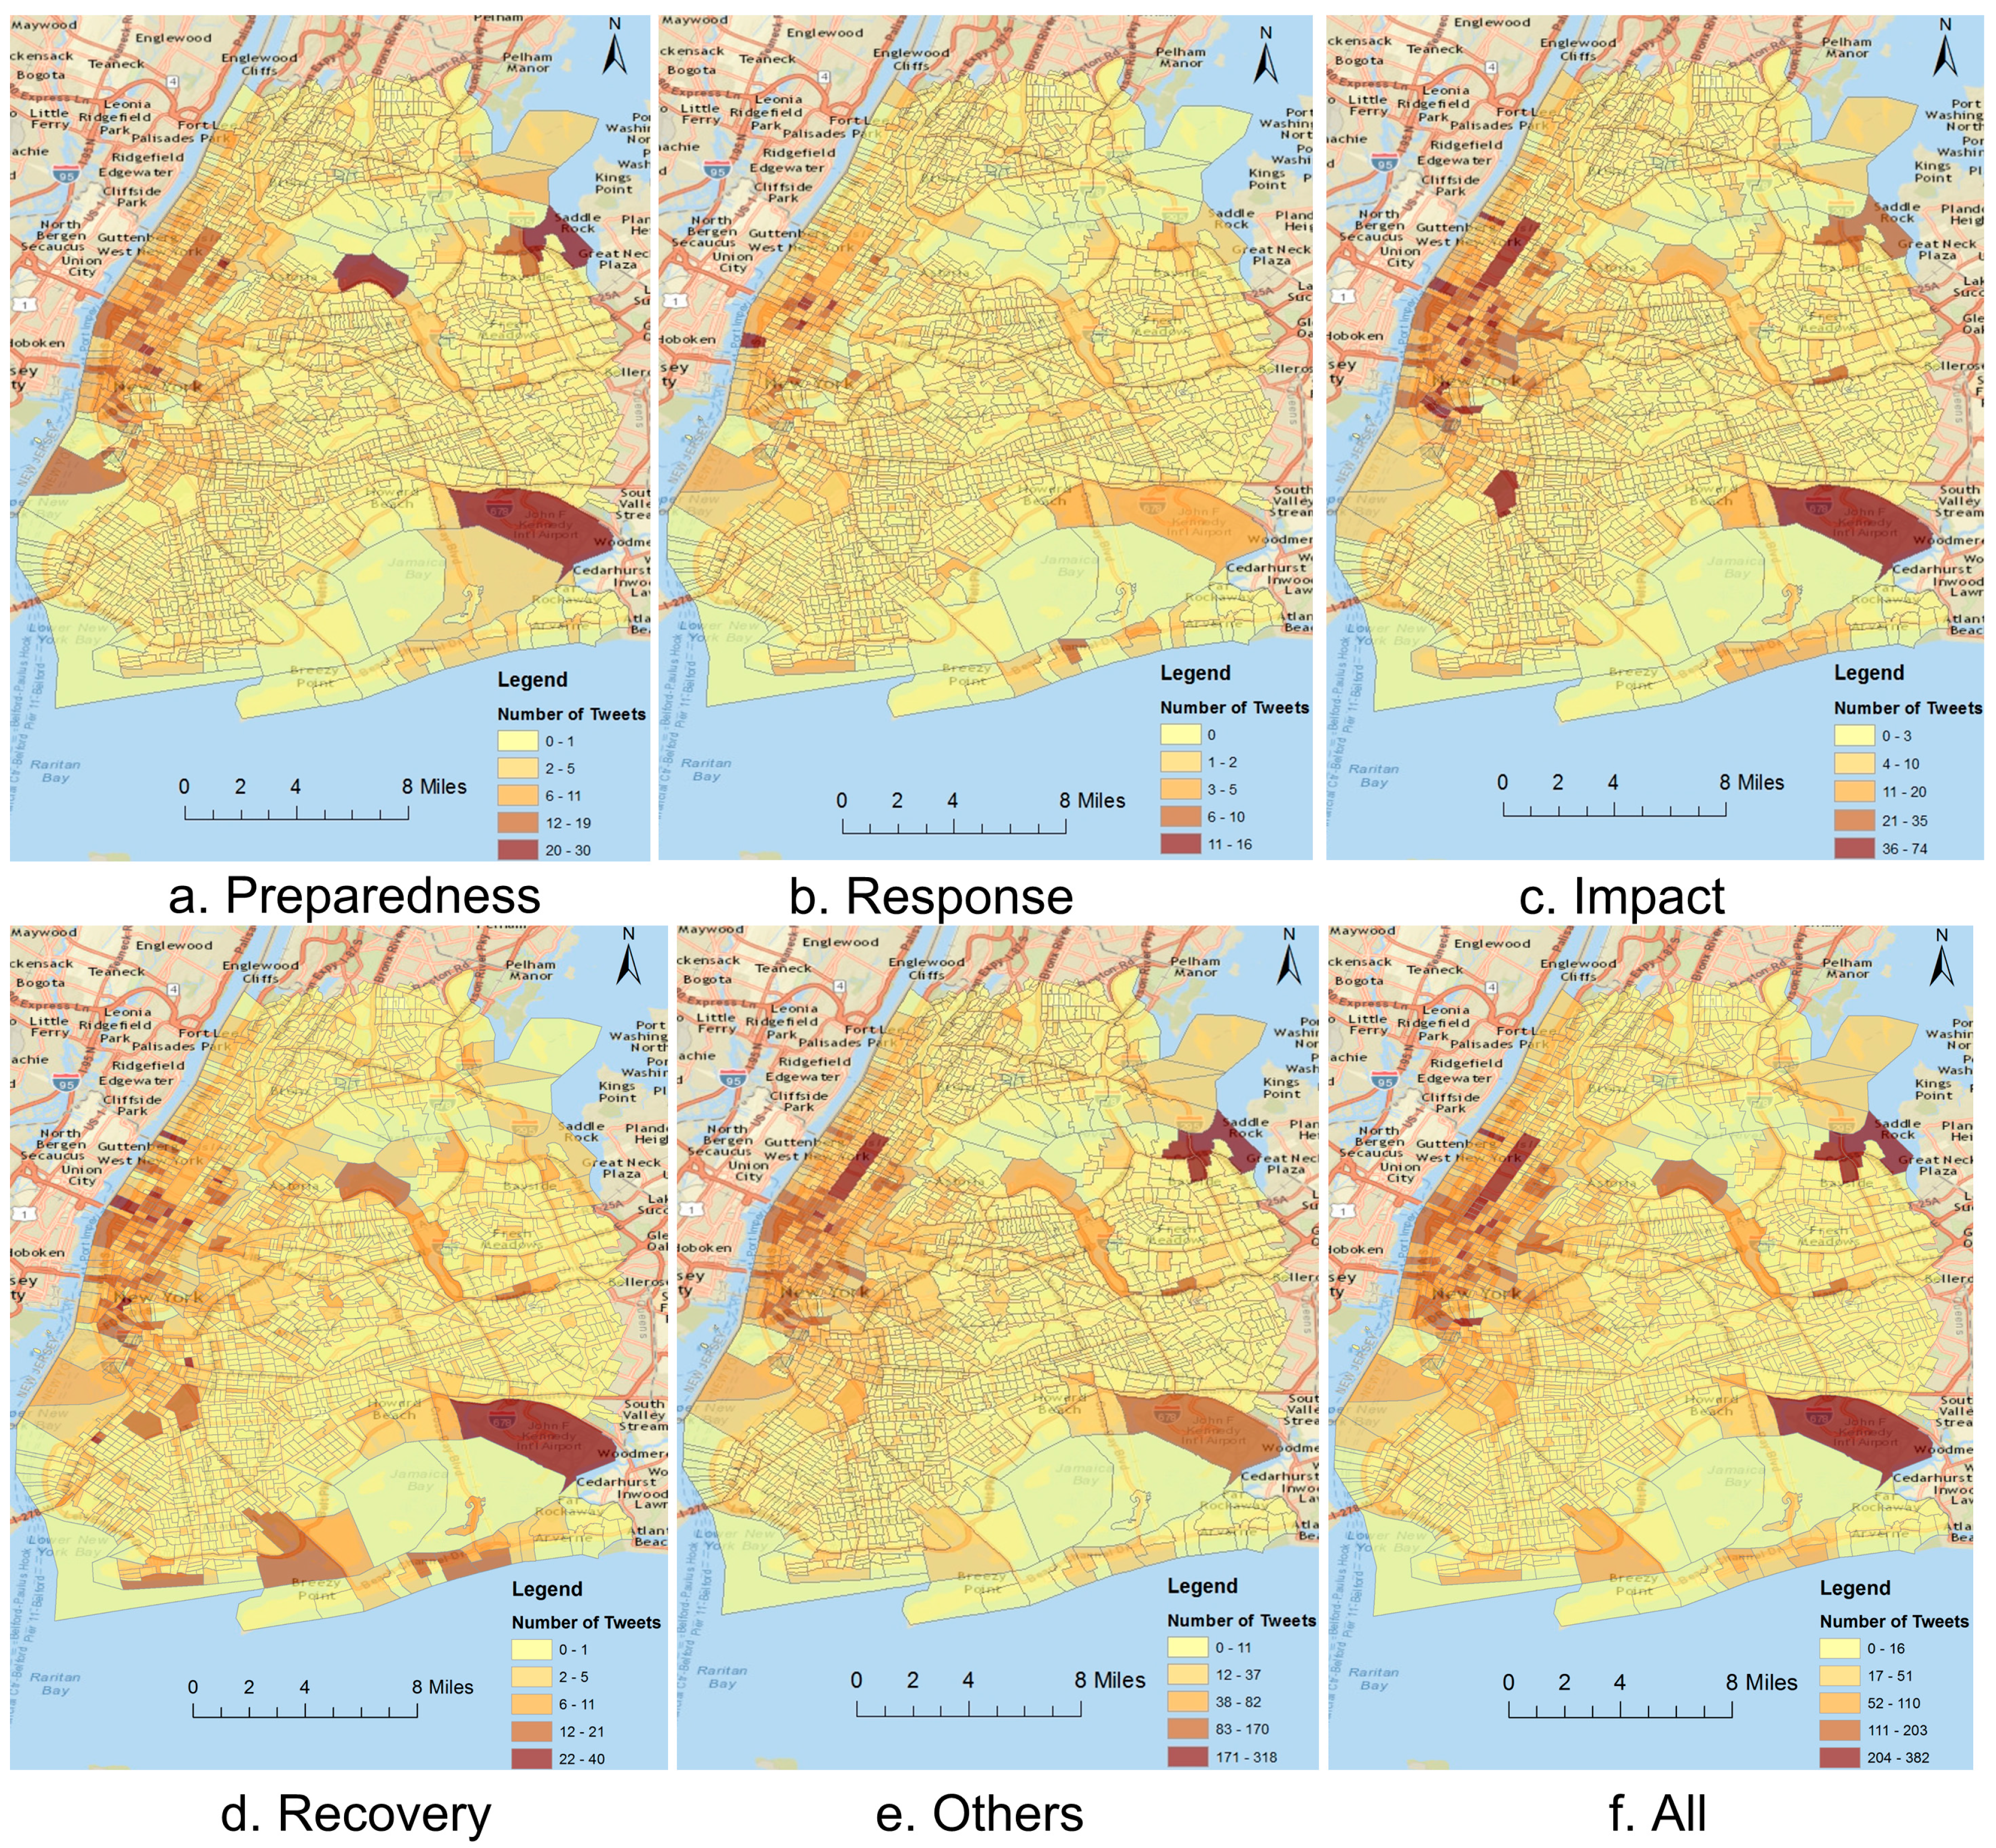
4.2. Topics in Space

We can investigate citizens’ online social behaviors by mapping and visualizing the tweets of a specific theme (such as the response during Hurricane Sandy). Figure 3 shows the geographical distribution of tweets for different topics by census tract within three disaster stages. It can be observed that there are several places where users most actively posted information about the disaster. For instance, most tweets were sent from the communities of lower Manhattan, cities within the shore storm surge area such as Hoboken, which lies on the bank of the Hudson River, and Brooklyn on the bank of the East River. These locations were devastated by the storm surge and high winds associated with Hurricane Sandy. Such patterns indicate that Twitter users within impacted neighborhoods are more likely to contribute meaningful data about the disaster.
Figure 3. The geographical distribution of disaster-relevant tweets within different disaster phases.
Ijgi 04 01549 g003
Additionally, there are a large number of tweets from many inland communities in Manhattan (Figure 3f). The high population density and the accessibility to the power and Internet in Manhattan might contribute to massive tweets in these communities [27]. Many public areas, such as central park, John F. Kennedy International Airport, and LaGuardia Airport, capture a large number of tweets. It is observed that there are many tweets sent from the airport during different stages. This is because people would post information about leaving New York before the hurricane (Preparedness; Figure 3a), report the damages of the airport or cancellation of the flights indeterminately after the Sandy (Impact; Figure 3c), and share the news about the normal operation of the airport, getting back to or flying out the city (Recovery; Figure 3d). A quite large number of Tweets are posted from the Bay Terrace area (NE corner of the study area). This is because we include the tweets posted from Foursquare, where users can check in to different places, and share these check-in with friends on both Foursquare and other social media sites, such as Twitter. We notice that many check-ins were made at the “Frankenstorm Apocalypse—Hurricane Sandy (https://foursquare.com/frankenstorm_ny)” with photos, updates and tips shared among users from the Bay Terrace area.
It is apparent that many tweets of the Impact category are generated from the public parks (e.g., Central Park) because people witnessed and posted the photos of fallen trees, and reported the closure of these parks (Figure 3c). Census tracts along the shore of the Hudson River, especially these close to the Lincoln Tunnel, and Holland Tunnel, have a large number of tweets of both the Impact (Figure 3c) and Recovery (Figure 3d). This is because many people, visiting or passing by these areas, would report the information about surging or fading of the water, and closure or open of the tunnels, etc.

5. Conclusions

Social media messages are rich in content, capturing and reflecting many aspects of individual lives, experiences, behaviors, and reactions to a specific topic or event. Therefore, these messages can be used to monitor and track geopolitical and disaster events, support emergency response and coordination, and serve as a measure of public interest or concern about events. This work presents a coding schema for separating social media messages into different themes within different disaster stages. A number of standard text mining techniques are experimentally used to classify the collected tweets during a disaster, Hurricane Sandy in 2012. A logistic regression classifier is selected to train and automatically categorize the messages into our predefined categories.
The classifier can achieve an overall precision of 0.647 on average. As introduced in Section 3.3, a few categories whose sample sizes are too small (less than 20 tweets) to train the classifier are discarded. Additionally, a few themes that include too small-sized samples (less than 20 tweets) to train the classifier are discarded (preparedness.plans). Some categories of similar topics are combined. In the future, a more sophisticated classification model that can handle unbalanced data may be developed to increase the classification accuracy. Different combinations of similar themes may be also tested to obtain better accuracy. Additionally, actionable information should be extracted for each disaster phase rather than response phase. For example, we could extract the open stores available for stocking up on disaster essentials and restoring daily supplies before and after disasters, which were less examined in previous studies.
In this work, we used Hurricane Sandy data to train and validate the classifier. In future, data from different extreme natural hazard events, especially hurricane related ones, should be examined and integrated to create a common classifier so that it can be applied to automatically categorize the tweets into different categories during a disaster. Such common classifier could help support real-time disaster management and analysis by monitoring subsequent events while tweets are streaming, and mining useful information.
This paper presents a new coding schema to categorize tweets into different themes for establishing geographic situational awareness, and a framework that can be applied to separate tweets into those categories. Therefore, only preliminary analysis is performed over the classification results, and a great deal of effort will be devoted to analyzing the spatiotemporal patterns of a specific subset of categories (e.g., power outage), and understand the drivers of these patterns by linking the classification results with other GIS data, such as demographic and socioeconomic information.
Despite the opportunities and possibilities that scholars and practitioners envisioned in utilizing social media for disasters, several concerns have been raised about the information quality of social media data [28,29]. For example, it has been recognized that certain groups (i.e., low income, low education, and elderly) may lack the tools, skills and motivations to access social media and therefore they may be less likely to post disaster relevant information through social media [27]. Additionally, certain areas may be severely damaged by the disaster, which results in extremely low participation in social media usage after the disaster. As a result, the situational awareness information extracted from social media data may be biased and needs from the significantly impacted communities can be underestimated. Therefore, the social and spatiotemporal inequality in the usage of social media data should be fully considered before such data can be leveraged to predict damage, investigate impacted populations and prioritize activities during the course of disaster management. Instead of using social media as a standalone information source, previous studies [25,30] suggested that authoritative data (e.g., remote sensing data) should be combined to enhance the identification of relevant messages from social media.

Supplementary Files

Supplementary File 1

Author Contributions

Qunying Huang and Yu Xiao designed the coding schema, annotated the sample sets, and wrote the paper. Qunying Huang processed and analyzed the data.

Conflicts of Interest

The authors declare no conflict of interest.

Acknowledgement

We would like to thank Caitlin McKown for the help and support during this research. Work performed under this project has been funded by the UW-Madison WARF grant # PRJ93XF.

References

  1. Neal, D.M. Reconsidering the phases of disaster. Int. J. Mass Emerg. Disasters 1997, 15, 239–264. [Google Scholar]
  2. U.S. Department of Education. Action Guide for Emergency Management at Institutions of Higher Education. 2010. Available online: http://rems.ed.gov/docs/rems_ActionGuide.pdf (accessed on 7 June 2015). [Google Scholar]
  3. FEMA 1998 Animals in Disaster: Module Awareness and Preparedness. Available online: http://training.fema.gov/EMIWeb/downloads/is10comp.pdf (accessed on 7 June 2015).
  4. Pu, C.; Kitsuregawa, M. Big Data and Disaster Management: A Report from the JST/NSF Joint Workshop. Georgia Institute of Technology, CERCS. 2013. Available online: https://grait-dm.gatech.edu/wp-content/uploads/2014/03/BigDataAndDisaster-v34.pdf (accessed on 7 June 2015).
  5. Vieweg, S.; Hughes, A.L.; Starbird, K.; Palen, L. Microblogging during two natural hazards events: What Twitter may contribute to situational awareness. In Proceedings of the 2010 SIGCHI Conference on Human Factors in Computing Systems, Atlanta, GA, USA, 10–15 April 2010.
  6. Kumar, S.; Barbier, G.; Abbasi, M.A.; Liu, H. TweetTracker: An analysis tool for humanitarian and disaster relief. In Proceedings of the Fifth International Conference on Weblogs and Social Media, ICWSM, Barcelona, Spain, 17–21 July 2011.
  7. Blanchard, H.; Carvin, A.; Whitaker, M.E.; Fitzgerald, M.; Harman, W.; Humphrey, B. White Paper: The Case for Integrating Crisis Response with Social Media; American Red Cross: Washington, DC, USA, 2012. [Google Scholar]
  8. Cameron, M.A.; Power, R.; Robinson, B.; Yin, J. Emergency situation awareness from twitter for crisis management. In Proceedings of the 21st International Conference Companion on World Wide Web, Lyon, France, 16–20 April 2012.
  9. Savage, M.; Devine, F.; Cunningham, N.; Taylor, M.; Li, Y.; Hjellbrekke, J.; Roux, B.L.; Friedman, S.; Miles, A. A new model of social class? Findings from the BBC’s Great British class survey experiment. Sociology 2013, 47, 219–250. [Google Scholar] [CrossRef] [Green Version]
  10. Imran, M.; Elbassuoni, S.; Castillo, C.; Diaz, F.; Meier, P. Practical extraction of disaster-relevant information from social media. In Proceedings of the 22nd International Conference on World Wide Web Companion, Rio de Janeiro, Brazil, 13–17 May 2013.
  11. Purohit, H.; Castillo, C.; Diaz, F.; Sheth, A.; Meier, P. Emergency-relief coordination on social media: Automatically matching resource requests and offers. First Monday 2013, 19. [Google Scholar] [CrossRef]
  12. Ashktorab, Z.; Brown, C.; Nandi, M.; Culotta, A. Tweedr: Mining twitter to inform disaster response. In Proceedings of the 11th International ISCRAM Conference, University Park, PA, USA, 18–21 May 2014.
  13. Huang, Q.; Xu, C. A Data-driven framework for archiving and exploring social media data. Ann. GIS 2014, 20, 265–277. [Google Scholar]
  14. Warfield, C. The Disaster Management Cycle. 2008. Available online: http://www.gdrc.org/uem/disasters/1-dm_cycle.html (accessed on 7 June 2015).
  15. Vieweg, S. Situational Awareness in Mass Emergency: A Behavioral and Linguistic Analysis of Microblogged Communications. Ph.D. Thesis, University of Colorado at Boulder, Boulder, CO, USA, 2012. [Google Scholar]
  16. Meier, P. Digital Disaster Response to Typhoon Pablo. Available online: http://voices.nationalgeographic.com/2012/12/19/digital-disaster-response/ (accessed on 7 June 2015).
  17. Sakaki, T.; Okazaki, M.; Matsuo, Y. Earthquake shakes Twitter users: Real-time event detection by social sensors. In Proceedings of the 19th International Conference on World Wide Web, Raleigh, NC, USA, 26–30 April 2010.
  18. Signorini, A.; Segre, A.M.; Polgreen, P.M. The use of Twitter to track levels of disease activity and public concern in the US during the influenza A H1N1 pandemic. PLoS ONE 2011, 6. [Google Scholar] [CrossRef] [PubMed]
  19. Kent, J.D.; Capello, H.T., Jr. Spatial patterns and demographic indicators of effective social media content during the Horsethief Canyon fire of 2012. Cartogr. Geogr. Inf. Sci. 2013, 40, 78–89. [Google Scholar] [CrossRef]
  20. Mandel, B.; Culotta, A.; Boulahanis, J.; Stark, D.; Lewis, B.; Rodrigue, J. A demographic analysis of online sentiment during hurricane irene. In Proceedings of the Second Workshop on Language in Social Media, Atlanta, GA, USA, 13 June 2012.
  21. Spinsanti, L.; Ostermann, F. Automated geographic context analysis for volunteered information. Appl. Geogr. 2013, 43, 36–44. [Google Scholar] [CrossRef]
  22. Gao, H.; Barbier, G.; Goolsby, R. Harnessing the crowdsourcing power of social media for disaster relief. IEEE Intell. Syst. 2011, 26, 10–14. [Google Scholar] [CrossRef]
  23. Schnebele, E.; Cervone, G. Improving remote sensing flood assessment using volunteered geographical data. Nat. Hazards Earth Syst. Sci. 2013, 13, 669–677. [Google Scholar] [CrossRef]
  24. Schnebele, E.; Cervone, G.; Kumar, S.; Waters, N. Real time estimation of the Calgary floods using limited remote sensing data. Water 2014, 6, 381–398. [Google Scholar] [CrossRef]
  25. Schnebele, E.; Oxendine, C.; Cervone, G.; Ferreira, C.M.; Waters, N. Using non-authoritative sources during emergencies in urban areas. In Computational Approaches for Urban Environments; Springer: Berlin, Germany, 2015; pp. 337–361. [Google Scholar]
  26. Owen, S.; Anil, R.; Dunning, T.; Friedman, E. Mahout in Action; Manning Publications Co.: Greenwich, CT, USA, 2011. [Google Scholar]
  27. Xiao, Y.; Huang, Q.; Wu, K. Understanding social media data for disaster management. Nat. Hazards 2015. [Google Scholar] [CrossRef]
  28. Oh, O.; Kwon, K.H.; Rao, H.R. An exploration of social media in extreme events: Rumor theory and twitter during the Haiti Earthquake 2010. In Proceedings of the 2010 ICIS, Saint Louis, MO, USA, 10–20 August 2010.
  29. Goodchild, M.F.; Li, L. Assuring the quality of volunteered geographic information. Spat. Stat. 2012, 1, 110–120. [Google Scholar] [CrossRef]
  30. De Albuquerque, J.P.; Herfort, B.; Brenning, A.; Zipf, A. A geographic approach for combining social media and authoritative data towards identifying useful information for disaster management. Int. J. Geogr. Inf. Sci. 2015, 29, 667–689. [Google Scholar] [CrossRef]

