Article

User-Centered Design for Interactive Maps: A Case Study in Crime Analysis

1
Department of Geography, University of Wisconsin-Madison, Madison, WI 53706, USA
2
Booz Allen Hamilton, Durham, NC 27701, USA
3
GeoVISTA Center, Department of Geography, The Pennsylvania State University, University Park, PA 16802, USA
*
Author to whom correspondence should be addressed.
ISPRS Int. J. Geo-Inf. 2015, 4(1), 262-301; https://doi.org/10.3390/ijgi4010262
Submission received: 2 November 2014 / Revised: 9 December 2014 / Accepted: 26 January 2015 / Published: 16 February 2015
(This article belongs to the Special Issue Recent Developments in Cartography and Display Technologies)

Abstract

:
In this paper, we address the topic of user-centered design (UCD) for cartography, GIScience, and visual analytics. Interactive maps are ubiquitous in modern society, yet they often fail to “work” as they could or should. UCD describes the process of ensuring interface success—map-based or otherwise—by gathering input and feedback from target users throughout the design and development of the interface. We contribute to the expanding literature on UCD for interactive maps in two ways. First, we synthesize core concepts on UCD from cartography and related fields, as well as offer new ideas, in order to organize existing frameworks and recommendations regarding the UCD of interactive maps. Second, we report on a case study UCD process for GeoVISTA CrimeViz, an interactive and web-based mapping application supporting visual analytics of criminal activity in space and time. The GeoVISTA CrimeViz concept and interface were improved iteratively by working through a series of user→utility→usability loops in which target users provided input and feedback on needs and designs (user), prompting revisions to the conceptualization and functional requirements of the interface (utility), and ultimately leading to new mockups and prototypes of the interface (usability) for additional evaluation by target users (user… and so on). Together, the background review and case study offer guidance for applying UCD to interactive mapping projects, and demonstrate the benefit of including target users throughout design and development.

1. Introduction

The advent of a digital, interactive medium has had a profound impact on the ways in which maps—and geographic concepts of space and place—are perceived and understood. For many, interactive maps are inescapable: they are in our cars, on our phones, and in our public spaces. Further, professionals in a variety of fields are embracing interactive maps as the front-end of their information systems, performing spatial queries and map interpretations once reserved solely for cartographers and GIS analysts. In the following, we use the term interactive map to capture the broad spectrum of one-off web maps, map-based applications, and other GIS or visualization tools that make use of a digital map as the manipulable interface to geographic information. Arguably, the renaissance of “geo” throughout popular culture and across professions is due at least in part to the pervasiveness of interactive maps that are location-aware, mobile compatible, and/or web-based. The outlook for interactive maps is great.
Yet, not all interactive maps “work” as they could or should; as the general public becomes more map-savvy through exposure to (and reliance on) interactive maps, they are becoming increasingly aware of the shortcomings and failures of these interactive maps. Perhaps these interactive maps portray geographic information that are inaccurate or incomplete, as with the well-publicized controversy regarding the initial release of Apple Maps [1]. Perhaps these interactive maps violate time-tested conventions of cartographic design, resulting in information displays that are inappropriately generalized, incorrectly normalized or classified, and illogically or unclearly symbolized. Perhaps the interface to the map is difficult to learn and use, and includes unexpected or unhelpful functionality, altogether resulting in an ineffective or frustrating user experience with the interactive map. Finally, perhaps these interactive maps work quite well, but only for particular user groups and particular tasks, leaving other target users and use case scenarios unsupported. While the outlook for interactive maps is great, ensuring they “work” successfully for the target users remains a challenge for designers and developers.
Here, we directly address the topic of interface success (i.e., does the interactive map work?) from the perspectives of cartography, GIScience, and visual analytics. As implied in the above, interface success is more than a matter of programming and debugging; it involves a deep study of the target users and supported use case scenarios during design, with multiple evaluation-and-revision stages planned into the development process to address these users and use cases fully. Therefore, the focus of our research is on the process of design that a cartographer should follow in practice, drawing from and building upon core tenets of user-centered design (hereafter “UCD”). UCD describes an early and active focus on the needs of the user when conceptualizing and implementing an interface [2], with an emphasis on iterative refinement to the ease-of-use and usefulness of the interface [3,4].
UCD increasingly has been recommended for interactive maps, e.g., [5,6,7,8,9], and has been leveraged within GIScience for the design and evaluation of digital geospatial libraries [10], desktop geovisualization tools [11,12,13], mobile mapping applications [14], participatory mapping tools [15,16], spatial decision support tools [17], virtual environments [18,19], and web mapping applications [20,21,22,23], among others. However, preliminary evidence suggests that UCD may not be common in practice, despite the desire of interactive map users to be more involved in the conceptualization, evaluation, and refinement of their interactive mapping systems [24]. Reasons for deviating from a user-centered approach include lack of access to the target users, lack of time or money to involve the users, the potential of feature creep, and even a general belief held by designers and developers that they know best. Yet, a user-centered approach often saves project resources rather than wastes them, as it is more costly to make fundamental changes to the interactive map after it has been deployed than during the earlier stages of conceptual design and prototyping [25].
Another additional explanation for minimal adoption of UCD for interactive mapping is that past discussion in cartography, GIScience, and visual analytics has not provided sufficient guidance for conceptualizing the overall UCD process nor the range of specific evaluation decisions needed to be made along the way. In this paper, we contribute to this gap in the research and practice on the UCD of interactive maps in two ways. First, we distill core concepts—and offer new ideas—regarding UCD, resulting in a comprehensive background review of UCD for interactive mapping. Second, we report on a case study in the context of crime analysis as a way to demonstrate the benefit of UCD and to reflect on key concepts related to UCD presented in the background review. Specifically, we describe the UCD of GeoVISTA CrimeViz (http://www.geovista.psu.edu/CrimeViz/), an interactive and web-based mapping application supporting visual analytics of criminal activity in space and time. We designed and developed GeoVISTA CrimeViz in collaboration with the Harrisburg Bureau of Police (Pennsylvania, USA) to support their specific crime analysis needs.
The paper proceeds in four additional sections. In the following section, we provide a background review on UCD for interactive maps, organizing the review into three parts: (1) the three components of interface success; (2) UCD processes; and (3) methods of interface evaluation. We introduce the GeoVISTA CrimeViz crime analysis case study in the third section and describe the user-centered process we completed to design and evaluate the application. In the fourth section, we discuss the results of each evaluation of GeoVISTA CrimeViz, walking through the evolution of GeoVISTA CrimeViz from a simple classroom example to the transition of the full release to the Harrisburg Bureau of Police. We reserve the final, concluding section to discuss ongoing aspects of maintenance to GeoVISTA CrimeViz and to reflect on broader issues regarding UCD for cartography, GIScience, and visual analytics.

2. Background

2.1. The Three U’s of Interface Success

An essential starting point for a UCD framework is consideration of how interface success is measured; in other words, how do we know when an interactive map “works”? Two broad categories of measures are leveraged to evaluate the success of an interface: usability and utility [26]. Usability describes the ease of using an interface to complete the user's desired set of objectives [27]. Nielsen [3,4] lists five measures of usability, which have been adopted by the Usability.gov website [28]: (1) learnability (how quickly users understand the interface without prior use); (2) efficiency (how quickly users can interact with the interface once learned to complete the desired tasks); (3) memorability (how well users can return to an interface and pick up where they left off); (4) error frequency and severity (how often users make mistakes and how fatal they are, respectively); and (5) subjective satisfaction (how well the interface is liked by the users). While the first four measures of usability primarily evaluate work productivity, the latter describes the user’s engagement with the interface and general impression of it, an aspect of usability essential for promoting buy-in and improving uptake of an interactive map.
In contrast, utility describes the usefulness of an interface for completing the user’s desired set of objectives [27]. Approaches for evaluating utility typically fall into one of two strategies. The first strategy assesses user performance according to a set of benchmark tasks, or representative combinations of user objectives and information content. For example, Andrienko et al. [29] present an “operational task typology” to characterize the suite of tasks that a user may need to complete with an interactive visualization. The taxonomy includes three axes along which benchmark tasks vary: (1) the cognitive operation (the user objective for completing the task, simplified in the operational task typology to the basic identify one data element and compare two or more data elements); (2) search target (the information content under consideration, including space, time, and attribute, or “where?”, “when?”, and “what?” questions); and (3) search level (an additional aspect of the information content considering the percentage of all map items under consideration along a continuum of elementary to general). The result of the operational task typology is a three-dimensional solution space from which example benchmark tasks can be derived for the purpose of utility evaluation. Roth [30] provides a review of alternative interaction primitive taxonomies that also can be used to construct benchmark tasks. The use of benchmark tasks to evaluate utility holds the advantages of having a “correct” answer, which in turn directly relates utility issues to specific interface functionality and affords consistency in measurement across multiple versions of an interactive map and different kinds of target users. However, benchmark tasks may oversimplify how interactive maps actually are used in practice, such as in the open-ended exploration and analysis typical of visual analytics.
The second strategy for evaluating utility instead assesses the quality of analytical products derived by the user when employing the interactive map. Such analytical products vary according to the user’s overall goals and may include the hypotheses generated by the interface, knowledge constructed while using the interface, or decisions made with support of the interface. For example, North [31] identified five characteristics of insights that can be used to evaluate the quality of ideas generated by an interactive visualization: (1) complex (how many information elements are included in the insight and how well they are integrated?); (2) deep (how much time was put into establishing the insight and how much evidence was accumulated to support it?); (3) qualitative (how exact and certain is the insight and what intangibles make it particularly intriguing?); (4) unexpected (how unique or novel is the insight?); and (5) relevant (how useful to the application domain is the insight and how well it generalizes across application domains?). The assessment of analytical products to evaluate utility aligns more closely with how interactive maps are used “in the wild”, but has the limitations of being more difficult to quantify given the lack of a “correct” answer, more difficult to relate utility issues to specific interface functionality, and more difficult to measure consistently across multiples versions of an interactive map.
Returning to the distinction between usability and utility, the International Organization for Standardization [32] and several subsequent scholars, e.g., [19,33] include utility as a component of the broader concept of usability, describing it as effectiveness, or the extent to which user tasks are achieved by employing the provided interface functionality. While it is true that utility is a measure of the mismatch between user tasks and the available functionality (or how well users apply the available functionality), we argue that there are advantages to treating utility separately from usability because the two typically play out as competing forces in terms of interface success. This usability-utility tradeoff often leads to a distinction between interfaces for experts that provide great utility, but are difficult to learn and use, and general-use interfaces that are transparently usable (i.e., require little or no learning to use), but support only a small set of user tasks [26].
So which should come first in this usability-utility tradeoff: usability or utility? We argue that it is necessary first to consider a third “U”: the user. The first step in successful UCD (as the name implies: “user”-centered design) is defining the target user group, or the community of users the interactive map is intended to support (Figure 1: top). We offer four axioms regarding the target users that designers and developers should embrace as they begin to learn their audience: (1) key stakeholders or domain experts do not necessarily represent target users, as they often hold much more experience and knowledge than the typical user; (2) the target users are unlikely to know what they want when first contacted, meaning it is the job of the project team to translate their abstract requests into concrete functional requirements; (3) the target users are likely to evolve over time, and therefore the interface should evolve with the target users; and finally, (4) the target users can exhibit substantial diversity both in their characteristics (i.e., their ability, expertise, and motivation in both domain concepts and interactive map use) as well as their needs (i.e., the tasks the interactive map must support).
We contend that this understanding of the user comes to define the initial functional requirements for the interactive map, which might be considered as a utility baseline against which versions of the interactive map should be compared (Figure 1: bottom-right). Once the utility baseline is determined, the designers and developers can work through static and partially functional prototypes to identify potentially usable interface designs for the required functionality (Figure 1: bottom-left). Thus, we argue that utility comes before usability for interactive maps, although acknowledge that promoting usability remains essential for interface success.
Finally, the preliminary interface design should be evaluated by a representative set of target users to ensure it successfully works across their needs and characteristics, returning full circle to the user (Figure 1: top). During such interface evaluation, users interact with the map to identify potential issues with its usability (looking rearward in the Figure 1 triangle) and to provide input about possible revisions to its utility in the next version (looking forward in the Figure 1 triangle); thus measures for both usability and utility should be collected during interface evaluation, with these results then prompting an additional user→utility→usability loop. As discussed in the above user axioms, thoughtful engagement with the interactive map may lead to an improved user awareness of what is possible, again instantiating new user→utility→usability loops. In some cases, the target users themselves can be improved through the provision of learning materials (e.g., help menus, tutorials, documentation), effectively achieving interface success without changing the utility or usability, but instead by changing the user [34]. The three U’s of interface success form a triangular relationship in which each of three components is contingent upon revisions and refinements to the prior (Figure 1).
Figure 1. The Three U’s of Interface Success. A successful interactive map in practice is contingent upon three components: the user, its utility, and its usability. We recommend first to determine user needs and characteristics, second to set the utility threshold to respond to these user characteristics and needs, third to improve the usability of interface design as much as possible given the utility threshold, and finally to return to the user to evaluate the preliminary interface, instantiating a new user→utility→usability loop.
Ijgi 04 00262 g001

2.2. The User-Centered Design Process

Following the triangular user→utility→usability relationship, UCD is not an equation in which all design decisions are prescribed a priori. Rather, UCD is best conceptualized as a flexible, multi-stage process during which an interactive map continuously is evaluated against established criteria, prompting subsequent refinement to its deficient aspects [35]. Nielsen’s [3,4] seminal work on usability engineering emphasizes the importance of iterative evaluation and revision during user-centered design, enumerating ten “elements” of the usability engineering lifecycle:
(1)
Know the User: Complete a needs assessment (also called a task analysis or work domain analysis) with target users to establish user profiles and use case scenarios;
(1)
Competitive Analysis: Critically compare existing interfaces supporting similar use cases to determine how the proposed interface can fill unmet needs;
(3)
Setting Goals: Use insight from the needs assessment and competitive analysis to formalize a requirements document of proposed functionality to guide design and development;
(4)
Participatory Design: Recruit a representative set of target users to participate in the conceptual design of the interface;
(5)
Coordinated Design: Coordinate design across the project team to develop a consistent product identity (i.e., look and feel);
(6)
Guidelines and Heuristic Analysis: Recruit experts during design and development to evaluate the interface according to guidelines (generalized insights generated from the scientific investigation of digital interfaces) and heuristics (well-accepted, overarching design principles drawn from experience);
(7)
Prototyping: Create static or interactive mockups of the interface; an early, partially-functional prototype is referred to as an alpha release while a fully-functional, but unstable prototype is referred to as a beta release;
(8)
Empirical Testing: Recruit a representative set of target users to evaluate the utility and usability of numerous prototypes during their evolution; formative evaluation describes the feedback solicited in the early to intermediate stages of the project on the alpha and beta releases, while summative evaluation is conducted on the full release of the interface to determine if the usability and utility goals have been achieved;
(9)
Iterative Design: Revise the interface based on feedback from guidelines/heuristic analysis and empirical testing;
(10)
Collect Feedback from Field Use: Acquire feedback about the interface after it is transitioned into the field to inform future product releases.
Figure 2. A User-centered Design Process for Cartographic Interfaces. Robinson et al. (2005) recommend a highly iterative, six stage UCD process for interactive maps: (1) work domain analysis (i.e., a needs assessment); (2) conceptual development; (3) prototyping; (4) interaction and usability studies; (5) implementation; and (6) debugging. Image redrawn with permission from Robinson et al. [12].
Ijgi 04 00262 g002
Figure 3. User-centered Design as an Iterative Process. The iterative, triangular user→utility→usability relationship represented in Figure 1 is implicit in most UCD processes, including the Robinson et al. [12] process illustrated by Figure 2. Here, the Three U’s are compared to the UCD process recommended by Robinson et al. and the case study UCD process completed for GeoVISTA CrimeViz.
Ijgi 04 00262 g003
Several scholars within cartography, GIScience, and visual analytics have distilled Nielsen’s [3,4] recommendations into formal and repeatable UCD processes. Gabbard, Hix, and colleagues [18,19,36] enumerate four stages in their UCD process: (1) a user task analysis (i.e., a needs assessment); (2) a guidelines-based evaluation on early prototypes (using Nielsen’s guidelines and heuristics); (3) a formative evaluation on an early release; and (4) a summative comparative evaluation on the full release. It is recommended to prioritize formative evaluation over summative evaluation, as major revisions are more costly toward the end of design and development [25]. Slocum et al. [17] expand upon this process to include six stages, making the evaluation-refinement coupling explicit: (1) creation of a prototype; (2) domain expert evaluation; (3) software refinement; (4) usability expert evaluation; (5) additional software refinement; and (6) decision maker (i.e., target user) evaluation. Interestingly, Slocum et al., include steps for gathering input from both experts and target users (like other UCD processes), but do not begin design and development by seeking user input in a needs assessment study (unlike other UCD processes), instead start with rapid prototyping. Finally, Tsou and Curran [37] adapt Garrett’s [38] five-stage user experience framework to web mapping, describing five different design “planes” that can be evaluated and refined by target users before implementation: (1) strategy plane (general user needs supported by the interface); (2) scope plane (specific mapping objectives supported by the interface); (3) structure plane (enumeration and organization of interface requirements); (4) skeleton plane (low-fidelity prototype sketching the interface layout); and (5) surface plane (high-fidelity prototype illustrating the final product identity of the interface).
Notably, Robinson et al. [12] describe a UCD process that emphasizes the highly iterative nature of UCD, encapsulating multiple user→utility→usability loops within a recursive six-stage process: (1) work domain analysis; (2) conceptual development; (3) prototyping; (4) interaction and usability studies, (5) implementation; and (6) debugging (Figure 2). The first three stages match closely to the three U’s of interface success identified in Figure 1. Robinson et al. [12], recommend beginning with a work domain analysis (i.e., a needs assessment) (Figure 3a), using this to set the initial utility baseline in a requirements document (Figure 3b), and then generating prototypes of the interactive map to optimize usability relative to the identified utility baseline (Figure 3c). These prototypes then are evaluated by a representative set of target users through interaction and usability studies (returning to Figure 3d), with user feedback prompting subsequent revision to the interface concept (utility; Figure 3e) and interface design (usability; Figure 3f), initiating one or several repetitions through the triangular relationship of the three U’s (Figure 3g–i). The Robinson et al. [12] UCD process finishes with a debugging stage (Figure 3j), during which small usability errors are removed and the code is optimized for stability, resulting in the transition of the full release to the target users.

2.3. Methods of Interface Evaluation

The reviewed UCD processes provide alternative strategies for the iterative evaluation and revision of an interactive map, describing repeatable approaches for working through the Figure 1 user→utility→usability loop. However, these UCD processes typically do not identify the actual method used for evaluating the interface. A wide variety of methods have been suggested for interface evaluation, most of which have their roots in scientific inquiry [39,40]. In this subsection, we complete the background review on UCD by enumerating available methods for evaluating interactive maps during their design and development.
Several scholars organize the available array of interface evaluation methods according to the recommended stage in the UCD process during which the method should be applied. For example, Buttenfield [10] classifies interface evaluation methods into three categories according to the stage in the overall process: (1) design (e.g., participant observation, needs assessment interviews); (2) development (e.g., cognitive walkthroughs, conformity assessment); and (3) deployment (e.g., automated evaluation, entry/exit surveys). Several popular web resources regarding usability engineering use similar, three-part classifications of interface evaluation methods according to stage (Table 1).
Table 1. Classifications of Interface Evaluation Methods by Stage. Many scholars or professional organizations classify interface evaluation methods into three categories according to the stage in the UCD process during which the method should be applied. Examples include Buttenfield [10], James Hom’s Usability Toolbox [41], Usability.gov [28], and Usability Partners [42].
Stage #Buttenfield (1999)Hom’s Usability ToolboxUsability.govUsability Partners
#1evaluation during system designinquiryanalyzecontext and user requirements
#2evaluation during system developmentinspectiondesignearly design and prototyping
#3evaluation during system deploymenttestingtesttest and evaluation
We suggest that a stage-based approach to organizing interface evaluation methods may be an oversimplification imposed for practical purposes. The parameters of most interface evaluation methods can be modified to generate insight into usability and utility at multiple—or, for several interface evaluation methods, at all—stages of UCD. For example, the card sorting method recommended generally for evaluating the navigational menu structure of websites (e.g., [43]) and specifically for organizing symbolized map features into a logical structure (e.g., [44]) can be used both to generate the structure (i.e., during early stages of design) as well as to evaluate an existing structure (i.e., during the middle to late stages of design). Similarly, the focus group method commonly is used for interface evaluation during system deployment to get subjective reactions to the application from target users (e.g., [45,46,47]), but also can be used successfully in certain interface design contexts as the initial needs assessment study.
We do not suggest that interface evaluation methods are interchangeable and can be applied arbitrarily during design and development; each method exhibits a nuanced set of advantages and limitations that make the method more or less appropriate for a particular interface design and development context. Bowman et al. [19] suggest that designers and developers pose six questions to themselves prior to selecting an interface evaluation method, with the current stage in the UCD process being only one consideration: (1) What are the goals of the interface evaluation method? (2) When should the interface evaluation method be used? (i.e., a stage-based approach) (3) In what situations is the interface evaluation method useful? (4) What are the costs of using the interface evaluation method? (5) What are the benefits of using the interface evaluation method?; and (6) How are the results of the interface evaluation method used to improve the interface?
One aspect of the interface evaluation method that is not included explicitly in Bowman’s et al. [19] set of considerations are the evaluators themselves, or the source of the input and feedback regarding the interactive map’s usability and utility [48]. As described above, Nielsen [3] introduced an initial distinction among interface evaluations completed by design experts (e.g., guidelines/heuristic analysis), the project team themselves (e.g., competitive analysis), and target users (e.g., empirical testing for formative and summative evaluation). The distinction in evaluator among experts, the project team, and/or target users is maintained in several UCD processes specific to interactive maps (e.g., [6,17,18,19,36]).
In the context of UCD, we argue that the evaluator is the cardinal characteristic of an interface evaluation method, as interface design insights drawn from experts or theory only should be used to supplement and interpret feedback from the target users. Thus, we propose that interface evaluation methods can be organized into three broad categories discriminated by evaluator:
(1)
Expert-based methods solicit input and feedback about an interactive map from consultants with training and experience in interface design and evaluation. It is important that the expert is a person from outside the project team, as it is necessary that he or she has little or no prior knowledge about the interface under evaluation in order to provide a fresh and unbiased perspective.
(2)
Theory-based methods require the designers and developers to evaluate the interface themselves. To apply some degree of rigor in theory-based evaluations, designers and developers evaluate their interface designs using theoretical frameworks established through scientific research.
(3)
User-based methods solicit input and feedback about an interface from a representative set of target users, and are essential to effective UCD. However, user-based methods can be prohibitively costly in terms of time, money, and participant access. To circumvent this issue, Nielson [4] recommends a discount approach to user-based interface evaluation, recruiting only a small number of participants (3–5 target users) for each evaluation, with reliability maintained by triangulating insights across multiple user→utility→usability loops. Buttenfield [10] describes the administration of multiple, discount empirical evaluations during UCD as the convergent methods paradigm.
Table 2 enumerates interface evaluation methods commonly drawn from each of our three evaluator-based categories. Table 2 also lists related methods and provides a summary of the method’s relative pros and cons, addressing Bowman et al.’s [19] six questions where possible. Finally, Table 2 includes a recommended reference for each listed interface evaluation method that provides additional details and an empirical example about the given method when applied in cartography, GIScience, or visual analytics. It is important to note that several methods can be classified as expert-based, theory-based, or user-based, depending on the experimental parameters of the administered evaluation; our use below of the think aloud study as an expert-based method is one such example.
Table 2. Interface Evaluation Methods Classified by Evaluator. Interface evaluation methods can be organized into three broad categories, discriminated according to the evaluator completing the critique on the interactive map: (1) expert-based methods; (2) theory-based methods, and (3) user-based methods. A convergent approach using methods from each category—but with an emphasis on user-based methods—is recommended to allow for discount interface evaluation throughout design and development.
MethodRelatedGood When…Poor When…Reference
Expert-based Methods
guidelines & heuristic evaluation
  • rules of thumb
  • input/feedback is needed quickly
  • only a small set of experts are available
  • used for several rounds of expert evaluation
  • designers/developers are interested in uncovering a broad range of interface issues
  • expert consultants are unavailable or expensive
  • the experts are part of the project team
  • targeting a specific kind of interface problem
  • one or more of the heuristics is not relevant to the goals of interface evaluation
  • there is excessive subjectivity in interpreting the heuristics
Hix et al. [36]
conformity assessment
  • feature inspection
  • consistency inspection
  • standards inspection
  • guideline checklist
  • there are multiple components of an interface requiring the same look/feel
  • different teams of designers are working on different components of the application
  • there are established design standards and conventions
  • a work domain analysis has been completed
  • the evaluation goal is to brainstorm potential usability issues rather than ensure the interface meets particular requirements
  • the project consists of only several people working together closely
  • there is little or no precedent on how a novel interface should look and behave
Kostelnick et al. [49]
cognitive walkthroughs
  • pluralistic walkthroughs
  • prototyping
  • storyboarding
  • Wizard of Oz
  • the characteristics/behaviors of the targeted end users are well understood
  • the expert has a great deal of experience working with users
  • there is not enough time to study users firsthand
  • the tasks included in the walkthrough represent real-world work objectives
  • multiple steps must be completed in order to use the interface
  • only paper mockups are available
  • experts are not familiar with the user group
  • the tasks are ill-defined, open-ended, or have multiple solutions
  • the research design is not informed by a study with users
Richards & Egenhofer [50]
Theory-based Methods
scenario-based design
  • personas
  • use case scenarios
  • scenarios of use
  • context of usetheatre
  • a work domain analysis cannot be completed due to limited resources or poor user accessibility
  • actual use scenarios are well known or validated through user studies
  • the interface needs to support a diverse set of users or objectives
  • expert- or user-based studies relying on tasks are conducted at later stages in design/development
  • the project team is large
  • little is known about the users
  • the scenarios are not validated with user-based studies
  • the scenarios are overly simplistic or include only a subset of the complete set of potential users or objectives
  • an interface is in the final stages of development
MacEachren et al. [21]
secondary sources
  • content analysis
  • competitive analysis
  • the designers/developers know little about the application domain
  • a user-based work domain analysis cannot be completed
  • at the formative stage of design and development
  • there are a large number of competing applications that implement similar functionality
  • the interface is designed to support a wide variety of application domains
  • the interface is the first of its kind and has few extant parallels for comparison
  • a robust work domain analysis already was completed
  • at the final stages of design and development
Roth et al. [51]
automated evaluation
  • unmoderated user-based methods
  • adaptive interfaces
  • automated interaction logs
  • the goal is to improve and stabilize source code
  • long-term interface support is needed after deployment
  • the fully-featured interface serves a large user community
  • resources are limited to complete multiple rounds of user-based studies
  • the interface is unique or novel
  • the usability measures for a specific type of application are poorly established
  • the interface is simple and includes only several features
Stanney et al. [52]
User-based Methods
participant observation
  • ethnographies
  • field observation
  • MILCs
  • journal/diary sessions
  • screenshot captures
  • interaction logs
  • evaluators have excellent access to users
  • evaluators want to build a strong connection with a particular set of users
  • information is needed about how users currently work
  • the project is large with design/development spanning multiple years
  • the interface or a previous version of the interface already is in use
  • access to users is limited
  • when users are diverse in their characteristics or application domain
  • users are dispersed geographically
  • feedback is needed quickly
  • the interface is simple or supports few tasks
Robinson et al. [12]
surveys
  • questionnaires
  • entry/exit surveys
  • blind voting
  • cognitive workload assessment
  • input is required from a large number of diverse users
  • characteristics of the targeted audience are not fully knownthe investigators cannot be present physically to administer the evaluation (i.e., administered online)
  • the participants have very little time to provide feedback
  • progress needs to be tracked across multiple versions of the interface
  • important design decisions are based solely upon the results
  • the investigators are unfamiliar with the user tasks or expectations and therefore do not know what questions to ask
  • access to end users is limited
  • users are asked to recall experiences or usage strategies from a significant amount of time prior to taking the survey
Robinson et al. [ 26]
interviews
  • structured interviews
  • semi-structured interviewsuns
  • tructured interviews
  • contextual inquiry
  • the user needs and expectations are poorly known
  • the software supports a small number of highly-specialized users or a small set of user profiles
  • transitioning an interactive map to a new application domain
  • the participants are not representative of the target users
  • the user group is diverse
  • investigators have limited time to perform the evaluation and analyze the results
Slocum et al. [ 11]
focus groups
  • supportive evaluation
  • workshops
  • Delphi
  • e-Delphi
  • the user needs and expectations are poorly known
  • investigators have access to an intermediate number of users and stakeholders (more than required for interviews, but less than required for surveys)
  • the focus of summative evaluation is user satisfaction
  • the investigators do not have time to complete interviews
  • access to users is limited
  • users are diverse in their characteristics or application domain
  • users are dispersed geographically
  • feedback is needed quickly
  • the interface is simple or supports few tasks
Kessler et al. [47]
card sorting
  • Q methodology
  • concept mapping
  • affinity diagramming
  • brainstorming
  • there are a large set of functions included in the interface (between 30-200) or these functions include a large set of parameters
  • the optimal categorization or structure is not currently known
  • an existing categorization resulted in usability issues and needs to be revised
  • the interface requires a large amount of navigation among multiple pages or menus
  • the set of items is small (less than 30) or extremely large (200+)
  • the goal is to refine a single feature in the interface
  • users can customize the layout/organization of the interface
Roth et al. [44]
talk aloud/think aloud studies
  • verbal protocol analysis
  • co-discovery study
  • evaluators are interested in identifying a broad range of usability issues feedback is required quickly on only the most important problems
  • project resources are limited
  • the interface is flexible, supporting multiple ways to complete the same objective
  • when experts can simulate the workflows of target users (an expert-based variation)
  • the tasks the interface should support are poorly known
  • the participants are not representative of the target audience
  • each task requires a large amount of time to complete
  • evaluators are more interested in utility than usability
  • participants are already familiar with the interface
Roth & Harrower [23]
interaction studies
  • performance measurement
  • controlled experiments
  • the project spans multiple years and includes iterative rounds of interaction studies
  • the kind of interface evaluated has an established optimal score in the applied performance measures
  • evaluators are interested both in expanding the understanding of interactive cartography broadly as well as improving the cartographic interface specifically
  • user objectives are not known
  • time and resources are lacking to collect and analyze the copious interaction logs
  • the performance measures poorly support the evaluation goals
  • evaluators are interested in capturing subjective satisfaction
Edsall [53]

3. Methods: User-Centered Design of GeoVISTA CrimeViz

3.1. Case Study: GeoVISTA CrimeViz

We leveraged the above background review to inform the UCD of GeoVISTA CrimeViz, an interactive and web-based mapping application that supports spatiotemporal visual analytics of criminal activity (http://www.geovista.psu.edu/CrimeViz/). Visual analytics describes the combination of visualization and computation to support sophisticated analytical reasoning about voluminous and multifaceted datasets [54,55]. The design of useful and usable interfaces is essential to visual analytics, as it is the interface—map-based or otherwise—that serves as the link between the analyst and the computer during visual exploration and analysis.
A clear need exists within law enforcement and public safety for interactive maps supporting visual analytics, as the primary function of crime analysis is identification of structure and deviation in complex, spatiotemporal information [56]. Crime analysts simply call the hypotheses generated from visual exploration and analysis by a different name: hunches. When such hunches are informed by spatiotemporal crime information and derived from sophisticated analytical reasoning, they can be leveraged to make effective policing decisions [57]. However, when these hunches are not based on information or are poorly thought-through, they may lead to suboptimal or potentially dangerous policing decisions. Unfortunately, many small-to-intermediate sized municipal law enforcement agencies lack adequate tools and training to make sense of their crime information in space and time [58]. Thus, spatiotemporal crime analysis often is limited to the generation of one-off, non-interactive maps showing crime incidents within the past 7-to-30 days [59].
The GeoVISTA CrimeViz concept originated as a classroom exercise for learning animated and interactive web mapping in an advanced course on dynamic cartographic representation. The exercise explained how to load and map a point dataset atop basemap tiles using the Google Maps API and then to enable the basic “slippy” interactivity typical of Google Maps mashups. The exercise also provided example code for filtering the map by attribute and temporal facets in the dataset using checkboxes. The example leveraged a publicly available data feed of crime incidents in Washington, DC, USA, resulting in the CrimeViz name. Figure 4 provides a screenshot of the classroom example.
Following release of the exercise and prototype (see [60]), we collaborated with the Harrisburg Bureau of Police to reconfigure and expand the GeoVISTA CrimeViz concept to meet their crime analysis needs. The Harrisburg Bureau of Police is an internationally accredited law enforcement agency serving a municipal population of approximately 50,000 citizens. Harrisburg (USA), Pennsylvania’s state capital, is the largest city within the Harrisburg-Carlisle Metropolitan Statistical Area, which covers a population of approximately 550,000 people; the workday population within the Harrisburg city limits is estimated at approximately 125,000. Harrisburg experiences a relatively large number of crime incidents and ordnance violations within the city given its population, ranging between 10,000–15,000 incidents annually during 2006–2010. The Harrisburg Bureau of Police employs over 200 sworn and civilian personnel, but did not have a staffed crime analyst or geospatial technician at the time of initial GeoVISTA CrimeViz design and development.
Figure 4. The initial CrimeViz classroom exercise. GeoVISTA CrimeViz grew out of a classroom exercise on interactive and web-based mapping for an advanced course on dynamic cartographic representation. The exercise prototype maps a publicly available data feed of crime incidents in Washington, D.C.
Ijgi 04 00262 g004

3.2. User-Centered Design Process for GeoVISTA CrimeViz

We followed an iterative UCD process for GeoVISTA CrimeViz, directly drawing upon the existing frameworks and processes reviewed above. The broadest goal of our user-centered approach was to resolve the aforementioned usability-utility tradeoff in the design and development of GeoVISTA CrimeViz, ensuring it could support sophisticated visual exploration and analysis of criminal activity in Harrisburg, while remaining approachable to a non-technical target user group. Following the recommendations from Nielsen [3] and Buttenfield [10] introduced above, the evaluations were administered in a discount manner with purposeful overlap in feedback to allow for triangulation of insights across studies. Our UCD process included four formal evaluations of GeoVISTA CrimeViz with target users or design experts. The first three evaluations were formative, completed during design and development to revise to the GeoVISTA CrimeViz conceptual design and prototypes. Each of the three formative evaluations represents a loop through the user→utility→usability cycle; Figure 3 directly relates our UCD approach to the Figure 1 user→utility→usability loop and the previously reviewed Robinson et al. [12] UCD process. The fourth evaluation was summative, designed to determine if the usability and utility goals of GeoVISTA CrimeViz were met. Each evaluation is described below:
(1)
Needs Assessment Interviews: Our UCD process began with a needs assessment study, following the above recommendations of Nielsen [3,4], Gabbard, Hix, and colleagues [18,19,36] and Robinson and colleagues [12]. Rather than focusing specifically upon the Harrisburg Bureau of Police, we performed a comparative needs assessment, enrolling additional law enforcement agencies considered peers of the Harrisburg Bureau of Police. The comparative approach also allowed us to perform a structured follow-up analysis of current trends and unmet needs in spatiotemporal crime analysis broadly (see [61]). In total, nine personnel from seven law enforcement agencies participated in a 60-minute interview to identify key unmet needs in spatiotemporal crime analysis; two of the nine participants were from the Harrisburg Bureau of Police. We selected the user-based interview method for the needs assessment study because the user needs and expectations were poorly known at the time and the interactive map was designed to support a small number of user profiles (see Table 2 above). The needs assessment interviews also served as a discount competitive analysis following Nielsen [3,4], allowing participants to remark on alternative tools they have used or would like to use. This input in turn led to the formalization of requirements and an alpha release of GeoVISTA CrimeViz for initial use by the Harrisburg Bureau of Police.
(2)
Expert-based Think Aloud Study: We then conducted an expert-based think aloud study on the alpha release with design experts outside of the project team, following the recommendations by Nielsen [3,4], Gabbard, Hix, and colleagues [18,19,36], and Slocum and colleagues [17] reviewed above. We selected the think aloud study, which requires participants to explain their reasoning as they use an interface, in order to quickly identify a broad range of usability and utility issues with GeoVISTA CrimeViz during the highly flexible activity of visual exploration and analysis (Table 2). Five design experts were asked to verbalize their thought process as they completed a set of benchmark tasks with the alpha release of GeoVISTA CrimeViz. We included twelve benchmark tasks in the think aloud study, with the tasks balanced according to the three dimensions of the aforementioned Andrienko et al. [29] operational task typology (Table 3). Each think aloud session closed with an open-ended debriefing session to allow the participant to expound upon his or her experience using the application, with the complete evaluation lasting 60 minutes total. We logged critical incidents (e.g., severe errors, ideas for additional functionality, major breakthroughs) that occurred while using the alpha release and revised these utility and usability issues in a beta release.
(3)
Formative Online Survey: To gather user feedback on the beta release, we designed an online survey comprising a series of discrete scale ratings (e.g., “on a scale of 1–7...”) and unstructured form fill-in free response questions. We selected the online survey method at this stage in the UCD process because we were unable to be physically present at the Harrisburg Bureau of Police to administer the evaluation and the surveyed personnel had limited time to provide feedback (Table 2). Survey questions were balanced to measure the components of usability (e.g., the learnability, efficiency, memorability, error rates/severity, and subjective satisfaction) and utility (e.g., its effectiveness across use case scenarios, including aspects of the novelty and comprehensiveness of included functionality) summarized above. Ten stakeholders at the Harrisburg Bureau of Police completed the formative usability/utility survey, with the survey designed to take approximately 15 minutes so as not to interfere with the workday of the participating personnel. The feedback led to several additions to the functional requirements and prompted an update to its product identity in the full release of GeoVISTA CrimeViz.
(4)
Summative Online Survey: We administered the online survey a second time several weeks after transitioning the full release to the Harrisburg Bureau of Police. As described above, summative evaluation in the deployment stage of design and development is common in UCD [10], even though it offers only minimal opportunity to make significant revisions to the interface [25]. Our summative evaluation let us determine if revisions to the beta release resulted in a positive improvement to GeoVISTA CrimeViz, as the survey method allows for direct comparison across multiple versions of an interface (Table 2); questions in the summative online survey were unchanged from the formative online survey. The summative evaluation also allowed us to determine if any new issues were introduced during transition of the full release to the Harrisburg Bureau of Police, and important component of Robinson et al.’s [12] debugging stage introduced above. Ten different personnel from the Harrisburg Bureau of Police participated in the summative online survey evaluating the full release of GeoVISTA CrimeViz.
Table 3. The benchmark tasks used in the expert-based think aloud study. We balanced the benchmark tasks included in the think aloud study based on the Andrienko et al. [29] operational task taxonomy in order to span the spectrum of hypothetical visual exploration and analysis tasks supported by GeoVISTA CrimeViz.
Cognitive Operation: Identify Cognitive Operation: Compare
Search Level: Elementary Search Level: Elementary
T1given what? find where? & when?T7given what? & where? find when?
T2given what? & when? find where?T8given when? find what? & where?
T3given where? find what? & when?T9given where? & when? find what?
Search Level: GeneralSearch Level: General
T4given what? & where? find when?T10given what? find where? & when?
T5given when? find what? & where?T11given what? & when? find where?
T6given where? & when? find what?T12given where? find what? & when?
The insight generated from the four formal interface evaluations was supplemented by informal feedback acquired from a rotating set of 6–8 stakeholders at the Harrisburg Bureau of Police. Informal feedback included conference calls held every two-to-four weeks (synchronous, distributed), site visits held every four-to-six months (synchronous, co-located), and use of a collaborative action item list for identifying and tracking bugs and other revision requests (asynchronous, distributed). The suite of formal and informal interface evaluations, and subsequent interface revisions, altogether constitute a multi-dimensional, in-depth, and long-term case study (MILC), which describes a UCD approach wherein evaluators work closely with a small user group over a period of months to evaluate and refine an interface iteratively [62].

4. Results: Evolution of GeoVISTA CrimeViz

4.1. Needs Assessment Interviews

We began UCD of 
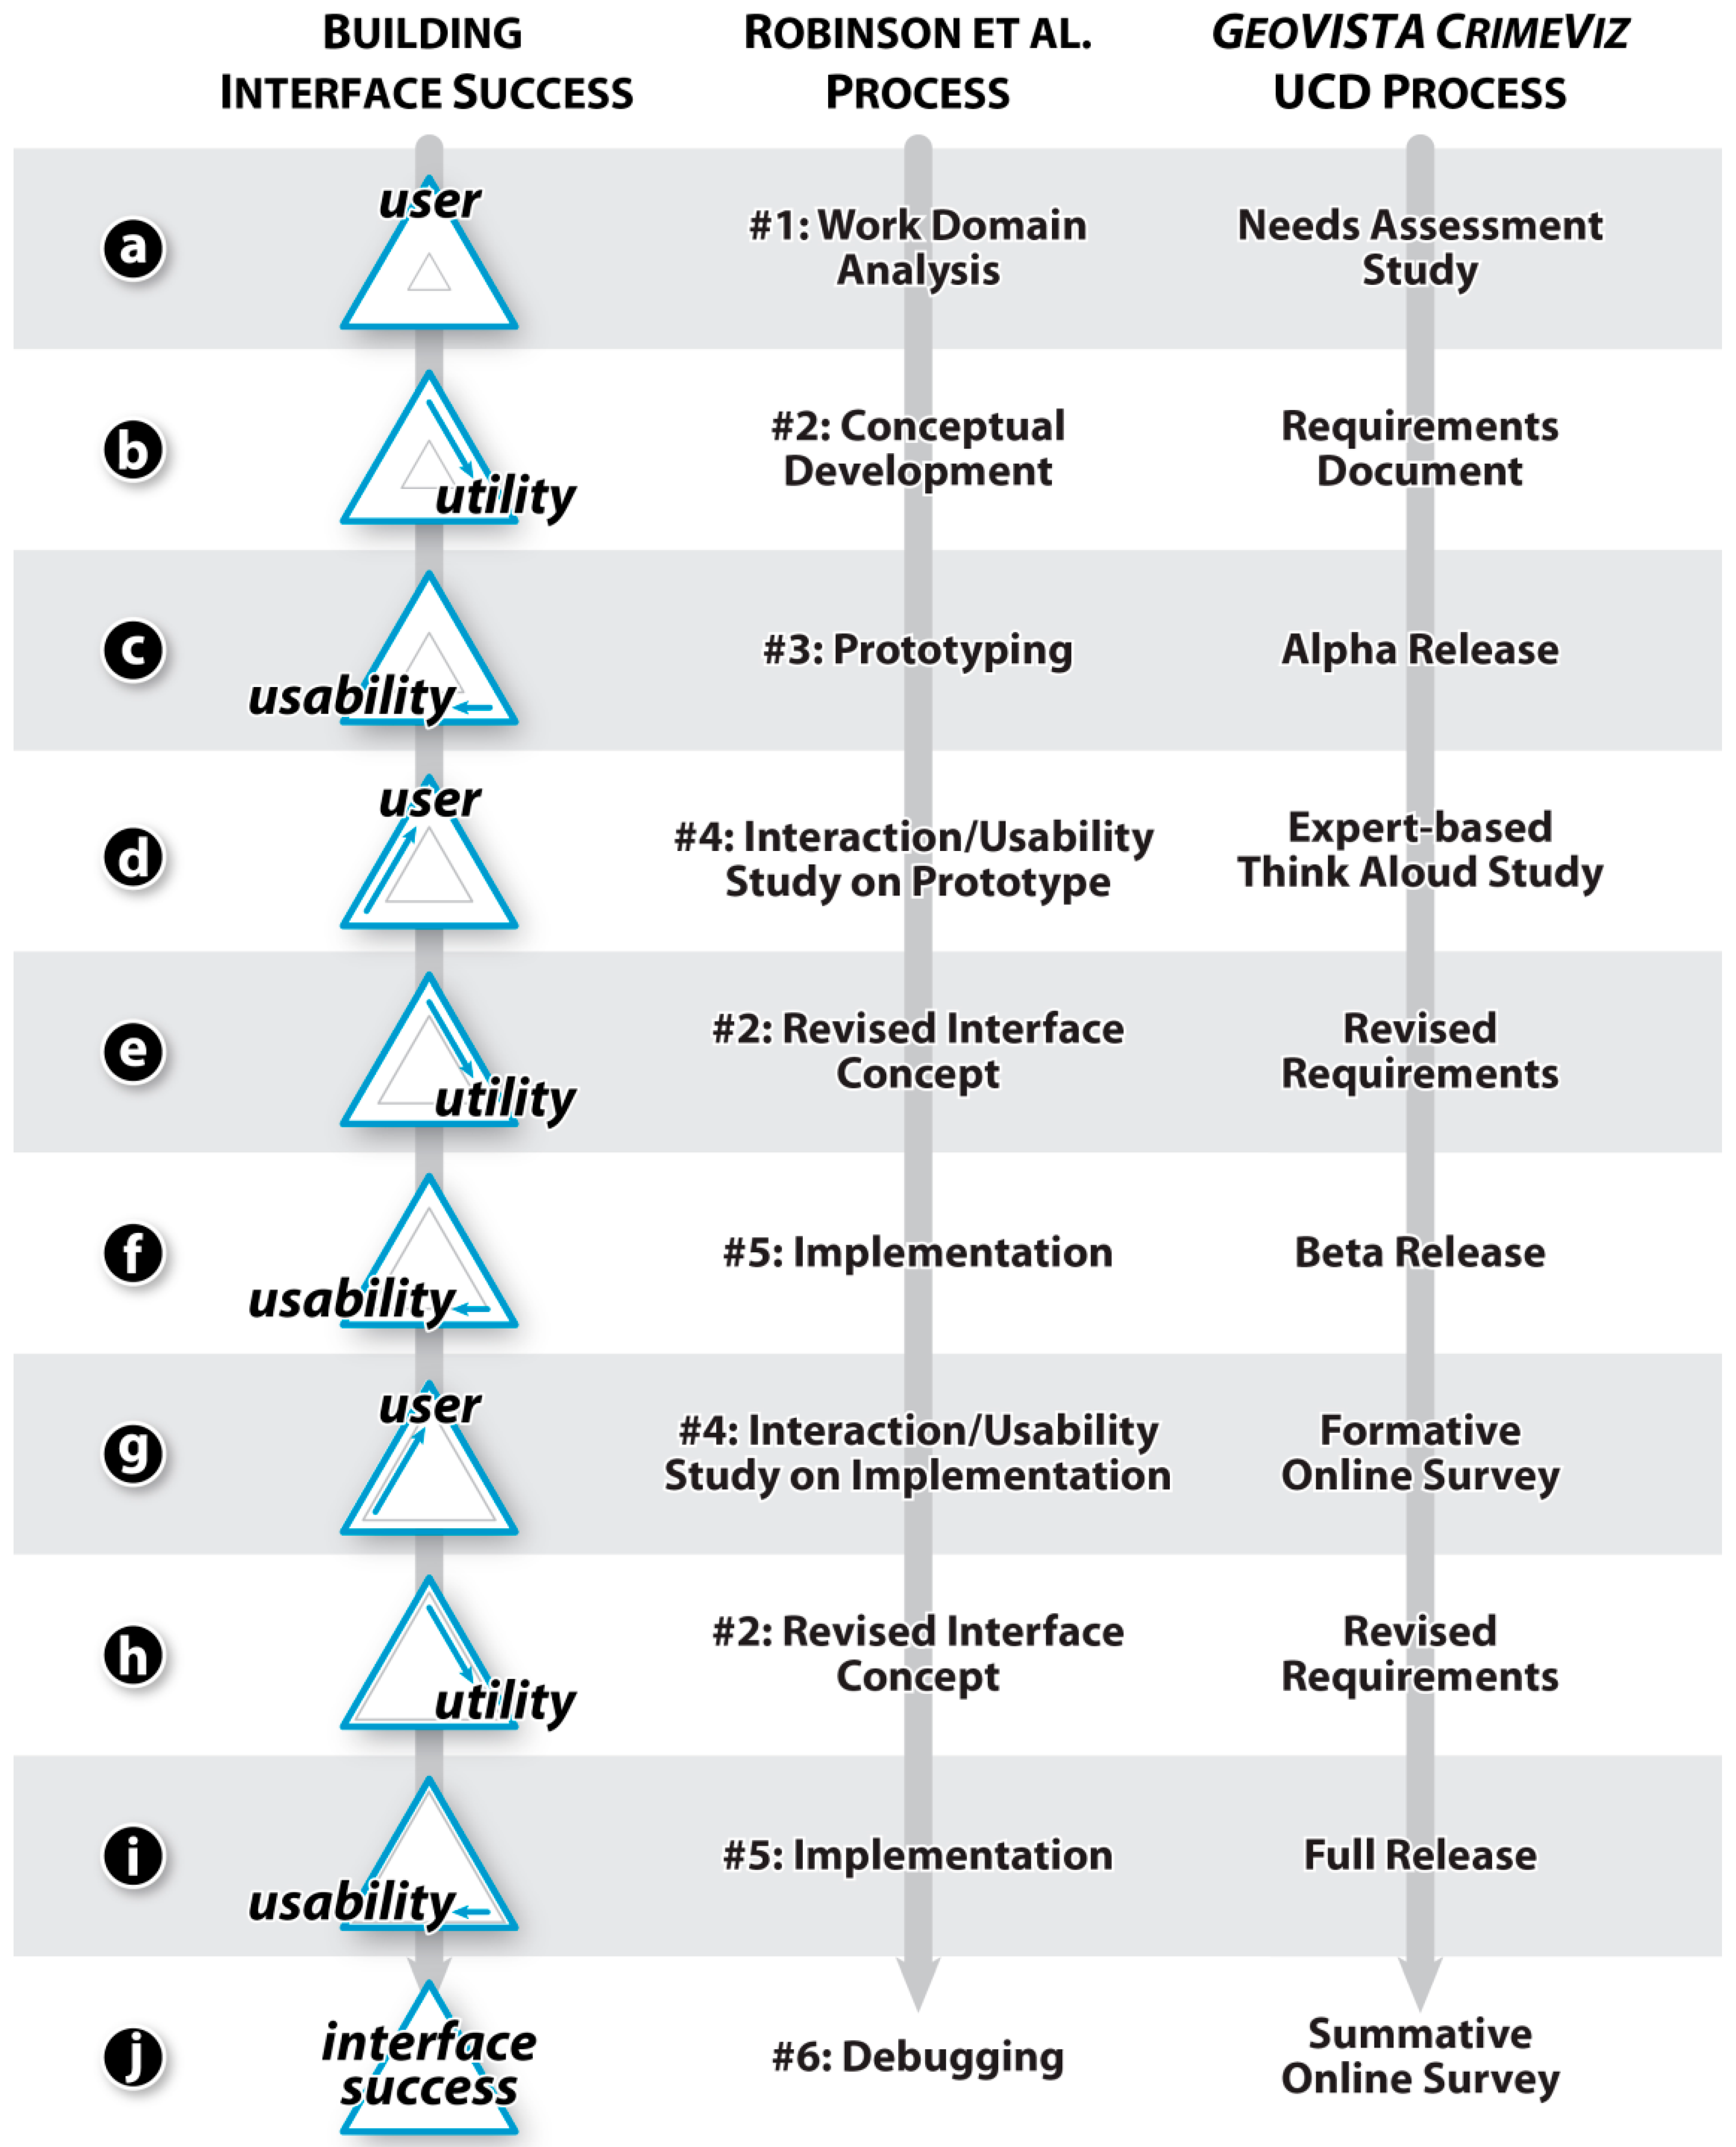
GeoVISTA CrimeViz with a comparative needs assessment study (Figure 3a). Following Nielsen [3,
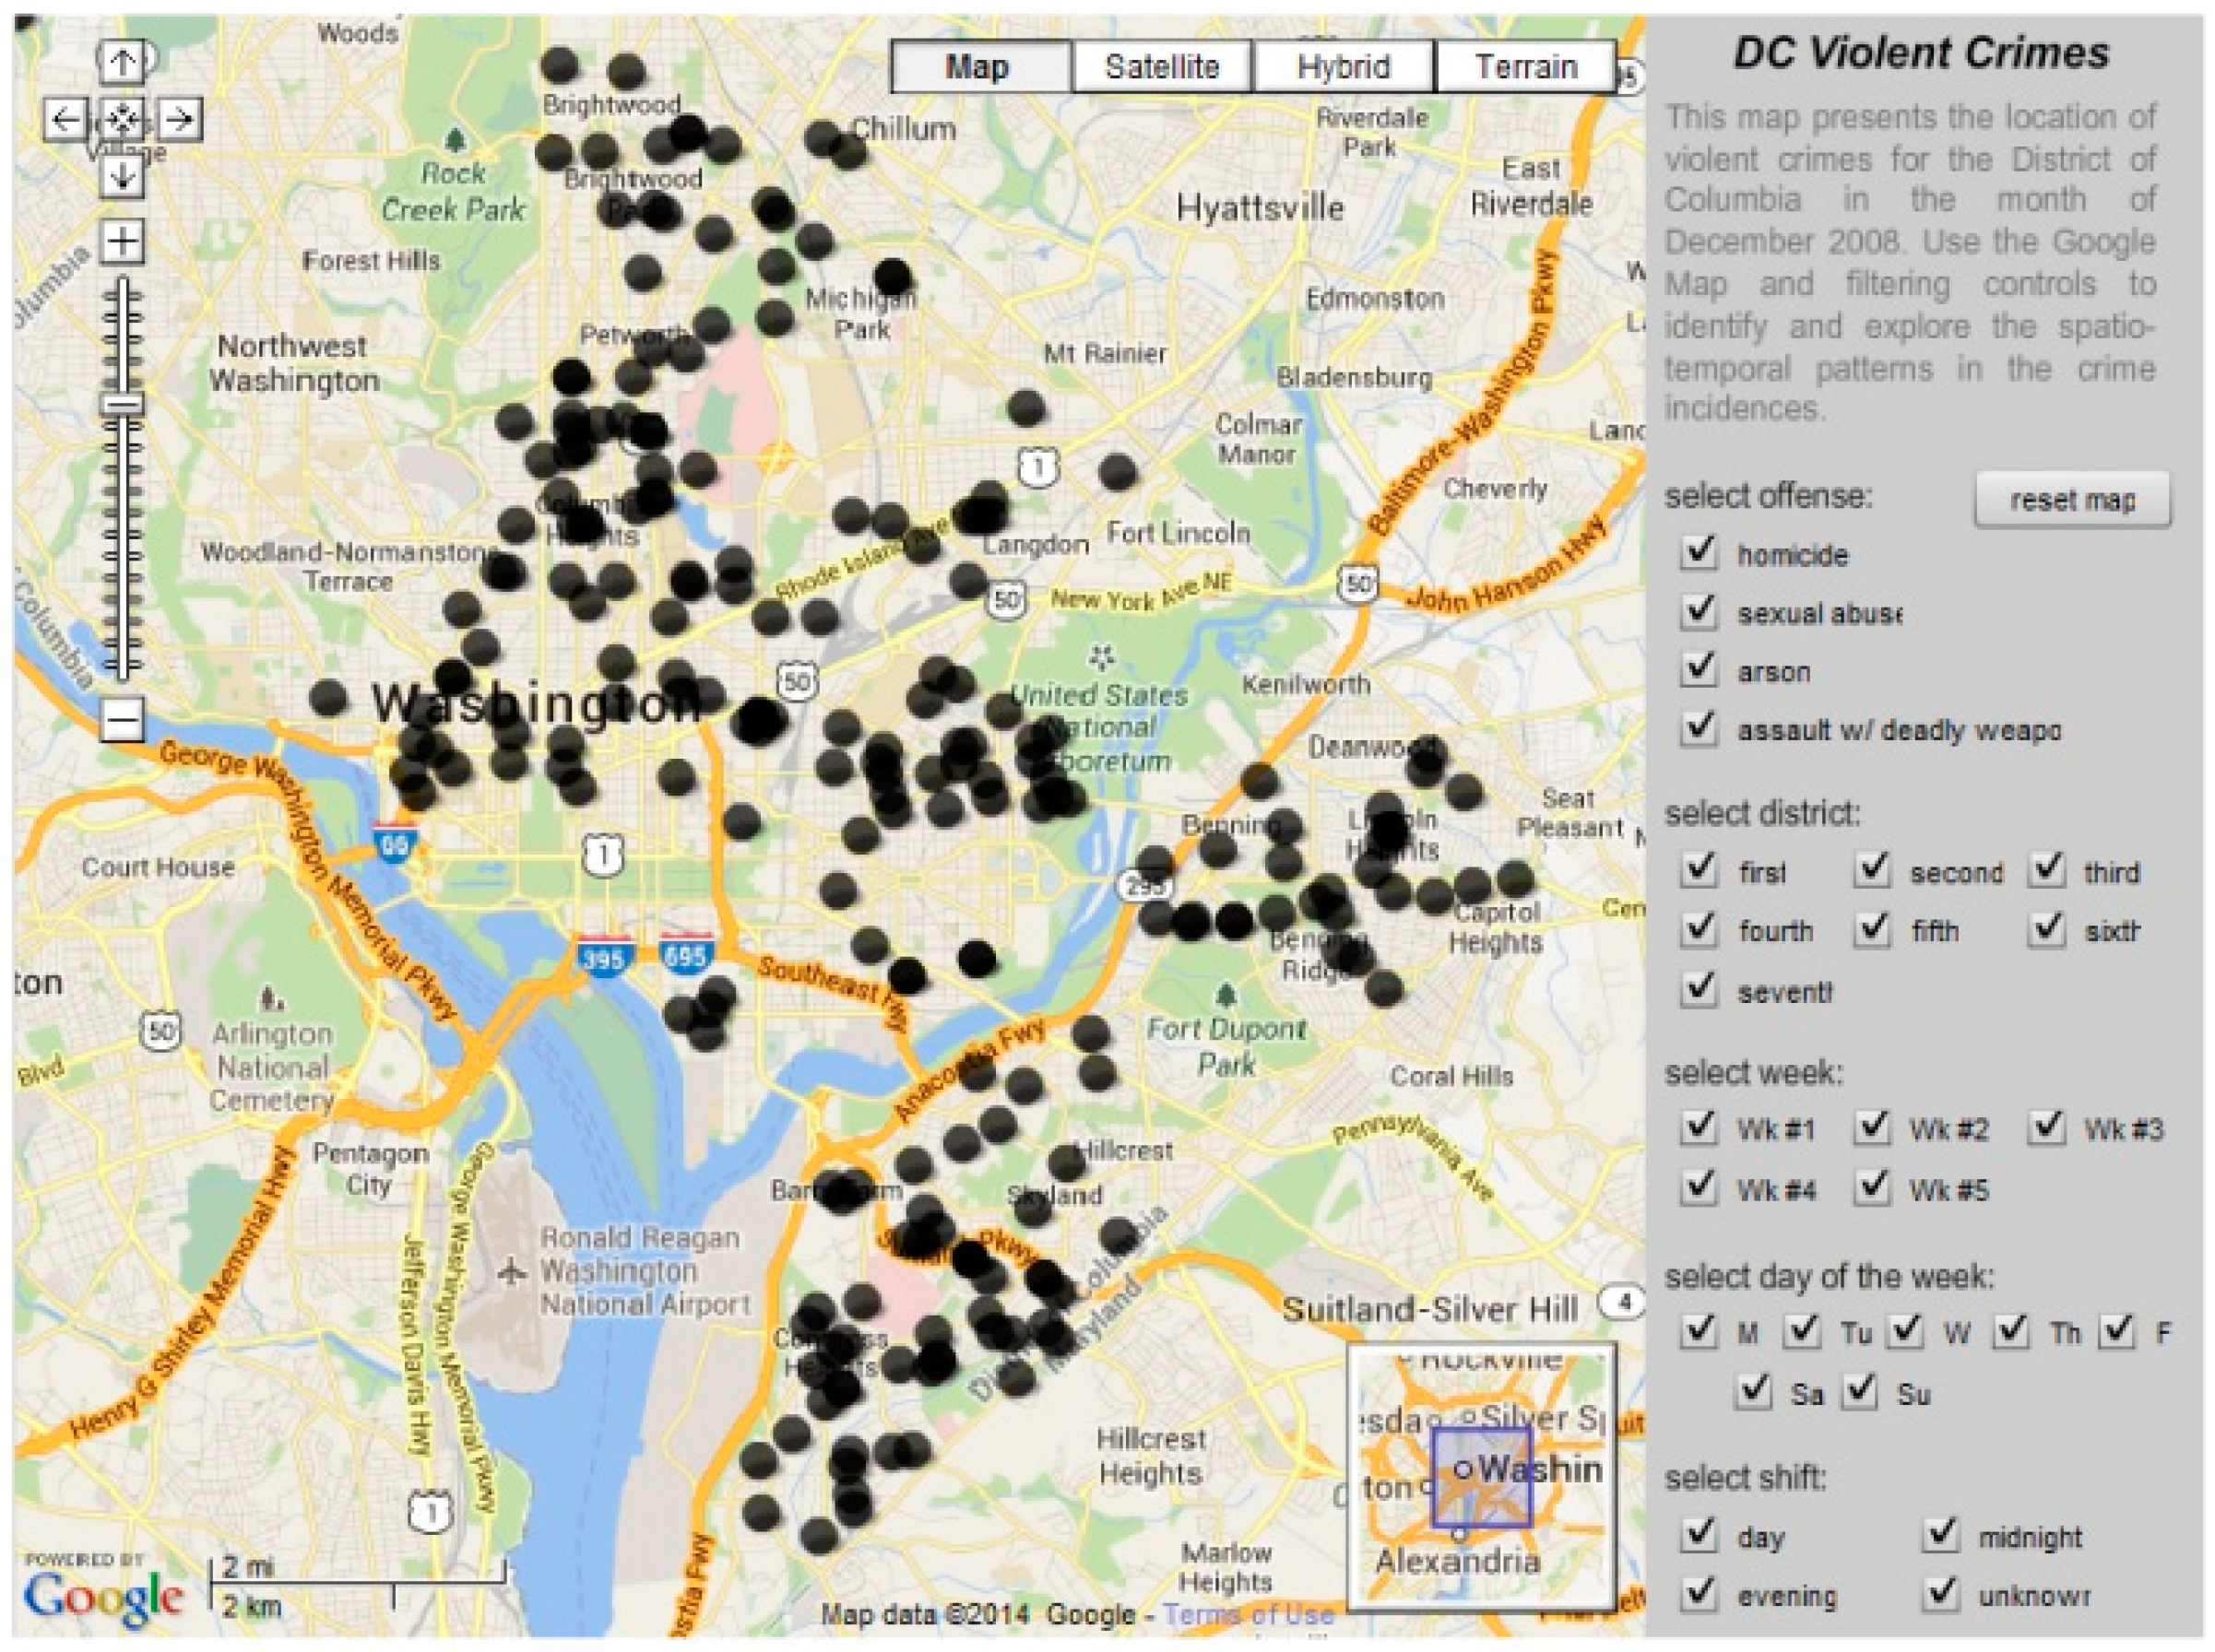
4], the needs assessment interviews allowed us to establish user profiles and use case scenarios, as well as to learn more broadly about the larger context of crime analysis. The pair of interviews with the Harrisburg Bureau of Police led to the formalization of three user profiles that match their divisional hierarchy: investigators (detectives and forensic agents conducting investigations of violent and vice crime), officers (uniformed patrol supporting first response, traffic control, parking enforcement, and animal control), and administrators (service personnel supporting the functions of law enforcement and courtroom proceedings). Compared to other participating law enforcement agencies, personnel at the Harrisburg Bureau of Police had minimal internal training in and expertise with geospatial technologies, regardless of user profile. However, personnel were familiar with common web mapping services, like Google Maps, and were expected to understand basic “slippy map” interactivity, such as panning and zooming. Importantly, we ruled out the general public as a target user group at this stage due to ethical considerations with mapping criminal activity at the address level. As a result, the public releases of GeoVISTA CrimeViz used the public Washington, D.C., data feed to maintain confidentiality of potentially sensitive information (Figure 5 and Figure 6). Releases of GeoVISTA CrimeViz mapping the Harrisburg dataset were password protected to restrict public access.
These user profiles then were matched against five use case scenarios for GeoVISTA CrimeViz common across the seven participating law enforcement agencies: (1) criminal investigative analysis (individual-level analysis of an emerging crime serial and identification of potential suspects); (2) intelligence analysis (individual-level analysis of relationships among crime incidents and criminal offenders to uncover a crime syndicate); (3) strategic crime analysis (aggregate-level spatiotemporal analysis to understand and respond to long-term patterns and trends in criminal activity); (4) tactical crime analysis (aggregate-level spatiotemporal analysis to respond to a recent crime spike); and (5) administrative crime analysis (presentation of spatiotemporal crime patterns and trends to government officials and citizens) (see [63]). Investigators were responsible for criminal investigative analysis, intelligence analysis, and strategic crime analysis, and therefore had the most complex array of spatiotemporal crime analysis needs. Investigators needed to create flexible overview maps spanning the entirety of the crime incident dataset to identify long-term patterns and trends (strategic crime analysis), to filter these overviews by space, time, and attribute to establish serials (criminal investigative analysis), and finally to collect and synthesize details about related crimes to reveal broader crime syndicates (intelligence analysis). Therefore, investigators needed an interface that supported intermittent use (e.g., weekly or monthly, depending on the assignment of new cases) characterized by deep (i.e., multi-hour), highly exploratory spatiotemporal analysis. In contrast, officers primarily were responsible for tactical crime analysis, quickly reviewing simple maps of crime reports from the past several days at the start of their workday in order to gain situational awareness of recent criminal activity. Finally, administrators were responsible for administrative crime analysis, printing summary maps for inclusion in courtroom proceedings and reports upon request.
In addition to formalizing user profiles and use case scenarios, the important first step to knowing the user (Figure 3a), the comparative approach to the needs assessment helped us to understand functional requirements for the extended version of GeoVISTA CrimeViz, setting a baseline for its utility (Figure 3b). A first set of insights regarded the kind and format of spatiotemporal data collected and maintained by the participating law enforcement agencies and the resulting back-end technology needed to index and serve these datasets. Although individual agencies stated they maintain databases on calls for service, field interviews, arrests, or convictions, the overwhelming focus of the discussion was on crime reports describing criminal incidents (which may or may not lead to an arrest). All participating agencies described a core set of information provided in a crime report: a report number identifier, address, date and time, crime type, MO (modus operandi), and a narrative description. Thus, the crime report datasets across agencies included inherent facets for visual exploration and analysis by space (location), time (year, month, day, hour), and attribute (crime type, MO, and narrative).
There were two challenges specific to the crime reports maintained by the Harrisburg Bureau of Police that complicated their mapping. Law enforcement agencies indicate the type of felony or misdemeanor (i.e., crime type) in a crime report using UCR (uniform crime report) codes, a two-level standard that is enforced federally by the U.S. Department of Justice to allow for comparison of criminal activity across municipalities and states. The Harrisburg Bureau of Police extended the federal UCR coding scheme to indicate different MOs by crime type, to include city ordinance violations, and to identify non-criminal activity, such as accidents. Thus, the first requirement for the extended GeoVISTA CrimeViz was to instantiate a spatial database supporting this nearly 500-code schema; this back-end solution was supported by Apache and PostGIS/PostGreSQL. Further, while larger law enforcement agencies maintain an address look-up to georeference each crime incident to geographic coordinates, the Harrisburg Bureau of Police did not geocode their crime reports into a spatial reference system. Thus, a second requirement for GeoVISTA CrimeViz was to develop a server-side script for spatially referencing new crime reports as they were added to the PostGIS/PostGreSQL database; this solution leveraged the Yahoo! geocoding service, using a Cron script to import and geocode new crime reports every 24 h.
Figure 5. 
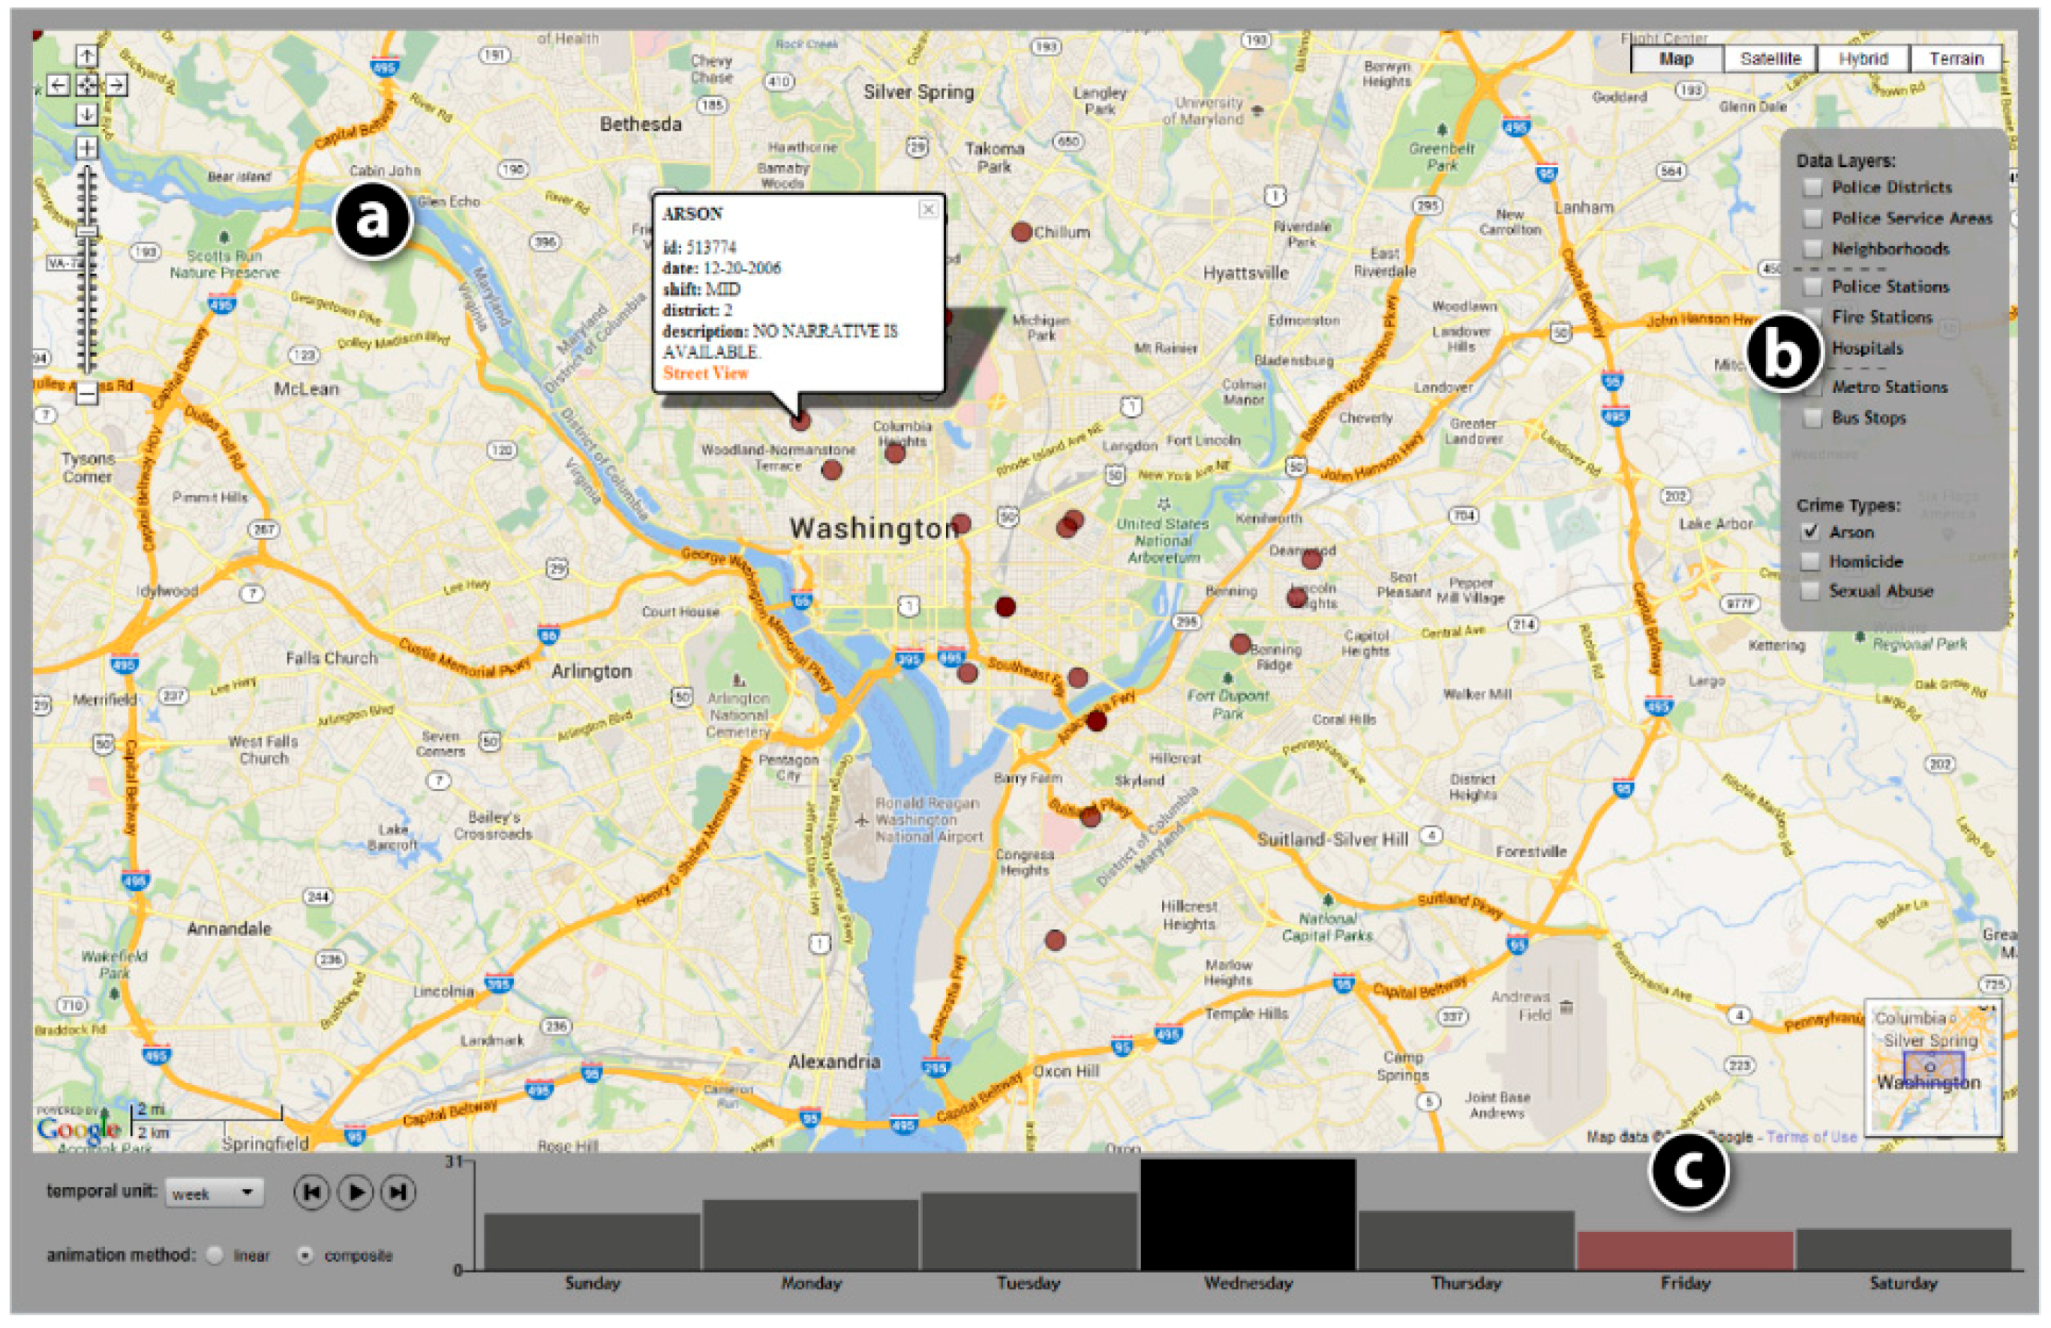
The alpha release of GeoVISTA CrimeViz. The needs assessment interviews allowed us to enumerate an initial set of functional requirements, which we organized into three interface panels in the alpha release: (a) the Map Panel (spatial exploration and analysis); (b) the Data Panel (attribute exploration and analysis), and (c) the Temporal Panel (temporal exploration and analysis). The figure has reexpressed the map sequence to show a composite week by day-of-the-week, revealing an intriguing spike in arson crimes on Wednesdays in Washington, D.C.
Ijgi 04 00262 g005
Figure 6. 
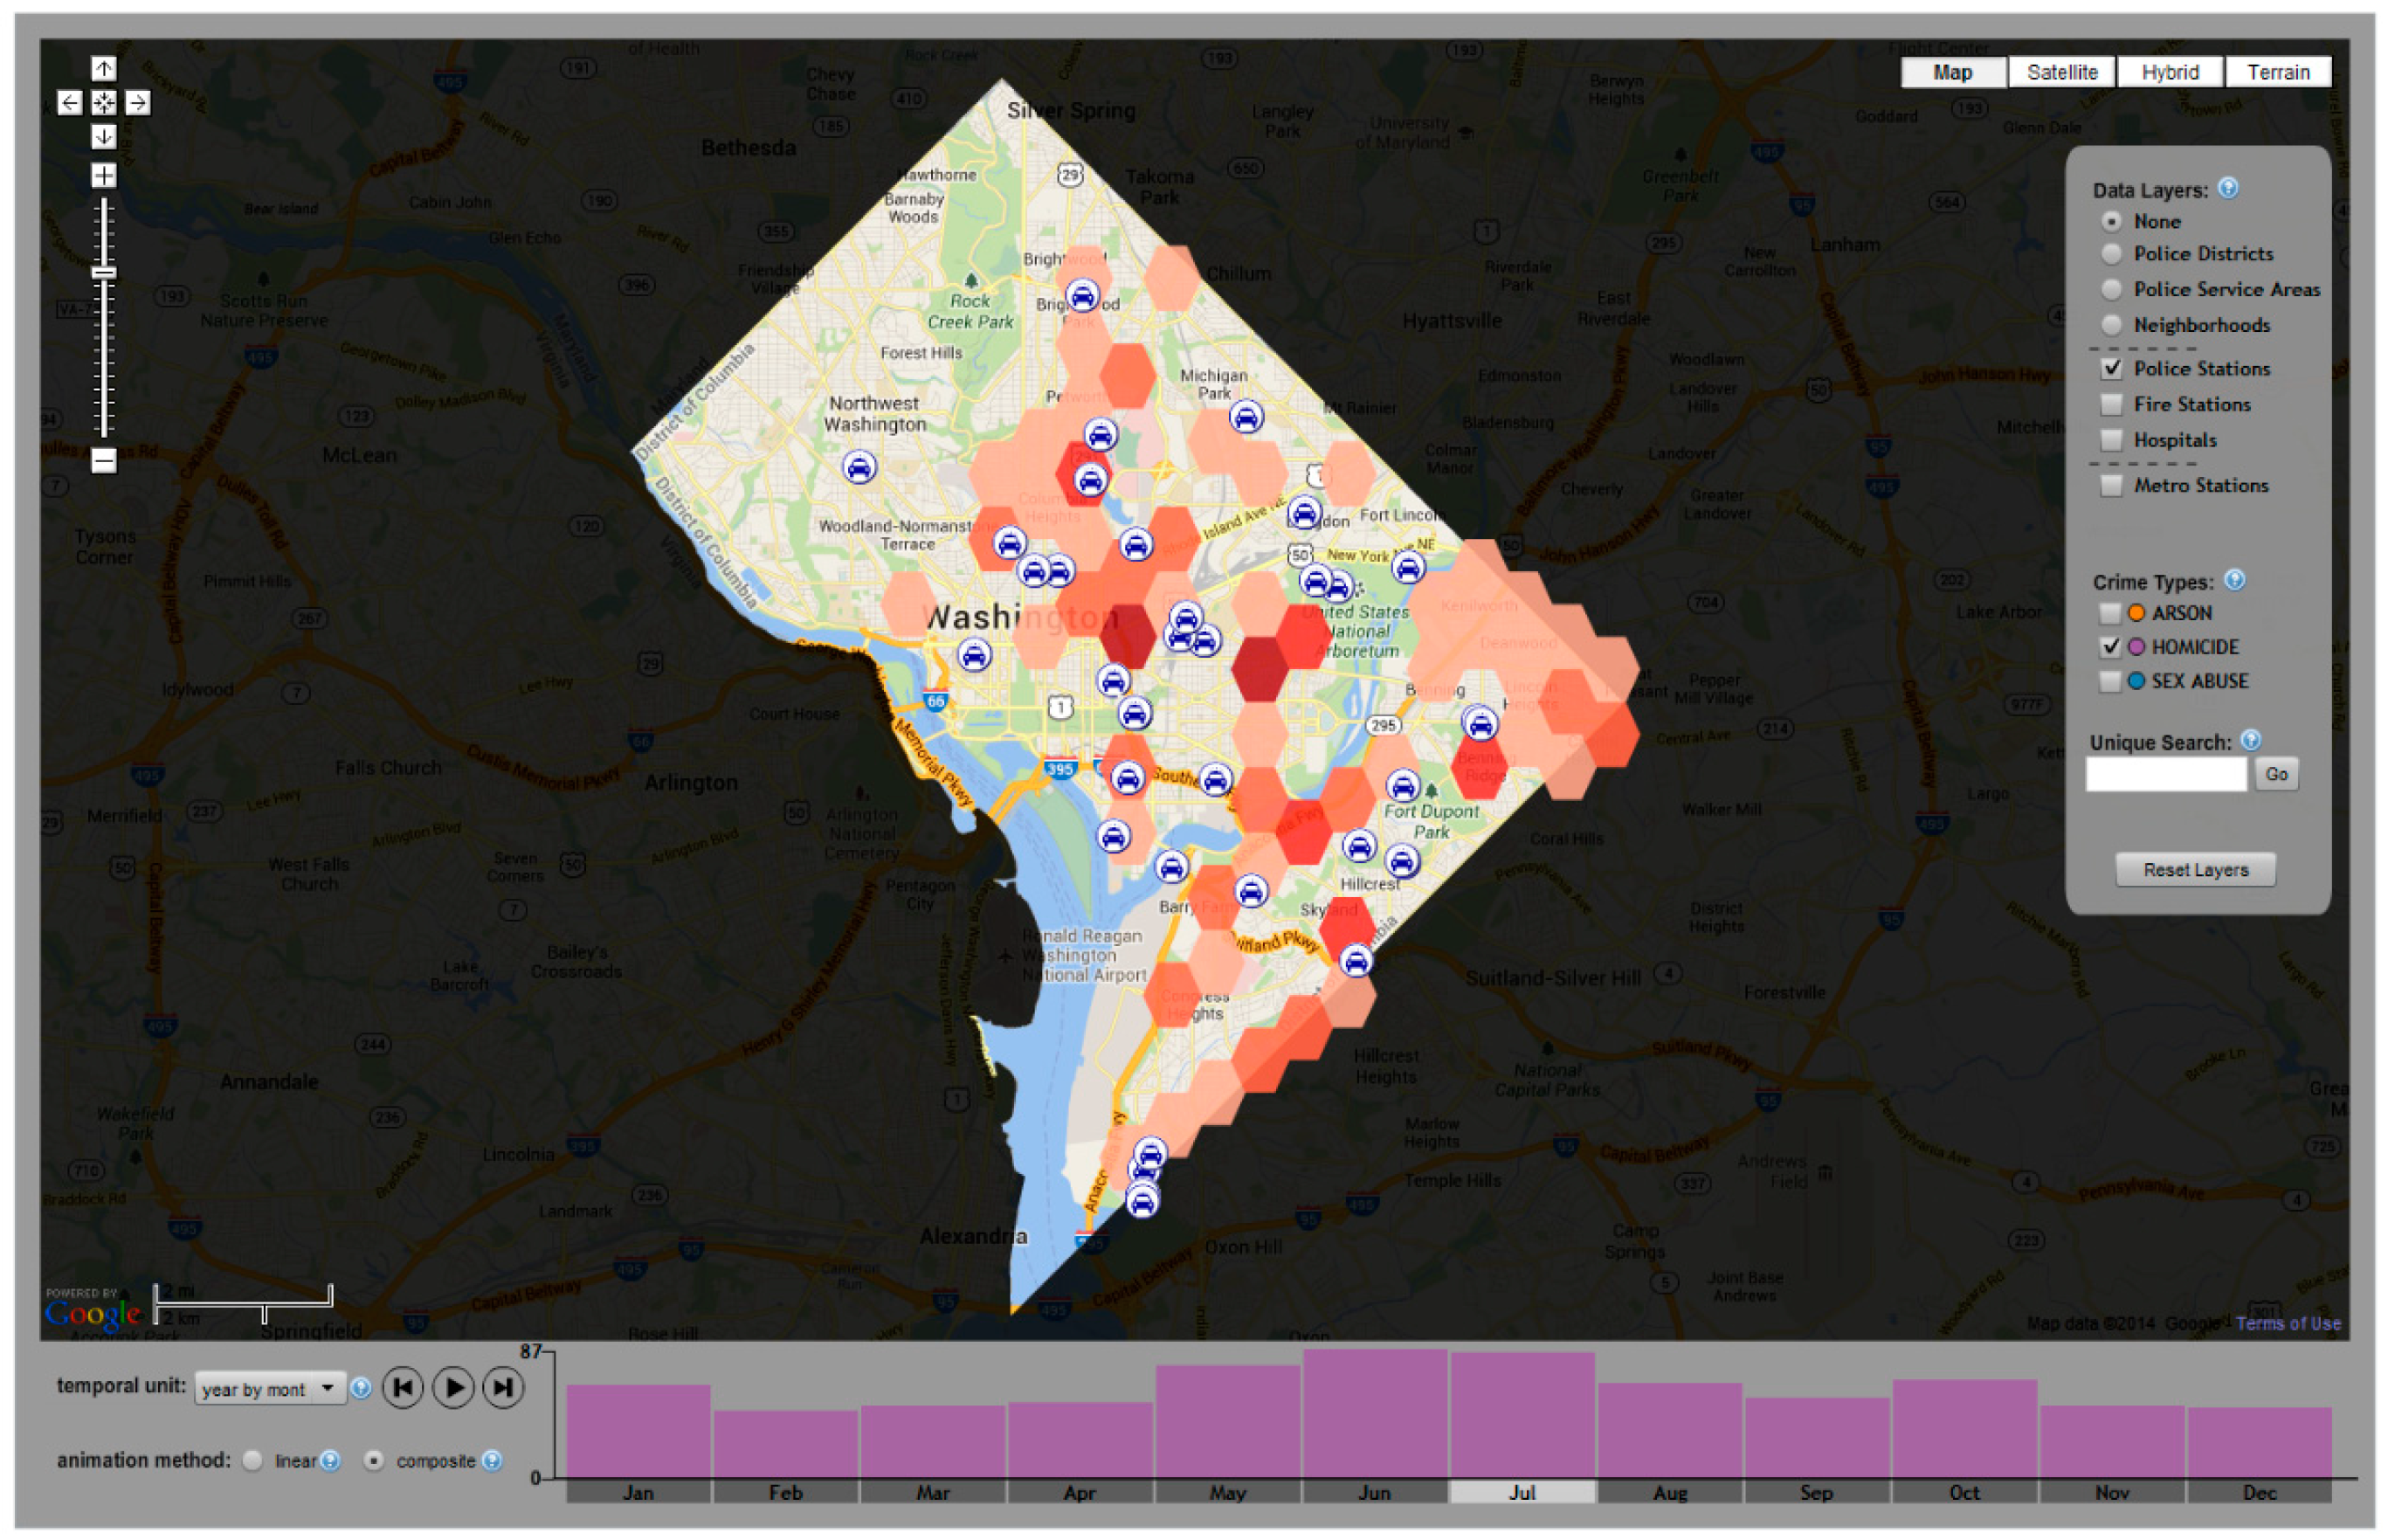
The beta release of GeoVISTA CrimeViz. The expert-based think aloud study identified an array of missing functionality and programming bugs, which largely were resolved in the beta release of GeoVISTA CrimeViz. The configuration in the figure illustrates the search feature added in support of elementary level tasks as well as the hexagonal aggregation feature added to generate overview maps in support of general level tasks.
Ijgi 04 00262 g006
In addition to server-side functional requirements, the needs assessment study also generated important insights into the client-side functional requirements of GeoVISTA CrimeViz. Although we did not conduct a formal competitive analysis as recommended by Nielsen [3,4], the comparative approach to the needs assessment allowed us to view demonstrations of interactive maps currently employed by participating law enforcement agencies for visual exploration and analysis of criminal activity. Such map-based applications included ATAC (Automated Tactical Analysis of Crime) [64], Azavea HunchLab/Crime Spike Detector [65], CrimeStat [66], GeoDa [67] and, most commonly, Esri’s ArcGIS. While each of these tools were targeted toward expert use—and thus were not appropriate for the established user profiles in the Harrisburg Bureau of Police context—there were several commonalities in their map and interface designs that directly informed the functional requirements of GeoVISTA CrimeViz.
Regarding the map design requirements, crime reports most commonly were represented using point symbols (i.e., “push pin maps”) colored by crime type or time. Participants completed minimal thematic mapping of aggregated information, with participants from three agencies even voicing a disdain for “hot spot maps” using a kernel density function to present a crime surface. These participants noted that hot spot maps overly smoothed the crime pattern—at times even placing a hotspot in the center of two or more localized spikes—which regularly confused investigators and officers not trained in reading maps. Participants typically included contextual layers to assist with interpretation of the pushpin maps, such as police and fire stations, police districts and grids, schools and hospitals, and emergency evacuation routes. The two participants from the Harrisburg Bureau of Police were particularly excited about the integration of GeoVISTA CrimeViz with Google Street View in order to assist with tactical operations; for this reason, we maintained the Google Maps API as the base code library for client-side development.
Regarding the interface design requirements, use of competing applications emphasized flexible filtering of crime reports. Desktop GIS primarily was applied to extract filtered subsets of the crime report database for subsequent viewing as individual GIS layers. An interactive map with a persistent filtering interface without complex menus was seen by participants as a design improvement, allowing analysts to instantaneously filter by different database facets without needing to work through multiple, nested dialog windows. While participants noted the importance of filtering their crime report databases by crime type and MO (i.e., by attributes), it was common first to filter by date and time, and then to produce temporal sequences based on the filtered parameters for subsequent animation over space and time. Temporal units of analysis included day and week for tactical crime analysis and month and year for strategic crime analysis. Law enforcement agencies other than the Harrisburg Bureau of Police also produced temporal composites to support strategic and administrative crime analysis, in which the frequencies for each individual instance of the finite set of cyclical temporal units were averaged or summed to calculate a single, representative value for each of the cyclical temporal units (e.g., the combined total of all Sunday, Monday, etc., values over a year or the average January, February, etc., value over a 10-year span). Finally, participants used interactive maps to click on specific points of interest and retrieve details from the crime report in support of criminal investigative analysis and intelligence analysis.
Following the needs assessment interviews, we created a formal requirements document outlining functionality for GeoVISTA CrimeViz (Figure 3b). We organized the client-side functional requirements into three categories based on the explicit delineation of space, time, and attribute information in crime reports (Table 4: black requirements). We then revised the prototype used as a classroom exercise to support newly identified functional requirements, resulting in an alpha release of GeoVISTA CrimeViz for internal experimentation by the Harrisburg Bureau of Police (Figure 3c). Interface controls were organized into three interface panels in the partially-functional, alpha prototype:
(1) 
The Map Panel: The central Map Panel provides the interface controls for spatial exploration and analysis of criminal activity (Figure 5a). In the alpha release, the geocoded crime reports were symbolized as point symbols at all cartographic scales. The basemap supported basic “slippy map” interactivity, including panning, zooming, and overlay of different tilesets. Selection of a point symbol activates an information window containing the available information for the associated incident and a link to Google Street View.
(2) 
The Data Panel: The Data Panel provides the interface controls for attribute exploration and analysis of criminal activity (Figure 5b). The Data Panel in the alpha release supported two forms of interactions: a set of checkboxes to overlay the contextual layers identified as important in the needs assessment study and a set of checkboxes to filter by crime type. Figure 5 shows only three filtering options, given our use of the Washington, D.C., data feed for the public version of the alpha prototype. The alpha release did not yet include attribute filtering by the complete UCR schema or by MO, but such functionality was planned at this stage in the UCD process (Table 4).
(3) 
The Temporal Panel: The Temporal Panel provides interface controls for temporal exploration and analysis of criminal activity (Figure 5c). In the alpha release, we implemented an interactive histogram, aggregating the crime report database into a set of mutually exclusive temporal bins, or equivalent intervals of time. As with the point symbols on the map, each histogram bar could be brushed to retrieve details about the crime reports within the given temporal bin. The Map Panel could be animated across the bins, with the histogram doubling as an interactive temporal legend. The alpha release also included a menu to change the temporal unit of analysis to a week, a month, or a year. Finally, a pair of radio buttons was included to toggle between linear and composite temporal sequences.
Table 4. Functional Requirements for GeoVISTA CrimeViz. Requirements derived from the needs assessment are shown in black, with additions from the expert-based think aloud study and formative online survey marked in orange and purple respectively.
RequirementInterface Solution(s)
Server-Side
password protection• password access by user profile
spatial database• schema based on the modified UCR coding used at the Harrisburg Bureau of Police
Cron script• import new crime reports every 24 hours
geocoding script• Yahoo! geocoding service
aggregation script• flexible aggregation of crime reports meeting user-defined criteria to a hexagonal grid
Map Panel (Space)
map design• Google Maps basemap tiles
• individual crime reports symbolized as points at large scales
• crime type for individual points symbolized using a qualitative color scheme
• crime reports aggregated into a hexagonal grid at small scales
• crime reports aggregated into a hexagonal grid at small scalescrime frequency within hexagon aggregates symbolized using a sequential color ramp
• point context layers symbolized using iconic point symbols
• line/polygonal context layers symbolized using a qualitative color scheme
spatial pan• direct manipulation click+drag on map
• direct manipulation ‘reset extent’ control
spatial zoom of map• direct manipulation double-click on map
• direct manipulation ‘+’ and ‘−’ controls
• direct manipulation click on crime report point
• direct manipulation click on hexagon bin
• direct manipulation click on context layer element
overlay• menu selection of basemap type (‘map’, ‘sat’, and ‘terrain’)
retrieve details from map• direct manipulation mouse-over of crime report point
• direct manipulation click of crime report point
• direct manipulation click of ‘Street View’
• direct manipulation mouse-over of hexagon bin
• direct manipulation mouse-over of context layer element
learning and help materials• direction manipulation click of ‘GeoVISTA’ hyperlink
• direct manipulation click of ‘show legend’ button
• direct manipulation click of ‘about’ hyperlink
• direct manipulation click of ‘how to’ hyperlink
• direct manipulation click of ‘in writing’ hyperlink
Data Panel (Attribute)
overlay• menu selection checkboxes for point/line context layers
• menu selection radio buttons for polygonal context layers
• direct manipulation click of ‘reset’ additional context layers buttons
filter crime reports• menu selection by ‘UCR primary’
• menu selection by ‘UCR secondary’
• menu selection by ‘MO’
• form fill-in by ‘UCR primary’
• form fill-in by ‘UCR secondary’
• form fill-in by ‘MO’
• direct manipulation click of ‘reset basic filters’
• menu selection radio buttons for ‘maintain basic’ filtering parameters
• menu selection numerical stepper by ‘district’
• menu selection numerical stepper by ‘grid’
• form fill-in by ‘any field contains’
• direct manipulation click ‘reset advanced features’
search crime reports• form fill-in search by ‘address’
• form fill-in search by ‘report #’
minimize data panel• direct manipulation click of minimize button
Temporal Panel (Time)
timeline design• histogram depicting frequency of each bin as the height of the histogram bar, with currently mapped bin highlighted
reexpress sequence of bins• menu selection of linear timeline
• menu selection of composite year
• menu selection of composite month
• menu selection of composite week
• menu selection of composite day
sequence animation• direction manipulation click of ‘play’ and ‘pause’ VCR controls
temporal pan• direct manipulation click on histogram bin
• direct manipulation click on 'back' and 'step' VCR controls
• direct manipulation of histogram scroll bar (when entirety of histogram is not displayed)
temporal zoom• menu selection for binning by year
• menu selection for binning by month
• menu selection for binning by week
• menu selection for binning by day
temporal filter• menu selection numerical stepper for ‘form’ and ‘to’ linear filtering
• from’ and ‘to’ linear filtering
• menu selection shortcuts for linear filtering (‘week’, ‘month’, ‘year’, ‘all’)
• direct manipulation timewheel for cyclical filtering by hour
• direction manipulation timewheel for cyclical filtering by month
• direction manipulation timewheel for cyclical filering by day
• menu selection shortcuts for cyclical filtering (season, weekend/weekday, time-of-day)
• direct manipulation click ‘reset temporal parameters’
retrieve details of temporal bin• direct manipulation mouse-over of histogram
minimize temporal panel• direct manipulation click of minimize button

4.2. Expert-Based Think Aloud Study

While stakeholders at the Harrisburg Bureau of Police were experimenting with the revised prototype, we conducted a think aloud study with design experts to evaluate its usability and utility (Figure 3d). As discussed above, the expert-based evaluation was used to supplement input from target users, offering feedback about the alpha release based on established principles in cartography, GIScience, and visual analytics, rather than current practices in crime analysis. Table 5 enumerates the variety and extensiveness of design recommendations elicited through the think aloud study, organized according to the three interface panels in the Figure 5 alpha release.
A first set of recommendations derived from the think aloud study was on the map design. A carry-over from the classroom exercise, the alpha design did not distinguish visually among crime types, using uniform symbolization for all crime reports plotted in the Map Panel. Based on feedback from the needs assessment and think aloud studies, we initially planned to represent each primary UCR code with a different color using a qualitative color scheme. However, due to the extended UCR schema leveraged by the Harrisburg Bureau of Police, we ultimately grouped unique crime types into five categories, using a qualitative color scheme to symbolize by category: (1) violent crimes; (2) property crimes; (3) vice crimes; (4) accidents; and (5) other. We then represented the primary UCR code using a two-letter abbreviation. This again was adjusted to the two-digit, numerical UCR primary code in the full release based on feedback from the formative online survey, as there was concern over the need to learn and remember two, competing abbreviations for the same extended UCR schema. Feedback from the think aloud study also revealed a need to symbolize the point-based context layers using iconic symbols and to differentiate different elements within line and polygon context layers using a qualitative color scheme (Figure 6).
A second set of recommendations regarded additional interface functionality for improving support across the evaluated benchmark tasks (Table 3). Use of benchmark tasks proved fruitful, as the think aloud study allowed us to identify visual exploration and analysis tasks that were poorly supported by the alpha release, an additional advantage of leveraging benchmark tasks for measuring utility from those reviewed above. Participants particularly grew frustrated during three of the elementary level tasks: Task #1 (identify, given what? find when? and where?), Task #2 (identify, given what? and when? find where?), and Task #9 (compare, given where? and when? find what?). Participant verbalizations revealed that this difficulty was due primarily to the lack of a search feature for identifying unique addresses or unique crime report numbers; the former feature supports elementary level tasks in which the where? is known and the latter feature supports elementary level tasks in which the what? is known. Based on this feedback, we added a form fill-in textbox to the Data Panel allowing users to search for a unique address or crime report number. When the user submits an address that has a match within the city limits, the map is zoomed and re-centered to the submitted address. When the user submits a crime report number that has a match in the data feed, the map is zoomed and re-centered to the associated marker on the map, activating the information window in the Map Panel and advancing the animation to the appropriate temporal bin in the Temporal Panel.
Table 5. Results of the expert-based think aloud study. Discussion of critical incidents during the think aloud study led to the identification of missing functionality (utility) and programming bugs (usability) in the alpha release of GeoVISTA CrimeViz.
IssueExten.Fixed?
Map Panel (Space)
Add a search feature by incident report number5Yes
Add a search feature by address5Yes
Unable to discriminate the different areal boundary layers of same color5Yes
Unable to retrieve information about districts (both IDs, population, and incidents) and POIs5Yes
Overlapping incident symbols/Too much data on the map/Add data aggregation option5Yes
Unable to discriminate the different types of crime without filtering/brushing them4Yes
Add scroll zooming using the mouse wheel3Yes
Add ability to zoom into a feature3Yes
Add a spatial extent reset feature3Yes
Add a measurement tool (linear) or distance query tool (circular from point)3No
Unable to discriminate the different Points of Interest3Yes
Add cluster analysis feature3No
Lag in sequencing, panning, and zooming when numerous points are shown1Yes
Add a search feature by Point of Interest1No
Add rubberband zoom using Shift+Drag1No
Unclear that Street View is available until activating information window1No
Selection of ‘fullscreen’ instead of ‘close’ in Street View1Yes
Street View does not work in Internet Explorer1Yes
Information window should close when clicking outside of it1Yes
Information window should include the address1Yes
Add ability to show the case ID on mouse over of the point symbol1Yes
Add buffer feature1No
Data Panel (Attribute)
Application breaks when viewing ‘Bus Stops’ context layer5Yes
Sexual abuse cases after 2006 not mapped5Yes
Loading screen does not provide feedback2Yes
Data Panel overlaps the Google Maps inset1Yes
Add a context layer reset feature1Yes
Crime layer check boxes low on the visual hierarchy1Yes
One misregistered data point1Yes
Temporal Pattern (Time)
Ambiguity in the meaning of linear and composite aggregation5Yes
Filter by compound selection of histogram bars5No
Lag in the animation and in histogram brushing when there are a small number of bins5Yes
Ambiguity in the meaning of temporal unit when composite is applied4Yes
Data filtering not reflected in the histogram popup3Yes
Add a clear division by year for the linear-month histogram2Yes
Add a scroll feature to the histogram so that the bins could be wider2Yes
Animations continued to play or stopped in unexpected ways when interacting with the histogram or map2Yes
Unclear labels on temporal legend2Yes
Add ability to customize the bin widths1No
Add a reset animation feature1Yes
Ambiguity in interpreting composite-month because of extra Jan and Feb from 20091Yes
While participants overall were successful in completing the general level tasks, they were unable to complete these tasks quickly due to lags in map interaction and rendering when plotting a large number of points in the Map Panel. This was particularly problematic for Task #4 (identify, given what? and where? find when?), Task #10 (compare, given what? find where? and when?), and Task #12 (compare, given where? find what? and when?), as these tasks required participants to find information regarding the temporal component of the crime reports. For these general level tasks, participants commonly employed the animation with attribute filtering, which resulted in lags in the animation and inhibited spatiotemporal reasoning. In addition, participants noted that the use of point symbols at small scales to represent individual crime reports resulted in the occlusion of many symbols due to overplotting, which further complicated the interpretation of general level patterns. To alleviate this pair of issues regarding general level tasks, we implemented a backend script that flexibly aggregates crime report points meeting user-defined filtering and sequencing criteria to an arbitrary geospatial grid. The aggregation tallies then are represented in the Map Panel using a sequential color scheme for an overview map at smaller scales. We directly aggregated the crime reports to a hexagon tessellation due to the negative feedback about smoothed “hot spot maps” provided in the needs assessment interviews. When the overview map is zoomed, the Map Panel reverts to the detail view, again plotting the crime reports as individual points in support of elementary level tasks.
Feedback from the expert-based think aloud study prompted a considerable extension to the requirements document (Figure 3e), particularly for the Map and Data Panels (Table 4: orange requirements). In addition to aforementioned revisions, participants also recommended additional flexibility for panning and zooming in the Map Panel, clearer informational content in the information popups in the Map and Temporal Panels, a scroll feature in the Temporal Panel so that the histogram bins can be wider, and buttons for resetting the parameters in the Map, Data, and Temporal Panels. There also were several recommended interface functions that we determined fell outside the project scope, illustrating the tradeoff between utility and usability; such functions included a distance query tool, a buffer feature, support for cluster analysis, and the ability to filter by selecting individual histogram bars.
Finally, the think aloud study revealed a large number of programming bugs and general usability issues in the alpha release. The majority of these usability issues were resolved in a beta release of GeoVISTA CrimeViz for internal experimentation by the Harrisburg Bureau of Police (Figure 3f). Notably, participants in the think aloud study noted that several of the interface concepts and terminology may be confusing to the target users, such as linear versus cyclical time and the creation of temporal composites. Based on this feedback, we designed a comprehensive set of learning and help materials to improve the learnability and memorability of GeoVISTA CrimeViz for non-expert use. These materials initially were provided as text-based tooltips in the beta release (Figure 6), but ultimately were expanded into multimedia webpages available through hyperlinks in the full release (see the “How To” page at http://www.geovista.psu.edu/CrimeViz/).

4.3. Formative Online Survey

After release of the GeoVISTA CrimeViz beta, we administered an online survey to collect feedback from target users on the beta release (Figure 3g). As described above, the formative online survey comprised a series of discrete scale ratings and open-ended questions, balanced by utility and usability. Participant responses to discrete scale ratings in the formative online survey revealed a clear divide between the usability and utility of the beta release, with opinion much more positive on its usability than its utility.
Overall, participant ratings regarding the utility of the beta release was mixed (Table 6). Positively worded questions received an average of 4.7 out of “7” (“7” being the optimal score) and negatively worded questions received an average rating of 2.9 out of “7” (optimal score of “1”), resulting in an absolute average of only 4.9 overall, just slightly above the “4” or “neither agree nor disagree” midpoint of the discrete scale. Several of the utility discrete scale ratings exhibited a bimodal distribution, with a subset of participants strongly agreeing and a second subset strongly disagreeing (e.g., Questions #1 and #2 on frequency of using the prototype and Questions #7 and #8 on the utility of DC CrimeViz for visual exploration and analysis). Examining individual participant responses revealed that this divide closely matched the distinction between the investigator and officer user profiles, with the former rating the utility of the beta release much lower than the latter.
Investigator responses to the open-ended questions clarified their opinions on deficient functionality, focusing primarily upon additional controls for filtering the crime report database. First, investigators requested the ability to aggregate crime reports by hour and to generate a composite day by hour-of-the-day. We initially used “day” as the finest temporal unit, given restrictions in the Washington, D.C., dataset and due to the lack of discussion about hour-by-hour analysis in the needs assessment interviews. Open-ended comments, and follow-up informal discussions, explained the relevance of diurnal cycles in criminal activity to all five use case scenarios. Second, investigators requested greater flexibility in temporal filtering. The beta version allowed for filtering by UCR code and MO, but did not support filtering by time. Investigators indicated the need to filter linearly, setting the “beginning” and “end” date of the mapped crime reports, as well as to filter cyclically by hour-of-the-day, day-of-the-week, and month-of-the-year. Open-ended comments listed both linear and cyclical filtering as important for criminal investigative analysis and intelligence analysis, where a temporal pattern is established in a serial or across a syndicate, and listed cyclical filtering as important for strategy crime analysis. Finally, investigators requested additional ways for filtering the crime reports by space and attribute, including a form fill-in interface for typing specific UCR codes (in addition to selecting from a drop-down menu), numerical steppers for selecting a specific policing region within Harrisburg (either by larger “districts” supervised by captains, or smaller “grids” used for organizing patrol), and a form fill-in textbox allowing for keyword filtering of the narrative descriptions found in the crime reports. This feedback led to a final revision to the GeoVISTA CrimeViz requirements document (Figure 3h; Table 4: purple requirements).
Table 6. Formative Online Survey Responses to Utility Discrete Scale Ratings. Positively worded discrete scale ratings (with an optimal score of “7”) are shaded in white and negatively worded discrete scale ratings (with an optimal score of “1”) are shaded in gray.
Q#Utility Rating1234567Avg
Strongly DisagreeStrongly Agree
1I think that I would use CrimeViz frequently.-2131124.4
2CrimeViz does not support the type of work that I typically do. 5--221-2.9
3CrimeViz would be useful for crime analysts who regularly map crime incident data.-1-22145.4
4CrimeViz would not be useful for detectives or supervisors with no training in crime mapping and analysis. 4321---2.0
5CrimeViz is a novel approach to access and explore crime incident data. --122415.2
6I have access to other software that provides the same functionality implemented in CrimeViz. -1311224.6
7CrimeViz has all the necessary functions to explore crime incident data. -3112214.2
8CrimeViz has all the necessary functions to analyze crime incident data.12211124.0
9CrimeViz has all the necessary functions to present crime incident data.111124-4.4
10CrimeViz is unnecessarily complex, providing too many ways to look at the crime data. 71-1--12.0
Average Rating for Positive Questions (6) 4.7
Average Rating for Negative Questions (4) 2.9
Overall Average with Negative Questions Inversed 4.9
In contrast, participants rated the usability of the beta release highly (Table 7). Positively worded questions received an average of 6.0 out of “7” and negatively worded questions received an average rating of 2.1 out of “7”, resulting in an absolute average of 6.0 overall. Participants found the beta release easy to learn and to use, and also were confident in their understanding of what the interactive map could do and what it was telling them about patterns and trends in criminal activity. The lowest rated usability question regarded the visual design of the beta release (Question #9). Though still receiving an overall response of 5.5 out of “7”, feedback to this usability question prompted a revision to the interactive map design to modernize the look and feel of GeoVISTA CrimeViz, improving its product identity.
Table 7. Formative Online Survey Responses to Usability Discrete Scale Ratings. Positively worded discrete scale ratings (with an optimal score of “7”) are shaded in white and negatively worded discrete scale ratings (with an optimal score of “1”) are shaded in gray.
Q#Usability Rating1234567Avg
Strongly DisagreeStrongly Agree
1I thought CrimeViz was easy to use. 11176.4
2I found CrimeViz very cumbersome to use.5311 1.8
3I do not think that I would need the support of a technical person to be able to use CrimeViz. 11356.2
4I think that I would need detailed help and tutorials to be able to use CrimeViz.53 1 12.2
5I think that most people would learn to use CrimeViz very quickly. 11356.2
6I would need to learn a lot of things before I could get going with CrimeViz.62 2 1.8
7I felt very confident using CrimeViz. 1 11345.7
8I often was confused about what to click or where to look when using CrimeViz. 53 1 12.3
9The visual design of the CrimeViz interface is well done. 1 3335.5
10CrimeViz violates basic cartographic conventions.2521 2.2
Average Rating for Positive Questions (5)6.0
Average Rating for Negative Questions (5)2.1
Overall Average with Negative Questions Inversed 6.0
The modified GeoVISTA CrimeViz started as a static mockup in order to brainstorm designs for integrating the new functional requirements identified by investigators, while remaining usable by officers and administrators (
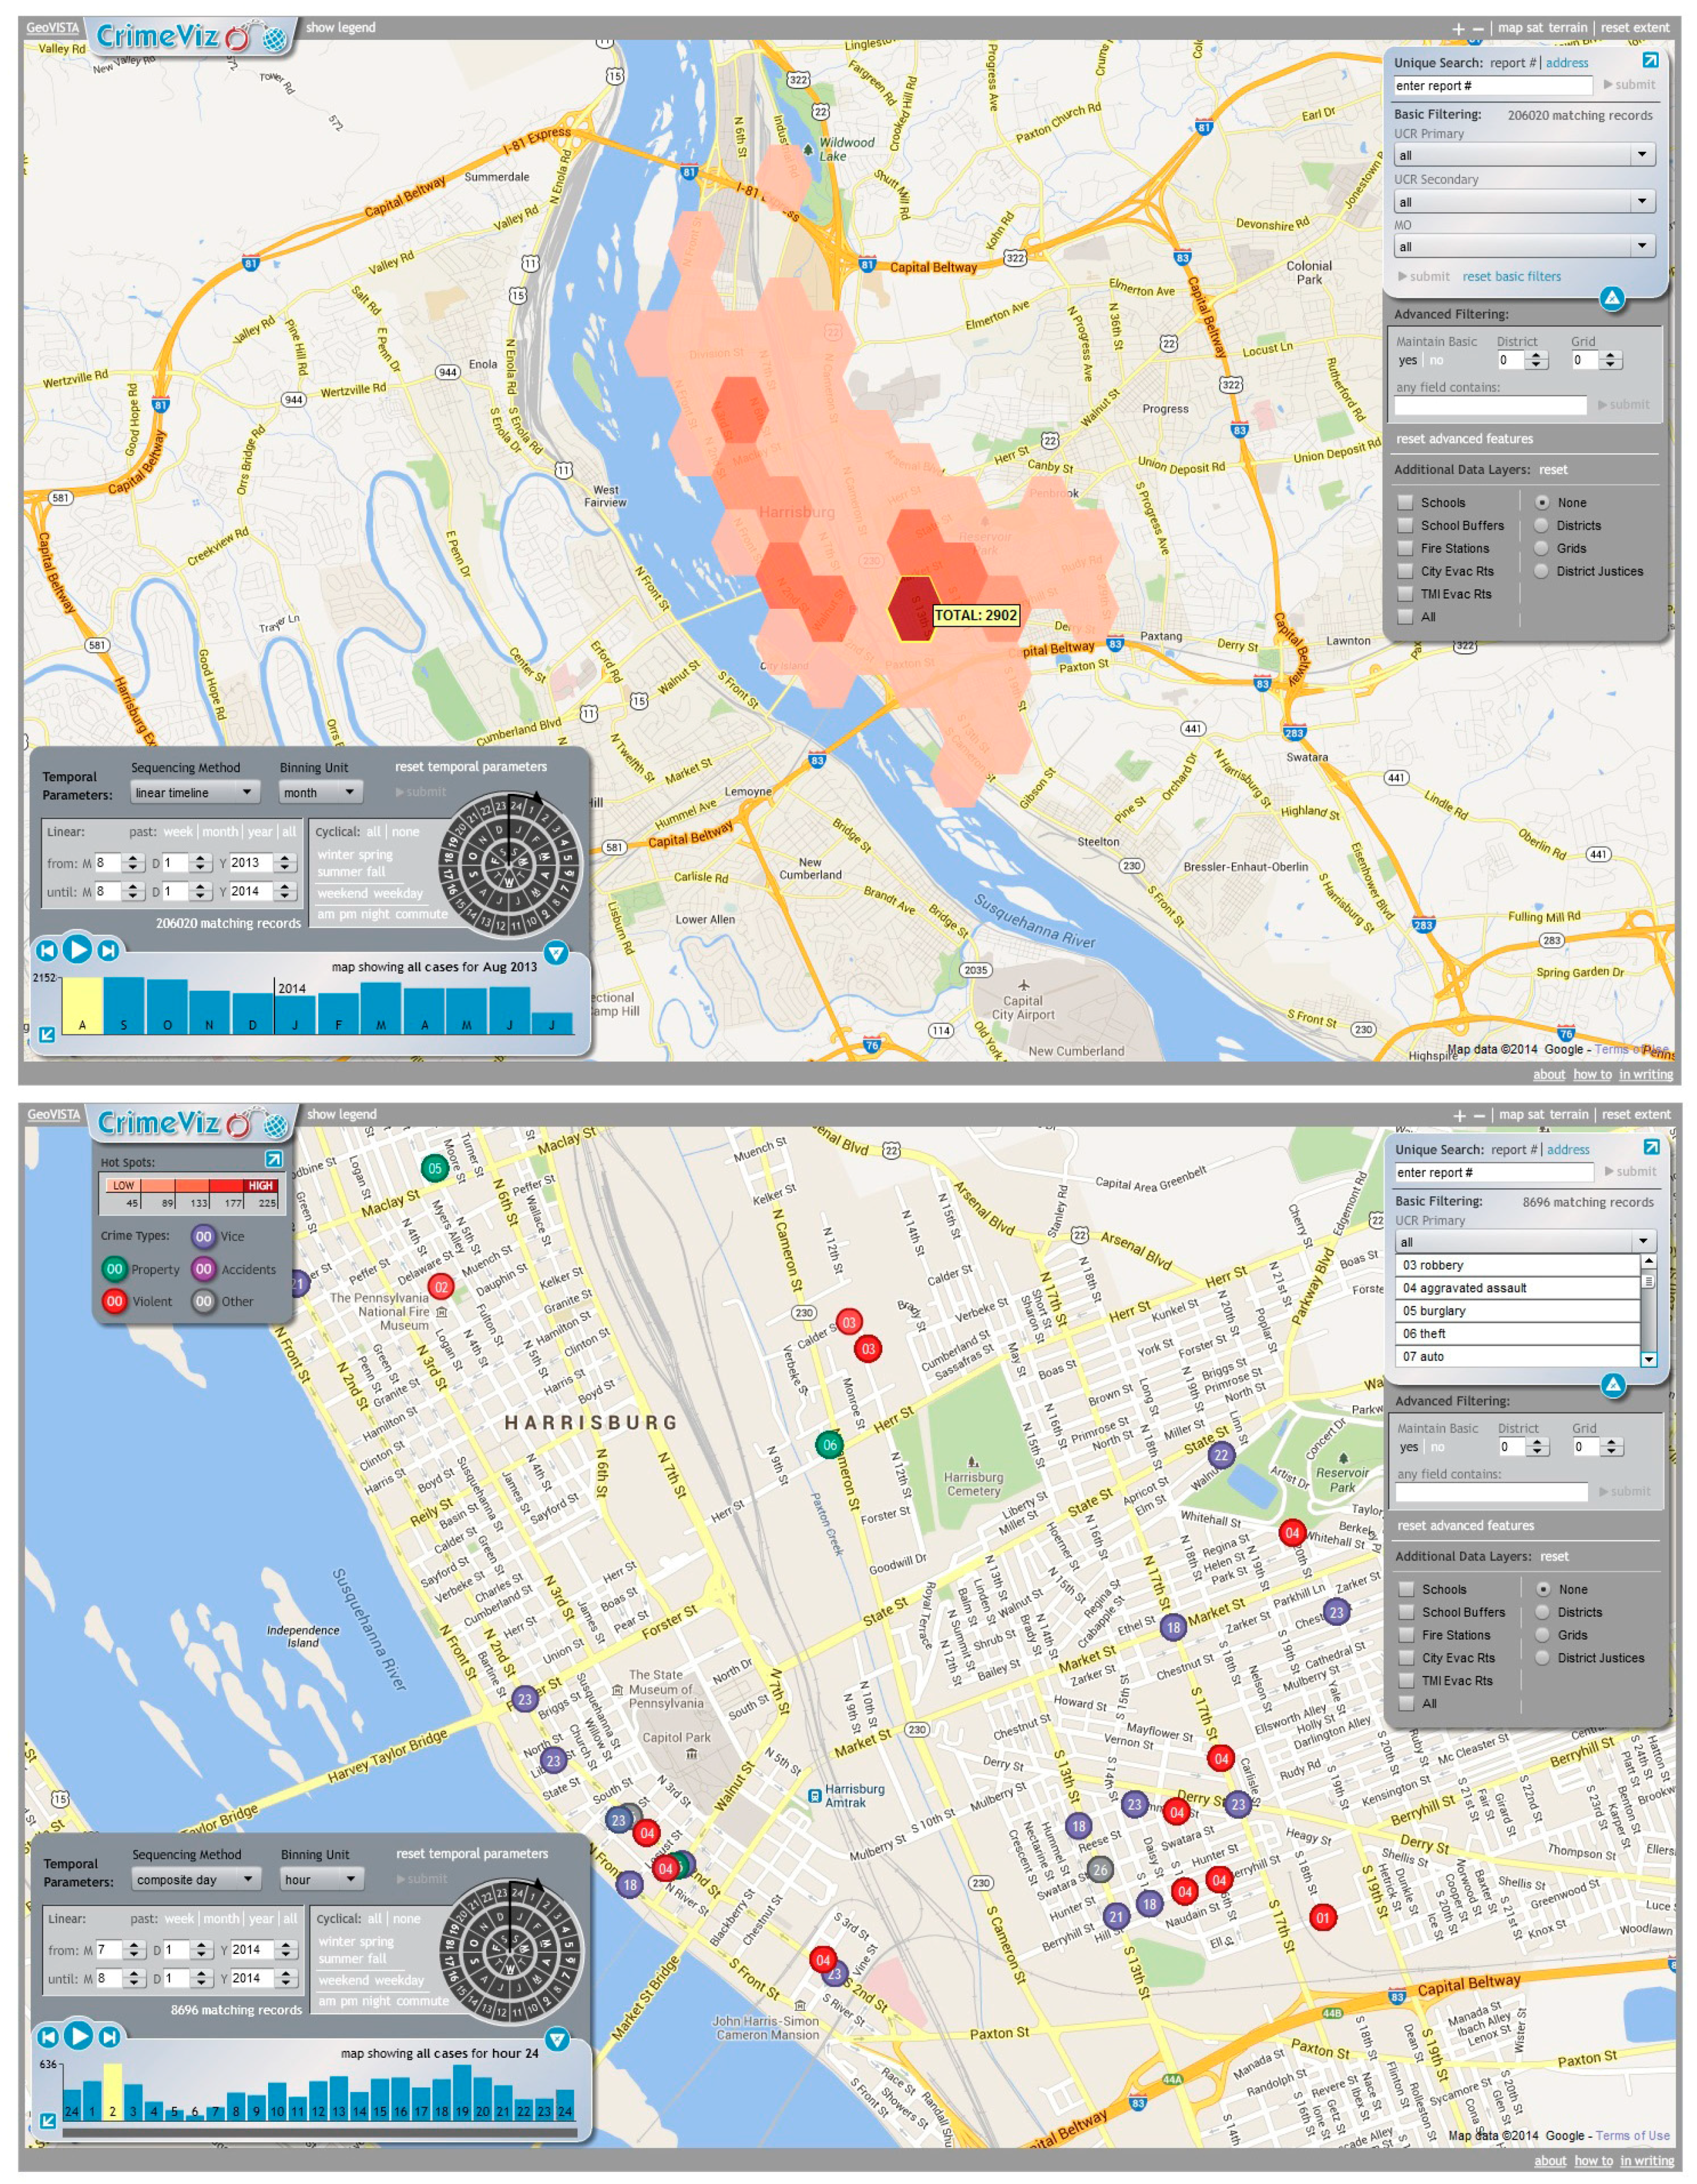
Figure 7). A first important revision was to add “Advanced” Data and Temporal Panels—deactivated by default—to house the more complex interface functionality identified by investigators in the formative online survey. The original Data and Temporal Panels then had purposeful default settings (all crime types for the Data Panel and the past seven days for the Temporal Panel) so that officers did not need to activate the advanced panels in order to complete their simpler, tactical crime analysis tasks. While we expected that administrators would need to activate the advanced panels, we included shortcuts within these panels to tailor attribute and temporal filtering options to common report requests (e.g., past week/month/year, seasons, weekend/weekday, and a.m./p.m./night/commute). Thus, we anticipated the revised interface design and layout to support the flexible visual exploration and analysis required by investigators without complicating the work of officers and administrators. Finally, we designed a direct manipulation timewheel control to reinforce the difference between linear and cyclical filtering—a potential confusion identified in the think aloud study—and to allow users to build up complex queries quickly without using nested windows and complex menus—a design improvement identified in the needs assessment interviews.
The full release of GeoVISTA CrimeViz was transitioned to the Harrisburg Bureau of Police in the Summer of 2011 following an 18-month UCD process (Figure 3i). The overview and detail view of the full release are depicted in Figure 8.
Figure 7. 
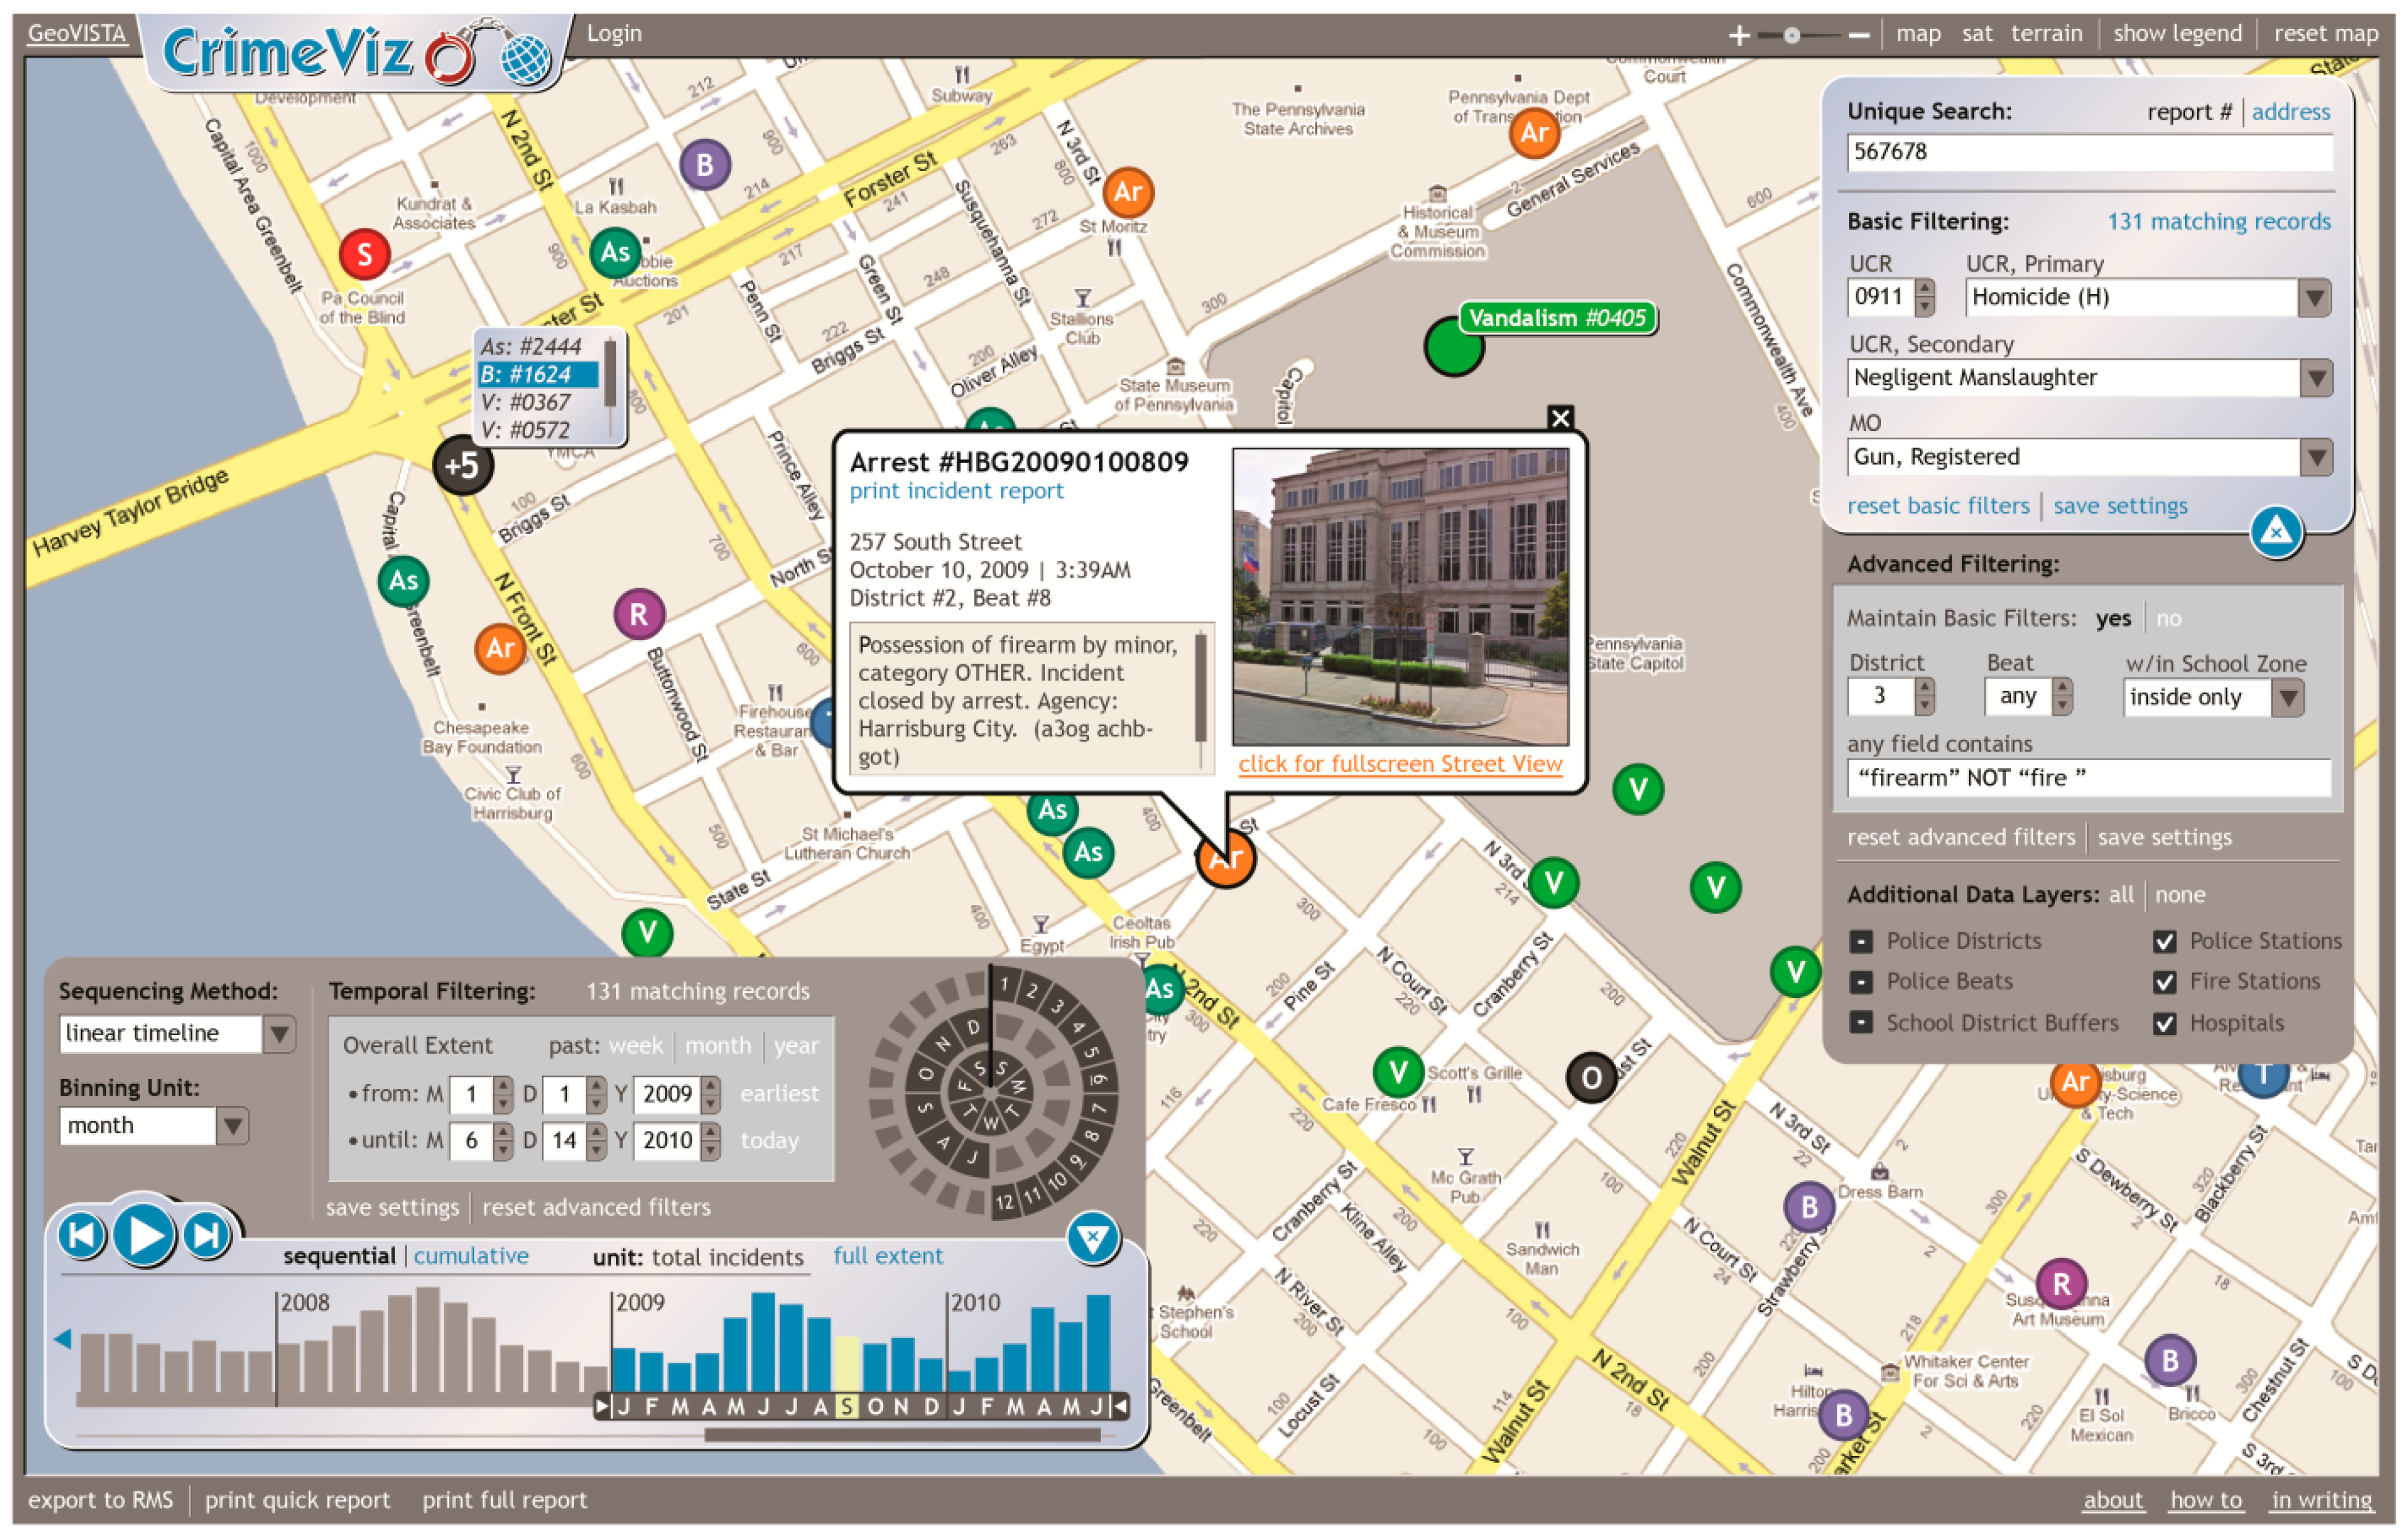
Static mockup of the GeoVISTA CrimeViz full release. Feedback from the formative online survey enumerated additional functional requirements supporting the investigator profile, as well as prompting a major revision to the product identity.
Ijgi 04 00262 g007

4.4. Summative Online Survey

Following Nielsen [3,4], Gabbard, Hix, and colleagues [18,19,36], and Buttenfield [10], we concluded our UCD process by evaluating the full release of GeoVISTA CrimeViz after deployment through a summative online survey (Figure 3j). As described above, both the formative and summative online surveys included the same set of discrete scale ratings and open-ended questions, allowing for comparison between the beta release and revisions made to the full release. The goal of this final survey was to assess how well the utility and usability goals were met by the full release and to inform future versions of the interactive map.
Importantly, participants in the summative online survey rated the utility of GeoVISTA CrimeViz much more favorably than in the formative online survey (Table 8). In the summative online survey, positively worded questions received an average of 5.8 out of “7” and negatively worded questions received an average rating of 1.9 out of “7”, resulting in an absolute average of 6.0 overall. The overall utility score therefore exhibited an increase of 1.1 between the formative and summative online surveys, an indication that the redesign of GeoVISTA CrimeViz was successful.
Figure 8. Overview (top) and detail view (bottom) of the GeoVISTA CrimeViz full release.
Ijgi 04 00262 g008
Table 8. Summative Online Survey Responses to Utility Discrete Scale Ratings. Positively worded discrete scale ratings (with an optimal score of “7”) are shaded in white and negatively worded discrete scale ratings (with an optimal score of “1”) are shaded in gray.
Q#Utility Rating1234567AvgΔ
Strongly DisagreeStrongly Agree
1I think that I would use CrimeViz frequently.1 12 155.3+0.9
2CrimeViz does not support the type of work that I typically do. 8 11 1.5−1.4
3CrimeViz would be useful for crime analysts who regularly map crime incident data. 1366.5+1.1
4CrimeViz would not be useful for detectives or supervisors with no training in crime mapping and analysis. 53 1 12.2+0.2
5CrimeViz is a novel approach to access and explore crime incident data. 11356.2+1.0
6I have access to other software that provides the same functionality implemented in CrimeViz. 8 2 1.6−3.0
7CrimeViz has all the necessary functions to explore crime incident data. 22425.6+1.2
8CrimeViz has all the necessary functions to analyze crime incident data. 111615.5+1.5
9CrimeViz has all the necessary functions to present crime incident data. 111615.5+1.1
10CrimeViz is unnecessarily complex, providing too many ways to look at the crime data. 531 1 1.9−0.1
Average Rating for Positive Questions (6) 5.8+1.1
Average Rating for Negative Questions (4) 1.8−1.1
Overall Average with Negative Questions Inversed 6.0+1.1
Overall, participants again rated the usability of the full release favorably (Table 9). Positively worded questions received an average of 5.4 out of “7”, and negatively worded questions received an average rating of 1.9 out of “7”, resulting in an absolute average of 5.8 overall. The overall usability score of the full release (5.8) was down 0.3 from the overall usability score of the beta release (6.1); this marginal reduction in perceived usability was considered a success, given the large number of features added to GeoVISTA CrimeViz following the formative online survey. Further, the summative online survey indicated a balanced between the usability-utility tradeoff in the full release of GeoVISTA CrimeViz, with participants rating usability (5.8) very near utility (6.0).
Table 9. Formative Online Survey Responses to Usability Discrete Scale Ratings. Positively worded discrete scale ratings (with an optimal score of “7”) are shaded in white and negatively worded discrete scale ratings (with an optimal score of “1”) are shaded in gray.
Q#Usability Rating1234567AvgΔ
Strongly DisagreeStrongly Agree
1I thought CrimeViz was easy to use. 13335.8−0.6
2I found CrimeViz very cumbersome to use.4411 1.9+0.1
3I do not think that I would need the support of a technical person to be able to use CrimeViz.12111314.2−2.0
4I think that I would need detailed help and tutorials to be able to use CrimeViz.415 2.1−0.1
5I think that most people would learn to use CrimeViz very quickly. 112515.4−0.8
6I would need to learn a lot of things before I could get going with CrimeViz. 541 1.6−0.2
7I felt very confident using CrimeViz. 122325.3−0.4
8I often was confused about what to click or where to look when using CrimeViz. 332 11 2.6+0.3
9The visual design of the CrimeViz interface is well done. 1 1356.2+0.7
10CrimeViz violates basic cartographic conventions.641.4 −0.8
Average Rating for Positive Questions (5)5.4−0.6
Average Rating for Negative Questions (5)1.9−0.2
Overall Average with Negative Questions Inversed5.8−0.3

5. Summary and Conclusions

In this paper, we addressed the topic of user-centered design for cartography, GIScience, and visual analytics. Our contribution was two-fold: (1) we distilled core concepts from the literature into a comprehensive background review to inform UCD for interactive maps; and (2) we reported on a case study user-centered process, tracking the design and evaluation of GeoVISTA CrimeViz as it evolved from classroom exercise to full transition to the Harrisburg Bureau of Police. In the following, we provide a concluding summary of our research contributions, bringing together key concepts in the background review and notable insights from the case study UCD process to demonstrate the importance of taking a user-centered approach to the design and development of interactive maps.
GeoVISTA CrimeViz presented an interesting case study in balancing the usability-utility tradeoff—the two broad categories of measures collected during UCD—given the need to support sophisticated visual exploration and analysis of criminal activity in Harrisburg, while remaining approachable to a non-technical target user group. To balance this tradeoff, we envisioned our UCD approach to GeoVISTA CrimeViz as a series of user→utility→usability loops (Figure 1) in which each evaluation (user) evoked revisions to the functional requirements of GeoVISTA CrimeViz (utility), which further prompted updates to the static and interactive prototypes (usability). We completed four user→utility→usability loops in total, each leading with an empirical evaluation (Figure 3): (1) a needs assessment interview study; (2) an expert-based think aloud study; (3) a formative online survey; and (4) a summative online survey. The decision to select an interface evaluation method based on the evaluator, rather than by stage, proved to be advantageous, and we recommend use of the Table 2 summary of interface evaluation methods for selecting and administering an appropriate method quickly during rapid prototyping.
The opening needs assessment study (Figure 3a) helped us formalize user profiles and use case scenarios for GeoVISTA CrimeViz, both of which are essential for “knowing the user” during subsequent conceptual development and early prototyping. We also learned about the kind and format of spatiotemporal information needed by target users, and opportunities and complications with mapping these information. Relatedly, the needs assessment generated insight into the appropriate information architecture, suggesting that a full stack solution was necessary. The needs assessment also served as a discount competitive analysis study, with participants describing alternative tools available to support their work needs and providing their reasoning for internal adoption of these tools, or lack thereof. Finally, and perhaps most importantly, we learned a substantial amount about currently met and unmet needs regarding map design and interface design, which directly led to articulation of an initial requirements document (Figure 3b; Table 4) and the alpha release of GeoVISTA CrimeViz (Figure 3c; Figure 5).
The think aloud study on the alpha release (Figure 3d) demonstrated the usefulness of supplementing user-based evaluation methods with theory-based or, in this case, expert-based methods (Table 2). The think aloud study allows us to relate the feedback we received from target users to cartographic design conventions and recommendations, leading to revisions to the ways in which the dataset was aggregated and symbolized. Use of the Andrienko et al. [29] operational task taxonomy for measuring utility proved fruitful, as the resulting benchmark tasks exposed gaps in interface functionality unidentified during the needs assessment study. Finally, the think aloud study suggested ways to improve the flexibility of the interface design, as well as identified a large number of programming bugs and general usability issues (Table 5), ultimately leading to a first revision of the requirements document (Figure 3e) and the beta release of GeoVISTA CrimeViz (Figure 3f; Figure 6).
The consistent format of the formative (Figure 3g) and summative (Figure 3j) online surveys allowed us to grapple directly with the usability-utility tradeoff as we transitioned from the beta release to the full release. The formative online survey identified a division across user profiles in the perceived utility of the beta release (Table 6), prompting a final revision to the functional requirements to ensure the interface supported all target users (Figure 3h). Further, while the beta release was considered highly usable, we learned that more work was needed to modernize the product identify before transitioning the full release (Table 7), which in turn led to a final prototyping session to revise the look and feel of the map and interface design (Figure 3i). Finally, the summative online survey provided evidence that target users were happy with the balance of utility and usability in the full release, confirming interface success (Tables 8 and 9).
Overall, the GeoVISTA CrimeViz case study demonstrated the benefit of following a UCD process for interactive mapping projects. The emphasis on formative feedback over summative feedback allowed us to establish and modify our conceptual design at a low cost, enabling us to use development resources efficiently; by the time we reached summative evaluation, we simply confirmed that GeoVISTA CrimeViz was a success. The discount, convergent nature of the process also proved effective, as each overlapping evaluation caught issues missed in the prior evaluation. Finally, and perhaps most importantly, the multidimensional, in-depth, and long-term nature of the case study promoted buy-in with the target users, improving adoption and uptake of the interface. As described above, the full release of GeoVISTA CrimeViz was transitioned in the Summer of 2011 following an 18-month UCD process, and continues to be an important component of the analytical workflow for the Harrisburg Bureau of Police.

Acknowledgments

We wish to thank following individuals from the Penn State GeoVISTA Center who helped with various aspects of CrimeViz UCD process: Benjamin Finch, Wei Luo, Craig McCabe, Ryan Mullins, Scott Pezanowski, and Camilla Robinson. We also wish to thank the key stakeholders at the Harrisburg Bureau of Police who facilitated the UCD process: Sergeant Deric Moody, Corporal Gabriel Olivera, Larry Eikenberry, Roger Swinehart, and Steve Zimmerman.

Conflicts of Interest

The authors declare no conflict of interest.

References

  1. Cook, T. A Letter from Tim Cook on Maps. Available online: http://www.apple.com/letter-from-tim-cook-on-maps/ (accessed on 1 January 2015).
  2. Norman, D.A. The Design of Everyday Things; Basic Books: New York, NY, USA, 1988. [Google Scholar]
  3. Nielsen, J. The usability engineering life cycle. Computer 1992, 25, 12–22. [Google Scholar] [CrossRef]
  4. Nielsen, J. Usability Engineering; Morgan Kaufmann: San Francisco, CA, USA, 1993. [Google Scholar]
  5. MacEachren, A.M.; Kraak, M.-J. Research challenges in geovisualization. Cartogr. Geogr. Inf. Sci. 2001, 28, 3–12. [Google Scholar] [CrossRef]
  6. Fuhrmann, S.; Pike, W. User-centered design of collaborative geovisualization tools. In Exploring geovisualization; Dykes, J., MacEachren, A.M., Kraak, M.J., Eds.; Elsevier Science: Amsterdam, The Netherlands, 2005; pp. 591–610. [Google Scholar]
  7. Nivala, A.-M.; Brewster, S.; Sarjakoski, T.L. Usability methods’ familiarity among map application developers. Int. J. Hum.-Comput. Stud. 2007, 65, 784–795. [Google Scholar] [CrossRef]
  8. Haklay, M.; Nivala, A.-M. User-centered design. In Interacting with Geospatial Technologies; Haklay, M., Ed.; Wiley-Blackwell: West Sussex, UK, 2010; pp. 91–106. [Google Scholar]
  9. Tsou, M.-H. Revisiting web cartography in the United States: The rise of user-centered design. Cartogr. Geogr. Inf. Sci. 2011, 38, 250–257. [Google Scholar] [CrossRef]
  10. Buttenfield, B. Usability evaluation of digital libraries. Sci. Technol. Libr. 1999, 17, 39–59. [Google Scholar] [CrossRef]
  11. Slocum, T.A.; Sluter, R.S.; Kessler, F.C.; Yoder, S.C. A qualitative evaluation of MapTime, a program for exploring spatiotemporal point data. Cartographica 2004, 59, 43–68. [Google Scholar] [CrossRef]
  12. Robinson, A.C.; Chen, J.; Lengerich, E.J.; Meyer, H.G.; MacEachren, A.M. Combining usability techniques to design geovisualization tools for epidemiology. Cartogr. Geogr. Inf. Sci. 2005, 32, 243–255. [Google Scholar] [CrossRef] [PubMed]
  13. Koua, E.L.; MacEachren, A.M.; Kraak, M.-J. Evaluating the usability of visualization methods in an exploratory geovisualization environment. Int. J. Geogr. Inf. Sci. 2006, 20, 425–448. [Google Scholar] [CrossRef]
  14. Elzakker, C.P.V.; Delikostidis, I.; Oosterom, P.J.M.V. Field-based usability evaluation methodology for mobile geo-applications. Cartogr. J. 2008, 45, 139–149. [Google Scholar] [CrossRef]
  15. Haklay, M.; Tobón, C. Usability evaluation and PPGIS: Towards a user-centred design approach. Int. J. Geogr. Inf. Sci. 2003, 17, 577–592. [Google Scholar] [CrossRef]
  16. Sack, C.M. Mapmaking for Change: Online Participatory Mapping Tools for Revealing Landscape Values in the Bad River Watershed. University of Wisconsin-Madison: Madison, WI, USA, 2013. [Google Scholar]
  17. Slocum, T.; Cliburn, D.; Feddema, J.; Miller, J. Evaluating the usability of a tool for visualizing the uncertainty of the future global water balance. Cartogr. Geogr. Inf. Sci. 2003, 30, 299–317. [Google Scholar] [CrossRef]
  18. Gabbard, J.L.; Hix, D.; Swan, J.E. User-centered design and evaluation of virtual environments. IEEE Comput. Graph. Appl. 1999, 19, 51–59. [Google Scholar] [CrossRef]
  19. Bowman, D.A.; Gabbard, J.L.; Hix, D. A survey of usability evaluation in virtual environments: Classification and comparison of methods. Presence 2002, 11, 404–424. [Google Scholar] [CrossRef]
  20. Kramers, R.E. Interaction with maps on the internet: A user centred design approach for the Atlas of Canada. Cartogr. J. 2008, 45, 98–107. [Google Scholar] [CrossRef]
  21. MacEachren, A.M.; Crawford, S.; Akella, M.; Lengerich, G. Design and implementation of a model, web-based, GIS-enabled cancer atlas. Cartogr. J. 2008, 45, 246–260. [Google Scholar] [CrossRef]
  22. Nivala, A.-M.; Brewster, S.; Sarjakoski, T.L. Usability evaluation of web mapping sites. Cartogr. J. 2008, 45, 129–138. [Google Scholar] [CrossRef]
  23. Roth, R.E.; Harrower, M. Addressing map interface usability: Learning from the Lakeshore Nature Preserve Interactive Map. Cartogr. Perspect. 2008, 60, 46–66. [Google Scholar] [CrossRef]
  24. Roth, R.E. Interactivity and cartography: A contemporary perspective on UI/UX design from geospatial professionals. Cartographica, 2015; pending online. [Google Scholar]
  25. Krug, S. Don’t Make Me Think: A Common Sense Approach to Web Usability, 2nd ed.; New Riders Publishing: Berkeley, CA, USA, 2000. [Google Scholar]
  26. Robinson, A.C.; Roth, R.E.; MacEachren, A.M. Designing a web-based learning portal for geographic visualization and analysis in public health. Health Inf. 2011. [Google Scholar] [CrossRef]
  27. Grinstein, G.; Kobsa, A.; Plaisant, C.; Shneiderman, B.; Stasko, J.T. Which comes first, usability or utility? In Proceedings of 14th IEEE Visualization (Viz ’03), Seattle, WA, USA, 24–24 October 2003; 2003; pp. 605–606. [Google Scholar]
  28. Usability Gov. Available online: http://www.usability.gov/ (accessed on 1 January 2015).
  29. Andrienko, N.; Andrienko, G.; Gatalsky, P. Exploratory spatio-temporal visualization: An analytical review. J. Vis. Lang. Comput. 2003, 14, 503–541. [Google Scholar] [CrossRef]
  30. Roth, R.E. Cartographic interaction primitives: Framework and synthesis. Cartogr. J. 2012, 49, 376–395. [Google Scholar] [CrossRef]
  31. North, C. Toward measuring visualization insight. IEEE Comput. Graph. Appl. 2006, 26, 6–9. [Google Scholar] [CrossRef] [PubMed]
  32. ISO. ISO 9241-11: Ergonomic Requirements for Office Work with Visual Display Terminals (VDT)S, Part II; International Organization for Standardization: Geneva, Switzerland, 1998; p. 22. [Google Scholar]
  33. Fuhrmann, S.; Ahonen-Rainio, P.; Edsall, R.M.; Fabrikant, S.I.; Koua, E.L.; Tobon, C.; Ware, C.; Wilson, S. Making useful and useable geovisualization: Design and evaluation issues. In Exploring geovisualization; Dykes, J., MacEachren, A.M., Kraak, M.J., Eds.; Elsevier Science: Amsterdam, The Netherlands, 2005; pp. 553–566. [Google Scholar]
  34. Roth, R.E.; Maceachren, A.M.; Mccabe, C.A. A workflow learning model to improve geovisual analytics utility. In Proceedings of the 24th International Cartographic Conference, Santiago, Chile, 15–21 November 2009; pp. 1–10.
  35. Marsh, S.L.; Haklay, M. Evaluation and deployment. In Interacting with Geospatial Technologies; Haklay, M., Ed.; Wiley-Blackwell: West Sussex, UK, 2010; pp. 199–221. [Google Scholar]
  36. Hix, D.; Swan, J.E.; Gabbard, J.L.; Mcgee, M.; Durbin, J.; King, T. User-centered design and evaluation of a real-time battlefield visualization virtual environment. In Virtual Reality; IEEE: Houston, TX, USA, 1999; pp. 96–103. [Google Scholar]
  37. Tsou, M.-H.; Curran, J.M. User-centered design approaches for web mapping applications: A case study with USGS hydrological data in the United States. In International Perspectives on Maps and the Internet; Peterson, M.P., Ed.; Springer: Berlin-Heidelberg, Germany, 2008; pp. 301–321. [Google Scholar]
  38. Garrett, J.J. The Elements of User Experiences: User-Centered Design for the Web; American Institute of Graphic Arts: New York, NY, USA, 2002. [Google Scholar]
  39. Cairns, P.; Cox, A.L. Research Methods for Human-Computer Interaction; Cambridge University Press: Cambridge, UK, 2008. [Google Scholar]
  40. Marsh, S.L.; Dykes, J. Using and evaluating HCI techniques in geovisualization: Applying standard and adapted methods in research and education. In Proceedings of GIS Research UK, Machester, UK, 2–4 April 2008; pp. 33–38.
  41. Hom, J. The Usability Methods Toolbox. Available online: http://usability.jameshom.com/ (accessed on 1 January 2015).
  42. Usability Partners. Available online: http://www.usabilitypartners.se/ (accessed on 1 January 2015).
  43. Nielsen, J.; Sano, D. Sunweb: User interface design for sun microsystem’s internal web. Comput. Netw. Isdn Syst. 1995, 28, 179–188. [Google Scholar] [CrossRef]
  44. Roth, R.E.; Finch, B.G.; Blanford, J.I.; Klippel, A.; Robinson, A.C.; MacEachren, A.M. Card sorting for cartographic research and practice. Cartogr. Geogr. Inf. Sci. 2011, 38, 89–99. [Google Scholar] [CrossRef]
  45. Monmonier, M.; Gluck, M. Focus groups for design improvement in dynamic cartography. Cartogr. Geogr. Inf. Sci. 1994, 21, 37–47. [Google Scholar] [CrossRef]
  46. Harrower, M.; MacEachren, A.; Griffin, A.L. Developing a geographic visualization tool to support earth science learning. Cartogr. Geogr. Inf. Sci. 2000, 27, 279–293. [Google Scholar] [CrossRef]
  47. Kessler, F. Focus groups as a means of qualitatively assessing the u-boat narrative. Cartographica 2000, 37, 33–60. [Google Scholar] [CrossRef]
  48. Sweeney, M.; Maguire, M.; Shackel, B. Evaluating user-computer interaction: A framework. Int. J. Man-Mach. Stud. 1993, 38, 689–711. [Google Scholar] [CrossRef]
  49. Kostelnick, J.C.; Dobson, J.E.; Egbert, S.L.; Dunbar, M.D. Cartographic symbols for humanitarian demining. Cartogr. J. 2008, 45, 18–31. [Google Scholar] [CrossRef]
  50. Richards, J.R.; Egenhofer, M.J. A comparison of two direct-manipulation GIS user interfaces for map overlay. Geogr. Syst. 1995, 2, 267–290. [Google Scholar]
  51. Roth, R.E.; Quinn, C.; Hart, D. The competitive analysis method for evaluating water level visualization tools. In Lecture Notes in Geoinformation and Cartography; Springer: Heidelberg, Germany, 2015; pp. 241–256. [Google Scholar]
  52. Stanney, K.M.; Mollaghasemi, M.; Reeves, L.; Breaux, R.; Graeber, D.A. Usability engineering of virtual environments: Identifying multiple criteria that drive effective VE system design. Int. J. Hum.-Comput. Stud. 2003, 58, 447–481. [Google Scholar] [CrossRef]
  53. Edsall, R.M. Design and usability of an enhanced geographic information system for exploration of multivariate health statistics. Prof. Geogr. 2003, 55, 146–160. [Google Scholar]
  54. Thomas, J.J.; Cook, K.A.; Bartoletti, A.; Card, S.; Carr, D.; Dill, J.; Earnshaw, R.; Ebert, D.; Eick, S.; Grossman, R.; et al. Illuminating the Path: The Research and Development Agenda for Visual Analytics; IEEE CS Press: Los Alametos, CA, USA, 2005. [Google Scholar]
  55. Andrienko, G.; Andrienko, N.; Jankowski, P.; Keim, D.; Kraak, M.-J.; MacEachren, A.; Wrobel, S. Geovisual analytics for spatial decision support: Setting the research agenda. Int. J. Geogr. Inf. Sci. 2007, 21, 839–857. [Google Scholar] [CrossRef]
  56. Harries, K. Mapping Crime: Principle and Practice; National Institute of Justice, Crime Mapping Research Center: Washington, DC, USA, 1999. [Google Scholar]
  57. Ratcliffe, J.H. The structure of strategic thinking. In Strategic Thinking in Criminal Intelligence, 2nd ed.; Ratcliffe, J.H., Ed.; Federation Press: Sydney, Australia, 2009; pp. 1–10. [Google Scholar]
  58. Ratcliffe, J. Crime mapping: Spatial and temporal challenges. In Handbook of Quantitative Criminology; Piquero, A.R., Weisburd, D., Eds.; Springer Science: New York, NY, USA, 2009; pp. 5–24. [Google Scholar]
  59. Lodha, S.K.; Verma, A. Animations of crime maps using virtual reality modeling language. West. Criminol. Rev. 1999, 1, 1–19. [Google Scholar]
  60. Roth, R.E.; Ross, K.S. Extending the Google Maps API for event animation mashups. Cartogr. Perspect. 2009, 64, 21–40. [Google Scholar] [CrossRef]
  61. Roth, R.; Ross, K.; Finch, B.; Luo, W.; MacEachren, A. Spatiotemporal crime analysis in U.S. Law enforcement agencies: Current practices and unmet needs. Gov. Inf. Q. 2013, 30, 226–240. [Google Scholar] [CrossRef]
  62. Shneiderman, B.; Plaisant, C. Strategies for evaluating information visualization tools: Multi-dimensional in-depth long-term case studies. In Proceedings of 2006 Beliv Workshop, Venice, Italy, 23–26 May 2006; pp. 1–7.
  63. Boba, R. Crime analysis defined. In Crime Analysis and Crime Mapping; Sage: Thousand Oaks, CA, USA, 2005; pp. 5–18. [Google Scholar]
  64. Bair, S. Atac: A tool for tactical crime analysis. Crime Mapp. News 2000, 2, 9. [Google Scholar]
  65. Cheetham, R. Hunchlab: Spatial data mining for intelligence-driven policing. In Proceedings of the Annual Meeting of the Association of American Geographers, Washington, DC, USA, 15–18 April 2010.
  66. Levine, N. Crime mapping and the crimestat program. Geogr. Anal. 2006, 38, 41–56. [Google Scholar] [CrossRef]
  67. Anselin, L.; Syabri, I.; Kho, Y. Geoda: An introduction to spatial data analysis. Geogr. Anal. 2006, 38, 5–22. [Google Scholar] [CrossRef]

