
Road Intersection Recognition via Combining Classification Model and Clustering Algorithm Based on GPS Data

1
School of Computer Science and Engineering, Hunan University of Science and Technology, Xiangtan 411201, China
2
Hunan Key Laboratory for Service Computing and Novel Software Technology, Xiangtan 411201, China
*
Author to whom correspondence should be addressed.
ISPRS Int. J. Geo-Inf. 2022, 11(9), 487; https://doi.org/10.3390/ijgi11090487
Submission received: 3 July 2022
/
Revised: 21 August 2022
/
Accepted: 10 September 2022
/
Published: 14 September 2022
(This article belongs to the Special Issue Urban Geospatial Analytics Based on Crowdsourced Data)
Abstract
:Road intersections are essential to road networks. How to precisely recognize road intersections based on GPS data is still challenging in intelligent transportation systems. Road intersection recognition involves detecting intersections and recognizing its scope. There are few works on intersections’ scope recognition. The existing methods always focus on road intersection detection. It includes two parts: one is selecting turning points from GPS data and extracting their geometric features, another is clustering them into center coordinates of road intersections. However, the accuracy of road intersection detection still has improvement room due to two drawbacks: (1) Besides geometric features, spatial features explored from GPS data and the interactions among all features are also important to represent intersections’ semantics more accurately, and (2) How to capture the points around intersections for clustering has great impact on the accuracy of intersection detection. To solve the preceding problems, we propose a novel approach for road intersection recognition via combining a classification model and clustering algorithm based on GPS data, which involves detecting the center coordinate and computing the radius of the intersection. Firstly, we distil geometric features and spatial features from historical GPS points. These features are inputted into the Extreme Deep Factorization Machine (xDeepFM) model which is applied for capturing the GPS points nearby road intersections. Secondly, the preceding points are clustered into center coordinates of road intersections by the Density-Based Spatial Clustering of Applications with Noise algorithm (DBSCAN). Thirdly, we present a new method of radius computing by integrating Delaunay triangulation with circle shape structure. Experiments are carried out on the GPS data of Chengdu, China. Compared with some state-of-the-art methods, our approach achieves higher accuracy on road intersection recognition based on GPS data. The precision, recall, and f-measure of our proposed center coordinates detection method are respectively 99.0%, 92.7%, and 95.8% when the matching area’s radius is 30 m. Moreover, the error of the proposed radius calculation method is less than 26.5%.
1. Introduction
With the development of an intelligent transportation system, it becomes a high concern and challenge to precisely mine detailed digital road information from taxi trajectory data [1]. As one of the vital elements in road networks, road intersections play a crucial role in road network construction, route planning, and automatic driving [2,3,4]. Some ways to extract road intersections in the past decades include field mapping and remote sensing image recognition. The former one is time-consuming and of high labor cost. The latter way is easily disturbed by image noise [5,6,7,8]. The process of generating remote sensing images needs a long time and leads to difficultly in capturing the road changes in time [9]. Some companies have used mobile measuring vehicles to collect road information in recent years, which is still of high cost and time-consuming [10].
Owing to the maturity of the Global Positioning System (GPS) technology and the popularization of the smart city, more and more urban vehicles are equipped with GPS devices. The devices record a large amount of GPS trajectory data. These low-cost and widely distributed GPS data provide a new way to automatic road extraction [11,12,13,14].
As intersections link many lanes of different directions, drivers often change their direction at intersections before crossing ahead. That is to say, there are lots of turning points around intersections. Thus, the traditional approach of road intersection detection always uses geometric features of GPS data which contain turning angles and turning distances. The turning points are detected and then clustered to be center coordinates of road intersections [1,2,15,16,17,18]. However, there is still room for improvement due to lack of some other spatial features.
Intersections are located at the junctions of several roads. The GPS points’ numbers around intersections are obviously more than those of straight roads at the same intervals. Therefore, more spatial features, especially those of the spatial neighborhood of intersections, should be considered besides geometric features. In the traditional approach, only one algorithm is applied. Moreover, how to accurately recognize the intersections’ radiuses based on these features is also vital to intelligent transportation systems. The radiuses can help us create a high-definition map [2,19].
Motivated by the preceding idea, we propose a novel method for road intersection recognition via combining a classification model and clustering algorithm based on GPS data. It includes two parts: one is center coordinate detection via combining classification model and clustering algorithm, and another is radius computing by integrating Delaunay triangulation with circle shape structure. Our contribution lies in three aspects:
- (1)
- We propose a novel approach of road intersection detection via combining the Extreme Deep Factorization Machine (xDeepFM) model and the Density-Based Spatial Clustering of Applications with Noise algorithm (DBSCAN). Experiments show that our approach reaches a higher precision compared with some state-of-the-art classification models and clustering algorithms.
- (2)
- A new method of radius computing is presented by integrating Delaunay triangulation with circle shape structure. It is able to compute the intersections’ radiuses with less error than Tang’s method [2], which is one of the typical methods in the field.
- (3)
- Some spatial features in Section 3.1 are proposed to figure out, and are inputted into xDeepFM together with geometric features. In addition to geometric features, spatial features explored from GPS data and the interactions among all features are also important to represent intersections’ semantics more accurately. Experiments in Section 4.1 show that spatial features do better than geographic features, and the interactions among all features by xDeepFM further improve the performance of road intersection detection.
The paper is organized as follows: Section 2 reviews the related work on recognizing road intersections from GPS trajectory data. Section 3 describes the proposed method to recognize road intersections. Section 4 presents a set of experimental results and analyses. Finally, the conclusions are discussed in the last section.
2. Related Work
Road intersection recognition is a hot spot at home and abroad. Road intersection recognition involves detecting intersections and recognizing its scope. There are few works on intersections’ scope recognition. The existing methods always focus on road intersection detection. The state-of-the-art methods are divided into clustering-based methods and classifying-based methods. Related works are collected in Table 1.
The clustering-based methods generate a center coordinate of road intersections. The center coordinate is represented by the form of “(longitude, latitude)”. Wu’s method [15] computes the turning angle to acquire the turning points. It uses the points to extract the new points nearer the center of road intersections, clusters the points, and generates the center coordinate of road intersections. Tan’s method [16] defines a road intersection as the area where cars left high dense turning trajectories. It clusters the turning curves into the center coordinate of road intersections. It then uses the concentric circle algorithm to compute the radius of road intersections. Finally, the radius of the road intersection computes the driving direction of the road intersection. Li’s method [17] uses the Mean Shift clustering algorithm to merge the road centerline. It combines the Principal Component Analysis (PCA) algorithm and Deep First strategy to ensure the road shape and uses the line intersection to detect road intersections. Tang’s method [2] extracts the turning point pairs and clusters them based on angle and distance thresholds. For distinguishing different road intersections, it clusters the turning points using a local-based point connection clustering (LPC) algorithm. Wang’s method [18] computes high-density areas between neighbor roads, using the Mean Shift clustering algorithm to cluster the high-density points. Deng’s method [20] defines that the hot spot analysis can distinguish whether an area is a road intersection. It clusters the hot spot area points using Delaunay triangulation, generating the center coordinate of road intersections. Li’s method [1] is an integrating strategy. In the vector space, it uses the Peak Density Clustering (PDC) algorithm to cluster the GPS points. In the grid space, it adopts a mathematical morphology algorithm to detect road intersections. Then, the vector and grid space results are merged, generating the center coordinate of road intersections. Xie et al. [21] detect the junction of common sub-trajectory points, evaluating the junctions using the Kernel Density Estimation (KDE) algorithm and generating road intersection coordinates. Xie’s method [22] uses dynamic planning (DP) to detect the common sub-trajectories of GPS data, linking the start point and the endpoint as a junction and using the KDE algorithm to detect the junctions, computing the location of road intersections.
The existing clustering-based methods always include two parts: one is selecting turning points from GPS data and extracting their geometric features, another is clustering them into center coordinates of road intersections. However, the accuracy of road intersection detection still has improvement room due to two drawbacks: (1) Besides geometric features, spatial features explored from GPS data and the interactions among all features are also important to represent intersections’ semantics more accurately, and (2) How to capture the points around intersections for clustering has great impact on the accuracy of intersection detection.
Another approach, the classifying-based methods, have recently caught some attention. It concentrates on how to determine whether an area is a road intersection. Fathi et al. [23] use many related map data to train the shape descriptor, determining where a sub-area is a road intersection. Gao’s method [13] maps the area into a grid set, constructing training data using the set. The K-nearest neighbor (KNN) model is used to classify where a sub-area is a road intersection. Wan et al. [19] split the trajectory into both turning direction and non-turning direction, using Hausdorff distance to compute the similarity between trajectories. The decision tree model is used to classify where a trajectory is a turning trajectory. The location of road intersections is determined by clustering the turning trajectories. Chen’s method [10] proposes an algorithm to compensate for the number of the turning point of low-frequency GPS data, using Delaunay triangulation to cluster the turning points. The clustering algorithm generates the area set, collecting the road intersection. Finally, the paper uses the thinning algorithm to filter the wrong road intersections.
The clustering-based methods mainly extract the turning points from GPS data and then cluster the turning points using different algorithms. The classifying-based methods often use geometric similarity to detect road intersections. Both turning angles and geometric similarity are also geometric features capable of detecting road intersections [2]. However, the state-of-the-art methods neglect the deep layer features, and the radius of road intersection needs to be computed. So, there are spaces to enhance the accuracy of road intersection recognition. Therefore, the paper proposes a method combining a classification model and a clustering algorithm to recognize road intersections. The method raises the accuracy of the center coordinate of road intersections and computes the radius of road intersections.
3. Material and Methods
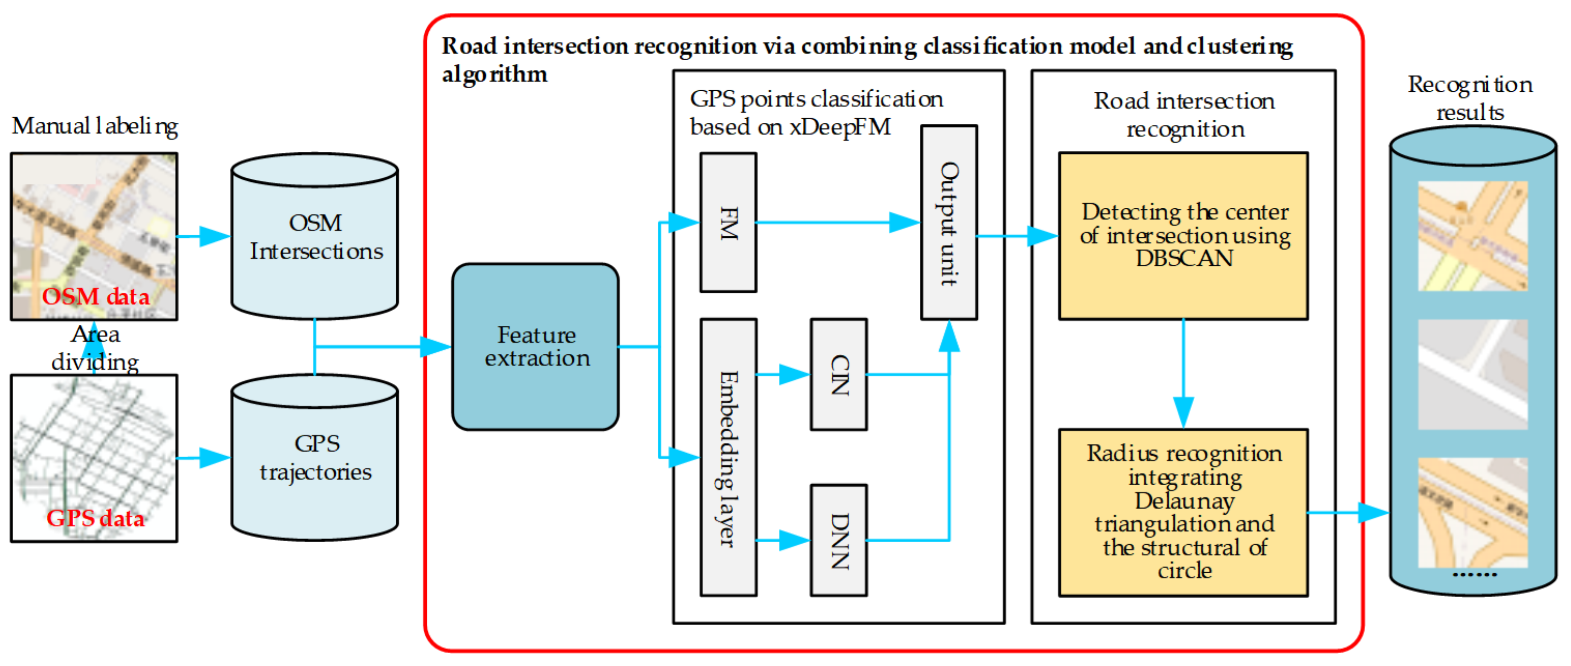
The framework of the proposed method is shown in Figure 1. Firstly, we extract geometric and spatial features of GPS points, and then merge them into a matrix. The feature matrix is inputted into the xDeepFM model for training. The trained xDeepFM model is applied for dividing GPS points into positive and negative points. The positive points are around the intersections and the negative points are not. Secondly, the positive points are clustered into the center coordinates of road intersections by the DBSCAN algorithm. Finally, the radius of road intersections is computed by integrating Delaunay triangulation with circle shape structure. Herein, we reckon the scope of an intersection as a circle shape which can be determined by the center coordinate and the radius.
3.1. Feature Extraction and the Classification Model
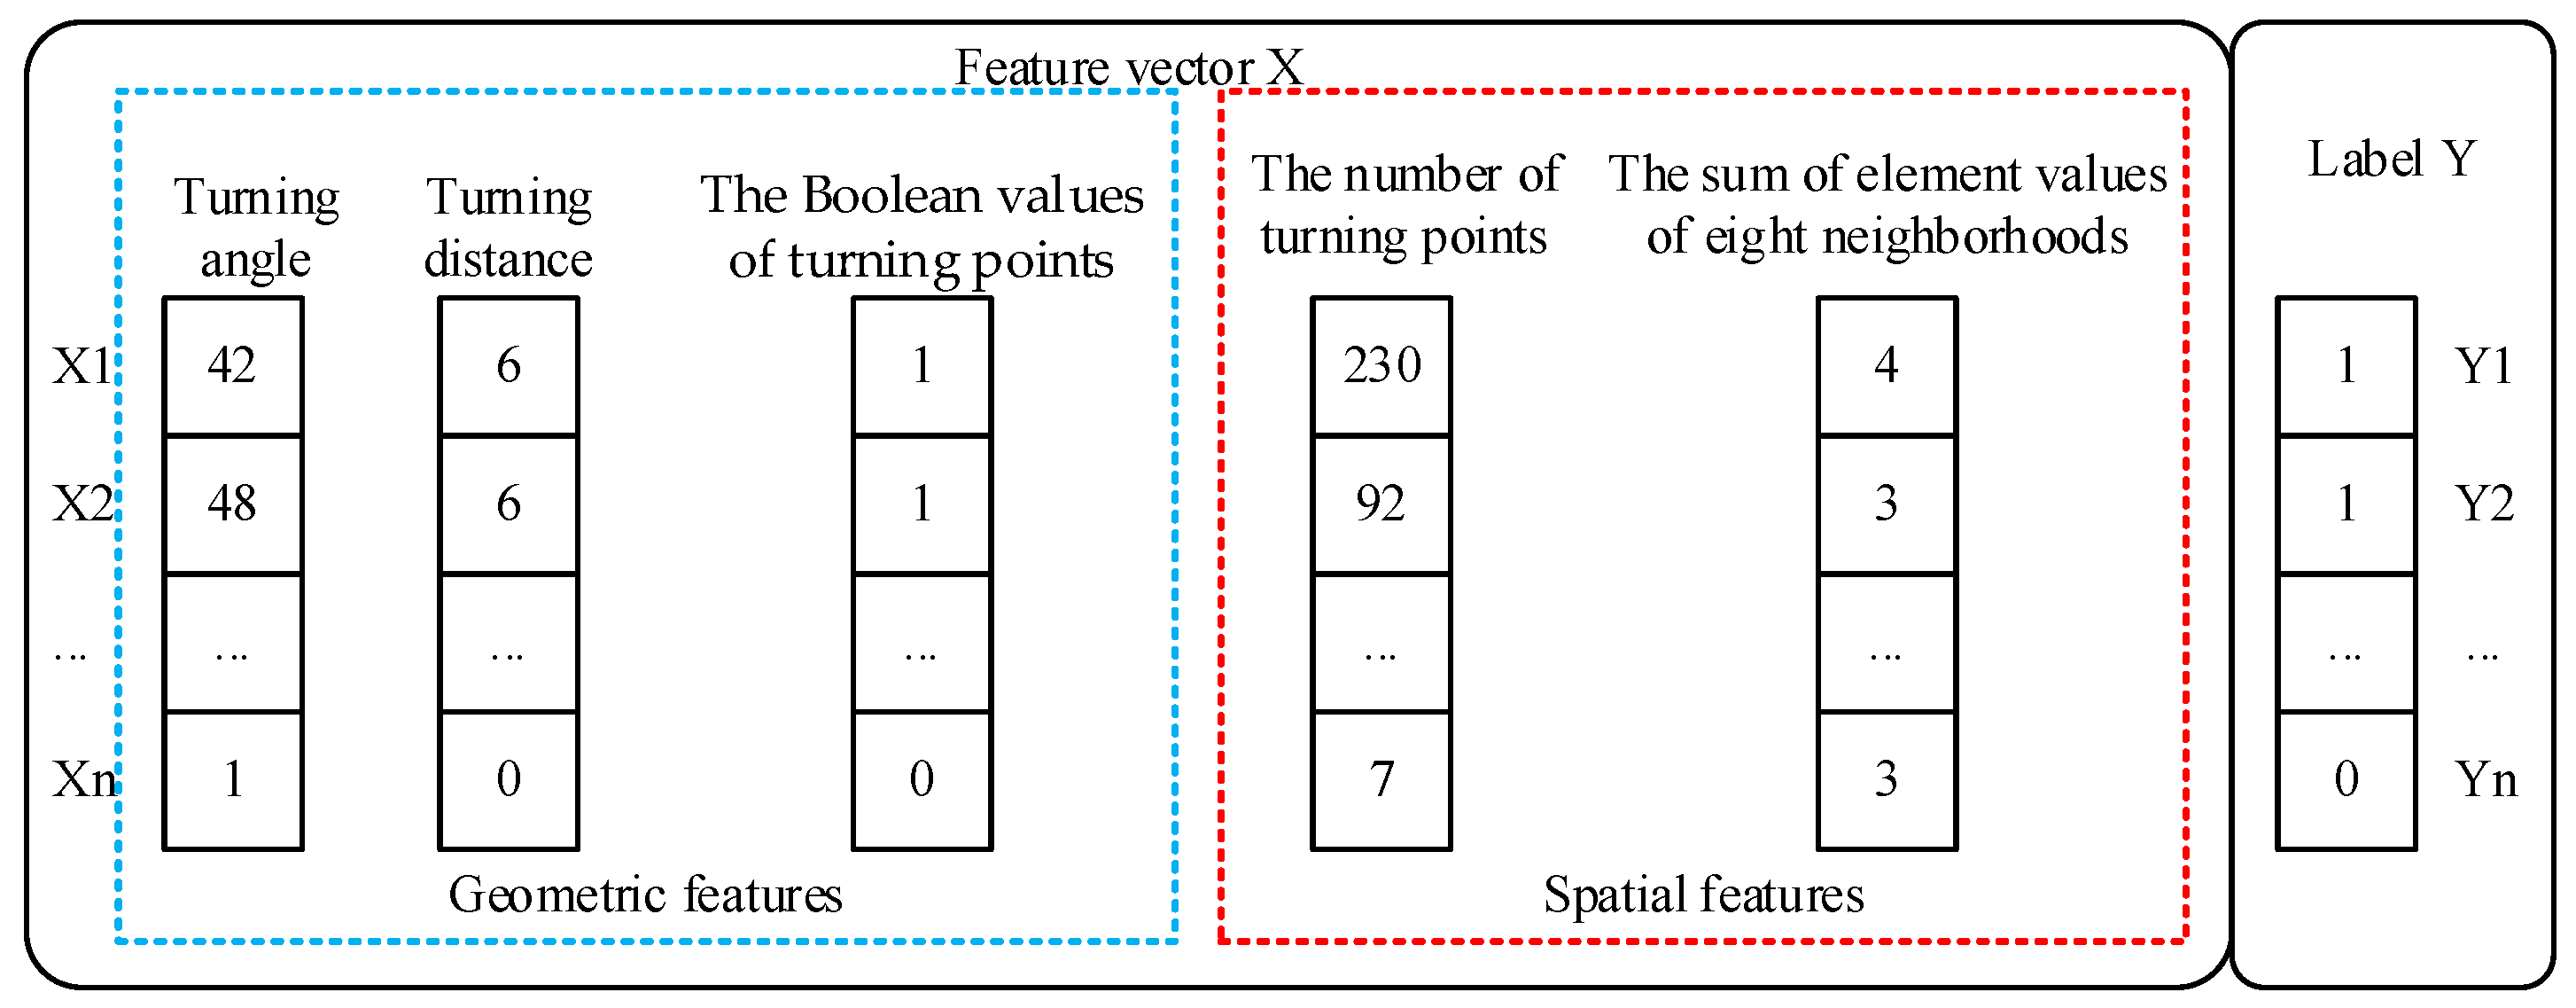
In addition to geometric features, spatial features explored from GPS data and the interactions among all features are also important to represent intersections’ semantics more accurately. Geometric features include turning angles, turning distances, and the Boolean values of turning points. Spatial features are included in the number of turning points and the sum of element values of eight neighborhoods. They are described as follows.
- (1)
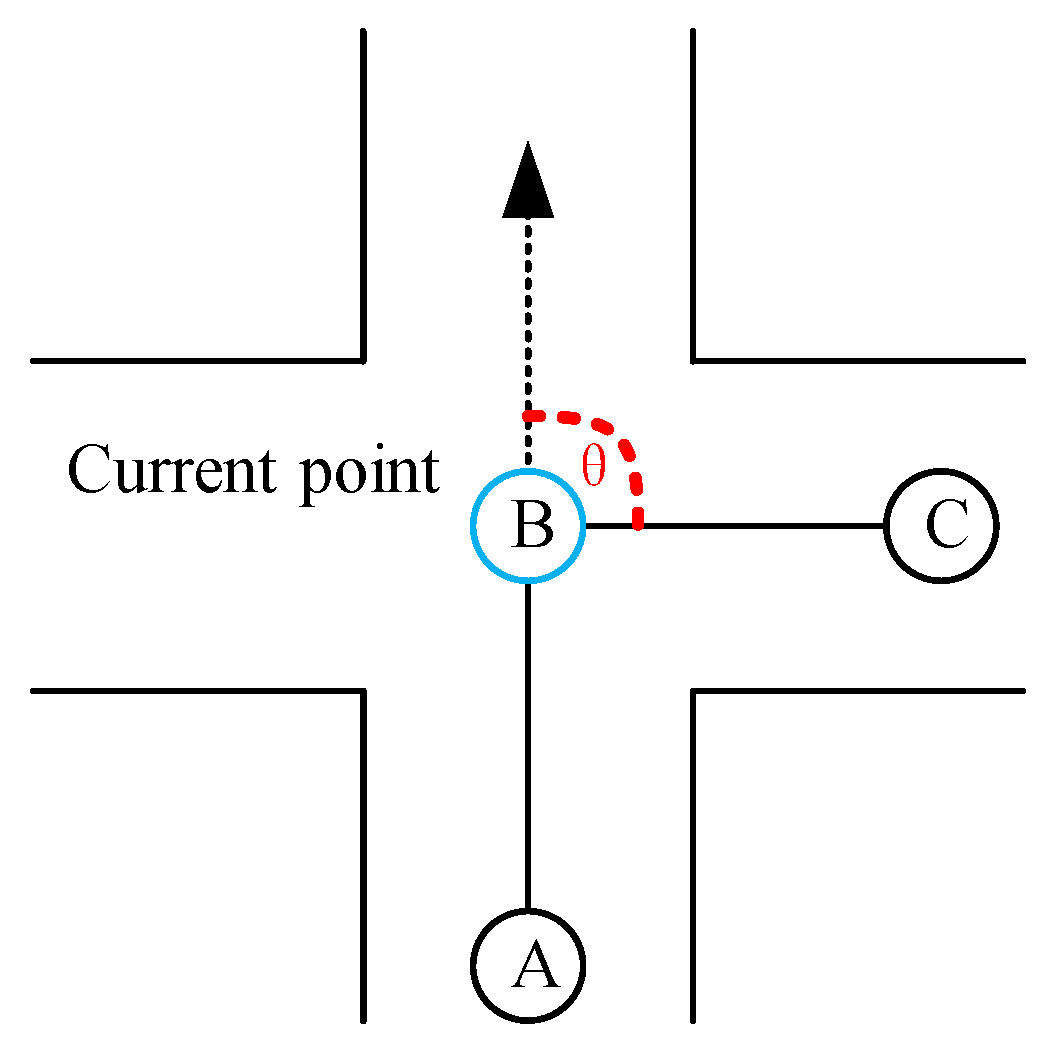
- Turning angles. The degree of changing direction is described as a turning angle. When the direction changes, the vehicle’s turning angle is larger than that of going straight [2]. The larger the turning angle of a trajectory point, the more likely it is to be at the intersection. In Figure 2, A, B, and C are the GPS points recorded in time order. The point B’s turning angle θ, shown as Figure 2, is calculated according to Equation (1).
- (2)
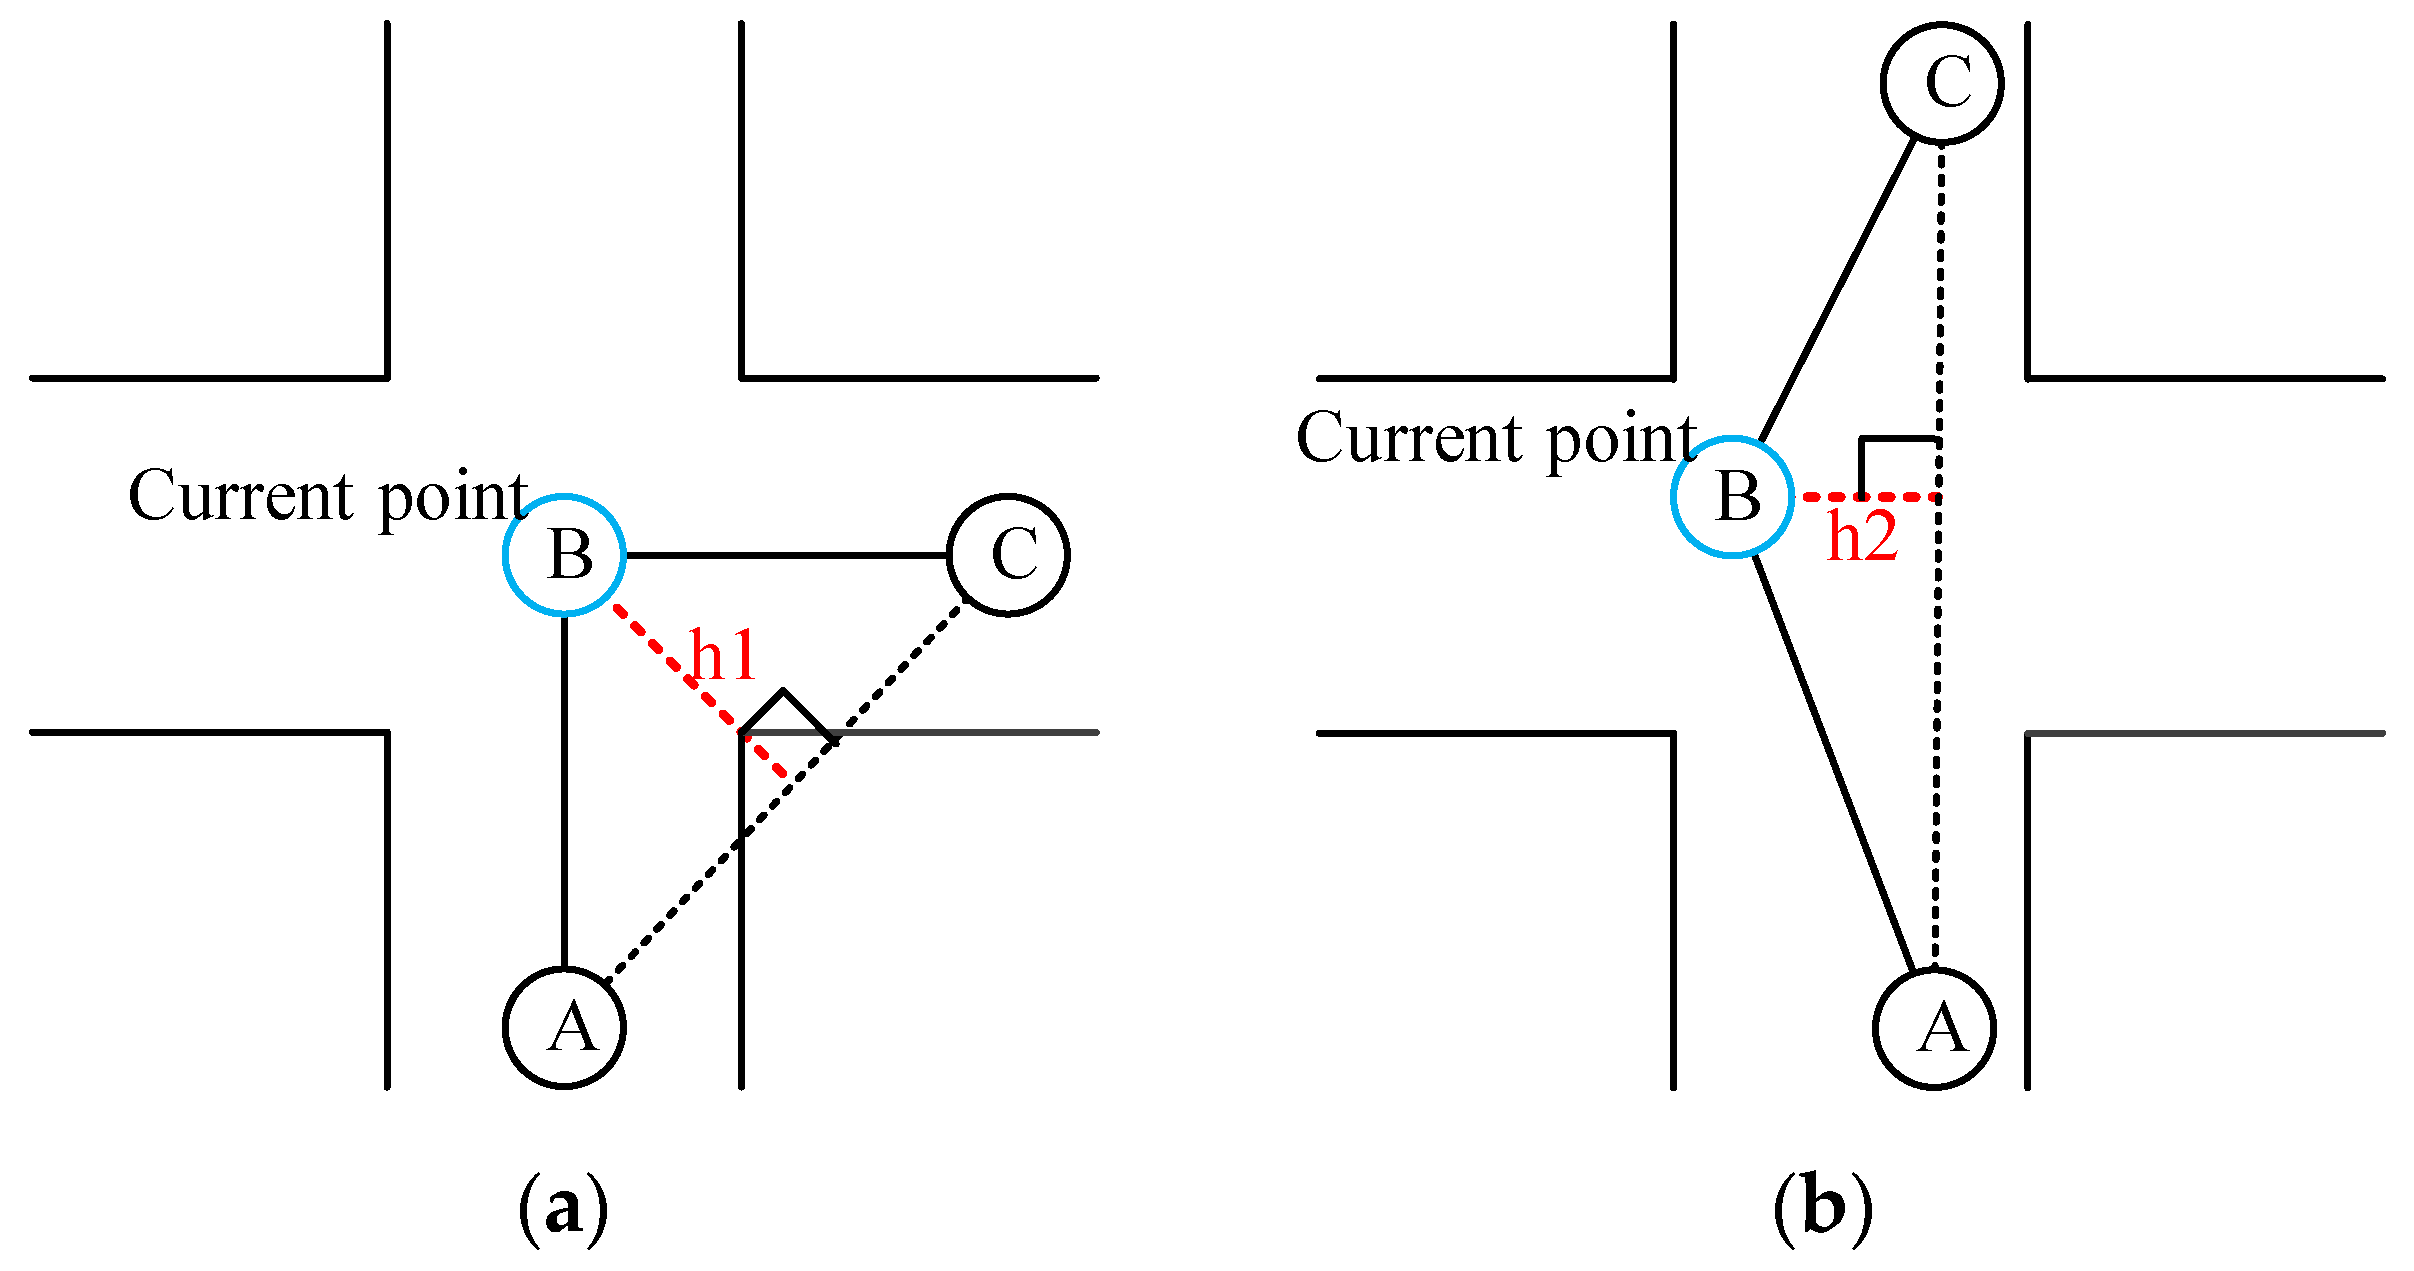
- Turning distances. The turning distance is the distance between the current point and the link line of its adjacent points. In Figure 3, A, B, and C are the GPS points recorded in time order. Figure 3a shows that h1 is point B’s turning distance. The value h1 is larger than h2 in Figure 3. It means that the turning distance generated when the vehicle changes direction is larger than that generated when the vehicle goes straight. The more the vehicle changes direction, the larger the turning distance. The larger the turning distance, the more likely the vehicle will be located within an intersection.
- (3)
- The Boolean values of turning points. In this paper, a point is a turning point if the point’s turning angle is larger than 15. Otherwise, it is a non-turning point. Usually, there are more turning points at intersections than at non-intersections [2]. Turning points are more likely to be at intersections than non-turning points.
- (4)
- The number of turning points. Wu et al. [15] believe that many turning points focus on an intersection, and intersection and non-intersection can be distinguished according to the density of turning points. Therefore, the number of turning points around a trajectory point is regarded as one of the features of this paper. The more turning points around a trajectory point, the higher the possibility that the trajectory point is located in an intersection.
- (5)
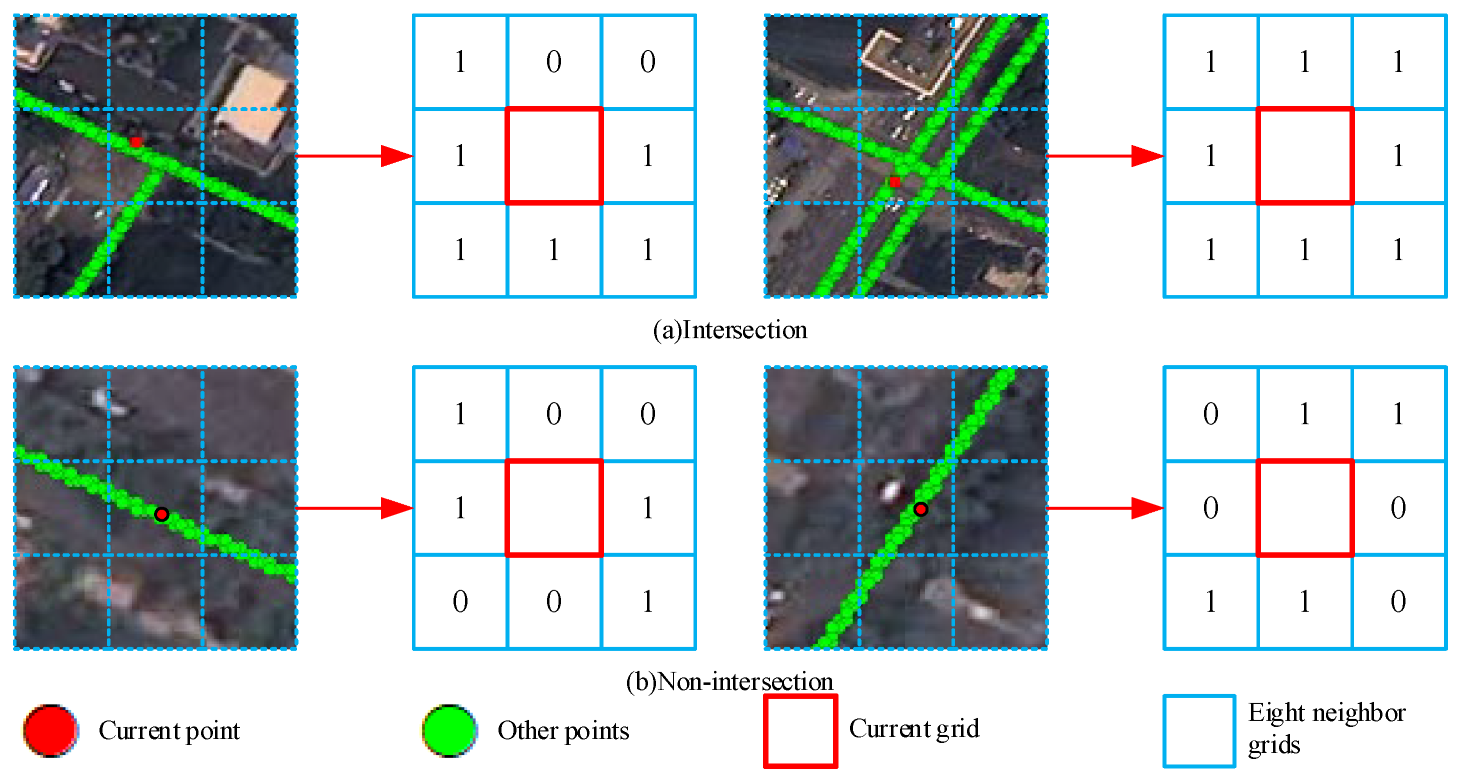
- The sum of element values of eight neighborhoods. In the literature [1], trajectory points are mapped to grids, and a method to determine intersection candidate points is proposed, which improves the accuracy of intersection center location detection. Therefore, this paper first uses a certain grid-scale to divide the experimental area. Then this paper maps trajectory points to corresponding grids and sets the element values of each grid. If there are points in the grid, the element value of the grid is 1; otherwise, it is 0.
The method to calculate this feature is shown in Figure 4. Firstly, the grid where each point is located is obtained. Secondly, the element values of the eight neighborhood grids around these grids are obtained. Finally, the values of the elements in the eight neighborhoods are added. The adding result is used as the value of the feature. The larger the sum of element values of eight neighborhoods of a trajectory point, the more likely it is to be at the intersection.
We manually label 110 intersections in the experimental area of the OpenStreetMap, and then each GPS point is labeled. We set a point’s label to 1 if the distance between the point and the center of the nearest intersection is smaller than the threshold; otherwise, it is 0. The points with label 1 are positive, and those with label 0 are negative. As shown in Figure 5, the feature matrix is constructed by three factors: the geometric features, the spatial features, and the labels.
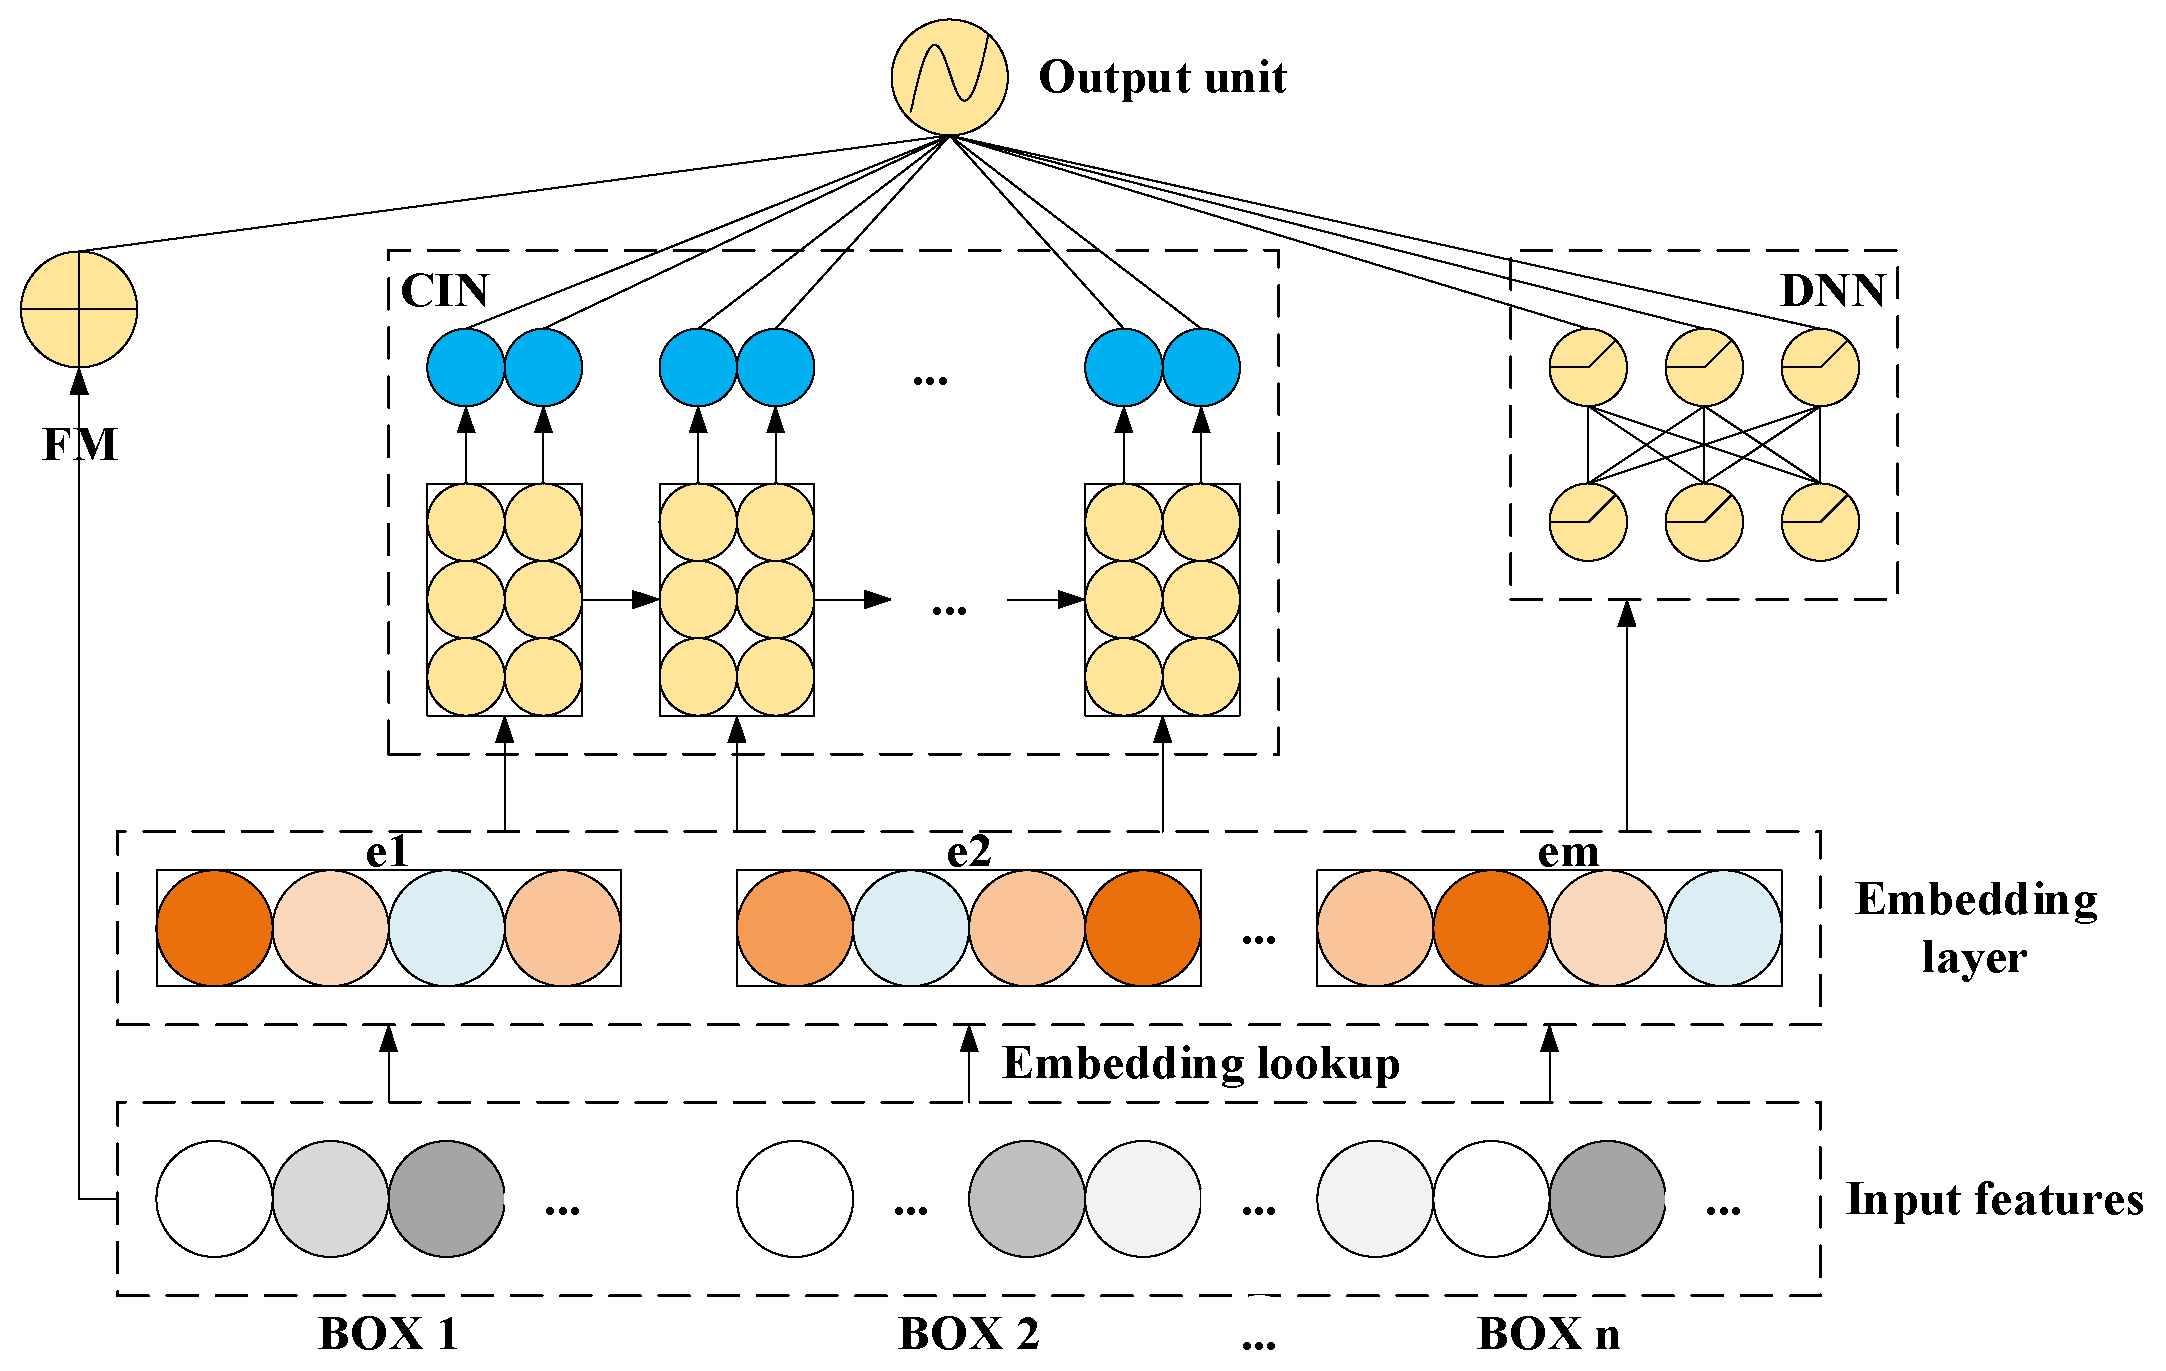
The Extreme Deep Factorization Machine (xDeepFM) model [24] is one of the state-of-the-art classification models. Its structure is shown in Figure 6, including a Factorization Machine (FM), a Deep Neural Network (DNN), and a Compressed Interaction Network (CIN). The FM part is used to extract the low-order feature interaction. The DNN part is used to capture the high-order and hidden feature interaction. The CIN part is used to dig out the surface feature interaction. These three parts share the same input and output the final classified result through normalization.
3.2. Road Intersection Recognition
In this paper, road intersection recognition involves detecting the center coordinate of the road intersections and computing the radius of the road intersection. We use clustering algorithms to capture the center coordinates of road intersections. To obtain excellent performance, we devise a comparison experiment in Section 4.3 among the K-means algorithm, the agglomerative hierarchical algorithm (AHC), and the DBSCAN algorithm. The result in Section 4.3 shows that the accuracy of the DBSCAN algorithm is higher than the others. The proposed algorithm, named center coordinate detection algorithm via combining classification model and clustering algorithm, is given as follows.
| Algorithm 1: Center coordinate detection algorithm via combining classification model and clustering algorithm. |
| Step 1: Initialize all the points as unvisited. Step 2: If all the points are visited, output cluster set C. Otherwise, randomly pick a point p from unvisited points and label it as visited. Step 3: p_neighbor is p’s neighbor points. Calculate p’s neighbor number p_num. Step 4: If p_num is larger than the threshold N, build an array c and an array X. Collecting p into c and collecting p_neighbor into X. Otherwise, labeling p as noise. Step 5: If all the points in X are visited, go to Step 8. Otherwise, select an unvisited point in X and label it as visited. Step 6: Count the number x_num of x’s neighbor points. x_neighbor represents x’s neighbor points. Step 7: If x_num is bigger than N, collect x into c, collect x_neighbor into X, and go back to Step 5. |
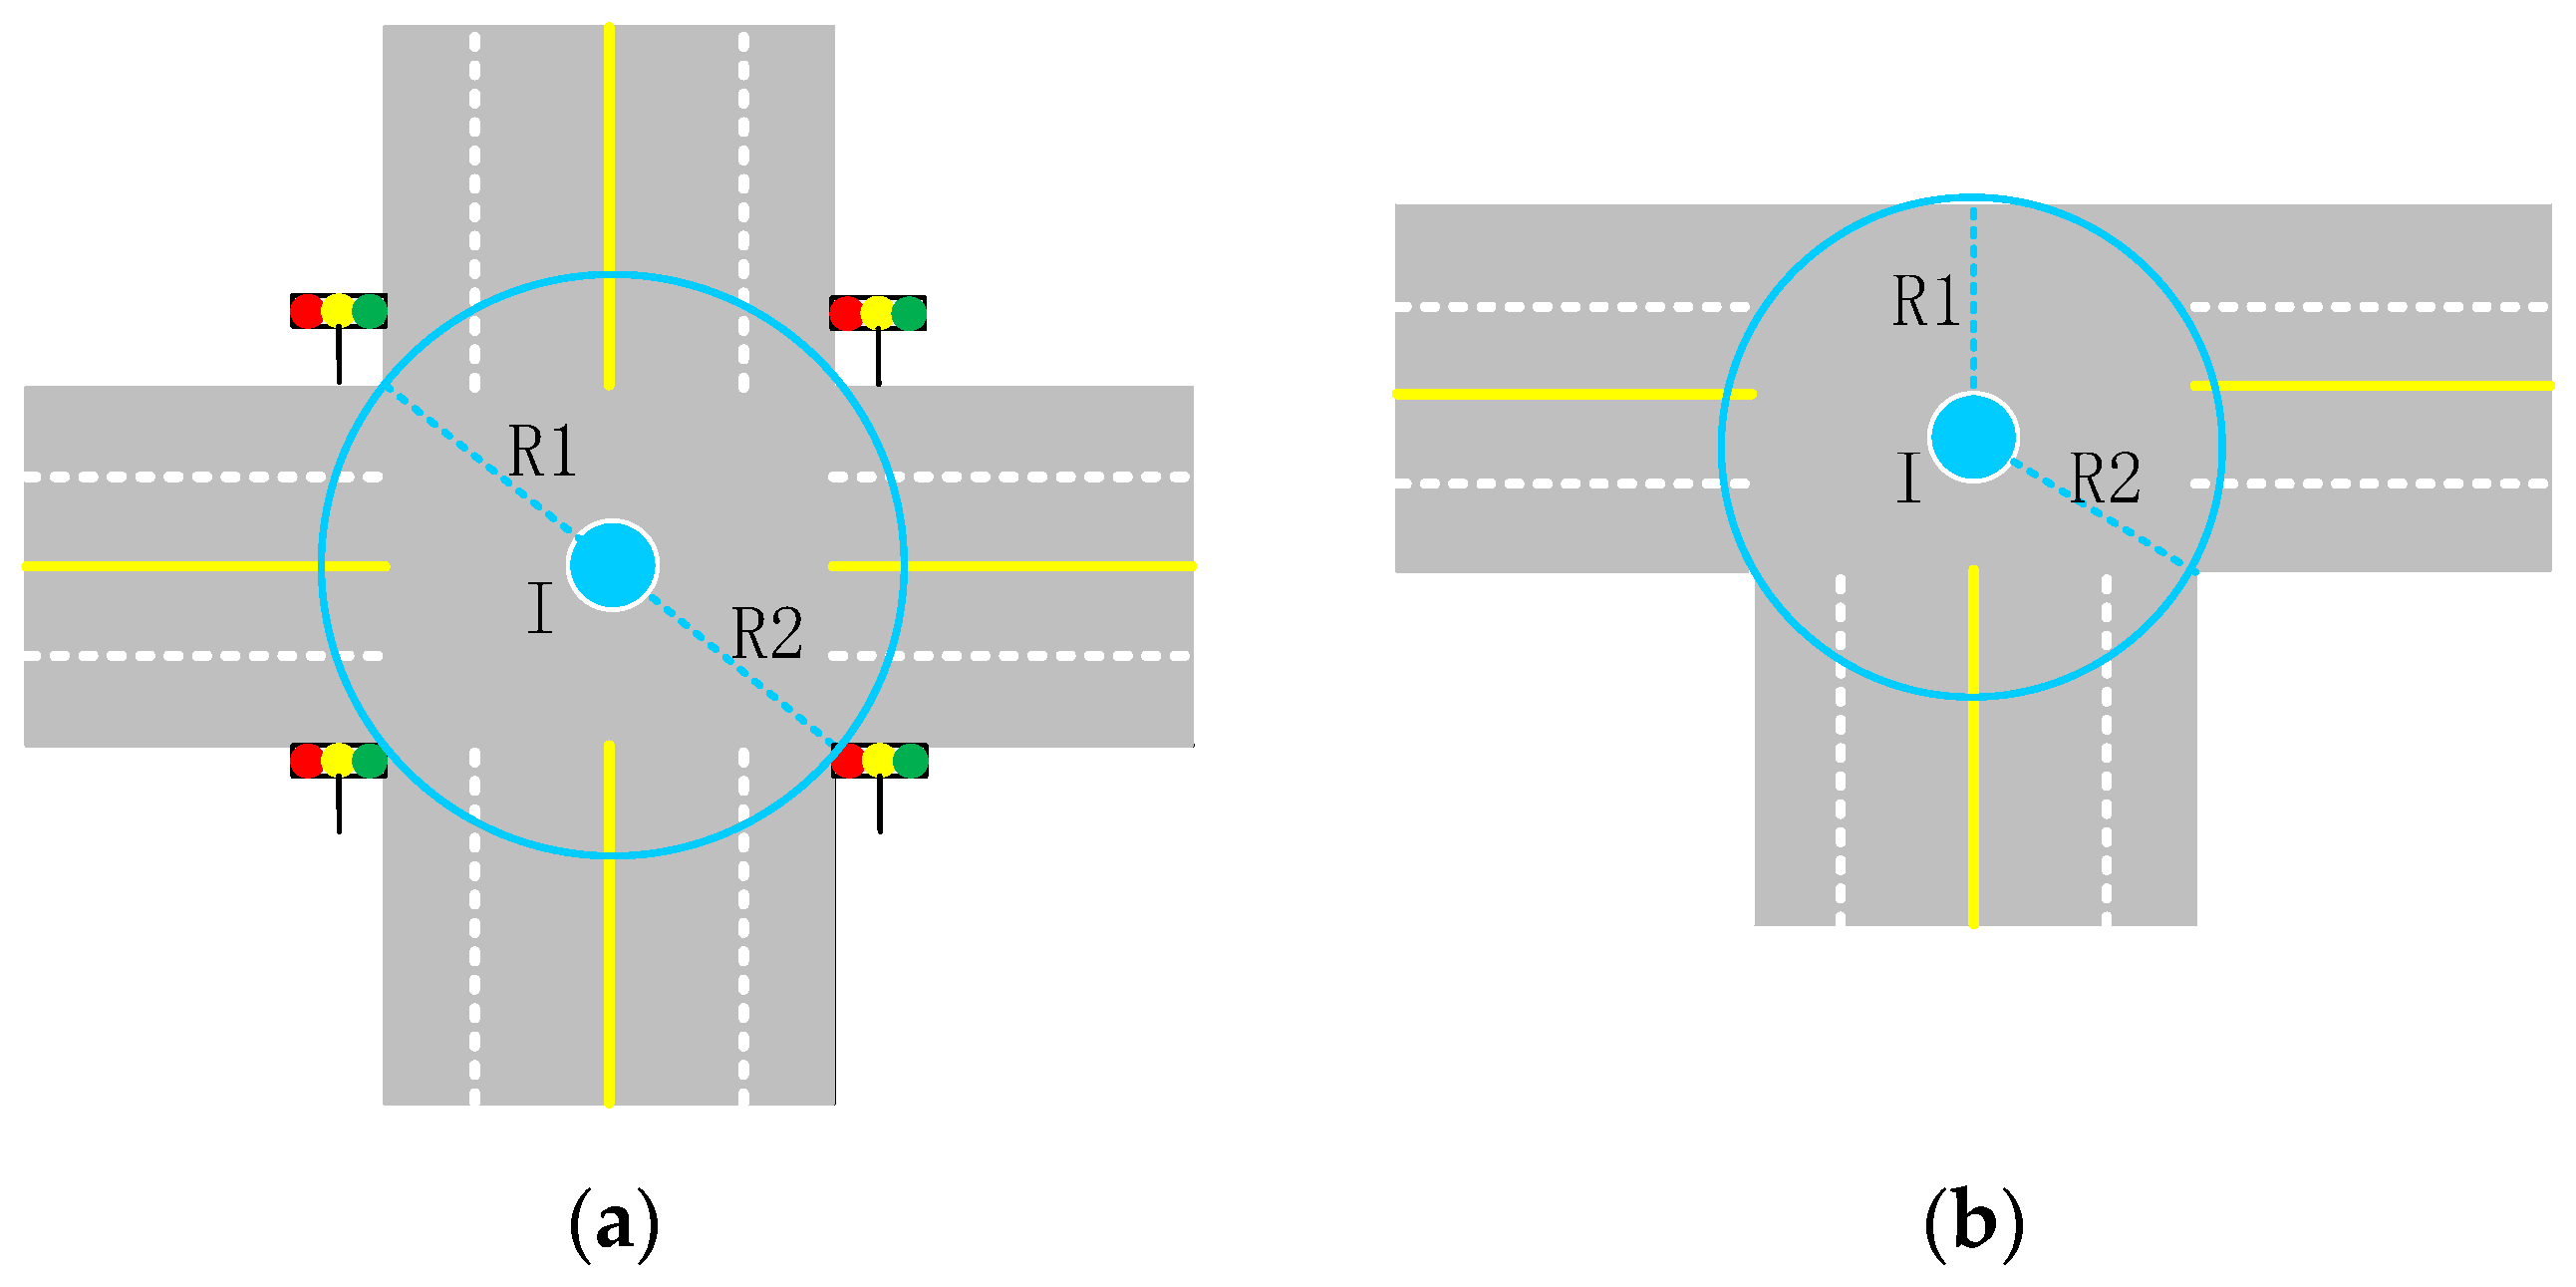
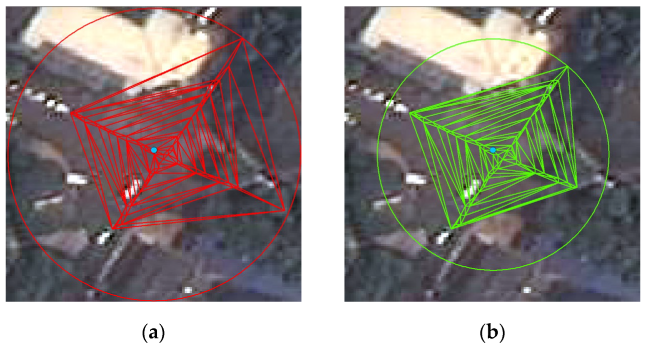
The radius of a road intersection is calculated after center coordinate detection. We reckon the area of a road intersection as a circle, shown as the area I within the blue circle in Figure 7. Its radius is the average of R1 and R2. Both R1 and R2 are manually labeled according to remote sensing images for evaluation in Section 4.2. We propose to integrate the Delaunay triangulation algorithm with the circle shape for figuring out intersections’ radiuses. The circle shape is the same as the literature [2]. For a cluster, some points may be far from others which are named outlier points. Tang et al. [2] calculate the distance between the cluster center and the farthest point as the intersection’s radius. This way causes unacceptable errors easily because of the outlier points. To delete these outlier points, we adopt the Delaunay triangulation algorithm [25,26] because it is helpful for capturing proximity relationships among spatial points [10]. The method can be implemented by Algorithm 1.
In this paper, the proximity is the length of two near points. The method can be implemented by Algorithm 2.
| Algorithm 2: Radius computing algorithm by integrating Delaunay triangulation with circle shape structure |
| Step 1: For a cluster c in C, compute its central location and label it as intersection I. Step 2: Use Delaunay triangulation in c and label the result as D. Step 3: Compute the length of each edge as e, and collect them in an ascending array Y. Step 4: Select the e at the top L% labeling as e_length, delete the edges that the length is bigger than e_length, and remove the points linked to those edges. Step 5: Compute the distance between the remaining points in c and intersection I, and use the max distance as the radius of intersection I. |
In Figure 8a, the red circle is the intersection radius before the outlier points are eliminated. After removing the outlier points, the radius of the road intersection is the green circle in Figure 8b.
In our experiments, we use the GPS data of taxis trajectory within 2 km of Wenwu Road in Chengdu. The area is about 2 km × 2 km. The data is provided by the DiDi chuxing GAIA plan project, containing DRIVER ID, ORDER ID, LATITUDE, LONGITUDE, and TIMESTAMP. The data were collected from 1–7 November 2016, including 535,875 orders and 53,655,575 GPS trajectory points. In this dataset, a set of trajectory points with the same ORDER ID represents a taxi trajectory. To calculate the features of the trajectory points, we divide the trajectory points into different groups. A group represents a trajectory segment. Trajectory points with the same ORDER ID are in the same group. Some trajectories which only contain a few points are not conducive to feature extraction. So, we delete the trajectories, which is less than 4 points.
4. Results and Discussion
The experiment environment of the paper is equipped with a Core i5 CPU, 8GM RAM, and Windows 10. Python is used to implement the proposed method. The paper uses the packages containing Pytorch, Sklearn, and Folium to construct the tool to visualize experiment results and qualifies the experimental accuracy.
4.1. Performance Evaluation of Road Intersection Detection
To estimate the performance of road intersection detection, we compare some typical classification models, such as the K-nearest neighbor (KNN) model [13], Logistic regression (LR) model [27], the Factorization machine (FM) model [28], and the Deep factorization machine (DeepFM) model [29]. In the experiments, we adopt DBSCAN [30] as the clustering algorithm.
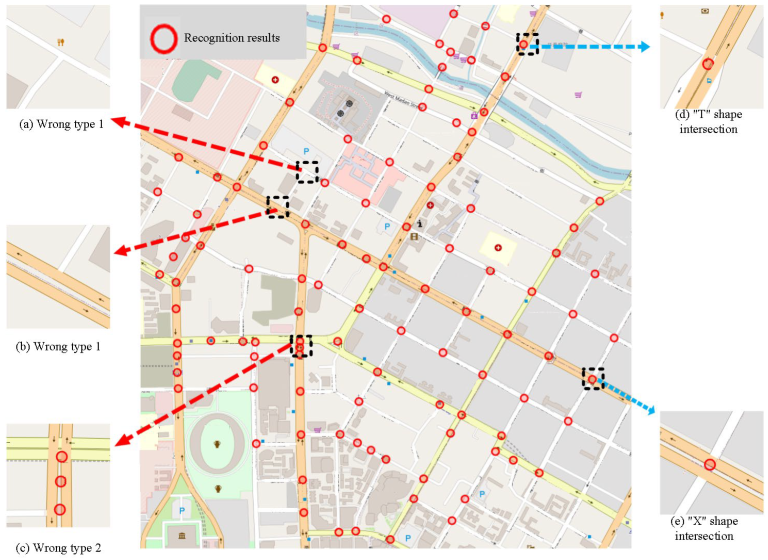
Figure 9 shows the road intersections detected by the proposed method in the experimental area. The red circles are the intersections’ positions. Figure 9a–c give some examples of the wrong detection types. The wrong type 1 (WT1) means the type of undetected intersections. The reason is that GPS points around an intersection are too sparse to obtain a cluster corresponding to the real intersection by DBSCAN. The wrong type 2 (WT2) is the type of wrongly detected intersections. It always occurs when two intersections are so close that they are clustered into a wrong intersection. Figure 9d-e give some examples of the matched intersections, containing “X” shape and “T” shape intersections.
We adopt OpenStreetMap as the referenced road network. The intersections labeled by OpenStreetMap are regarded as ground truths. Herein, we set a matching area which is referred to in the literatures [2,13] to judge whether the detected intersections are consistent with OpenStreetMap. If the distance between a detected intersection and its corresponding ground truth is shorter than the radius of the matching area, we reckon it as a right hit of road intersection detection. The matching area’s radius is also called the distance threshold. The detection performance is evaluated by the metrics such as Precision, Recall, and F-measure. Table 2 gives the evaluation results.
We can draw two conclusions from Table 2: (1) The performance of different methods rises with the increasing matching areas. (2) Our proposed method obviously outperforms other methods. Especially when the radius of the matching area is 30 m, the metrics of Precision, Recall, and F-measure respectively obtain 99%, 92.7%, and 95.8%. The KNN model is uneasy to construct feature interactions. The LR model is linear, lacking feature interaction. The FM model can build the second-order feature interaction, but it cannot learn the high-order feature interaction. The DeepFM cannot learn the feature interaction surface. The feature interaction it learned is uncontrollable [24]. The xDeepFM model builds the low-order and high-order feature interaction and constructs the hidden and surface feature interaction, making the accuracy of detecting the center coordinate splendid.
4.2. Performance Evaluation of Radius Computing
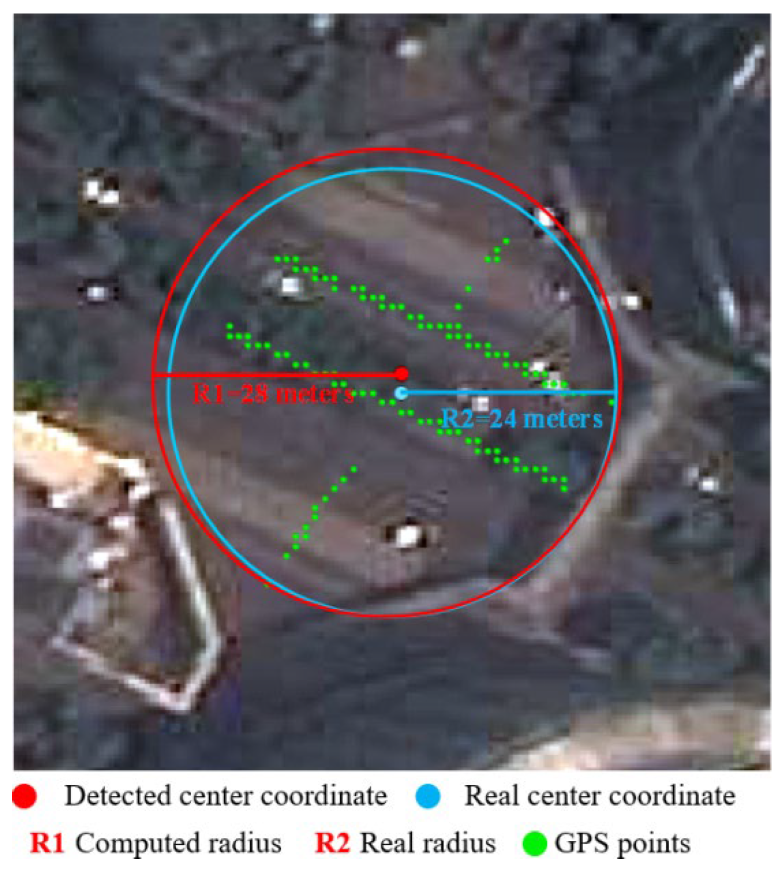
Figure 10 shows the radius of one of the road intersections. The blue point represents the location of the road intersection of OpenStreetMap. The blue circle is the radius of the road intersection of OpenStreetMap. The green points are the positive points. The red point represents the detected center coordinate of a road intersection. The red circle is the computed radius of a road intersection. The average error of the radius, , quantifies the computed radius. The can be calculated in Equation (2).
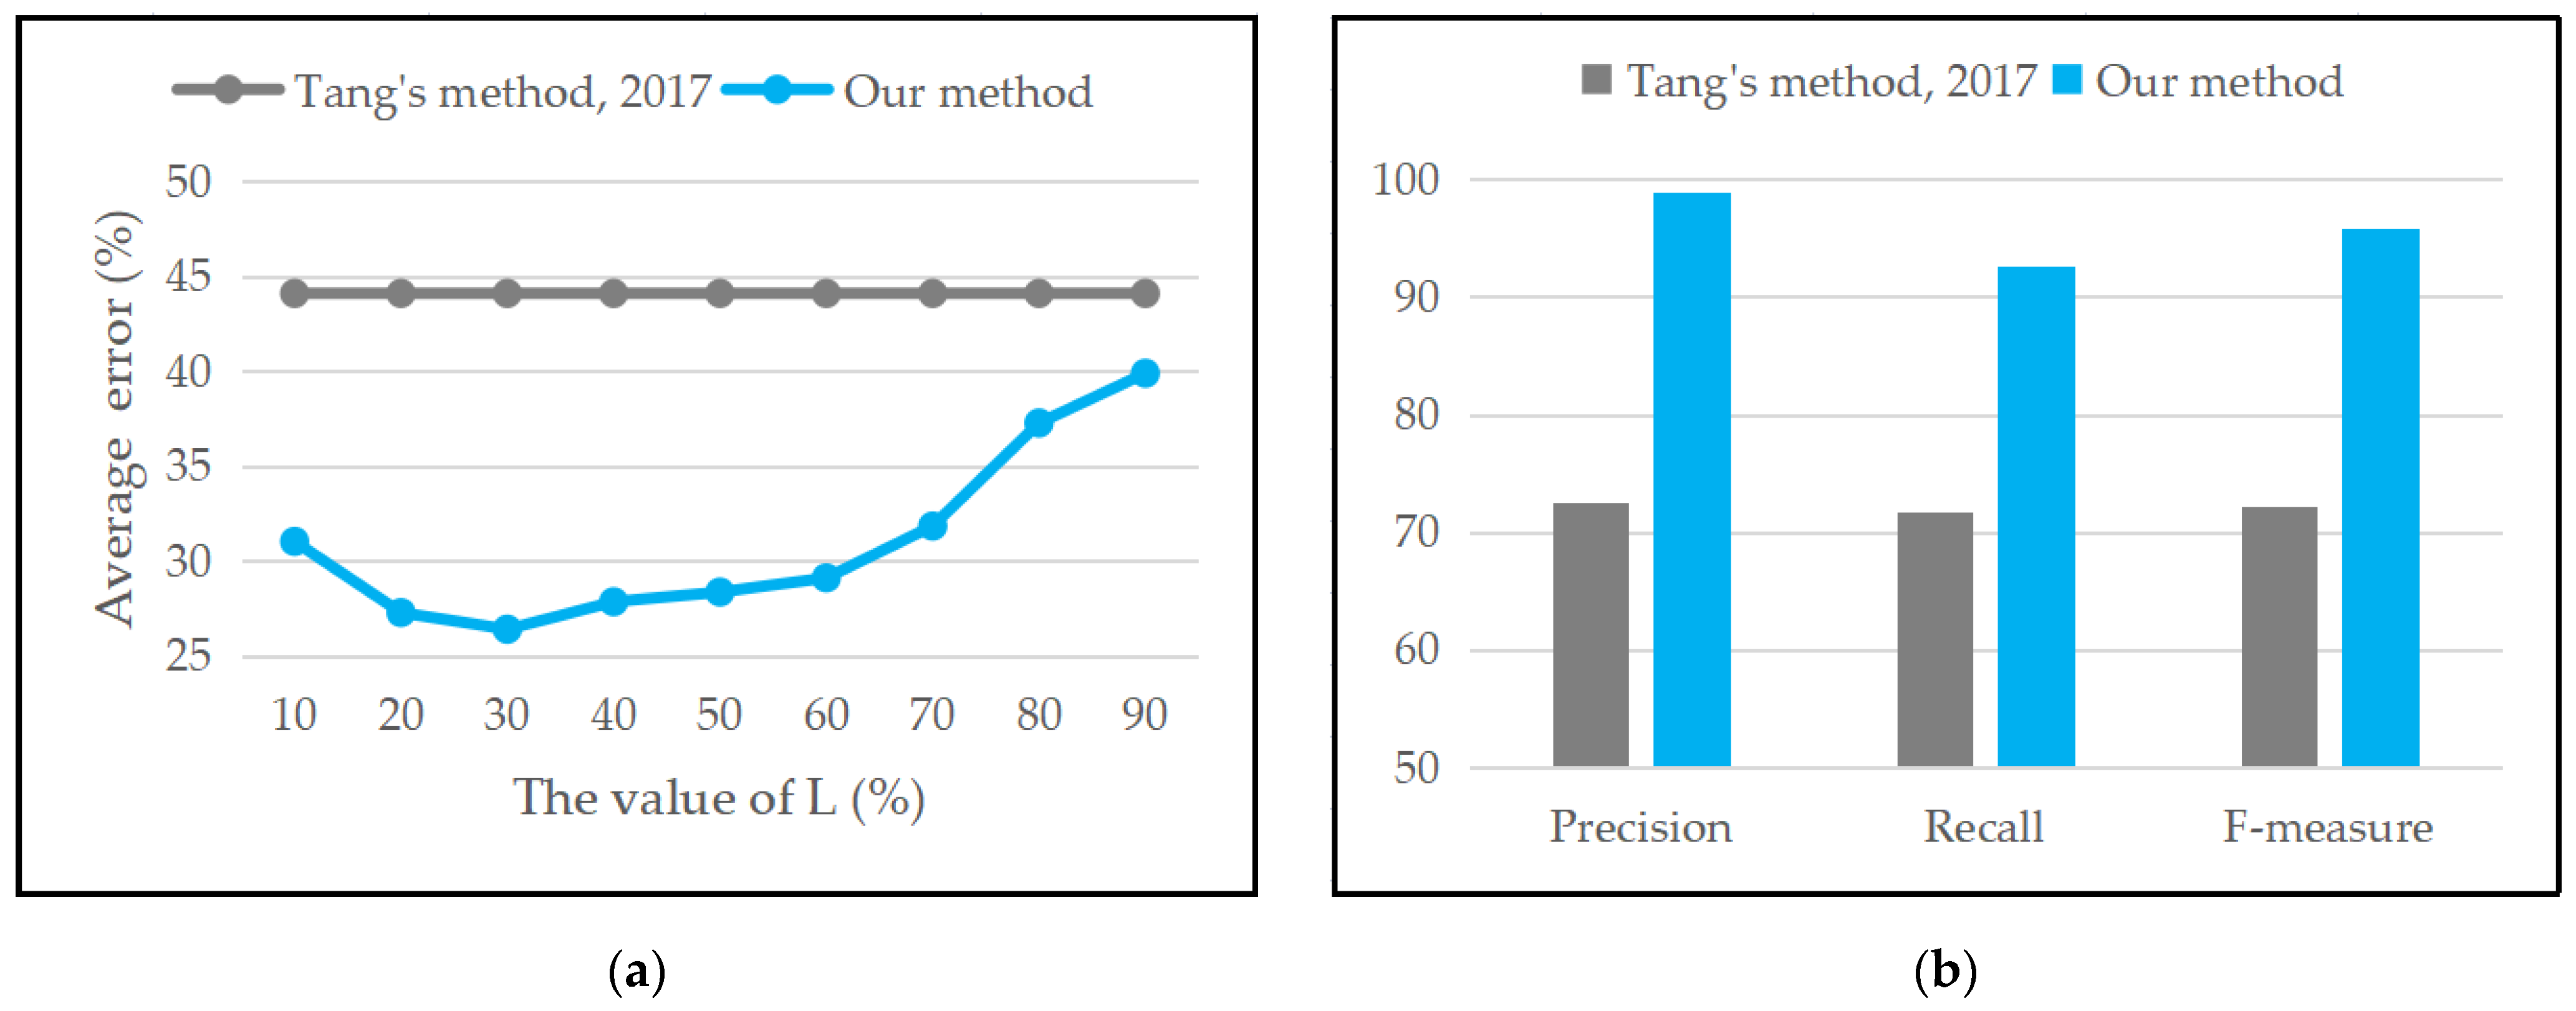
is the number of detected road intersections. represents the computed radius of road intersections. is the manually tagged radius of road intersections. The lower the value is, the lower the error of the calculated intersection radius is, and the more accurate the calculation result of the intersection radius is. The computing radius and comparison experiment results are shown in Figure 11.
In Figure 11a, Y-axis is the , and X-axis is the top L% edges in the array after the process of Delaunay triangulation. In Delaunay triangulation, the points that link to the edges of the lengthier than the top L% are deleted. The radius computed by Tang’s method [2] is the max distance between the cluster center and the farthest point, the straight gray line with 44.11% in Figure 11a. It can be learned from Figure 11a that the error of the proposed method is smaller than Tang’s method [2]. When the value of L is 30%, the is the smallest, getting 26.5%. The Delaunay triangulation algorithm is able to eliminate the outliers inside intersections. So it makes the calculation of the intersection radius more accurate, and experimental results prove it.
4.3. Performance Comparison of Clustering Algorithms and Feature Matrixes
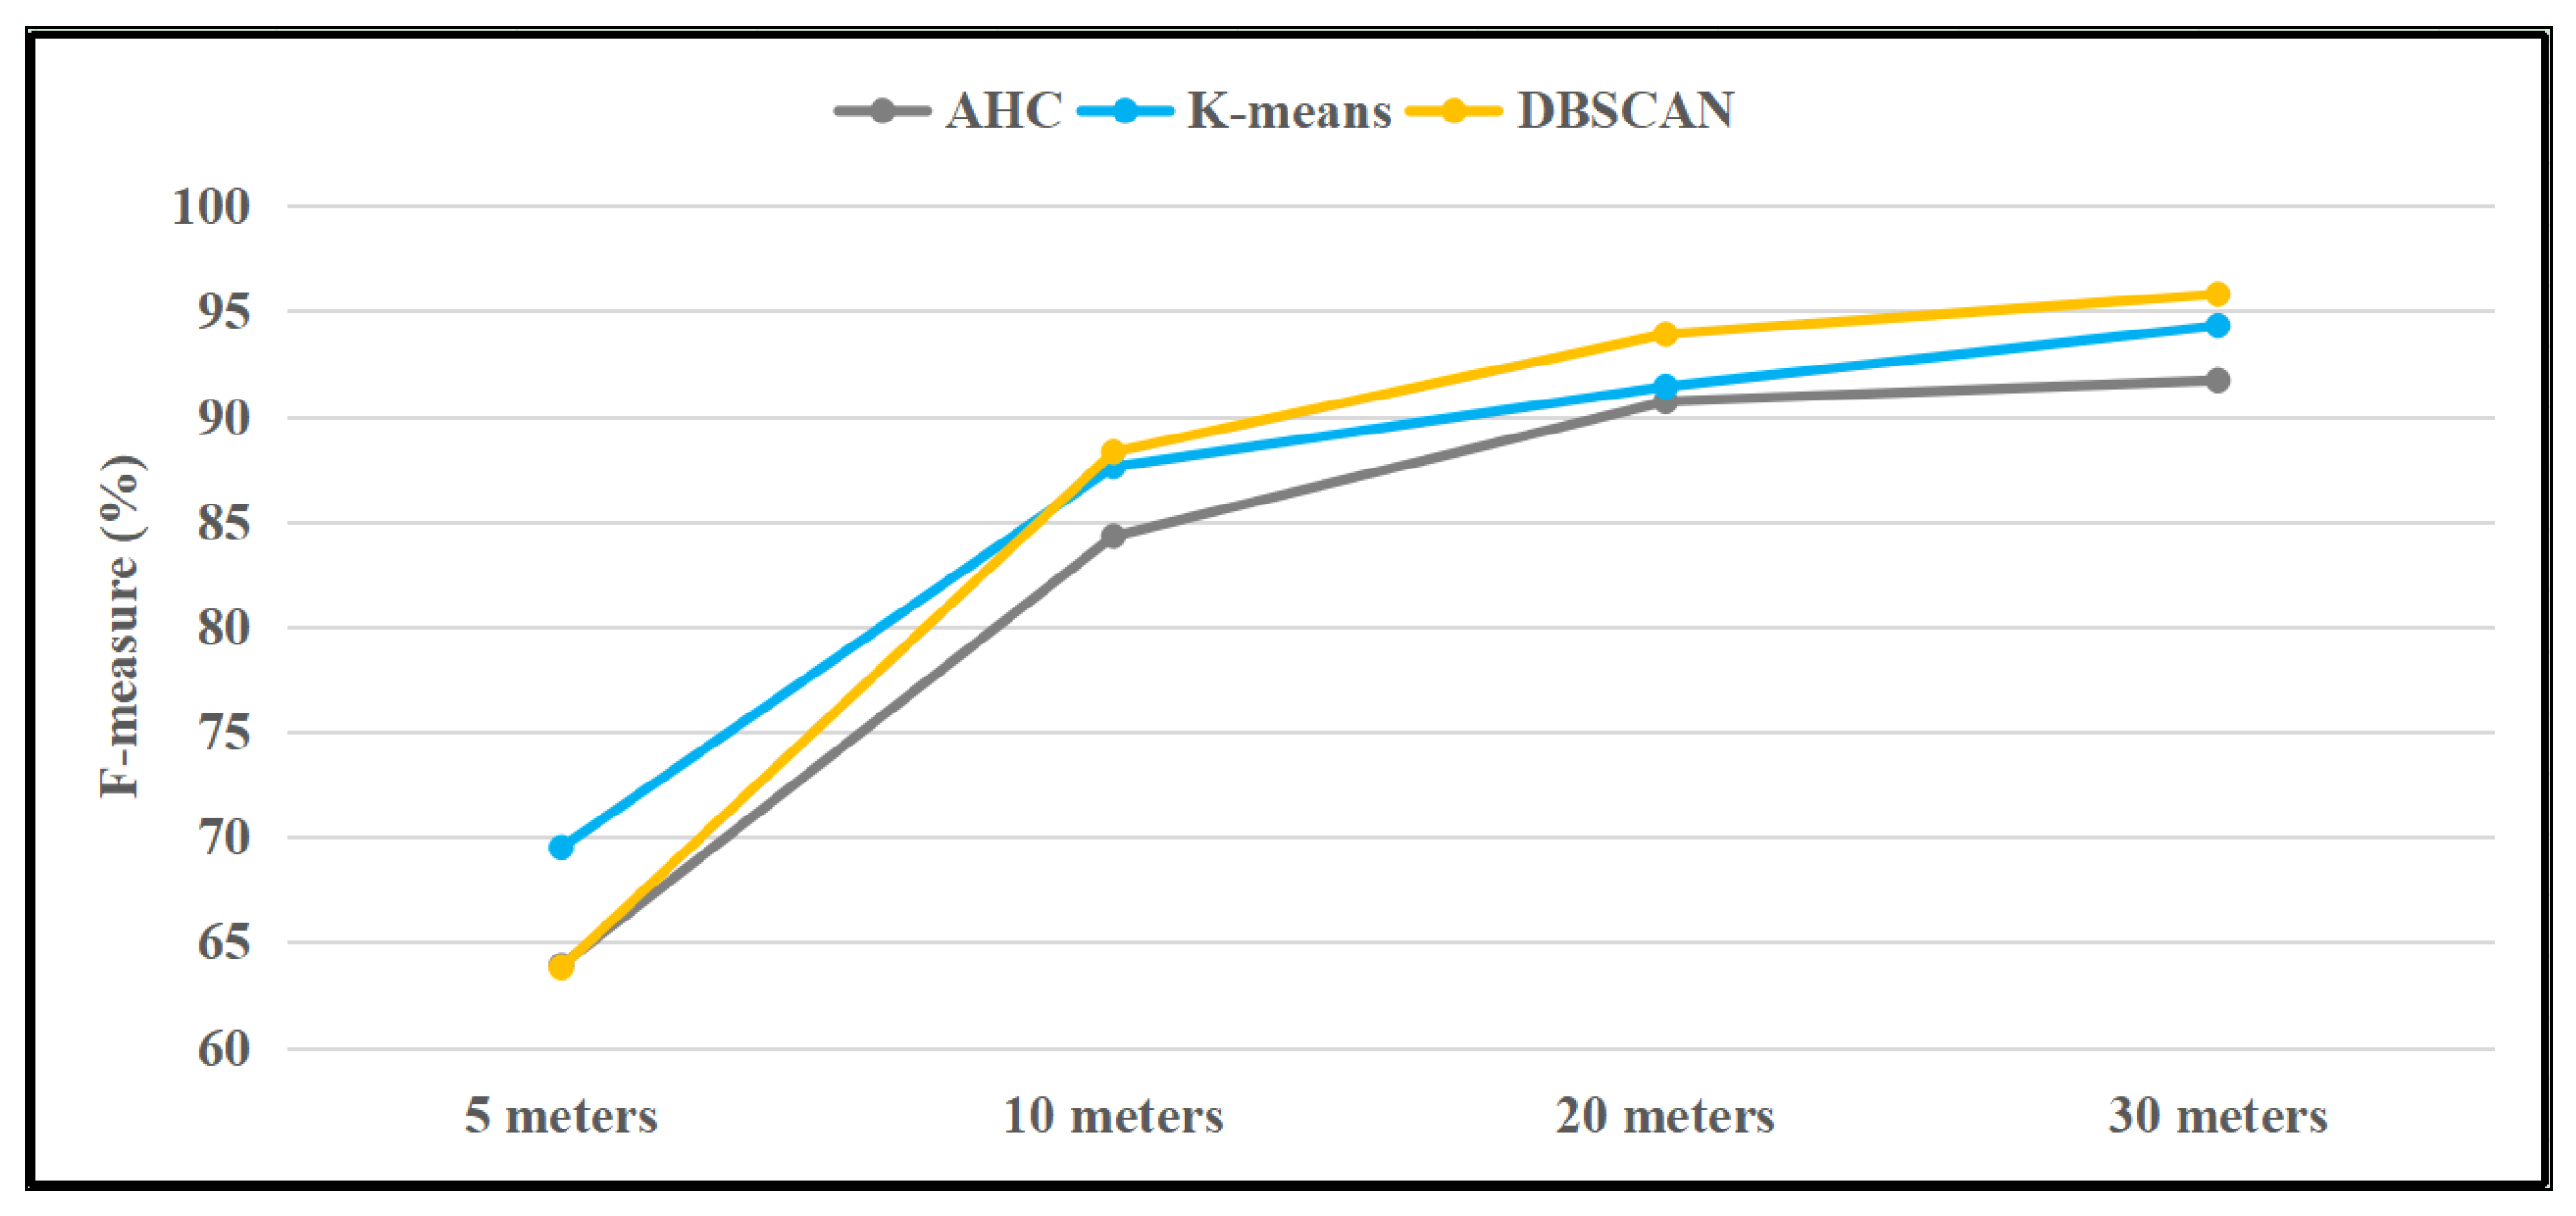
To select a suitable clustering algorithm for our approach, we devise a comparison experiment among three typical clustering algorithms: the Agglomerative Hierarchical Clustering algorithm (AHC), the K-means clustering algorithms (K-means), and the Density-Based Spatial Clustering of Applications with Noise algorithm (DBSCAN). The comparison results are shown in Figure 12. We observe that the DBSCAN algorithm outperforms other cluster algorithms when the matching area is larger than 10 m. The AHC algorithm is better than K-means. Its F-measure is 91.7% and the F-measure of the DBSCAN algorithm reaches 95.8%.
4.4. Discussion
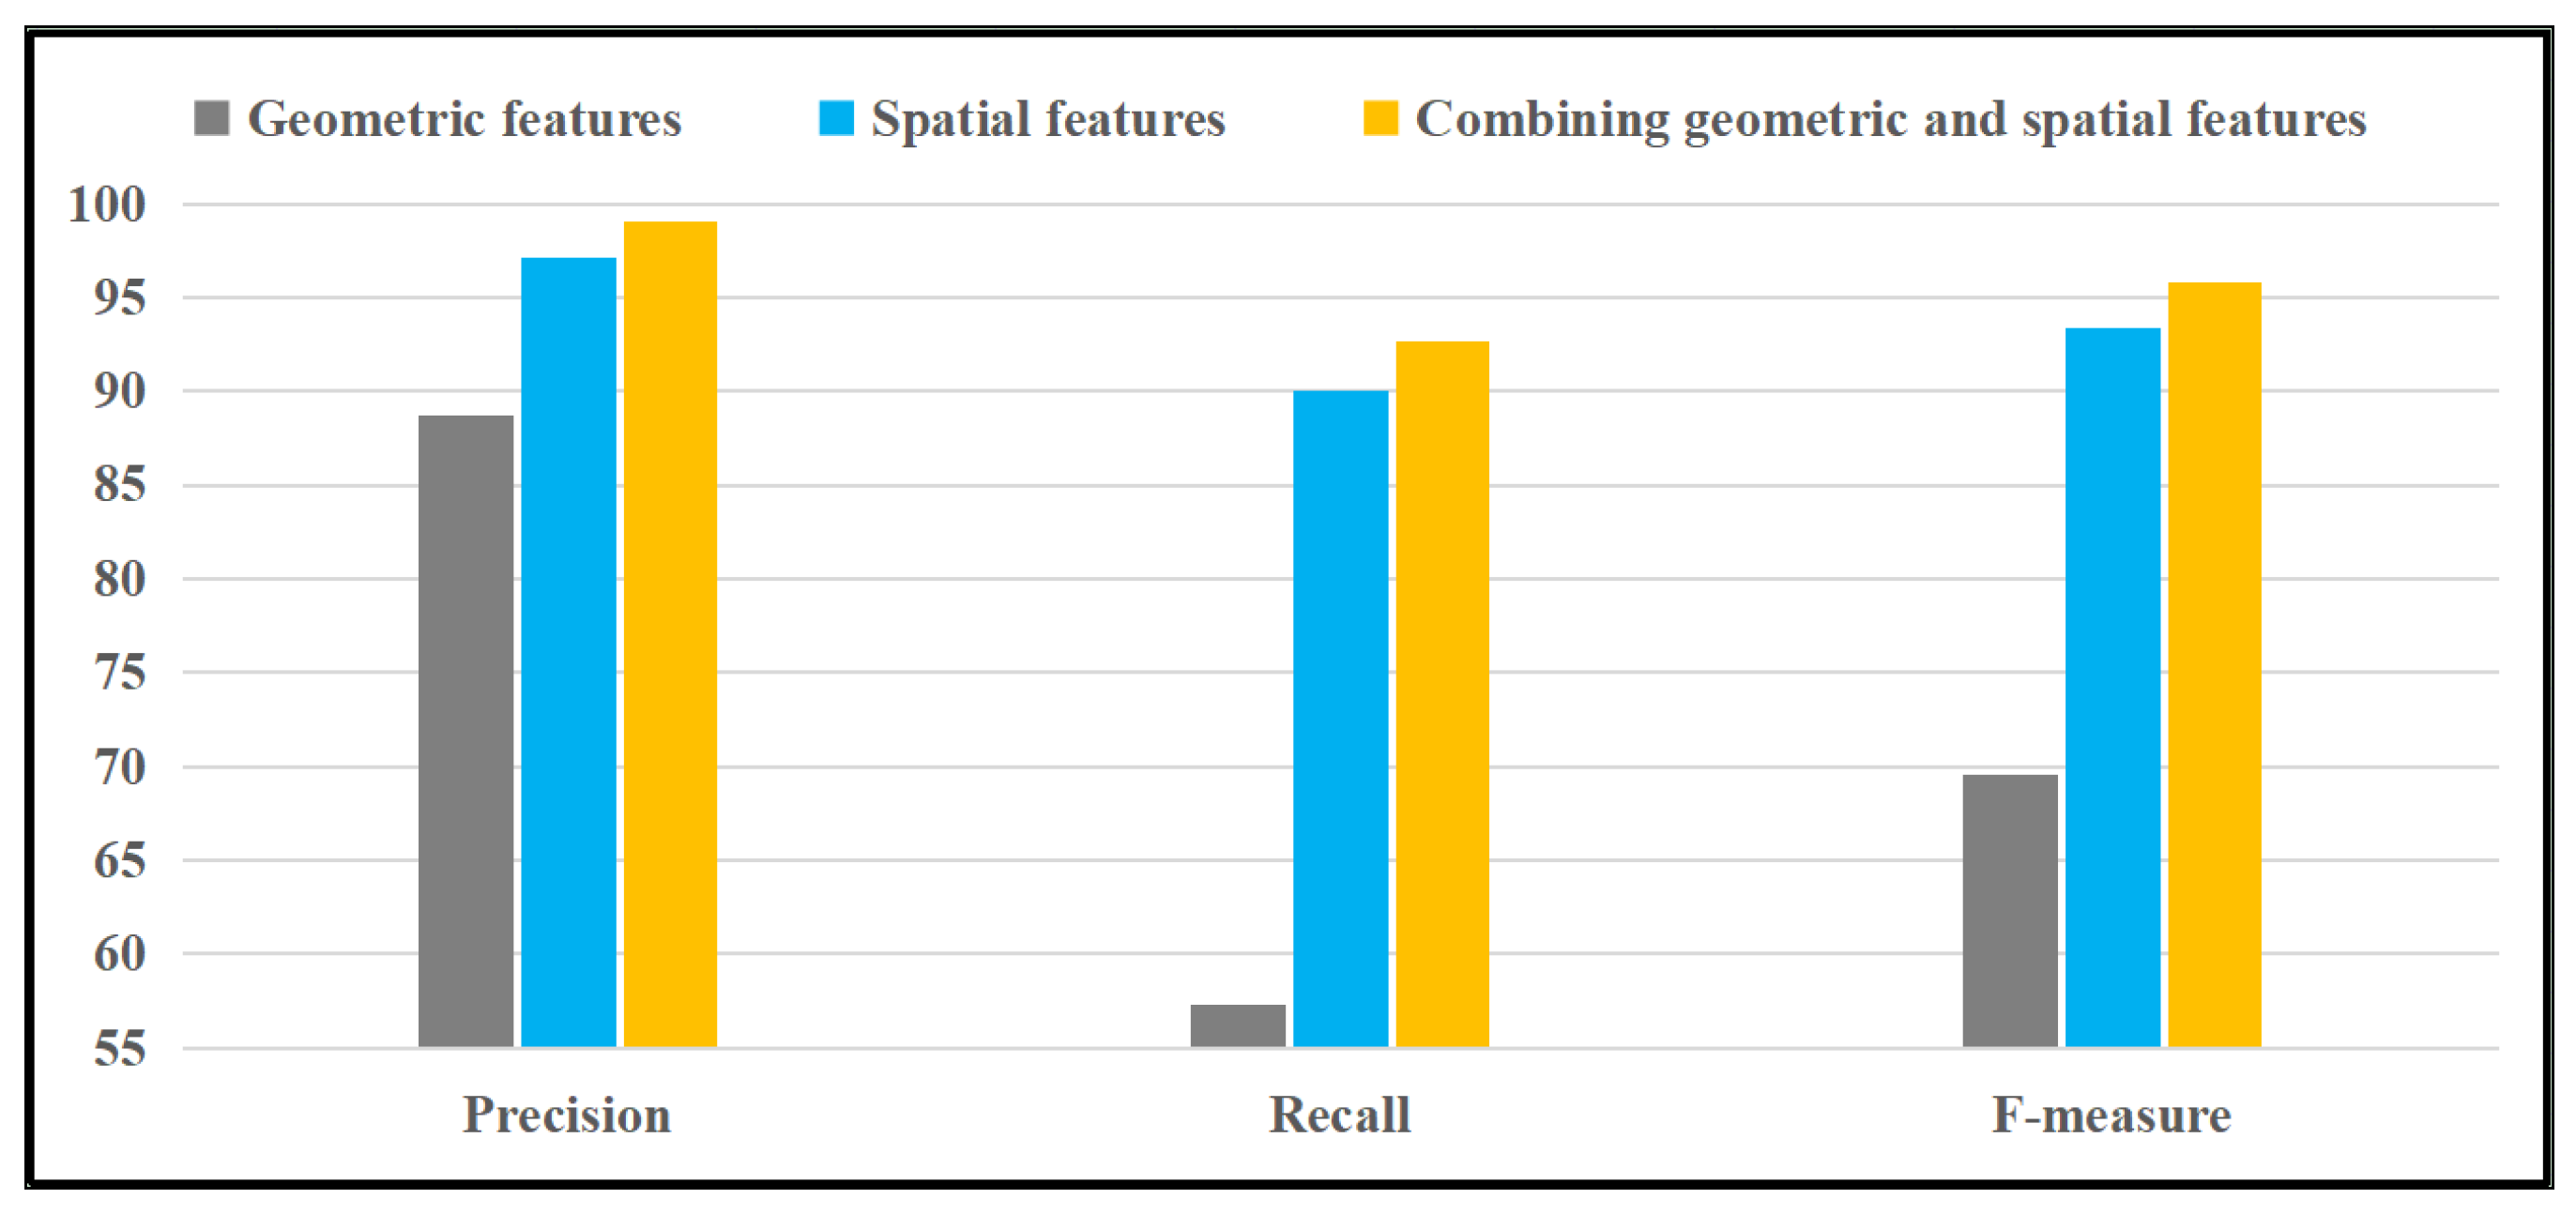
Road intersection detection based on GPS data can divide into three phrases: feature point selection, feature extraction, and feature point clustering. Section 4.3 gives us three observations: (1) DBSCAN outperforms K-means and AHC; (2) Spatial features do better than geometric features, and (3) Combining geometric and spatial features can obtain further improvement. Therefore, feature point selection is worthy of many focuses. The existing methods always concentrate on the selection of turning points. Turning points are around intersections, but they are a little far from center coordinates of intersections. Last but not least, the number of turning points after selection is too little.
In this paper, we divide GPS points into two categories by xDeepFM: one class around road intersections and another class on road segments. In addition to turning points, the former class includes many GPS points near intersections’ centers which are recorded when vehicles crossed intersections. When these points are put into the clustering algorithm, the clustering centers are closer to intersections than many existing methods.
In the future, we will discuss the robustness of the proposed method which is relative to the size of the detecting area and the numbers of GPS points or intersections. The xDeepFM model is one of the state-of-the-art classification models. Comparison with other classification models is also worthwhile to be conducted, especially the deep learning models in the literatures [31,32,33,34,35,36,37,38,39]. Additionally, we will apply our recent progress [40,41] for intersections’ scope recognition.
5. Conclusions
Road intersection recognition is essential for intelligent transportation systems. It is still challenging to precisely detect an intersection and recognize its radius based on GPS data. The traditional approach always takes three steps: Firstly, selecting turning points and extracting their geometric features; next, clustering them as intersections’ centers. However, the performance is not good enough owing to the following aspects: (1) Some other spatial features are ignored, such as those of intersections’ neighborhood; (2) Single algorithm is used; (3) The scope of intersections is seldom considered.
Addressing these problems, we propose a novel approach for road intersection recognition via combining classification model and clustering algorithm based on GPS data. It includes two parts: one is center coordinate detection via combining classification model and clustering algorithm; another is radius computing by integrating Delaunay triangulation with circle shape structure. Furthermore, we devise a set of experiments to evaluate our proposed methods on the GPS dataset of Chengdu provided by the DiDi chuxing GAIA plan project. Compared with some state-of-the-art methods, our approach achieves higher accuracy on road intersection recognition. The precision, recall, and f-measure of our proposed center coordinates detection method are respectively 99.0%, 92.7%, and 95.8% when the matching area’s radius is 30 m. Moreover, the error of the proposed radius calculation method is less than 26.5%.
Author Contributions
Methodology, Yizhi Liu and Yijiang Zhao; validation, Rutian Qing; writing-original draft preparation, Yizhi Liu and Rutian Qing; writing—review and editing, Yizhi Liu, Yijiang Zhao, and Zhuhua Liao; visualization, Rutian Qing. All authors have read and agreed to the published version of the manuscript.
Funding
This research was funded by the National Natural Science Foundation of China (41871320), the Key Project of Hunan Provincial Education Department (19A172), the Hunan Provincial Natural Science Foundation of China (2021JJ30276), and the Postgraduate Scientific Research Innovation Project of Hunan Province (CX20211000).
Institutional Review Board Statement
Not applicable.
Informed Consent Statement
Not applicable.
Data Availability Statement
https://outreach.didichuxing.com/app-vue/DataList02 (accessed on 9 September 2022).
Conflicts of Interest
The authors declare no conflict of interest.
References
- Li, S.; Xiang, L.; Zhang, C.; Gong, J. Extraction of urban road network intersections based on low-frequency taxi trajectory data. J. Geo-Inf. Sci. 2019, 21, 1845–1854. [Google Scholar]
- Tang, L.; Niu, L.; Yang, X.; Zhang, X.; Li, Q.; Xiao, S. Urban intersection recognition and construction based on big trace data. Acta Geod. Cartogr. Sin. 2017, 46, 770–779. [Google Scholar]
- Cheng, F.; Xiang, L.; Shao, X. Trajectory-network dynamic topological process model and its application in traffic information analysis. J. Geomat. 2019, 44, 39–43. [Google Scholar]
- Jepsen, T.; Jensen, C.; Nielsen, T. Graph convolutional networks for road networks. In Proceedings of the 27th ACM SIGSPATIAL International Conference on Advances in Geographic Information Systems, Chicago, IL, USA, 5–8 November 2019; pp. 460–463. [Google Scholar]
- Chiang, Y.; Knoblock, C.; Shahabi, C.; Chen, C. Automatic and accurate extraction of road intersections from raster maps. GeoInformatica 2009, 13, 121–157. [Google Scholar] [CrossRef]
- Cai, H.; Yao, G. Auto-extraction of road intersection from high resolution remote sensing image. Remote Sens. Nat. Resour. 2016, 28, 63–71. [Google Scholar]
- Wang, L.; Liu, Z.; Jin, F.; Wang, F. Research on automatic recognition algorithm of road intersection. Sci. Surv. Mapp. 2020, 45, 126–131. [Google Scholar]
- Jiang, Y. Research on road extraction of remote sensing image based on convolutional neural network. EURASIP J. Image Video Processing 2019, 1, 31. [Google Scholar] [CrossRef]
- Li, X.; Zhang, Y. Summary of road information extraction methods. Bull. Surv. Mapp. 2020, 6, 22–27. [Google Scholar]
- Chen, B.; Ding, C.; Ren, W.; Xu, G. Extended classification course improves road intersection detection from low-frequency GPS trajectory data. ISPRS Int. J. Geo-Inf. 2020, 9, 181. [Google Scholar] [CrossRef]
- Wu, H.; Huang, R.; You, L.; Xiang, L. Recent progress in taxi trajectory data mining. Acta Geod. Cartogr. Sin. 2019, 48, 1341–1356. [Google Scholar]
- Gan, M.; Qing, S.; Liu, X.; Li, D. Review on application of truck trajectory data in highway freight system. J. Transp. Syst. Eng. Inf. Technol. 2021, 21, 91–101. [Google Scholar]
- Gao, Y.; Wang, D.; Feng, H.; Shi, Y. Identifying urban intersections with GPS trajectories. Data Anal. Knowl. Discov. 2019, 3, 24–34. [Google Scholar]
- Wei, Y.; Ting, A.; Wei, L. A method for extracting road boundary information from crowdsourcing vehicle GPS trajectories. Sensors 2018, 18, 1261. [Google Scholar]
- Wu, J.; Zhu, Y.; Ku, T.; Wang, L. Detecting road intersections from coarse-gained GPS traces based on clustering. J. Comput. 2013, 8, 2959–2965. [Google Scholar]
- Tan, X.; Wang, J.; Song, X.; Xu, C.; Wang, C. Detection of road intersections using floating car data. Geogr. Geo-Inf. Sci. 2015, 31, 34–38. [Google Scholar]
- Li, L.; Li, D.; Xing, X.; Yang, F.; Rong, W.; Zhu, H. Extraction of road intersections from GPS traces based on the dominant orientations of roads. ISPRS Int. J. Geo-Inf. 2017, 6, 403. [Google Scholar] [CrossRef]
- Wang, J.; Wang, C.; Song, X.; Raghavan, V. Automatic intersection and traffic rule detection by mining motor-vehicle GPS trajectories. Comput. Environ. Urban Syst. 2017, 64, 19–29. [Google Scholar] [CrossRef]
- Wan, Z.; Li, L.; Yang, M.; Zhou, X. Decision tree model for extracting road intersection feature from vehicle trajectory data. Acta Geod. Cartogr. Sin. 2019, 48, 1391–1403. [Google Scholar]
- Deng, M.; Huang, J.; Zhang, Y.; Liu, H.; Tang, L.; Tang, J.; Yang, X. Generating urban road intersection models from low-frequency GPS trajectory data. Int. J. Geogr. Inf. Sci. 2018, 32, 2337–2361. [Google Scholar] [CrossRef]
- Xie, X.; Philips, W. Road intersection detection through finding common sub-tracks between pairwise GNSS traces. ISPRS Int. J. Geo-Inf. 2017, 6, 311. [Google Scholar] [CrossRef]
- Xie, X.; Liao, W.; Aghajan, H.; Veelaert, P.; Philips, W. Detecting road intersections from GPS traces using longest common subsequence algorithm. ISPRS Int. J. Geo-Inf. 2017, 6, 1. [Google Scholar] [CrossRef]
- Fathi, A.; Krumm, J. Detecting road intersections from GPS traces. In Proceedings of the International Conference On Geographic Information Science, Zurich, Switzerland, 14–17 September 2010; Springer: Berlin/Heidelberg, Germany, 2010; pp. 56–69. [Google Scholar]
- Lian, J.; Zhou, X.; Zhang, F.; Chen, Z.; Xie, X.; Sun, G. xdeepfm: Combining explicit and implicit feature interactions for recommender systems. In Proceedings of the 24th ACM SIGKDD International Conference on Knowledge Discovery & Data Mining, London, UK, 19–23 August 2018; pp. 1754–1763. [Google Scholar]
- Ai, T.; Ke, S.; Yang, M.; Li, J. Envelope generation and simplification of polylines using Delaunay triangulation. Int. J. Geogr. Inf. Sci. 2017, 31, 297–319. [Google Scholar] [CrossRef]
- Tang, L.; Ren, C.; Liu, Z.; Li, Q. A road map refinement method using Delaunay triangulation for big trace data. ISPRS Int. J. Geo-Inf. 2017, 6, 45. [Google Scholar] [CrossRef] [Green Version]
- Zheng, W.; Zhou, X.; Li, H.; Wu, H.; Tang, Z. Safety identification and recognition system of shunting yard based on the spatial analysis of GIS and deep learning. J. Saf. Environ. 2020, 20, 423–432. [Google Scholar]
- Rendle, S. Factorization machines. In Proceedings of the the 10th IEEE International Conference on Data Mining, Sydney, Australia, 14–17 December 2010; pp. 995–1000. [Google Scholar]
- Guo, H.; Tang, R.; Ye, Y.; Li, Z.; He, X. DeepFM: A factorization-machine based neural network for CTR prediction. In Proceedings of the 26th International Joint Conference on Artificial Intelligence, Melbourne, Australia, 19–25 August 2017; pp. 1725–1731. [Google Scholar]
- Sun, L.; Jia, L.; Wei, Z.; Li, J. Demand forecasting of taxi travel based on GPS data. J. Transp. Inf. Saf. 2021, 39, 128–136. [Google Scholar]
- Santhosh, K.; Dogra, D.; Roy, P.; Mitra, A. Vehicular trajectory classification and traffic anomaly detection in videos using a hybrid CNN-VAE architecture. IEEE Trans. Intell. Transp. Syst. 2022, 23, 11891–11902. [Google Scholar] [CrossRef]
- Santhosh, K.; Dogra, D.; Roy, P. Temporal unknown incremental clustering model for analysis of traffic surveillance videos. IEEE Trans. Intell. Transp. Syst. 2018, 20, 1762–1773. [Google Scholar] [CrossRef]
- Santhosh, K.; Dogra, D.; Roy, P. Queuing theory guided intelligent traffic scheduling through video analysis using Di-richlet process mixture model. Expert Syst. Appl. 2019, 118, 169–181. [Google Scholar]
- Li, J.; Xie, H.; Yu, L.; Gao, X.; Zhang, Y. Discriminative feature mining based on frequency information and metric learning for face forgery detection. IEEE Trans. Knowl. Data Eng. 2021, 1. [Google Scholar] [CrossRef]
- Dai, H.; Shi, H.; Liu, W.; Wang, L.; Liu, Y.; Mei, T. FasterPose: A faster simple baseline for human pose estimation. ACM Trans. Multimed. Comput. Commun. Appl. 2022, 18, 1–16. [Google Scholar] [CrossRef]
- Hu, Z.; Xie, H.; Yu, L.; Gao, X.; Shang, Z.; Zhang, Y. Dynamic-aware federated learning for face forgery video detection. ACM Trans. Intell. Syst. Technol. 2022, 13, 1–25. [Google Scholar] [CrossRef]
- Wang, X.; Liu, W.; Chen, J.; Wang, X.; Yan, C.; Mei, T. Listen, look, and find the one: Robust person search with multimodality index. ACM Trans. Multimed. Comput. Commun. Appl. 2020, 16, 1–20. [Google Scholar] [CrossRef]
- Hong, G.; Kim, B.; Dogra, D.; Roy, P. A survey of real-time road detection techniques using visual color sensor. J. Multimed. Inf. Syst. 2018, 5, 9–14. [Google Scholar]
- Ahmed, S.; Dogra, D.; Kar, S.; Roy, P. Trajectory-based surveillance analysis: A survey. IEEE Trans. Circuits Syst. Video Technol. 2018, 29, 1985–1997. [Google Scholar] [CrossRef]
- Zhao, Y.; Yang, W.; Liu, Y.; Liao, Z. Discovering transition patterns among OpenStreetMap feature classes based on the Louvain method. Trans. GIS 2021, 26, 236–258. [Google Scholar] [CrossRef]
- Liao, Z.; Xiao, H.; Liu, S.; Liu, Y.; Yi, A. Impact assessing of traffic lights via GPS vehicle trajectories. ISPRS Int. J. Geo-Inf. 2021, 10, 769. [Google Scholar] [CrossRef]
Figure 1.
The framework of the proposed method.

Figure 2.
The point B’s turning angle θ. The points A, B, and C are GPS points recorded in time order.
Figure 2.
The point B’s turning angle θ. The points A, B, and C are GPS points recorded in time order.

Figure 3.
Turning distances in two situations: (a) Turning distance when a taxi changes direction; (b) Turning distance when a taxi goes straight. The points A, B, and C are GPS points recorded in time order.
Figure 3.
Turning distances in two situations: (a) Turning distance when a taxi changes direction; (b) Turning distance when a taxi goes straight. The points A, B, and C are GPS points recorded in time order.

Figure 4.
Element values of eight neighborhoods.

Figure 5.
The feature matrix constructed by geometric features, spatial features, and labels.

Figure 6.
The structure of the xDeepFM model.

Figure 7.
The radius of a road intersection: (a) X shape road intersections; (b) T shape road intersections.
Figure 7.
The radius of a road intersection: (a) X shape road intersections; (b) T shape road intersections.

Figure 8.
Integrating Delaunay triangulation algorithm with the circle shape: (a) Before deleting outlier points; (b) After deleting outlier points.
Figure 8.
Integrating Delaunay triangulation algorithm with the circle shape: (a) Before deleting outlier points; (b) After deleting outlier points.

Figure 9.
The road intersections detected by the proposed method in the experimental area.

Figure 10.
Radius computing of a road intersection.

Figure 11.
Performance comparison between Tang’s method [2] and our method of radius computing and center coordinate detection: (a) The average error of computing radius of intersections; (b) The accuracy of detecting center coordinate of intersections.
Figure 11.
Performance comparison between Tang’s method [2] and our method of radius computing and center coordinate detection: (a) The average error of computing radius of intersections; (b) The accuracy of detecting center coordinate of intersections.

Figure 12.
Performance comparison of three typical cluster algorithms.

Figure 13.
Performance comparison of different feature matrixes.


Table 1.
Comparisons of algorithms and the performance among the related works.
| Literatures | Cities | Clustering Algorithms | Classification Models | Other Algorithms | Precision (%) | Recall (%) | F-Measure (%) | The Matching Area’s Radius (m) |
|---|---|---|---|---|---|---|---|---|
| [1] | Wuhan | PDC | none | PCA, morphology | 92.23 | 77.26 | 84.08 | none |
| [2] | Wuhan | LPC | none | none | 93.1 | 96.1 | none | none |
| [10] | Shenzhen | none | none | Delaunay, thinning | 87.93 | 75.76 | 82.0 | 40 |
| [13] | Beijing | none | KNN | GeoHash | 87.0 | 76.0 | 82.0 | 50 |
| [16] | Huaibei | DBSCAN | none | none | 91.6 | none | none | none |
| [17] | Chengdu | mean shift | none | PCA | 96.2 | none | none | 50 |
| [18] | Suzhou | mean shift | none | KDE | 94.7 | 92.88 | none | none |
| [19] | Cologne | none | DT | none | 93.2 | 92.8 | none | none |
| [20] | Chicago | none | none | Delaunay, K-segment | 93.6 | 65.67 | 77.19 | none |
| [21] | Chicago | none | none | KDE | 80.0 | None | none | 50 |
| [22] | Chicago | none | none | KDE, DP | 85.0 | None | none | 50 |
| [23] | Seattle | none | shape descriptor | none | 76.0 | None | none | none |
Table 2.
The performance evaluation of different classification models.
| The Matching Area’s Radius | Evaluation Metrics (%) | KNN | LR | FM | DeepFM | Ours |
|---|---|---|---|---|---|---|
| 5 m | Precision | 17.5 | 20.6 | 68.6 | 63.1 | 66.0 |
| Recall | 16.4 | 19.1 | 63.6 | 59.1 | 61.8 | |
| F-measure | 16.9 | 19.8 | 66 | 61 | 63.8 | |
| 10 m | Precision | 41.8 | 52.9 | 90.2 | 89.3 | 91.3 |
| Recall | 39.1 | 49.1 | 83.6 | 83.6 | 85.5 | |
| F-measure | 40.1 | 50.9 | 86.8 | 86.1 | 88.3 | |
| 20 m | Precision | 55.3 | 70.6 | 95.1 | 96.1 | 97.1 |
| Recall | 51.8 | 65.5 | 88.2 | 90 | 90.9 | |
| F-measure | 53.5 | 67.9 | 91.5 | 93 | 93.9 | |
| 30 m | Precision | 64.1 | 71.6 | 98.0 | 98.1 | 99.0 |
| Recall | 60.0 | 66.4 | 90.9 | 91.8 | 92.7 | |
| F-measure | 62.0 | 68.9 | 94.3 | 94.8 | 95.8 |
Publisher’s Note: MDPI stays neutral with regard to jurisdictional claims in published maps and institutional affiliations. |
© 2022 by the authors. Licensee MDPI, Basel, Switzerland. This article is an open access article distributed under the terms and conditions of the Creative Commons Attribution (CC BY) license (https://creativecommons.org/licenses/by/4.0/).
Share and Cite
MDPI and ACS Style
Liu, Y.; Qing, R.; Zhao, Y.; Liao, Z. Road Intersection Recognition via Combining Classification Model and Clustering Algorithm Based on GPS Data. ISPRS Int. J. Geo-Inf. 2022, 11, 487. https://doi.org/10.3390/ijgi11090487
AMA Style
Liu Y, Qing R, Zhao Y, Liao Z. Road Intersection Recognition via Combining Classification Model and Clustering Algorithm Based on GPS Data. ISPRS International Journal of Geo-Information. 2022; 11(9):487. https://doi.org/10.3390/ijgi11090487
Chicago/Turabian StyleLiu, Yizhi, Rutian Qing, Yijiang Zhao, and Zhuhua Liao. 2022. "Road Intersection Recognition via Combining Classification Model and Clustering Algorithm Based on GPS Data" ISPRS International Journal of Geo-Information 11, no. 9: 487. https://doi.org/10.3390/ijgi11090487
Note that from the first issue of 2016, this journal uses article numbers instead of page numbers. See further details here.