Article

The COVID Psychosocial Impacts Scale: A Reliable and Valid Tool to Examine the Psychosocial Impacts of the COVID-19 Pandemic

1
Department of Psychological Medicine, Christchurch Campus, University of Otago, Christchurch 8011, New Zealand
2
Te Kaupeka Oranga|Faculty of Health, Te Whare Wānanga o Waitaha|University of Canterbury, Christchurch 8041, New Zealand
3
School of Clinical Medicine, Primary Care Clinical Unit, The University of Queensland, Brisbane, QLD 4072, Australia
4
Department of Psychology, University of Otago, Dunedin 9016, New Zealand
5
Department of Psychological Medicine, Wellington Campus, University of Otago, Wellington 6021, New Zealand
6
Department of Psychiatry, HITEC Institute of Medical Sciences, Taxila 47078, Pakistan
7
Department of Education, Milestone College, Dhaka 1230, Bangladesh
*
Author to whom correspondence should be addressed.
Int. J. Environ. Res. Public Health 2023, 20(11), 5990; https://doi.org/10.3390/ijerph20115990
Submission received: 16 February 2023 / Revised: 5 April 2023 / Accepted: 27 May 2023 / Published: 29 May 2023
(This article belongs to the Section Mental Health)

Abstract

:
This paper reports on the development and validation of the COVID Psychosocial Impacts Scale (CPIS), a self-report measure that comprehensively examines both positive and negative psychosocial impacts from the COVID-19 pandemic. This is the first part of the program of work in which the CPIS was administered and compared with a measure of psychological distress (Kessler Psychological Distress Scale, K-10) and wellbeing (World Health Organization Well-Being Index, WHO-5). The data were obtained online in 2020 and 2022 at two distinct time points to capture different exposures to the pandemic in the New Zealand population to a non-representative sample of 663 and 687 adults, respectively. Two hundred seventy-one participants took part in both surveys. Findings indicate a unidimensional structure within CPIS subscales and inter-relatedness among CPIS stress-related subscales. The scatter plots and correlation matrix indicate CPIS having a positive moderate correlation with K10 and a negative moderate correlation with WHO-5, indicative of construct validity. The paper outlines contextual factors surrounding CPIS development and makes suggestions for future iterations of CPIS. Further work will examine its psychometric properties across cultures.

1. Introduction

The novel coronavirus disease 2019 (COVID-19) pandemic has exposed people to significant and prolonged stress [1,2]. The myriad of primary stressors includes personal and familial health consequences of infection, together with social and financial impacts of the ongoing public health restrictions, e.g., lockdowns, social distancing requirements, travel bans, and vaccination mandates. These psychosocial impacts were amplified by uncertainty relating to new variants of COVID-19, the limited effectiveness of public health restrictions, and political responses. What was happening amid increased societal divisions and polarisation around vaccination and mask mandates, and associated additional stresses (e.g., people losing jobs, verbal abuse of vaccinators, and staff checking vaccination passports) [3]. Those restrictions have largely been removed, although uncertainty about future variants remains.
No one is exempt from exposure to pandemic-related stressors but some segments of society (e.g., health workers, law enforcement, providers of essential goods/services, and at-risk populations) are more vulnerable to these stressors than others [4]. Some of the psychosocial impacts of COVID-19 were anticipated from the start of the pandemic [5]; however, the fluid nature of the pandemic globally, both within and across contexts and the varied responses, has made the assessment and cross-cultural comparison of the psychosocial impacts of COVID-19 extremely challenging.
Different approaches have been utilized to examine the psychological and social impacts of the COVID-19 pandemic. These include employing cross-sectional [6,7,8,9,10,11,12] and longitudinal [13] study designs with a representative [6,7,8] and convenience samples [9] of the general population, those in specific work roles (especially healthcare) [10,11], or those having a previous history of mental disorders [12,13]. Most studies have employed standardized self-report measures of wellbeing, psychological distress, depression, anxiety, and post-traumatic stress disorder (PTSD). These studies have generally reported negative psychosocial impacts, for example, psychological distress [8,14], alcohol abuse [14], family harm [8], and suicidality [8,14,15]. Some studies have used standardised instruments across countries to obtain comparable data sets [6,7,10]. Although the use of pre-existing standardised measures also allows for pre-pandemic comparisons, these measures do not specifically examine the impacts of COVID-related stressors.
As a result, there have been recommendations for novel self-report measures to be used alongside established psychometric measures [16,17]. Several scales have been developed to this end, which vary in focus and length. These include those assessing the impacts of the COVID-19 pandemic and public health restrictions on physical health, employment and finances, family and social disruption; and measures of psychological distress, loneliness, anxiety, depression, and PTSD (see [17] for a summary of these measures). While few scales attempt to capture the psychosocial impacts of the COVID-19 pandemic (for example, CRISIS assesses COVID stress on key domains namely COVID exposure, COVID worries, life changes, mood states, daily behaviors) [18], they frequently reflect the context and country in which they were developed, limiting their more general applicability. Other scales have a more specific focus rather than assessing the wider impacts of the pandemic (for example, the Fear of COVID-19 scale [19], the Coronavirus Anxiety Scale [20], and the COVID-19 Anxiety Scale [21]). With the exception of the Fear of COVID-19 scale, most of these novel scales lack detailed validation studies.
Importantly, the potential positive impacts of the pandemic were also recognised [22] but very few empirical studies have been undertaken to examine the positive psychosocial impacts of the pandemic. Jenkins et al. [23] and Beaglehole et al. [24] reported data from a demographically representative sample of New Zealanders. Jenkins et al. described the experience of the silver linings (positive impacts) resulting from the COVID-19 pandemic and reported positive impacts in two-thirds of their sample. They also reported two overarching themes of positive psychosocial impacts, including surviving (coping well, meeting basic needs, and maintaining health) and thriving (self-development, reflection, and growth) [23]. Beaglehole et al. examined lockdown experiences, wellbeing, and key sociodemographic determinants; and reported excellent wellbeing in 9% of their sample during the lockdown. They emphasised the need to assess a positive wellbeing to gain a comprehensive understanding of the psychosocial impacts of the COVID-19 pandemic [24].
The COVID Psychosocial Impacts Scale (CPIS) was therefore developed to address some of the issues identified above. The CPIS was developed by academics and practitioners in the field of psychology, psychiatry, epidemiology, and public health in the very early stages of the pandemic in New Zealand when we had a strict lockdown and very few cases. This situation did not change substantively until early 2022 when the Omicron variants arrived with higher infection rates, despite a high vaccination rate. We aimed to develop a measure for use in adults (18 years and above) that comprehensively assessed the impacts of the COVID-19 pandemic, including the adverse personal, social, and economic consequences that followed and recognised the positive outcomes which may have occurred. Ideally, the items must be derived based on prior research. However, it was the first historical occurrence of a widespread novel virus during a period in history where we have in place the tools to try to understand the stress caused by it. Notably, at the time of designing the CPIS, there were no established measures for assessing COVID-related stresses. As a consequence, we used an empirically driven approach to item and scale construction informed by our experience of developing a nuanced model for measuring exposure to the Canterbury earthquakes [25,26], in which the domains were modelled on a modified version of the Social Readjustment Scale [27]. In this approach, participants are asked to indicate the life event they have experienced and subsequently report the resultant level of stress owing to that life event. This approach allows us to work out the relative “weights” of different types of stresses and also shows combined stress load. Importantly, the relevant literature [4,5,6,8,10,11,12,13,16,17] and existing pandemic scales [18,19,20,21] were consulted in the process of scale construction. The CPIS applicability for use in a range of countries and cultures was also considered in the scale development.
There were three steps to scale construction, namely item development (identification of domain, item generation, content validity); scale development (pre-testing of items, survey administration, item reduction, extraction of factors); and scale evaluation (reliability, construct validity) [28]. The items were empirically derived from clinical experience in which participants were asked to indicate the resultant level of stress to a pandemic-related life event. Notably, the existing pandemic-related scale that examined the psychosocial impacts [18] was consulted in the process of item generation and identification of domains. Questions examining the positive consequences of the COVID-19 pandemic were also included. The CPIS was refined using the ‘group mind’ process [29], which asks colleagues including researchers based on personal contacts from a range of countries and cultures (Bangladesh, Ghana, and Pakistan) to review and rigorously critique a draft of the questionnaire, with iterative improvements made based on their comments. These specific low- and middle-income countries faced the substantial burden of COVID-19 (unlike New Zealand) and also vary in socio-economic context to New Zealand where the CPIS was developed. Collectively, this provided sufficient context to design a widely applicable measure. This was done to ensure content validity and applicability of newly developed CPIS in varying contexts.
In the scale development phase, we pre-tested the revised questionnaire on a small sample of the general public and further modified it to address respondents’ feedback. The CPIS was then administered to a non-representative New Zealand population at two distinct time points (2020, 2022) using an online survey to examine the psychometric properties of the newly developed scale. This paper reports on the item reduction, reliability analysis, factor extraction, and construct validity of the newly developed CPIS and its comparison with standardized self-report measures of psychological distress (Kessler Psychological Distress Scale, K10) [30] and wellbeing (World Health Organization Well-Being Index, WHO-5) [31]. Importantly, the psychometric study was carried out in New Zealand at two distinct time points to capture different exposures to the pandemic in the New Zealand population: (1) in 2020 (survey 1) when the pandemic was well-controlled and there was no reported community transmission of COVID-19; and (2) in 2022 (survey 2) when approximately 35% of the population had had a reported confirmed case of COVID-19 and nearly 2800 deaths had resulted [32]. At the time of both surveys, there was no lockdown in place across New Zealand, but the conditions on the ground changed considerably from successfully suppressing COVID-19 for two years to a reduced restriction due to a high vaccination rate, followed by an infection increase in 2022. The same set of items has been used in both surveys, except three items that were modified owing to psychometric and pragmatic considerations reflecting the process of constant improvement (for details see Table 1 and Section 3.1). This is the first part of the program of work and further work will examine its psychometric properties for cross-cultural use after the data acquisition is complete.

2. Materials and Methods

2.1. Participants

Participants were recruited using the Department of Psychology Research Participation Pool (University of Otago, New Zealand) comprising students and the general population using a convenient sampling from a non-representative New Zealand population.
In survey 1, six hundred sixty-three participants completed the survey. The median age range of respondents was 40 to 49 years. There were more female participants (75%) than males and most participants identified their ethnicity as New Zealand European (88%). Participants were living either with family (47%) or a partner/spouse (30%), and the majority (88%) experienced no change in their living arrangements since COVID-19. Most participants (76%) reported spending less than an hour a day seeking information about COVID-19. Participants mainly accessed information related to COVID-19 from the news (91%), health websites (62%), and Facebook/Twitter (40%). The majority of participants (90%) had experienced at least one prior (i.e., before the pandemic) traumatic event, most commonly a natural disaster (34%) and childhood trauma before the age of 16 years (25%). Two hundred six participants (31%) had a COVID-19 test and only one participant was diagnosed with COVID-19. Nineteen (3%) participants had at least one family member who had been diagnosed with COVID-19. Seven had 1 family member, six had 2 family members, two had 3 family members, one had 4 family members, one had 5 family members, and two had 6 family members diagnosed with COVID-19. Of these, one experienced 1 bereavement and another experienced 3 bereavements. No participants reported a family member who was COVID-19 positive at the time of data collection of survey 1.
In survey 2, six hundred eighty-seven participants completed the survey. The median age range of respondents was 50 to 59 years. There were more female participants (53%) than males and most participants identified their ethnicity as New Zealand European (89%). Participants were living either with family (36%) or a partner/spouse (44%) and the majority (84%) experienced no change in their living arrangements since COVID-19. Most participants (88%) reported spending less than an hour a day seeking information about COVID-19. Participants mainly accessed information related to COVID-19 from the news (83%), health websites (66%), and Facebook/Twitter (20%). Most participants (56%) experienced at least one prior (i.e., before the pandemic) traumatic event, most commonly a natural disaster (36%) and childhood trauma before the age of 16 years (22%). Five hundred fifty-six (81%) had a COVID-19 test. Five hundred forty (79%) participants had at least one family member who had been diagnosed with COVID-19, with 167 participants reporting having two or more family members diagnosed. Of these, five participants experienced 1 bereavement. Thirty (4%) participants reported a family member who was COVID-19 positive at the time of data collection of survey 2. See Appendix A for a detailed demographic profile of the participants.

2.2. Measures

2.2.1. Sociodemographic Information

Sociodemographic information collected included: age, gender (male, female, gender diverse), marital status, country of birth, years living in New Zealand, New Zealand citizenship or visa status, residing town, ethnicity, education, work status, occupation, annual family income, and prior exposure to traumatic events. Ethnicity was collected using the NZ Census question on ethnicity, which allows individuals to specify multiple ethnic groups [33].

2.2.2. COVID Psychosocial Impacts Scale (CPIS)

The CPIS includes 50 items that examine the psychosocial impacts of the COVID-19 pandemic across 13 key domains. These key domains are distributed across 5 core subscales (personal stresses (personal impacts, changes to daily routines and behaviours, and exposure to information about COVID-19); social stresses (family impacts, living arrangements, and relationships); financial stresses (work and COVID-19, employment, and income); perception of overall life stresses pre/post COVID-19; and positive impacts (silver linings)) and 2 optional subscales (education-related stresses, faith-related stresses) (See Table 1). The optional subscales could be skipped by participants if not applicable.
Of the 50 items, 42 examine the exposure to, and amount of stress experienced in response to pandemic-related life events on a 6-point rating scale (0 = No exposure to the life event, 1 = Yes exposed to the life event but caused no stress at all, through to 5 = Yes exposed to the life event and caused a lot of stress). This approach of calculating a “composite” indicator has been adopted from an established scale of life stress from the Christchurch Health and Development Study [25,34,35]. In the perception of the overall life stress pre/post COVID-19 subscale, four items ask about the perception of stress (1 = Considerably less stressed, 5 = Considerably more stressed) and psychological wellbeing (1 = Much better, 5 = Much worse) on a 5-point rating scale. The last subscale ‘silver lining’ examined the potential positive impacts of the COVID-19 pandemic through four items that asked participants to specify the positive consequences they may have experienced since the COVID-19 pandemic on a 5-point rating scale (1 = Not at all, 5 = A great deal). The items in the silver lining subscale are different from other positively phrased items (e.g., items 29, 31, 34, 36, 39, and 41) as it more generally asks to reflect any positive consequences they may have experienced since the COVID-19 pandemic, and not stresses in response to a particular pandemic-related life event. Reverse scoring was carried out for the positive impacts subscale. The CPIS composite scores can be calculated based on a linear combination of scores by items on the core subscales, where the data on optional subscales can be treated as a sub-sample.

2.2.3. Established Psychometric Measures

Kessler Psychological Distress Scale (K10)

The Kessler Psychological Distress Scale (K10) is a 10-item scale measuring non-specific symptoms of anxiety and depression over the previous four weeks on a 5-point Likert scale (1 = None of the time, 5 = All the time) [30]. Scores are reported in a 10 to 50 range, where respondents with a score of below 20 are likely to be well, 20 to 24 are likely to have a mild mental disorder, 25 to 29 are likely to have a moderate mental disorder, and participants with a score of 30 and over are likely to have a severe mental disorder [36].

World Health Organization Well-Being Index 5 (WHO-5)

The World Health Organization Well-Being Index 5 (WHO-5) is one of the most widely used scales for assessing subjective psychological wellbeing [31]. It contains five positively phrased items, with respondents rating each statement for the previous two weeks. Scores range from 0 to 25, which are then multiplied by 4, resulting in 100 indicating the highest subjective wellbeing. A cut-off score of 50 and below is generally used to screen for clinical depression [37].

2.3. Procedure

The survey was fielded on the Qualtrics XM Platform and was designed to be compatible with a mobile phone, tablet, or computer access. It was designed to take 15 to 25 min to complete the survey. Participants were asked to read the information sheet and provide online consent before proceeding with the survey (which included the CPIS and the other measures described above). For survey 1, data were collected from the 13 October to 9 November 2020 (4 weeks); at this time, 1872 confirmed cases and 25 deaths in New Zealand were attributed to COVID-19 [32]. For survey 2, data were collected from the 2 September to 26 September 2022 (3 weeks and 4 days); by this time, 1,746,460 confirmed cases and 2799 deaths due to COVID-19 had been recorded [32]. The participation was voluntary, and no incentive was provided.

2.4. Statistical Analyses

Data were analysed descriptively and analytically using SPSS V26.0 (IBM, Armonk, NY, USA). The reliability of the CPIS subscales was analysed using item-total correlations and Cronbach’s α with a minimum acceptable value of 0.30 and 0.70, respectively [38]. The factor structure was examined using exploratory factor analysis on the subscale of CPIS. Further analyses were carried out using scatter plots and correlation matrix (Pearson’s r correlation) on CPIS and its subscales to examine construct validity with K10 and WHO-5. Additional analyses were undertaken on subsamples who participated in both surveys and on subsamples who answered on one of the optional subscales (education-related stresses, faith-related stresses).

3. Results

In survey 1, a total of 1489 prospective participants were contacted with an explanation of the study, a participant information sheet, and a link to the survey. A total of 718 (48%) participants consented out of 1489 prospective participants. The non-completion rate, defined as those who started but did not complete the survey before the cut-off time, was 8% (n = 50), leaving complete responses from 663 (92%) participants. The median time taken for participants to complete survey 1 was twenty minutes (interquartile range = 15, 31 min). In survey 2, a total of 1211 prospective participants were contacted with an explanation of the study, a participant information sheet, and a link to the survey. A total of 751 (62%) participants consented out of 1211 prospective participants. The non-completion rate was 8% (n = 64), leaving complete responses from 687 (92%) participants. The median time taken for participants to complete survey 2 was nineteen minutes (interquartile range = 14, 28 min). Two hundred seventy-one participants took part in both surveys.

3.1. Reliability and Factor Structure

The item-total correlations and Cronbach’s α were computed for individual subscales to examine the homogeneity of the items within the subscales. Items with item-total correlations below 0.3 were removed from the analysis. In survey 1, the items removed due to low-item-total correlations included item 2 (“Have you had a COVID-19 test?”); item 6 (“Do you feel any family member is at risk of being exposed to someone with COVID-19 through their work?”); item 7 (“Has any family member had a COVID-19 test?”); item 12 (“Are you considered an essential worker (e.g., in healthcare, law enforcement, emergency services, provider of essential goods/services)?”); item 13 (“Do you have a close friend or family member who is an essential worker?”); and item 16 (“Had access to adequate computing facilities (e.g., personal laptop or computer, internet, etc.)”). The resultant reliability score for each subscale was above 0.70 (personal stress (r = 0.75), social stress (r = 0.74), financial stress (r = 0.79), perception of overall life stress pre/post COVID-19 (r = 0.86), positive impacts (r = 0.80), faith-related stress (r = 0.89), and education-related subscale (r = 0.75)) in survey 1.
In survey 2, the same set of items was administered with three exceptions (items 2, 3, and 7) which were modified owing to psychometric and pragmatic considerations (See Table 1). The items taken out from analysis due to low-item-total correlations in survey 2 included item 13 (“Are you considered an essential worker (e.g., in healthcare, law enforcement, emergency services, provider of essential goods/services)?”); item 14 (“Do you have a close friend or family member who is an essential worker?”); item 28 (“Has your household needed to seek help from a food bank or other charitable organisation?”); and item 50 (“Led to an increased connection to my faith.”). The resultant reliability score for each subscale was above 0.70 (personal stress (r = 0.77), social stress (r = 0.80), financial stress (r = 0.83), perception of overall life stress pre/post COVID-19 (r = 0.89), positive impacts (r = 0.71), faith-related stress (r = 0.86), and education-related stress (r = 0.82)) in survey 2.
Exploratory factor analysis carried out using the varimax (orthogonal) rotation method on CPIS five core subscales identified two factors with an eigenvalue above one in both surveys (See Table 2). Factor 1 (α = 0.75 in survey 1 and α = 0.76 in survey 2) comprised personal stress, social stress, financial stress, and perception of overall life stress pre/post COVID-19 subscales with factor loadings above 0.30. The positive impacts subscale was the only subscale that contributed to Factor 2 in survey 1, whereas the perception of overall life stress pre/post COVID-19 and positive impacts subscales both contributed to Factor 2 (α = 0.12) in survey 2, with factor loadings above 0.30. Similar exploratory factor analyses were carried out including each of the optional subscales (education-related stress, faith-related stress), which identified two factors with an eigenvalue above one (See Appendix B). Only Factor 1 had an α-value above 0.70 in both surveys and it includes personal stress, social stress, financial stress, perception of overall life stress pre/post COVID-19, and each of the optional subscales with factor loadings above 0.30.

3.2. Descriptive Statistics

Descriptive statistics were calculated for participants who responded to CPIS core subscales first and then for participants who responded on one of the optional subscales (education-related stress, faith-related stress) (See Table 3). An overall increase can be seen in the CPIS scores in survey 2 compared to survey 1. The mean score from K10 was below the cut-off score of 20, suggesting that participants were likely to be well. The mean score on the WHO-5 was above the cut-off of 50, suggesting the overall wellbeing of participants. The only exception was in survey 1 where the mean score on the WHO-5 was below the cut-off of 50 for participants who answered on education-related stress and faith-related stress subscales, suggesting poor wellbeing. The descriptive statistics for participants who responded on both optional subscales of CPIS are summarized in Appendix C.
The relationships between the CPIS composite scores and K10 or WHO-5 were examined using scatter plots which showed a positive linear correlation between the CPIS composite score and K10, and a negative linear correlation between CPIS and WHO-5 (See Figure 1).
Further analysis of this linear relationship was examined using a correlation matrix, obtaining similar findings. The CPIS composite score had a positive yet moderate correlation (r = 0.57 in survey 1, r = 0.56 in survey 2) with the K10. The CPIS composite score had a negative yet moderate correlation (r = −0.48 in survey 1, r = −0.50 in survey 2) with WHO-5 (for detail see Table 4). Similar analyses were carried out for participants who responded on one of the optional subscales, education-related stress (See Appendix D) or faith-related stress (See Appendix E), which yielded similar findings.

3.3. Additional Analyses on Subsample

The subsample (n = 271) who took part in both surveys was analyzed psychometrically (test-retest reliability) and descriptively (mean, SD). The test-retest reliability showed moderate correlations between the two administrations of CPIS (r = 0.56). An overall increase in the mean scores can be observed on the CPIS core subscales (except for financial stress and positive impacts subscales), CPIS composite scores, K10, and WHO-5 in survey 2 compared with survey 1 (See Table 5).

4. Discussion

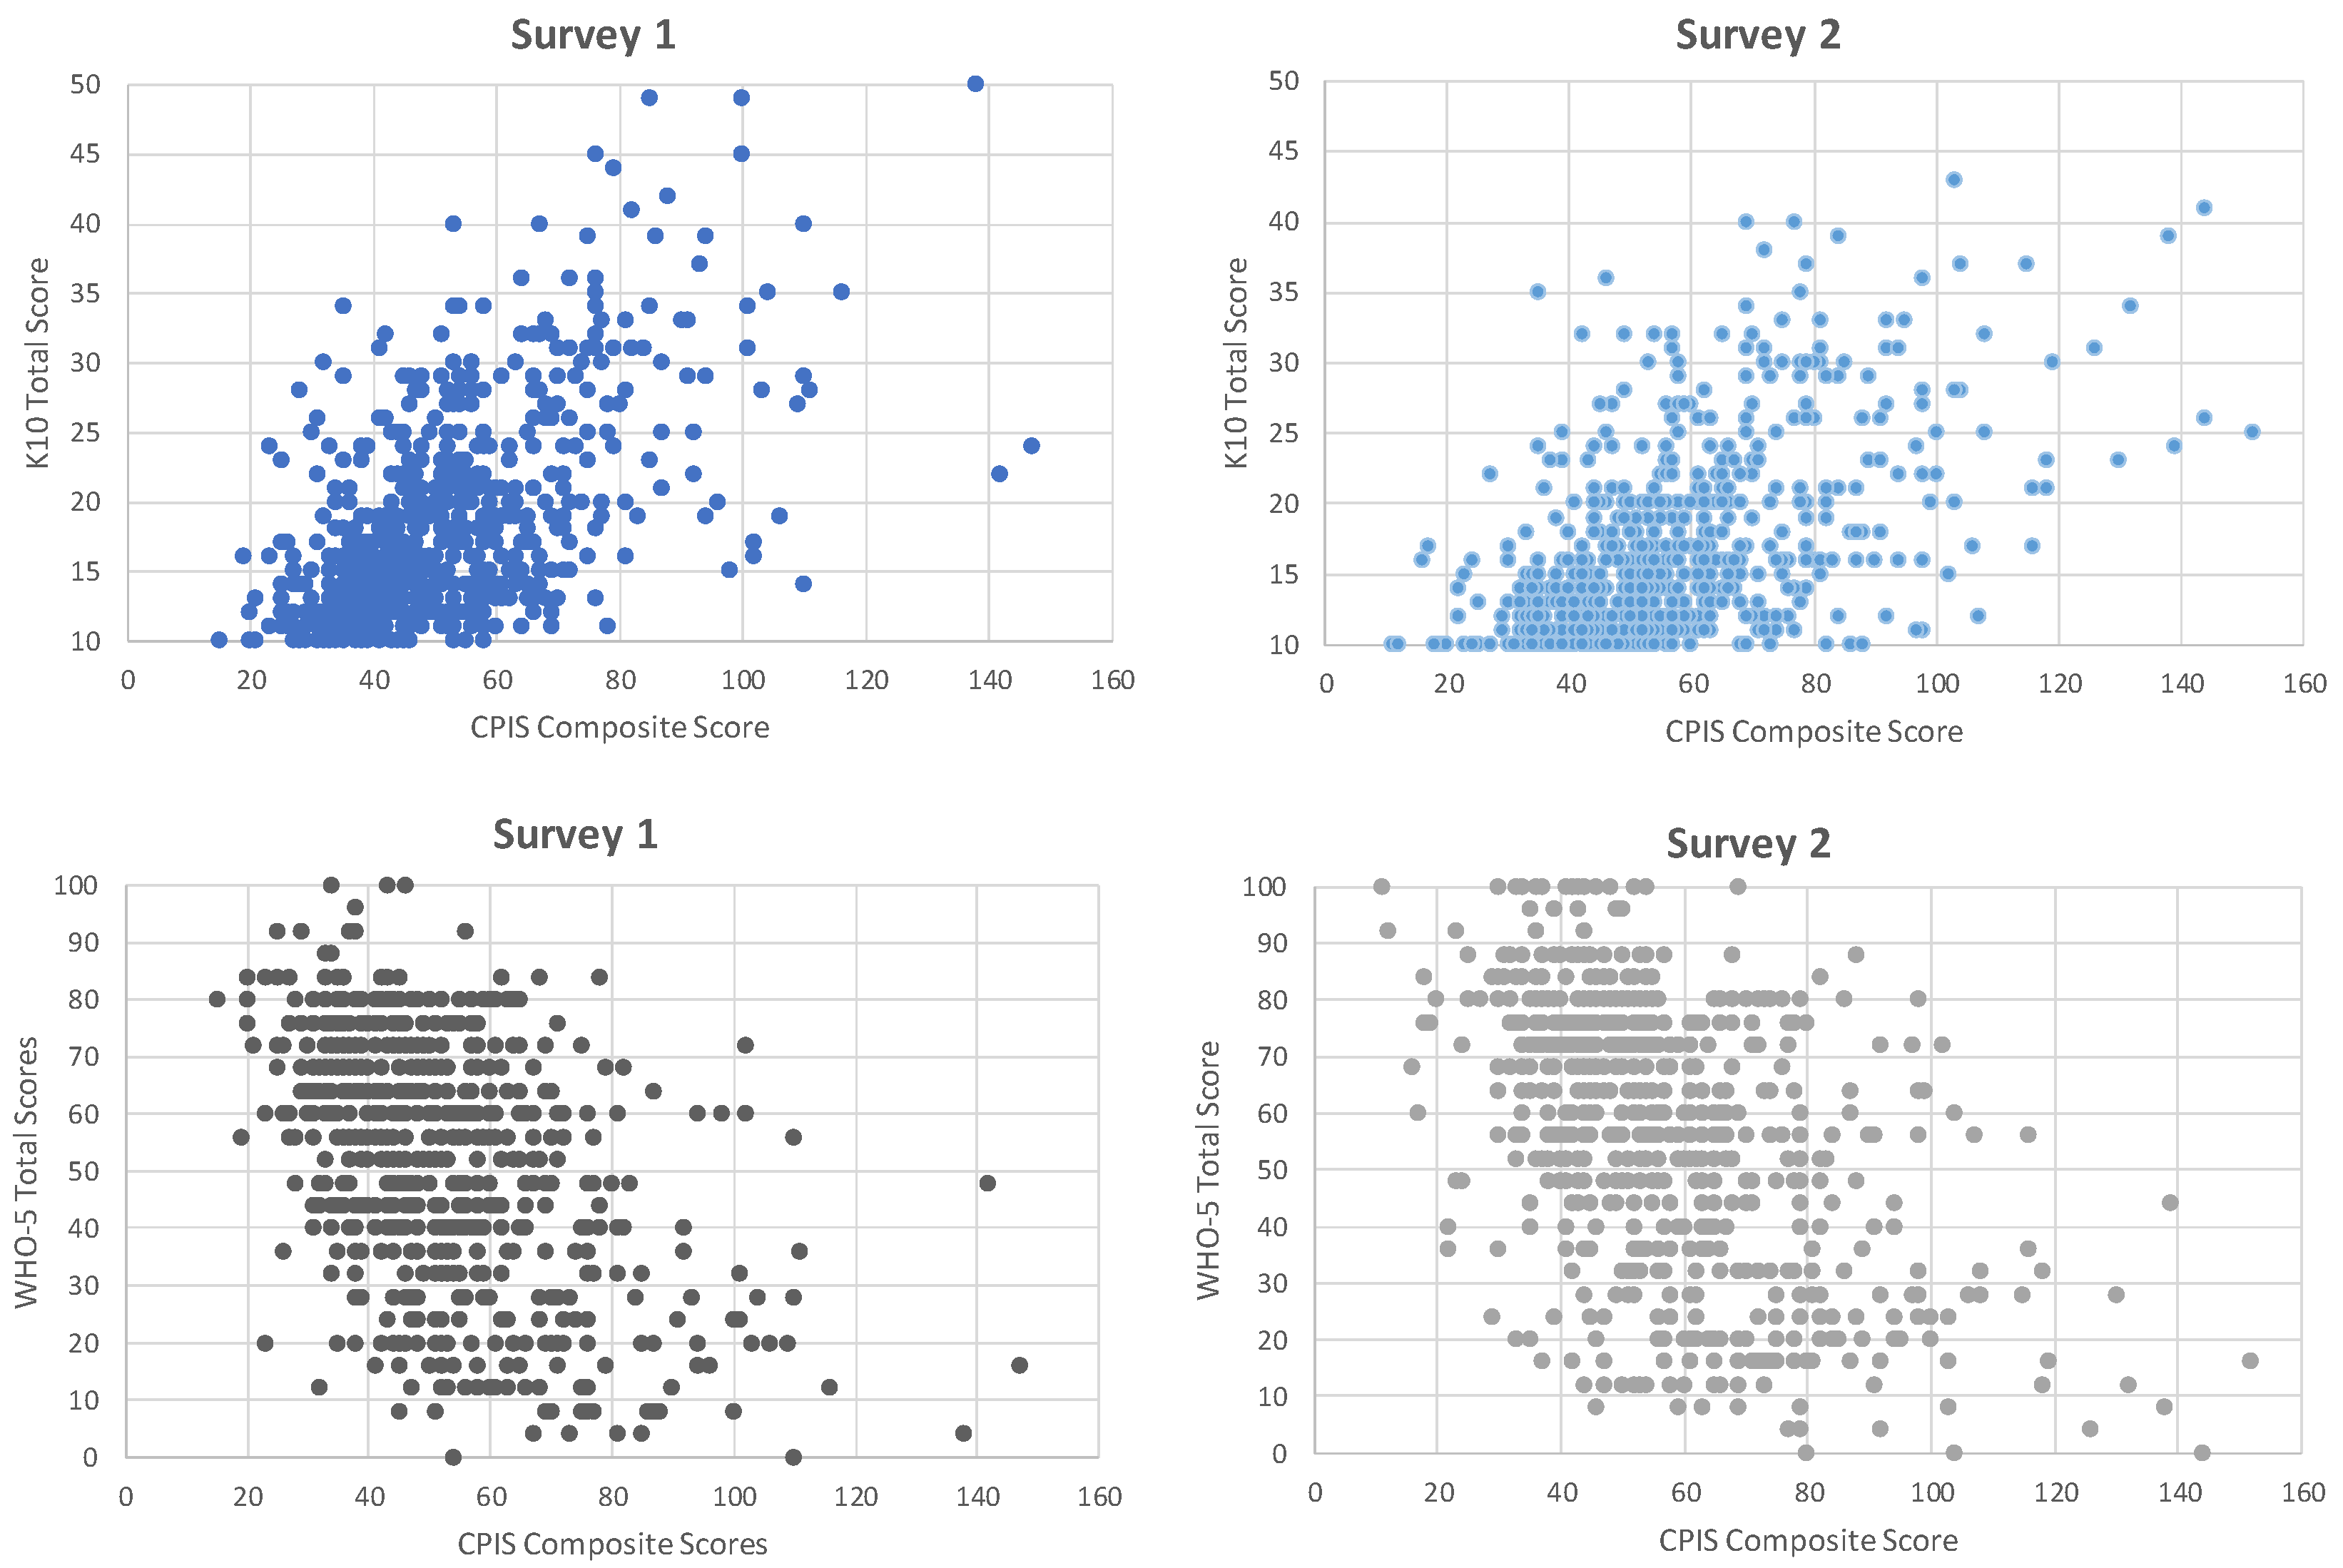
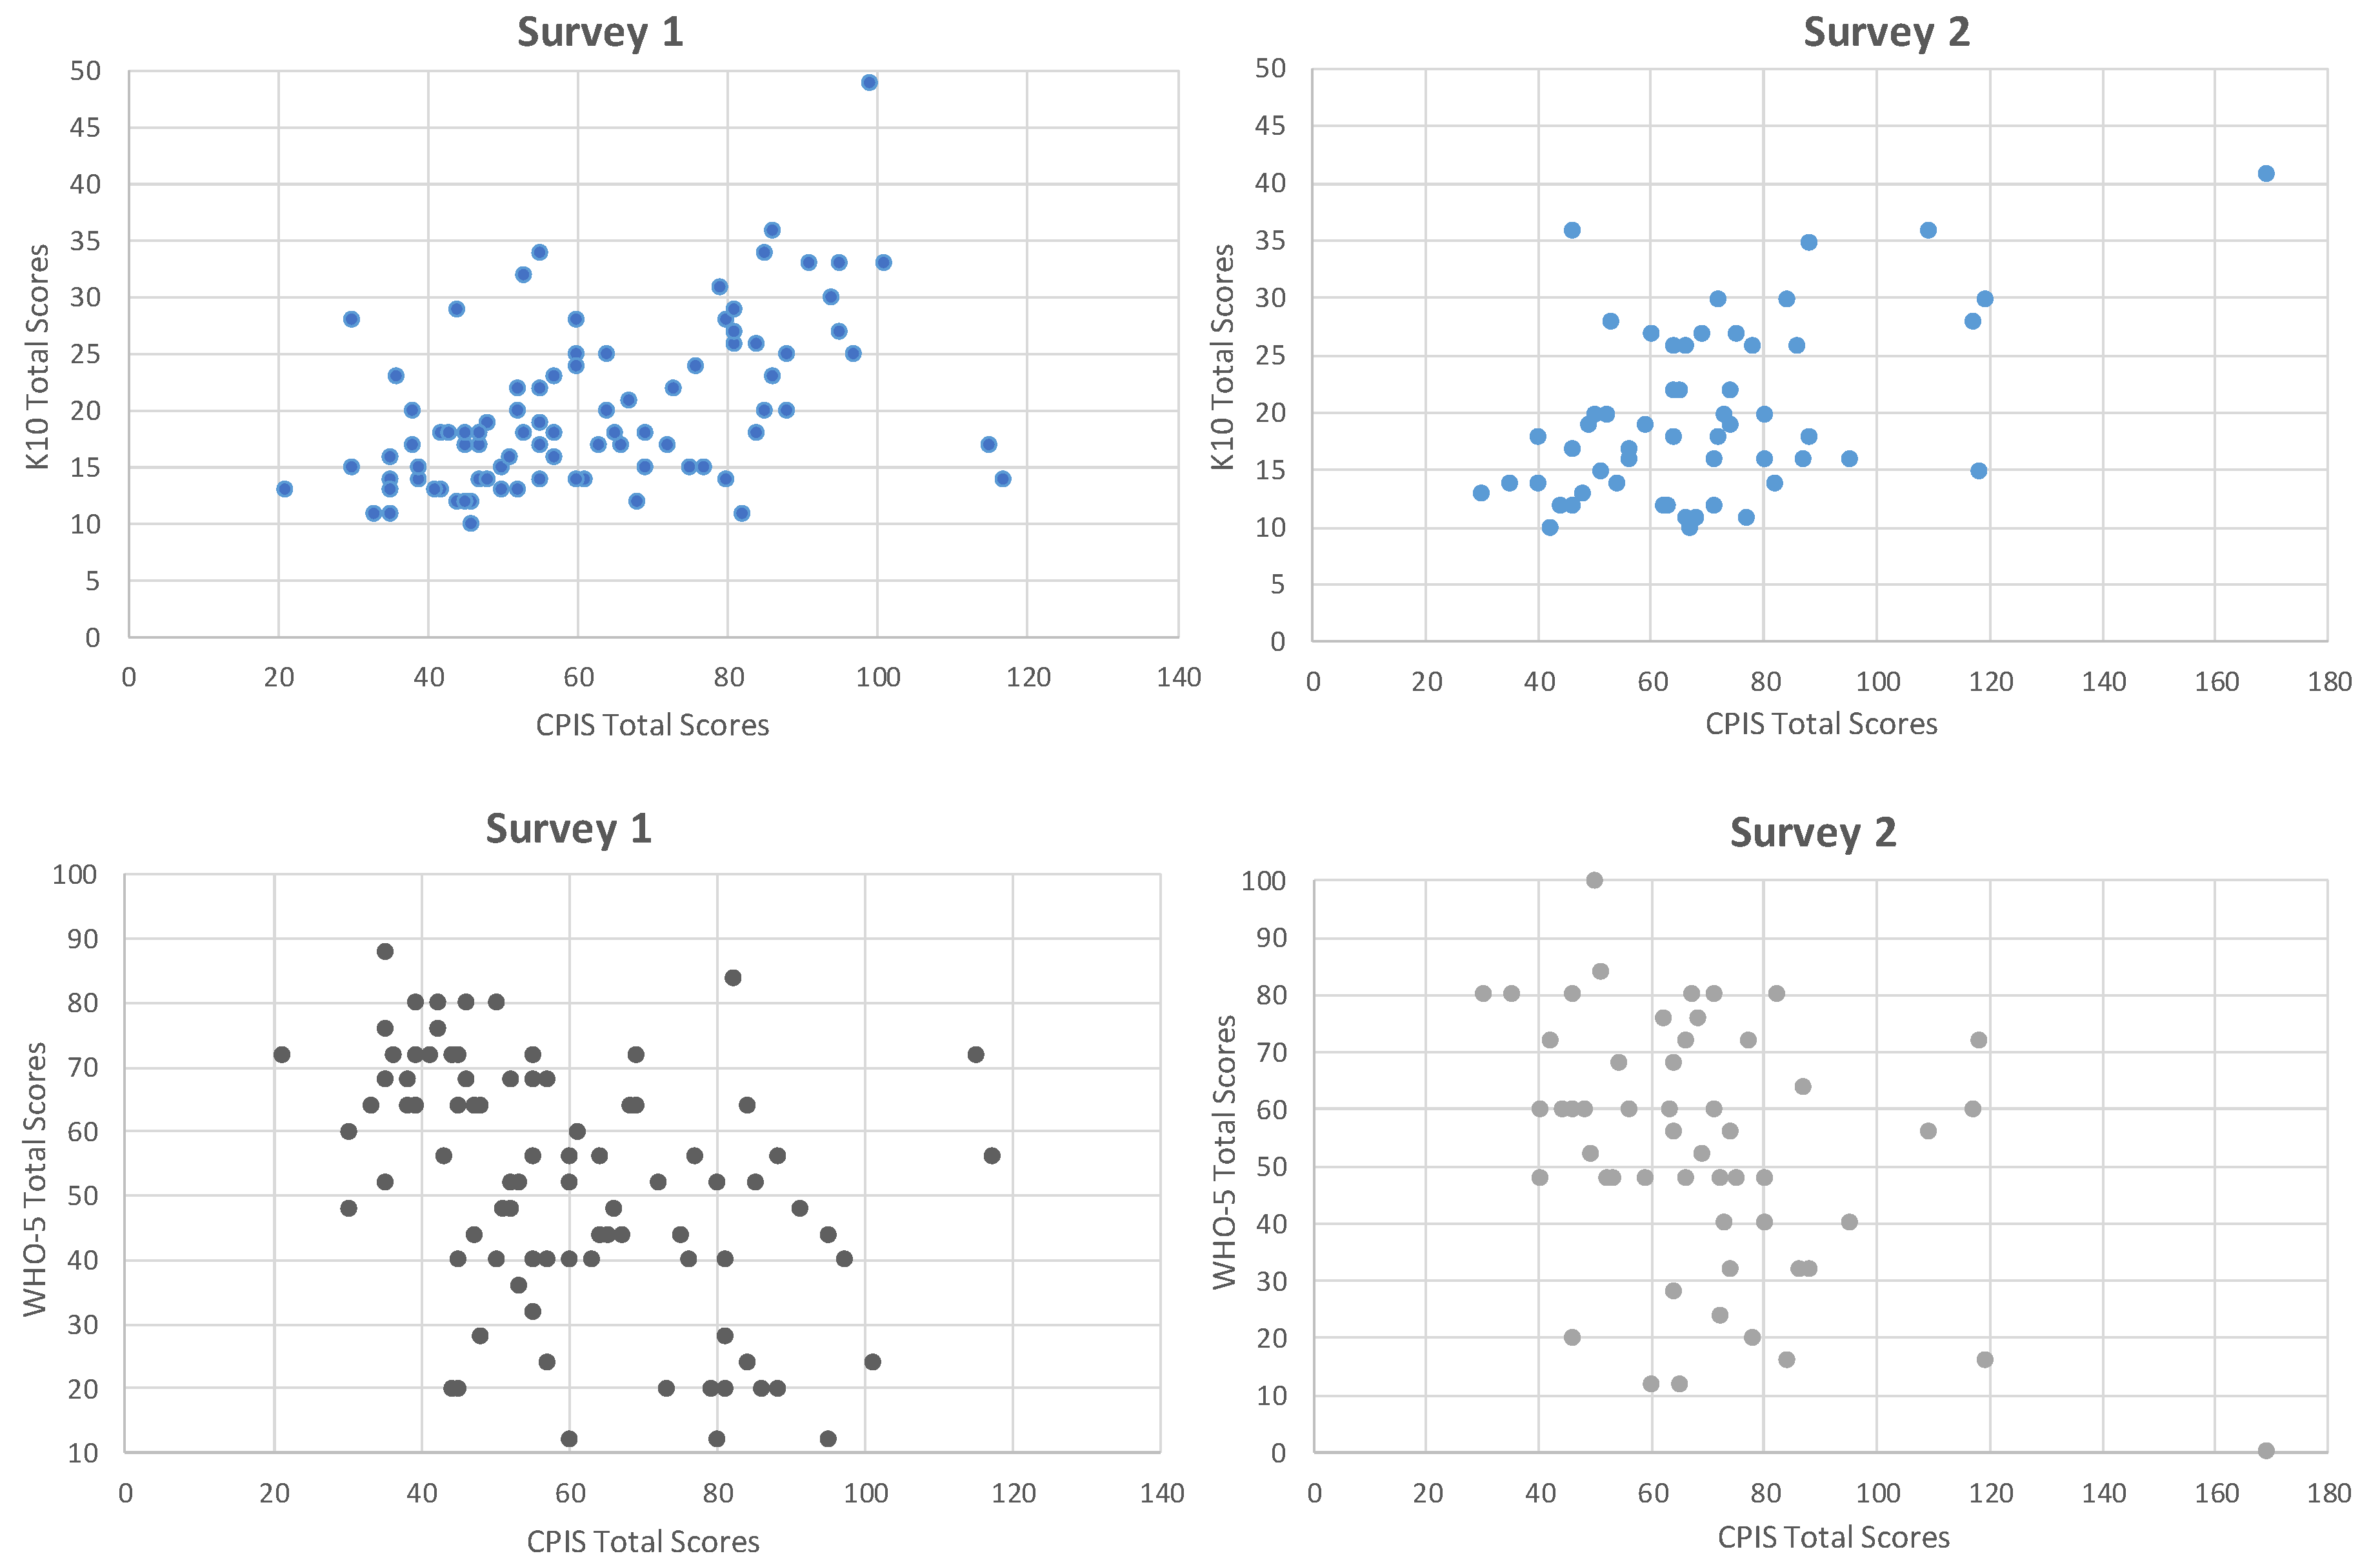
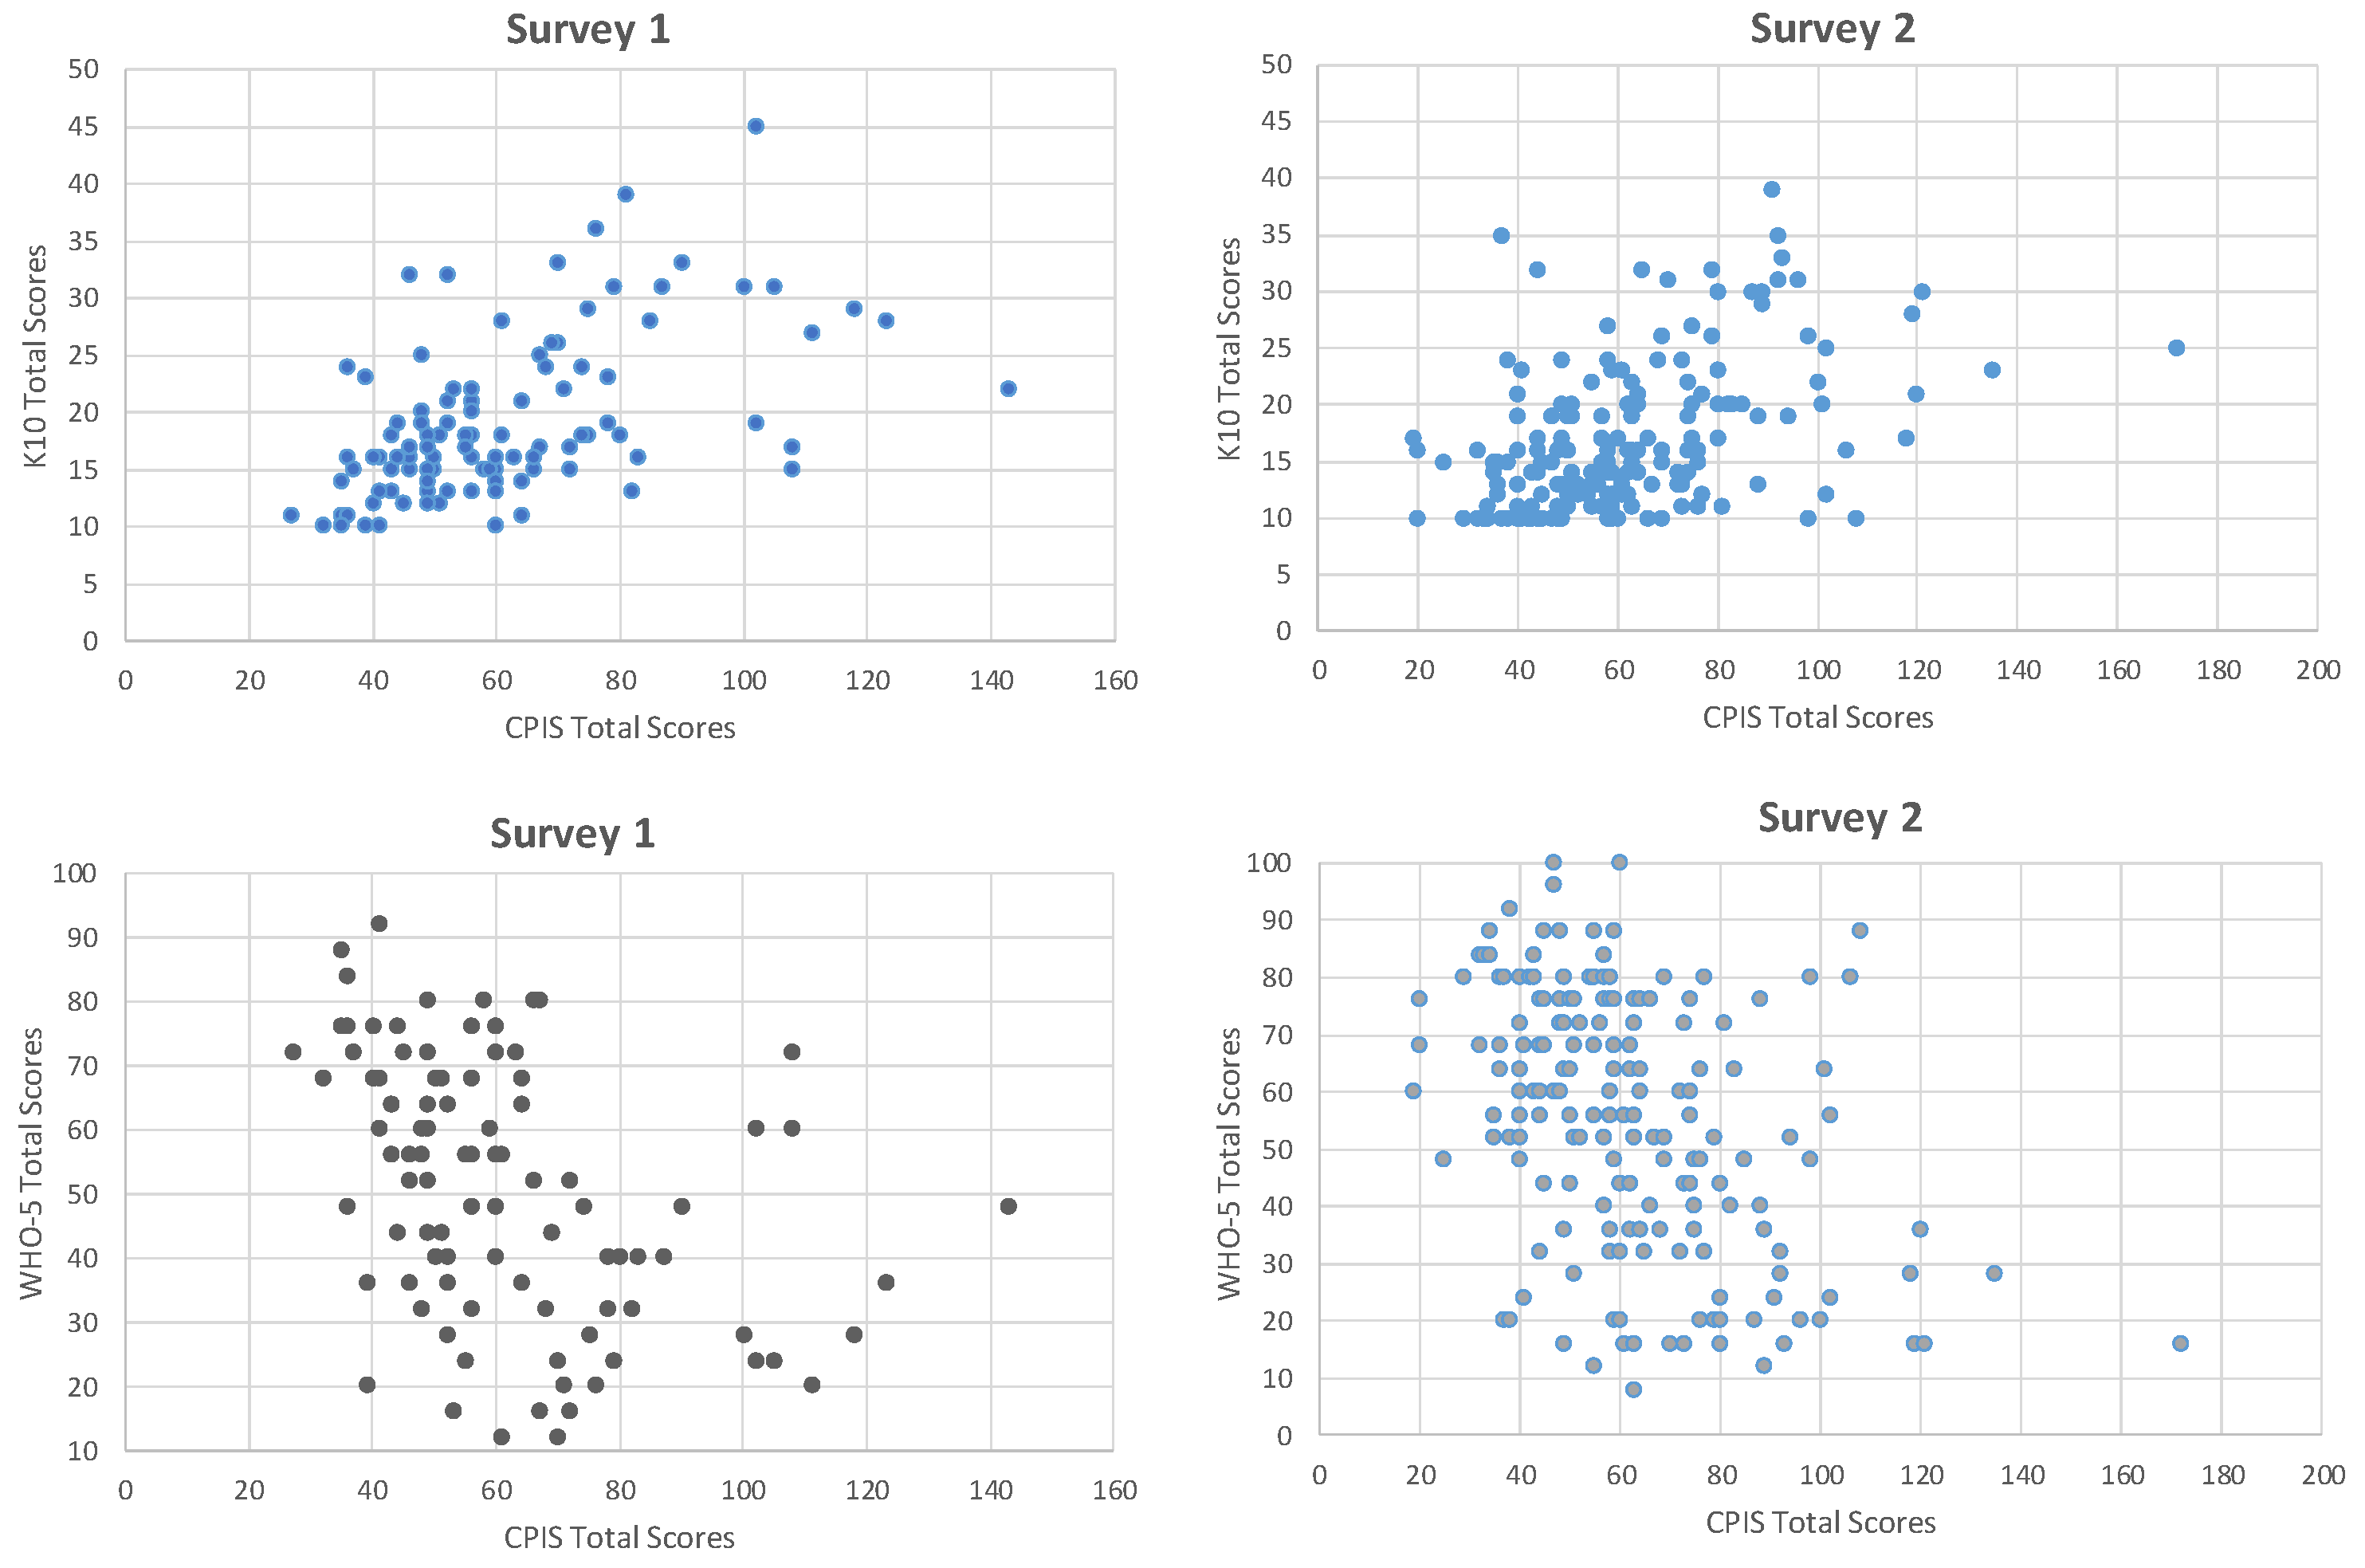
This study reports the findings of the psychometric study carried out to validate the newly developed CPIS that comprehensively assessed the impacts of the COVID-19 pandemic including the adverse personal, social, and economic consequences that followed along with the positive outcomes which may have occurred. Data were obtained in 2020 and 2022 to capture different exposures to the COVID-19 pandemic from a non-representative New Zealand sample. The main findings of this psychometric study were of a unidimensional structure within the CPIS subscales and inter-relatedness among CPIS stress-related subscales. Results showed CPIS to have a moderate negative correlation with K10 and a moderate positive correlation with WHO-5, reflecting construct validity.
Previously, Every-Palmer and colleagues examined psychological distress and wellbeing using the K10 and WHO-5 during New Zealand’s first lockdown in April 2020 in a demographically representative sample and reported moderate stress in thirty percent and low levels of wellbeing in forty percent of their participants [8]. Although the findings of Every-Palmer and colleagues are not directly comparable, due to different sampling strategies, but collectively both studies indicate a significant increase in the level of distress compared to previous population surveys [39,40], reflecting the overall impacts of the COVID-19 pandemic. Similar findings of increased psychological distress have been reported by researchers in the US [41], Europe [42,43], and Asia [44] (see also [7]). Although the use of pre-existing standardised measures allows pre-pandemic comparisons, these measures do not specifically examine the impacts of COVID-related stressors. Hence, we recommend using pandemic-related measures in conjunction with established psychometric measures to provide further depth to the interpretation of the findings.
Importantly, this study offered a unique opportunity to conduct the survey at various exposures of the COVID-19 pandemic in New Zealand and highlighted the impacts of the fluid nature of the pandemic on the findings. For survey 1, we reported mild-to-moderate levels of pandemic-related stress on CPIS amongst our sample when there was a low prevalence and no community transmission of COVID-19 in New Zealand. In survey 2, an overall increase in scores on CPIS and its subscales (personal stress, social stress, perception of overall life stress pre/post COVID-19, positive impacts) suggests that CPIS was sensitive to change in pandemic exposure. Interestingly, the participants who took part in both surveys also showed a similar trend. This may be due to a gradual recovery from the economic problems related to lockdowns and the country being closed.
Our findings suggest that the reliability and validity scores varied across time points. We attributed this to the various pandemic exposures and situational factors. Some of the items that were not reliable at the time of survey 1 showed acceptable reliability scores at the time of survey 2. These included item 2 (“Have you had a COVID test?”) and item 6 (“Do you feel any family member is at risk of being exposed to someone with COVID-19 through their work?”). In contrast, some of the items were reliable at the time of survey 1 but did not show acceptable reliability scores at the time of survey 2. This includes item 28 (“Has your household needed to seek help from a food bank or other charitable organisation?”). We argue that this is an issue of a floor effect rather than a reliability effect. Floor and ceiling effects are likely to affect some items in periods of relatively low and relatively high prevalence, but importantly no sustained floor or ceiling effects were observed over the two periods. We, therefore, argue that the reliability and validity of the CPIS were reasonably stable even though there was a difference in the levels of COVID-related stresses and morbidity between the two administrations of the questionnaire.
We also acknowledge some key contextual factors surrounding CPIS development. The experience of the pandemic in New Zealand was different compared to many other jurisdictions due to the presence of strong temporary laws that were in place to prevent the transmission of the virus. For instance, the “essential worker” category was a legal entity that permitted working outside of the home for certain designated professions during the lockdown in New Zealand, under the strict restrictions and measures in place. This was a heterogenous group (e.g., those working in healthcare, law enforcement, emergency services, or providers of essential goods/services such as those working in supermarkets or transport) in regard to income levels and risk of exposure to possible COVID-19 infection. In both surveys, a substantial percentage of participants and their families were essential workers (see Appendix A), but items 12 and 13 assessing stress owing to being an essential worker or having a family or friend as an essential worker showed poor item-total correlations by including as part of the financial stress subscale. These low-item-total correlations could be attributed to the timing of data collection as both surveys were administered when there was no lockdown in place in New Zealand. Hence, being an essential worker did not appear to contribute to stress as these items did not show much variability in the true scores, resulting in low-item-total correlations. Considering the current COVID-19 scenario, we argue that these items will be less important in future iterations of CPIS, and hence these items would likely be reconsidered as demographic items.
In addition, in 2020 (at the time of survey 1), the item “Have you had a COVID test?” had a ‘leaf’ question “If Yes, was the result positive?” At that time there was a low prevalence of COVID-19 in New Zealand and no evidence of community transfer. Although one-third of the participants had a COVID-19 test (only polymerase chain reaction tests were available), only one participant had been diagnosed with COVID-19. In 2022 (at the time of survey 2), there were reduced COVID restrictions owing to high vaccination rates; with Omicron, the infection rates have increased to 35% or more of the New Zealand population. Since now most people have had a COVID diagnosis, having a positive test will not be particularly discriminative. Therefore, we have modified those two items to “Have you ever been suspected of having COVID-19?” and “If yes, have you had a COVID test?” to capture stress owing to being a suspect of getting COVID-19 and stress of having a COVID test. In survey 1, other items also showed low-item-total correlations. These items were retained in the follow-up survey pragmatically and our findings from survey 2 affirm that those items showed acceptable reliability scores when the prevalence of COVID-19 changed considerably. In short, our team considered both psychometric and pragmatic considerations in designing the items of CPIS to reflect the fluid situation on the ground.
In recognition of the positive impacts of COVID-19 [22,23,24], we added four items assessing the sense of the meaning to life. On reflection, these items appear limited in their assessment of this area. We are considering removing these items in future iterations of the CPIS to balance the question types and to reduce the response burden. This area can be assessed by a standardised scale such as the Post-traumatic Growth Inventory [45] to examine whether a person has undergone a positive transformation after a traumatic event, such as COVID-19. In addition, there were twelve opposite items in three domains (relationships, changes to daily routines and behaviours, changes to faith-related activities) of CPIS assessing the same idea but one from a positive, and the other from a negative direction. These items were added to conceptualize any change in these domains as being a stressor, whether it is positive or negative. Either of these pairs of items could be considered ‘stressful’, however, it is unlikely that participants would endorse both items, rather they would be more likely to endorse one, but not the other. Although these items were not highly correlated warranting item-response bias [46], we are considering removing them to reduce the response burden in future iterations of CPIS and to capture negative aspects of functioning in these domains alone by assessing conceptually similar items to shed light on the same underlying construct. The CPIS included two optional subscales assessing the stress owing to changes to education-related and faith-related activities in response to COVID-19. This paper demonstrates how to use CPIS with and without these subscales. Future researchers can consider taking out optional subscales depending on their research interests. Lastly, there can be other pandemic-related life events that can be stressful (such as stress owing to vaccination mandates, travel bans, etc.) or other positive life changes due to the pandemic (such as adopting a healthier lifestyle or improving financial status) which could be added in the future iterations of CPIS, if applicable to the pandemic context.
This study has the following strengths. The CPIS was developed using the same “participant researcher” approach applied to understanding the psychosocial impacts of the Canterbury earthquakes [25,26,34,35]. This approach assesses exposure to the immediate impacts of the disaster and the adverse personal, social, and economic consequences that follow. We believe that the use of pandemic-specific impact scales is required to identify specific impacts of COVID-related stressors, and this cannot be achieved by established measures alone. The CPIS offers some unique advantages over other available pandemic-related scales, including an assessment of both negative and positive impacts. The CPIS can also be used in the general population and targeted groups, such as healthcare workers, essential workers, and other at-risk groups. We have also demonstrated its use in different pandemic-related contexts.
This study has the following limitations. The main limitations include data collection from a non-representative New Zealand sample representing literate or high-income individuals. Since the psychological effects of COVID-19 were widely anticipated, it would be ideal to have a representative sample. The survey was delivered online, and evidence suggests that people living with disabilities (including mental illness) are less likely to participate in online surveys [47]. It would be interesting to explore the association between socio-demographic and study variables using regression analysis to pool predictor variables. This was not done to keep the emphasis on reporting the scale’s psychometric characteristics. Future analyses of this or an expanded data set using a regression analysis would be useful.
Lastly, the COVID-19 mortality rate—even at its peak in New Zealand—was considerably lower than in many other countries. For instance, as of 3 March 2023, the USA’s total COVID-19 attributable death rate per 100,000 was estimated at 335.09, some 6.4 times higher than New Zealand’s rate of 52.71 [48]. This may affect the external validity and/or psychometric properties—especially in countries with considerably higher morbitiy and mortality rates. Although the CPIS was developed to be cross-culturally applicable, it has not yet been trialed in different cultures/countries—but consultation and co-design were used to fit it for such use. Further studies are underway in which a brief 32-item CPIS will be used in combination with other standardised measures of wellbeing (WHO-5), distress (K10, PTSD Checklist for DSM-5 [49]), and post-traumatic growth (PTGI) in several countries [50]. To achieve this, the CPIS and other measures were translated using parallel back-to-back translations by a team of proficient bilingual academics and researchers who were familiar with the content and context [51]. This follow-up study (Clinical Trials Registry (NCT05052333)) has the potential to contribute to an increased understanding of the psychosocial impacts of the COVID-19 pandemic and, importantly, to the development of psychosocial measures that allow cross-cultural comparisons.
The COVID-19 pandemic has had a profound impact on the world, causing widespread illness, death, and disruption to daily life. The fear and uncertainty surrounding the virus, coupled with social isolation and financial insecurity, have contributed to increased rates of depression, anxiety, and other mental health issues. With vaccines now widely available, and case numbers decreasing in many parts of the world, it may seem that the worst of the pandemic is over. However, measures taken to examine the psychosocial impacts of the pandemic should not be disregarded as new mutations of the virus could potentially lead to another global crisis. It is important to continue exploring and addressing the psychosocial impacts of the current pandemic as it evolves by adapting pandemic-related scales if necessary in future waves, as well as making efforts to improve preparedness for potential future pandemics.

5. Conclusions

This paper reports on the development and validation of CPIS, a self-report measure that comprehensively examines the psychosocial impacts of the COVID-19 pandemic. Importantly, this psychometric study was carried out at two distinct time points using an online survey to capture different exposures to the pandemic in the New Zealand population. The newly developed scale was used in combination with established measures of psychological distress and wellbeing. Findings suggest a unidimensional structure within CPIS subscales and inter-relatedness among CPIS stress-related subscales. The CPIS effectively examines the psychosocial impacts, both positive and negative; while it correlates with psychological distress and a general wellbeing, it is not only a proxy for these constructs. The data were obtained from a non-representative New Zealand sample using an online survey. This is the main limitation of this study. Future researchers should explore the association between socio-demographic and study variables along with reporting the psychometric properties of CPIS. The CPIS was developed to be cross-culturally applicable, further work will examine its cross-cultural use in countries with much higher morbidity and mortality rates. It is imperative to sustain the efforts taken to investigate and address the psychosocial impacts of the COVID-19 pandemic while continuing to improve our readiness for future pandemics.

Author Contributions

Conceptualization, S.T., R.J.P., C.B. and R.S.-H.; methodology, S.T., R.S.-H., J.B., D.S., B.B., R.J.P., P.J.S., C.B., F.A. and M.A.H.; software, S.T.; formal analysis, S.T., J.B., P.J.S., B.B. and R.J.P.; data curation, S.T. and D.S.; writing—original draft preparation, S.T.; writing—review and editing, S.T., P.J.S., B.B., R.J.P., R.S.-H., J.B., D.S., S.D., F.A., M.A.H. and C.B.; visualization, S.T.; supervision, C.B.; and project administration, S.T. All authors have read and agreed to the published version of the manuscript.

Funding

The authors declare that this study received no external funding. No funder was involved in the study design, collection, analysis, and interpretation of data, the writing of this article or the decision to submit it for publication.

Institutional Review Board Statement

The study was approved by the Human Ethics Committee of the University of Otago, New Zealand (F20/003, 16 September 2020) for studies involving humans.

Informed Consent Statement

Informed consent was obtained from all subjects involved in the study.

Data Availability Statement

Data are available on request.

Acknowledgments

We would like to acknowledge Ivy Kessewa Nkrumah from the University of Cape Coast, Ghana, to review the newly developed COVID Psychosocial Impacts Scale (CPIS).

Conflicts of Interest

All authors declare that the research was conducted in the absence of any commercial or financial relationships that could be construed as potential conflicts of interest.

Appendix A

Table A1. Showing Demographic Characteristics of Participants.
DemographicsSurvey 1 (N = 663)Survey 2 (N = 687)
n%n%
Gender
Male1552331446
Female4977536453
Other11291
Age range (in years)
18–198100
20–298713325
30–39140217110
40–492213313920
50–591071616724
60–69711115623
70 and above29412218
Marital status
Single119189514
In relationship1532312318
Married3415139858
Separated122233
Divorced284274
Widowed 102213
Ethnicity
NZ European5838861389
Māori447386
Pacific peoples6161
Asian102223
Middle Eastern/Latin American/African4141
Other6910528
Highest education level
No formal education51101
Secondary school508538
Tertiary qualification1091614121
Bachelor degree2163321631
Postgraduate degree2834326739
Current work or labour force status
Employed full-time3615435652
Employed part-time1712613920
Unemployed 437284
Not in the labour force901416424
Occupation
Manager80129614
Professional3315032647
Technicians and trade workers305233
Community and personal service workers213183
Clerical and administration workers497335
Sales workers11271
Machinery operators and drivers2041
Labourers2041
Residential categories/Others1372117626
Annual family income
$14,000 or less8413588
$14,001–$48,0001562417325
$48,001–$70,0001261911316
>$70,0002954534350
Trauma exposure before COVID-19
Natural disaster2253424936
Living in a war zone or exposed to military conflict173315
Childhood adversity before the age of 161642515322
Physical or sexual assault after the age of 1684136810
Serious physical accident5897311
Other19630649
COVID-19 Specific Demographics
Current living arrangement
Living alone771210615
Partner/Spouse2033130244
Family3104725036
Flatmates/Friends6610284
Hall of Residence/Hostel6110
Change in living arrangement since COVID-19
No change5838858084
Increased number of people376517
Decreased number of people437568
Sources of information regarding COVID-19
News6039157183
Facebook/Twitter2684014121
Health websites4116245767
Word of mouth1542317425
Others941415823
Number of hours seeking information about COVID-19
Less than one hour per day 5057660288
1–2 h per day135207010
2–4 h per day173112
4–8 h per day 5130
More than 8 h per day0010
The participant is an essential worker1542317025
Close Family and friends are an essential worker(s)2213337555

Appendix B

Table A2. Showing Exploratory Factor Analysis 1 of COVID Psychosocial Impacts Scale Subscales for Participants Who Responded on Education-related Stress Subscale.
SubscalesSurvey 1 (n = 91)Survey 2 (n = 55)
Mean (SD)Factor 1 aFactor 2Mean (SD)Factor 1 aFactor 2
Personal stress10.7 (5.7)0.81−0.1716.6 (8)0.87−0.07
Family stress12.7 (6.1)0.830.1418 (9.8)0.82−0.24
Financial stress6.7 (7.1)0.61−0.597.3 (7.5)0.580.43
Perception of overall life stress pre/post COVID-1913.5 (2.5)0.760.1213.7 (2.6)0.610.49
Education-related stress6.9 (5.3)0.710.194.5 (5)0.66−0.28
Positive impacts11 (4.4)0.190.859.3 (3.2)−0.140.74
1 The extraction method is principal component analysis. Components in bold have an r value above 0.3. a Factor having an α-value above 0.70.
Table A3. Showing Exploratory Factor Analysis 1 of COVID Psychosocial Impacts Scale Subscales for Participants Who Responded on Faith-related Stress Subscale.
SubscalesSurvey 1 (n = 103)Survey 2 (n = 181)
Mean (SD)Factor 1 aFactor 2Mean (SD)Factor 1 aFactor 2
Personal stress11.7 (7.3)0.90−0.0514.2 (7.6)0.88−0.16
Family stress12.6 (7.1)0.88−0.0915 (8.7)0.84−0.10
Financial stress7.4 (8)0.720.065.2 (6.4)0.64−0.08
Perception of overall life stress pre/post COVID-1913.1 (2.7)0.650.3312.8 (3)0.660.02
Faith-related stress4.3 (3.1)0.45−0.124.3 (3.9)0.500.42
Positive impacts12.6 (3.7)−0.090.9510 (3.8)0.060.93
1 The extraction method is principal component analysis. Components in bold have an r value above 0.3. a Factor having an α-value above 0.70.

Appendix C

Table A4. Showing the Descriptive Statistics of the COVID Psychosocial Impacts Scale (CPIS), CPIS Subscales, Kessler 10 (K10), and World Health Organization Well-Being Index 5 (WHO-5) for Participants who responded to Both of the Optional Subscales of CPIS.
Survey 1 (n = 13)Survey 2 (n = 13)
Score RangeMean (SD)Score RangeMean (SD)
Personal stress 4–2512.1 (6.4)7–3515.9 (6.6)
Social stress5–2514.1 (5.8)6–4518.6 (10.8)
Financial stress0–356 (9.7)0–228.7 (6.5)
Perception of overall life stress pre/post COVID-1912–1713.8 (1.6)10–1913.6 (2.4)
Education-related stress1–168.3 (5)0–134.5 (4.7)
Faith-related stress2–134.5 (3.2)0–83.3 (2.3)
Positive impacts4–2012.7 (4.6)5–1510.4 (2.9)
CPIS total score 46–12171.5 (22.8)43–12175.1 (19)
K1012–3621.2 (8)10–3616.4 (6.6)
WHO-520–8048.9 (22.1)20–10065.9 (20.2)

Appendix D

Figure A1. Showing Scatter Plot Showing a Positive Linear Correlation between COVID Psychosocial Impacts Scale (CPIS) and Kessler 10 (K10); and a Negative Linear Correlation between CPIS and World Health Organization Well-Being Index 5 (WHO-5) for Participants Who Responded to the Education-related Stress Subscale.
Ijerph 20 05990 g0a1
Table A5. Showing Construct Validity of COVID Psychosocial Impacts Scale (CPIS) and CPIS Subscales with Kessler 10 (K10) and World Health Organization Well-Being Index 5 (WHO-5) for Participants Who Responded on Education-related Stress Subscale 1.
Personal StressSocial StressFinancial StressPerception of Overall Life Stress Pre/Post COVID-19Education-Related StressPositive ImpactsCPIS Total ScoreK10WHO-5
Personal stress 10.74 **0.39 **0.41 **0.46 **−0.090.87 **0.51 **−0.45 **
Social stress0.57 **10.220.33 *0.48 **−0.130.83 **0.47 **−0.41 **
Financial stress0.55 **0.38 **10.42 **0.25−0.010.69 **0.17−0.10
Perception of overall life stress pre/post COVID-190.46 **0.53 **0.31 **10.180.050.55 **0.32 *−0.49 **
Education-related stress0.42 **0.53 **0.21 *0.50 **1−0.110.63 **0.39 **−0.16
Positive impacts0.100.22 *−0.160.140.1110.03−0.120.06
CPIS total score0.81 **0.82 **0.66 **0.66 **0.68 **0.29 **10.51 **−0.42 **
K100.35 **0.40 **0.21 *0.35 **0.55 **0.160.50 **1−0.73 **
WHO-5−0.39 **−0.36 **−0.25 *−0.45 **−0.38 **−0.20−0.48 **−0.76 **1
1 Data from survey 1 (n = 91) is shown in blue and data from survey 2 (n = 55) is in grey. ** Correlation is significant at the 0.01 level (2-tailed). * Correlation is significant at the 0.05 level (2-tailed).

Appendix E

Figure A2. Showing Scatter Plot Showing a Positive Linear Correlation between COVID Psychosocial Impacts Scale (CPIS) and Kessler 10 (K10); and a Negative Linear Correlation between CPIS and World Health Organization Well-Being Index 5 (WHO-5) for Participants Who Responded to Faith-related Stress Subscale.
Ijerph 20 05990 g0a2
Table A6. Showing Construct Validity of COVID Psychosocial Impacts Scale (CPIS) and CPIS Subscales with Kessler 10 (K10) and World Health Organization Well-Being Index 5 (WHO-5) for Participants Who Responded on Faith-related Stress Subscale 1.
Personal StressSocial StressFinancial StressPerception of Overall Life Stress Pre/Post COVID-19Faith-Related StressPositive ImpactsCPIS
Total Score
K10WHO-5
Personal stress 10.75 **0.44 **0.47 **0.34 **−0.060.86 **0.43 **−0.42 **
Social stress0.79 **10.35 **0.48 **0.26 **0.020.85 **0.40 **−0.39 **
Financial stress0.604 **0.47 **10.28 **0.30 **−0.030.65 **0.26 **−0.26 **
Perception of overall life stress pre/post COVID-190.45 **0.46 **0.37 **10.090.120.59 **0.49 **−0.47 **
Faith-related stress0.32 **0.38 **0.120.1110.15 *0.50 **0.08−0.06
Positive impacts−0.08−0.11−0.040.070.0010.19 *−0.050.02
CPIS total score0.89 **0.85 **0.77 **0.58 **0.43 **0.1010.45 **−0.43 **
K100.55 **0.48 **0.29 **0.55 **0.23 *−0.050.53 **1−0.74 **
WHO-5−0.38 **−0.34 **−0.25 **−0.48 **−0.18−0.18−0.44 **−0.70 **1
1 Data from survey 1 (n = 103) is shown in blue and data from survey 2 (n = 181) is in grey. ** Correlation is significant at the 0.01 level (2-tailed).* Correlation is significant at the 0.05 level (2-tailed).

References

  1. Cénat, J.M.; Blais-Rochette, C.; Kokou-Kpolou, C.K.; Noorishad, P.G.; Mukunzi, J.N.; McIntee, S.E.; Dalexis, R.D.; Goulet, M.A.; Labelle, P.R. Prevalence of Symptoms of Depression, Anxiety, Insomnia, Posttraumatic Stress Disorder, and Psychological Distress among Populations Affected by the COVID-19 Pandemic: A Systematic Review and Meta-Analysis. Psychiatry Res. 2021, 295, 113599. [Google Scholar] [CrossRef]
  2. Wu, T.; Jia, X.; Shi, H.; Niu, J.; Yin, X.; Xie, J.; Wang, X. Prevalence of Mental Health Problems during the COVID-19 Pandemic: A Systematic Review and Meta-Analysis. J. Affect. Disord. 2021, 281, 91–98. [Google Scholar] [CrossRef]
  3. Muldoon, O.T.; Liu, J.H.; McHugh, C. The Political Psychology of COVID-19. Polit. Psychol. 2021, 42, 715–728. [Google Scholar] [CrossRef]
  4. Dubey, S.; Biswas, P.; Ghosh, R.; Chatterjee, S.; Dubey, M.J.; Chatterjee, S.; Lahiri, D.; Lavie, C.J. Psychosocial Impact of COVID-19. Diabetes Metab. Syndr. Clin. Res. Rev. 2020, 14, 779–788. [Google Scholar] [CrossRef]
  5. World Health Organization. Mental Health and Psychosocial Considerations during COVID-19 Outbreak. 2020. Available online: https://www.who.int/docs/default-source/coronaviruse/mental-health-considerations.pdf (accessed on 1 September 2022).
  6. Généreux, M.; Schluter, P.J.; Hung, K.K.; Wong, C.S.; Mok, C.P.Y.; O’sullivan, T.; David, M.D.; Carignan, M.-E.; Blouin-Genest, G.; Champagne-Poirier, O.; et al. One Virus, Four Continents, Eight Countries: An Interdisciplinary and International Study on the Psychosocial Impacts of the COVID-19 Pandemic among Adults. Int. J. Environ. Res. Public Health 2020, 17, 8390. [Google Scholar] [CrossRef]
  7. Généreux, M.; Schluter, P.J.; Landaverde, E.; Hung, K.K.; Wong, C.S.; Mok, C.P.Y.; Blouin-Genest, G.; O’Sullivan, T.; David, M.D.; Carignan, M.E.; et al. The Evolution in Anxiety and Depression with the Progression of the Pandemic in Adult Populations from Eight Countries and Four Continents. Int. J. Environ. Res. Public Health 2021, 18, 4845. [Google Scholar] [CrossRef]
  8. Every-Palmer, S.; Jenkins, M.; Gendall, P.; Hoek, J.; Beaglehole, B.; Bell, C.; Williman, J.; Rapsey, C.; Stanley, J. Psychological Distress, Anxiety, Family Violence, Suicidality, and Wellbeing in New Zealand during the COVID-19 Lockdown: A Cross-Sectional Study. PLoS ONE 2020, 15, e0241658. [Google Scholar] [CrossRef]
  9. Gasteiger, N.; Vedhara, K.; Massey, A.; Jia, R.; Ayling, K.; Chalder, T.; Coupland, C.; Broadbent, E. Depression, Anxiety and Stress during the COVID-19 Pandemic: Results from a New Zealand Cohort Study on Mental Well-Being. BMJ Open 2021, 11, e045325. [Google Scholar] [CrossRef]
  10. Chew, N.W.S.; Lee, G.K.H.; Tan, B.Y.Q.; Jing, M.; Goh, Y.; Ngiam, N.J.H.; Yeo, L.L.L.; Ahmad, A.; Ahmed Khan, F.; Napolean Shanmugam, G.; et al. A Multinational, Multicentre Study on the Psychological Outcomes and Associated Physical Symptoms amongst Healthcare Workers during COVID-19 Outbreak. Brain Behav. Immun. 2020, 88, 559–565. [Google Scholar] [CrossRef]
  11. Krishnamoorthy, Y.; Nagarajan, R.; Saya, G.K.; Menon, V. Prevalence of Psychological Morbidities among General Population, Healthcare Workers and COVID-19 Patients amidst the COVID-19 Pandemic: A Systematic Review and Meta-Analysis. Psychiatry Res. 2020, 293, 113382. [Google Scholar] [CrossRef]
  12. Iasevoli, F.; Fornaro, M.; D’Urso, G.; Galletta, D.; Casella, C.; Paternoster, M.; Buccelli, C.; de Bartolomeis, A. Psychological Distress in Patients with Serious Mental Illness during the COVID-19 Outbreak and One-Month Mass Quarantine in Italy. Psychol. Med. 2020, 51, 1054–1056. [Google Scholar] [CrossRef] [PubMed]
  13. Van Rheenen, T.E.; Meyer, D.; Neill, E.; Phillipou, A.; Tan, E.J.; Toh, W.L.; Rossell, S.L. Mental Health Status of Individuals with a Mood-Disorder during the COVID-19 Pandemic in Australia: Initial Results from the COLLATE Project. J. Affect. Disord. 2020, 275, 69–77. [Google Scholar] [CrossRef] [PubMed]
  14. Bell, C.; Williman, J.; Beaglehole, B.; Stanley, J.; Jenkins, M.; Gendall, P.; Rapsey, C.; Every-Palmer, S. Psychological Distress, Loneliness, Alcohol Use and Suicidality in New Zealanders with Mental Illness during a Strict COVID-19 Lockdown. Aust. N. Z. J. Psychiatry 2021, 56, 800–810. [Google Scholar] [CrossRef]
  15. Schluter, P.J.; Généreux, M.; Hung, K.K.; Landaverde, E.; Law, R.P.; Mok, C.P.Y.; Murray, V.; O’Sullivan, T.; Qadar, Z.; Roy, M. Patterns of Suicide Ideation Across Eight Countries in Four Continents During the COVID-19 Pandemic Era: Repeated Cross-Sectional Study. JMIR Public Health Surveill. 2022, 8, e32140. [Google Scholar] [CrossRef]
  16. Chandu, V.C.; Marella, Y.; Panga, G.S.; Pachava, S.; Vadapalli, V. Measuring the Impact of COVID-19 on Mental Health: A Scoping Review of the Existing Scales. Indian J. Psychol. Med. 2020, 42, 421–427. [Google Scholar] [CrossRef]
  17. Recommended Scales. Available online: https://www.covidminds.org/mental-health-measures (accessed on 1 May 2020).
  18. The Coronoavirus Health Impact Survey (CRISIS) (n.d.). Available online: http://www.crisissurvey.org/ (accessed on 1 May 2020).
  19. Ahorsu, D.K.; Lin, C.Y.; Imani, V.; Saffari, M.; Griffiths, M.D.; Pakpour, A.H. The Fear of COVID-19 Scale: Development and Initial Validation. Int. J. Ment. Health Addict. 2020, 20, 1537–1545. [Google Scholar] [CrossRef]
  20. Lee, S.A. Coronavirus Anxiety Scale: A Brief Mental Health Screener for COVID-19 Related Anxiety. Death Stud. 2020, 44, 393–401. [Google Scholar] [CrossRef] [PubMed]
  21. Silva, W.A.D.; de Sampaio Brito, T.R.; Pereira, C.R. COVID-19 Anxiety Scale (CAS): Development and Psychometric Properties. Curr. Psychol. 2022, 41, 5693–5702. [Google Scholar] [CrossRef]
  22. COVID-Minds. February Update: The Psychological Impact of COVID-19. Available online: https://www.covidminds.org/post/february-update-the-psychological-impact-of-COVID-19 (accessed on 1 May 2020).
  23. Jenkins, M.; Hoek, J.; Jenkin, G.; Gendall, P.; Stanley, J.; Beaglehole, B.; Bell, C.; Rapsey, C.; Every-Palmer, S. Silver Linings of the COVID-19 Lockdown in New Zealand. PLoS ONE 2021, 16, e0249678. [Google Scholar] [CrossRef]
  24. Beaglehole, B.; Williman, J.; Bell, C.; Stanley, J.; Jenkins, M.; Gendall, P.; Hoek, J.; Rapsey, C.; Every-Palmer, S. Thriving in a Pandemic: Determinants of Excellent Wellbeing Among New Zealanders During the 2020 COVID-19 Lockdown. PLoS ONE 2022, 17, e0262745. [Google Scholar] [CrossRef]
  25. Fergusson, D.M.; Boden, J.M.; Horwood, L.J.; Mulder, R.T. Perceptions of Distress and Positive Consequences Following Exposure to a Major Disaster amongst a Well-Studied Cohort. Aust. N. Z. J. Psychiatry 2014, 49, 351–359. [Google Scholar] [CrossRef]
  26. McLeod, G.F.H.; Horwood, L.J.; Fergusson, D.M.; Boden, J.M. Life-stress and Reactivity by Gender in a Longitudinal Birth Cohort at 30 and 35 Years. Soc. Psychiatry Psychiatr. Epidemiol. 2016, 51, 1385–1394. [Google Scholar] [CrossRef] [PubMed]
  27. Holmes, T.H.; Rahe, R.H. The Social Readjustment Rating Scale. J. Psychosom. Res. 1967, 11, 213–218. [Google Scholar] [CrossRef] [PubMed]
  28. Boateng, G.O.; Neilands, T.B.; Frongillo, E.A.; Melgar-Quiñonez, H.R.; Young, S.L. Best Practices for Developing and Validating Scales for Health, Social, and Behavioral Research: A Primer. Front. Public Health 2018, 6, 149. [Google Scholar] [CrossRef] [PubMed]
  29. Theiner, G. A Beginner’s Guide to Group Minds. In New Waves in Philosophy of Mind; Sprevak, M., Kallestrup, J., Eds.; Palgrave Macmillan: London, UK, 2014; pp. 301–322. [Google Scholar] [CrossRef]
  30. Kessler, R.C.; Barker, P.R.; Colpe, L.J.; Epstein, J.F.; Gfroerer, J.C.; Hiripi, E.; Howes, M.J.; Normand, S.L.T.; Manderscheid, R.W.; Walters, E.E.; et al. Screening for Serious Mental Illness in the General Population. Arch. Gen. Psychiatry 2003, 60, 184. [Google Scholar] [CrossRef]
  31. World Health Organisation. The World Health Organisation-Five Well-Being Index (WHO-5). Wellbeing Measures in Primary Health Care/The Depcare Project; WHO Regional Office for Europe: Copenhagen, Denmark, 1998. [Google Scholar]
  32. New Zealand Coronavirus: Cases and Deaths—Worldometer. Available online: https://www.worldometers.info/coronavirus/country/new-zealand/ (accessed on 2 September 2022).
  33. Ministry of Health. HISO 10001:2017 Ethnicity Data Protocols. 2017. Available online: https://www.health.govt.nz/system/files/documents/publications/hiso_10001-2017_ethnicity_data_protocols_may-21.pdf (accessed on 1 October 2020).
  34. Boden, J.M.; Fergusson, D.M.; Horwood, L.J. Associations Between Exposure to Stressful Life Events and Alcohol Use Disorder in a Longitudinal Birth Cohort Studied to Age 30. Drug Alcohol Depend. 2014, 142, 154–160. [Google Scholar] [CrossRef]
  35. Boden, J.M.; Lee, J.O.; Horwood, L.J.; Grest, C.V.; McLeod, G.F.H. Modelling Possible Causality in the Associations Between Unemployment, Cannabis Use, and Alcohol Misuse. Soc. Sci. Med. 2017, 175, 127–134. [Google Scholar] [CrossRef]
  36. Andrews, G.; Slade, T. Interpreting Scores on the Kessler Psychological Distress Scale (K10). Aust. N. Z. J. Public Health 2001, 25, 494–497. [Google Scholar] [CrossRef]
  37. Topp, C.W.; Østergaard, S.D.; Søndergaard, S.; Bech, P. The WHO-5 Well-Being Index: A Systematic Review of the Literature. Psychother. Psychosom. 2015, 84, 167–176. [Google Scholar] [CrossRef]
  38. Zijlmans, E.A.O.; Tijmstra, J.; van der Ark, L.A.; Sijtsma, K. Item-Score Reliability as a Selection Tool in Test Construction. Front. Psychol. 2019, 9, 2298. [Google Scholar] [CrossRef]
  39. New Zealand Health Survey 2018/19. Available online: https://www.health.govt.nz/nz-health-statistics/national-collections-and-surveys/surveys/new-zealand-health-survey/ (accessed on 21 January 2021).
  40. General Social Survey 2018/9: Final Content. Available online: https://www.stats.govt.nz/methods/general-social-survey-2018-final-content (accessed on 21 January 2021).
  41. Bruine de Bruin, W. Age Differences in COVID-19 Risk Perceptions and Mental Health: Evidence from a National U.S. Survey Conducted in March 2020. J. Gerontol. B 2020, 76, e24–e29. [Google Scholar] [CrossRef] [PubMed]
  42. González-Sanguino, C.; Ausín, B.; Castellanos, M.Á.; Saiz, J.; López-Gómez, A.; Ugidos, C.; Muñoz, M. Mental Health Consequences during the Initial Stage of the 2020 Coronavirus Pandemic (COVID-19) in Spain. Brain Behav. Immun. 2020, 87, 172–176. [Google Scholar] [CrossRef] [PubMed]
  43. Petzold, M.B.; Bendau, A.; Plag, J.; Pyrkosch, L.; Mascarell Maricic, L.; Betzler, F.; Rogoll, J.; Große, J.; Ströhle, A. Risk, Resilience, Psychological Distress, and Anxiety at the Beginning of the COVID-19 Pandemic in Germany. Brain Behav. 2020, 10, e01745. [Google Scholar] [CrossRef] [PubMed]
  44. Wang, C.; Pan, R.; Wan, X.; Tan, Y.; Xu, L.; Ho, C.S.; Ho, R.C. Immediate Psychological Responses and Associated Factors during the Initial Stage of the 2019 Coronavirus Disease (COVID-19) Epidemic among the General Population in China. Int. J. Environ. Res. Public Health 2020, 17, 1729. [Google Scholar] [CrossRef]
  45. Tedeschi, R.; Cann, A.; Taku, K.; Senol-Durak, E.; Calhoun, L.G. The Posttraumatic Growth Inventory: A Revision Integrating Existential and Spiritual Change. J. Trauma. Stress 2017, 30, 11–18. [Google Scholar] [CrossRef]
  46. DeVellis, R.F.; Carolyn, T.T. Scale Development: Theory and Applications, 5th ed.; SAGE Publications: Thousand Oaks, CA, USA, 2022. [Google Scholar]
  47. Pierce, M.; McManus, S.; Jessop, C.; John, A.; Hotopf, M.; Ford, T.; Hatch, S.; Wessely, S.; Abel, K.M. Says Who? The Significance of Sampling in Mental Health Surveys during COVID-19. Lancet Psychiatry 2020, 7, 567–568. [Google Scholar] [CrossRef]
  48. World Health Organization. WHO Coronavirus (COVID-19) Dashboard. Available online: https://covid19.who.int/ (accessed on 21 March 2023).
  49. Weathers, F.W.; Litz, B.T.; Keane, T.M.; Palmieri, P.A.; Marx, B.P.; Schnurr, P.P. The PTSD Checklist for DSM-5 (PCL-5)—Standard [Measurement instrument]. The National Center for PTSD. 2013. Available online: https://www.ptsd.va.gov/ (accessed on 2 September 2022).
  50. Tanveer, S.; Schluter, P.J.; Porter, R.J.; Boden, J.M.; Beaglehole, B.; Sulaiman-Hill, R.; Dean, S.; Bell, R.; Al-Hussainni, W.N.; Arshi, M.; et al. Examining the Psychosocial Impacts of the COVID-19 Pandemic: An International Cross-sectional Study Protocol. BMJ Open 2023, 13, e067886. [Google Scholar] [CrossRef]
  51. Sulaiman-Hill, R.C.; Porter, R.; Tanveer, S.; Boden, J.; Beaglehole, B.; Schluter, P.J.; Dean, S.; Bell, C. Psychosocial Impacts on the Christchurch Muslim Community Following the 15 March Terrorist Attacks: A Mixed-Methods Study Protocol. BMJ Open 2021, 11, e055413. [Google Scholar] [CrossRef]
Figure 1. Scatter Plot Showing Correlation between COVID Psychosocial Impacts Scale (CPIS) Composite Scores with Kessler 10 (K10), and World Health Organization Well-Being Index 5 (WHO-5).
Ijerph 20 05990 g001
Table 1. Showing Items, Key Domains, and Subscales of the COVID Psychosocial Impacts Scale (CPIS).
Key DomainsSubscale
Personal ImpactsPersonal stress
1.
Do you have an underlying health condition that could make you vulnerable to COVID-19 (e.g., heart disease, difficulty breathing, weakened immunity or cancer)?
2.
Have you had a COVID-19 test? (Have you ever been suspected of having COVID-19?) *
3.
If Yes, was the result positive? (If yes, have you had a COVID-19 test?) *
4.
Have you felt at risk of being exposed to someone with COVID-19?
Family ImpactsSocial stress
5.
Does any family member have an underlying health condition that could make them vulnerable to COVID-19 (e.g., heart disease, difficulty breathing, weakened immunity, or cancer?)
6.
Do you feel any family member is at risk of being exposed to someone with COVID-19 through their work?
7.
Has any family member had a COVID-19 test? (Has any family member been suspected of having COVID-19?) *
8.
If yes, was the result positive?
9.
Do you have family overseas who you are worried are at risk of getting COVID-19?
10.
Do you have family overseas who you are not able to visit or who cannot visit you?
Living ArrangementSocial stress
11.
How much stress is this living arrangement causing you?
Work and COVID-19Financial stress
12.
Are you considered an essential worker (e.g., in healthcare, law enforcement, emergency services, or provider of essential goods/services)?
13.
Do you have a close friend or family member who is an essential worker?
EducationEducation-related stress
14.
Had to change the mode of study (e.g., online).
15.
Had access to a quiet space to study.
16.
Had access to adequate computing facilities (e.g., personal laptop or computer, internet, etc.).
17.
Are you concerned about its impact on your grades?
18.
Are you concerned about its impact on your future employment?
EmploymentFinancial stress
19.
Had a major change in working hours?
20.
Had to change the place of work to home?
21.
Had to change to a different type of work?
22.
Have you or anyone in your household lost their job?
23.
Is a business you or someone in your household owns or works in under threat of survival?
IncomeFinancial stress
24.
Has your household had a major deterioration in financial circumstances?
25.
Has your household had a major deterioration in your ability to pay your rent or mortgage?
26.
Has your household had a major deterioration in your ability to pay your bills or for food?
27.
Has your household needed to seek help from a food bank or other charitable organisation?
RelationshipsSocial stress
28.
Has it increased difficulty and tension in the family?
29.
Has it brought the family closer together?
30.
Has this decreased your contact with friends (physical or online)?
31.
Has this increased your contact with friends (physical or online)?
Changes to daily routines and behavioursPersonal stress
32.
Has the COVID-19 pandemic led to changes in your daily routine (for example, sleep, exercise, free time, pleasurable activities, or hobbies)?
33.
Has this led to you being less involved in family life?
34.
Has this led to you being more involved in family life?
35.
Has this caused you to delay/avoid seeking health care when you or a family member needed it?
36.
Has this increased your contact with healthcare for you or a family member?
37.
Have there been any other major changes in routine?
Changes to faith-related activitiesFaith-related stress
38.
Has this decreased your involvement with religious activities (in person or online)?
39.
Has this increased your involvement with religious activities (in person or online)?
40.
Has this decreased your connection with religious social gatherings (in person or online)?
41.
Has this increased your connection with religious social gatherings (in person or online)?
Exposure to information about COVID-19Personal stress
42.
How much stress is the news about COVID-19 causing you?
Comparing now with before the COVID-19 pandemicPerception of overall life stress pre/post COVID-19
43.
How would you rate your personal level of stress?
44.
How would you rate the overall stress in your household?
45.
How would you rate your personal psychological wellbeing?
46.
How would you rate the overall psychological wellbeing of your household members?
Silver LiningPositive Impacts
47.
Made me value family time more.
48.
Made me realise what was important in life.
49.
Led to an increased connection to my faith.
50.
Gave me a greater sense of purpose.
* Note: Three items (items 2, 3, and 7) were modified in survey 2 owing to psychometric and pragmatic considerations. The items in survey 2 are shown in brackets.
Table 2. Showing Exploratory Factor Analysis 1 on the Core Subscales of COVID Psychosocial Impacts Scale (CPIS).
SubscaleSurvey 1 (N = 663)Survey 2 (N = 687)
Mean (SD)Factor 1Factor 2Mean (SD)Factor 1Factor 2
Personal stress10.4 (6.9)0.87−0.0813.9 (7.6)0.89−0.07
Social stress12.8 (6.9)0.84−0.0615 (8.5)0.86−0.10
Financial stress5.7 (6.6)0.67−0.024 (4.6)0.68−0.07
Perception of overall life stress pre/post COVID-1913.0 (2.6)0.710.1820 (12.7)0.680.34
Positive impacts10.6 (4.4)0.010.9915 (10.1)0.010.95
1 The extraction method is principal component analysis. Components in bold have an r value above 0.30.
Table 3. Showing Descriptive Statistics on COVID Psychosocial Impacts Scale (CPIS), Kessler 10 (K10), and World Health Organization Well-Being Index 5 (WHO-5).
Survey 1 Survey 2
Score RangeMean (SD)Score Range Mean (SD)
CPIS composite score 15–14751.8 (18.2)11–15256.3 (20.4)
K1010–5018.5 (7.3)10–4316.5 (6.6)
WHO-50–10052.3 (21.3)0–10057.1 (23.6)
CPIS total score including Education-related stress subscale 21–11862.8 (21.7)30–16969.4 (24.4)
K1010–4919.9 (7.2)10–4119.9 (7.6)
WHO-54–8849.6 (20.5)0–10052.7 (22)
CPIS total score including Faith-related stress subscale 27–14863.1 (22.5)19–17261.8 (22.7)
K1010–4519.1 (7)10–3916.7 (6.5)
WHO-54–9249.8 (21.3)8–10055.4 (22.4)
Table 4. Showing Construct Validity of COVID Psychosocial Impacts Scale (CPIS) and CPIS Subscales with Kessler 10 (K10) and World Health Organization Well-Being Index 5 (WHO-5) 1.
Personal StressSocial StressFinancial StressPerception of Overall Life Stress Pre/Post COVID-19Positive ImpactsCPIS Composite ScoreK10WHO-5
Personal stress 10.75 **0.47 **0.46 **−0.13 **0.87 **0.55 **−0.47 **
Social stress0.67 **10.40 **0.43 **−0.14 **0.86 **0.51 **−0.42 **
Financial stress0.50 **0.38 **10.33 **−0.040.69 **0.29 **−0.27 **
Perception of overall life stress pre/post COVID-190.46 **0.49 **0.28 **10.070.61 **0.50 **−0.51 **
Positive impacts−0.03−0.030.010.0810.08 *−0.11 **0.02
CPIS composite score0.84 **0.82 **0.72 **0.61 **0.22 **10.56 **−0.50 **
K100.54 **0.50 **0.30 **0.54 **0.030.57 **1−0.75 **
WHO-5−0.42 **−0.38 **−0.23 **−0.52 **−0.14 **−0.48 **−0.71 **1
1 Data from survey 1 (N = 663) is shown in blue and data from survey 2 (N = 687) is in grey. ** Correlation is significant at the 0.01 level (2-tailed). * Correlation is significant at the 0.05 level (2-tailed).
Table 5. Showing Descriptive Statistics on COVID Psychosocial Impacts Scale (CPIS), CPIS Core Subscales, Kessler 10 (K10), and World Health Organization Well-Being Index 5 (WHO-5) on Subsample (n = 271).
Survey 1
Mean (SD)
Survey 2
Mean (SD)
Mean Difference
[95% CI]
Personal stress 10.1 (5.9)15.2 (7.4)5.2 [4.4, 5.9]
Social stress10.7 (6)16.3 (8.6)5.6 [4.7, 6.5]
Financial stress4.9 (5.9)4 (5.4)−0.9 [−1.7, −0.1]
Perception of overall life stress pre/post COVID-1912.9 (2.5)12.9 (2.9)0 [−0.4, 0.4]
Positive impacts11 (4.1)9.9 (3.6)−1.1 [−1.6, −0.5]
CPIS composite score49.6 (15.9)58.3 (19.5)8.8 [6.7, 10.8]
K1016.1 (26.3)17.8 (7.1)1.7 [−1.4, 4.8]
WHO-553 (22.1)54 (23)1 [−1.3, 3.3]
Disclaimer/Publisher’s Note: The statements, opinions and data contained in all publications are solely those of the individual author(s) and contributor(s) and not of MDPI and/or the editor(s). MDPI and/or the editor(s) disclaim responsibility for any injury to people or property resulting from any ideas, methods, instructions or products referred to in the content.

