
Characterization of Arsenic and Atrazine Contaminations in Drinking Water in Iowa: A Public Health Concern
 , , ,
, , ,  ,
,
Abstract
:1. Introduction
2. Materials and Methods
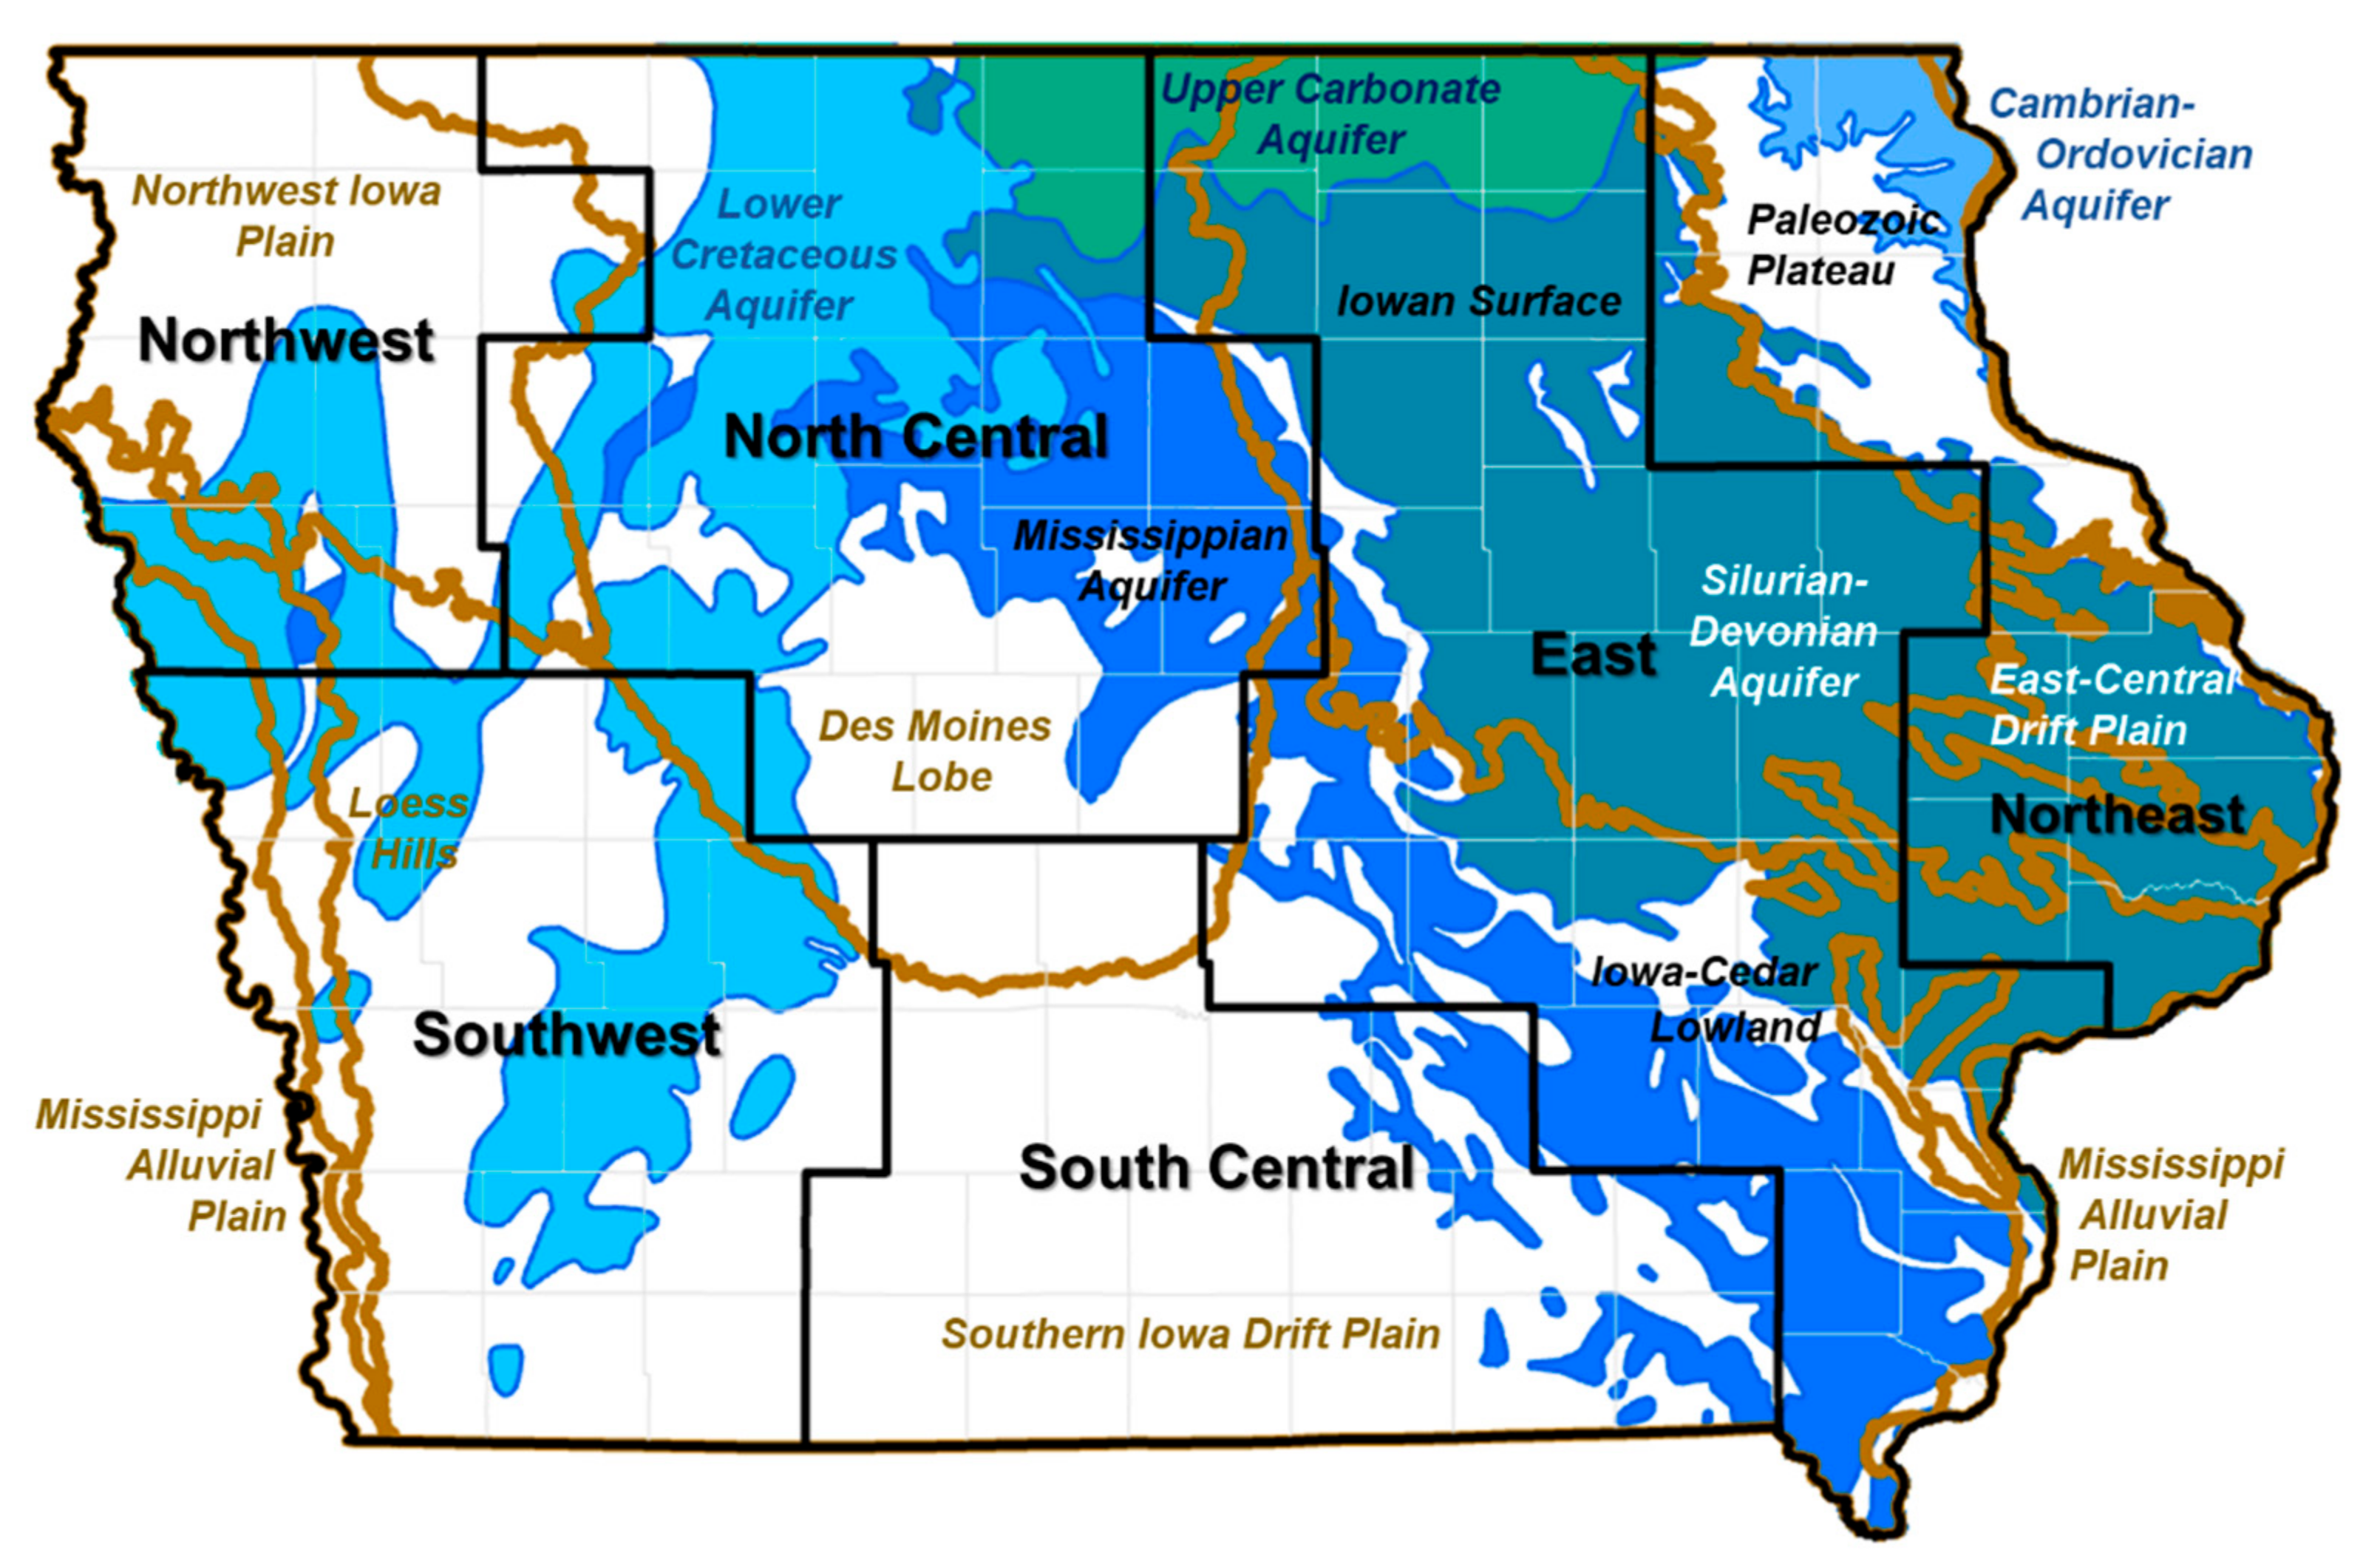
2.1. Study Area
2.2. Data Sources
2.3. Water Data Statistical Analysis
2.4. Geographic Mapping
3. Results
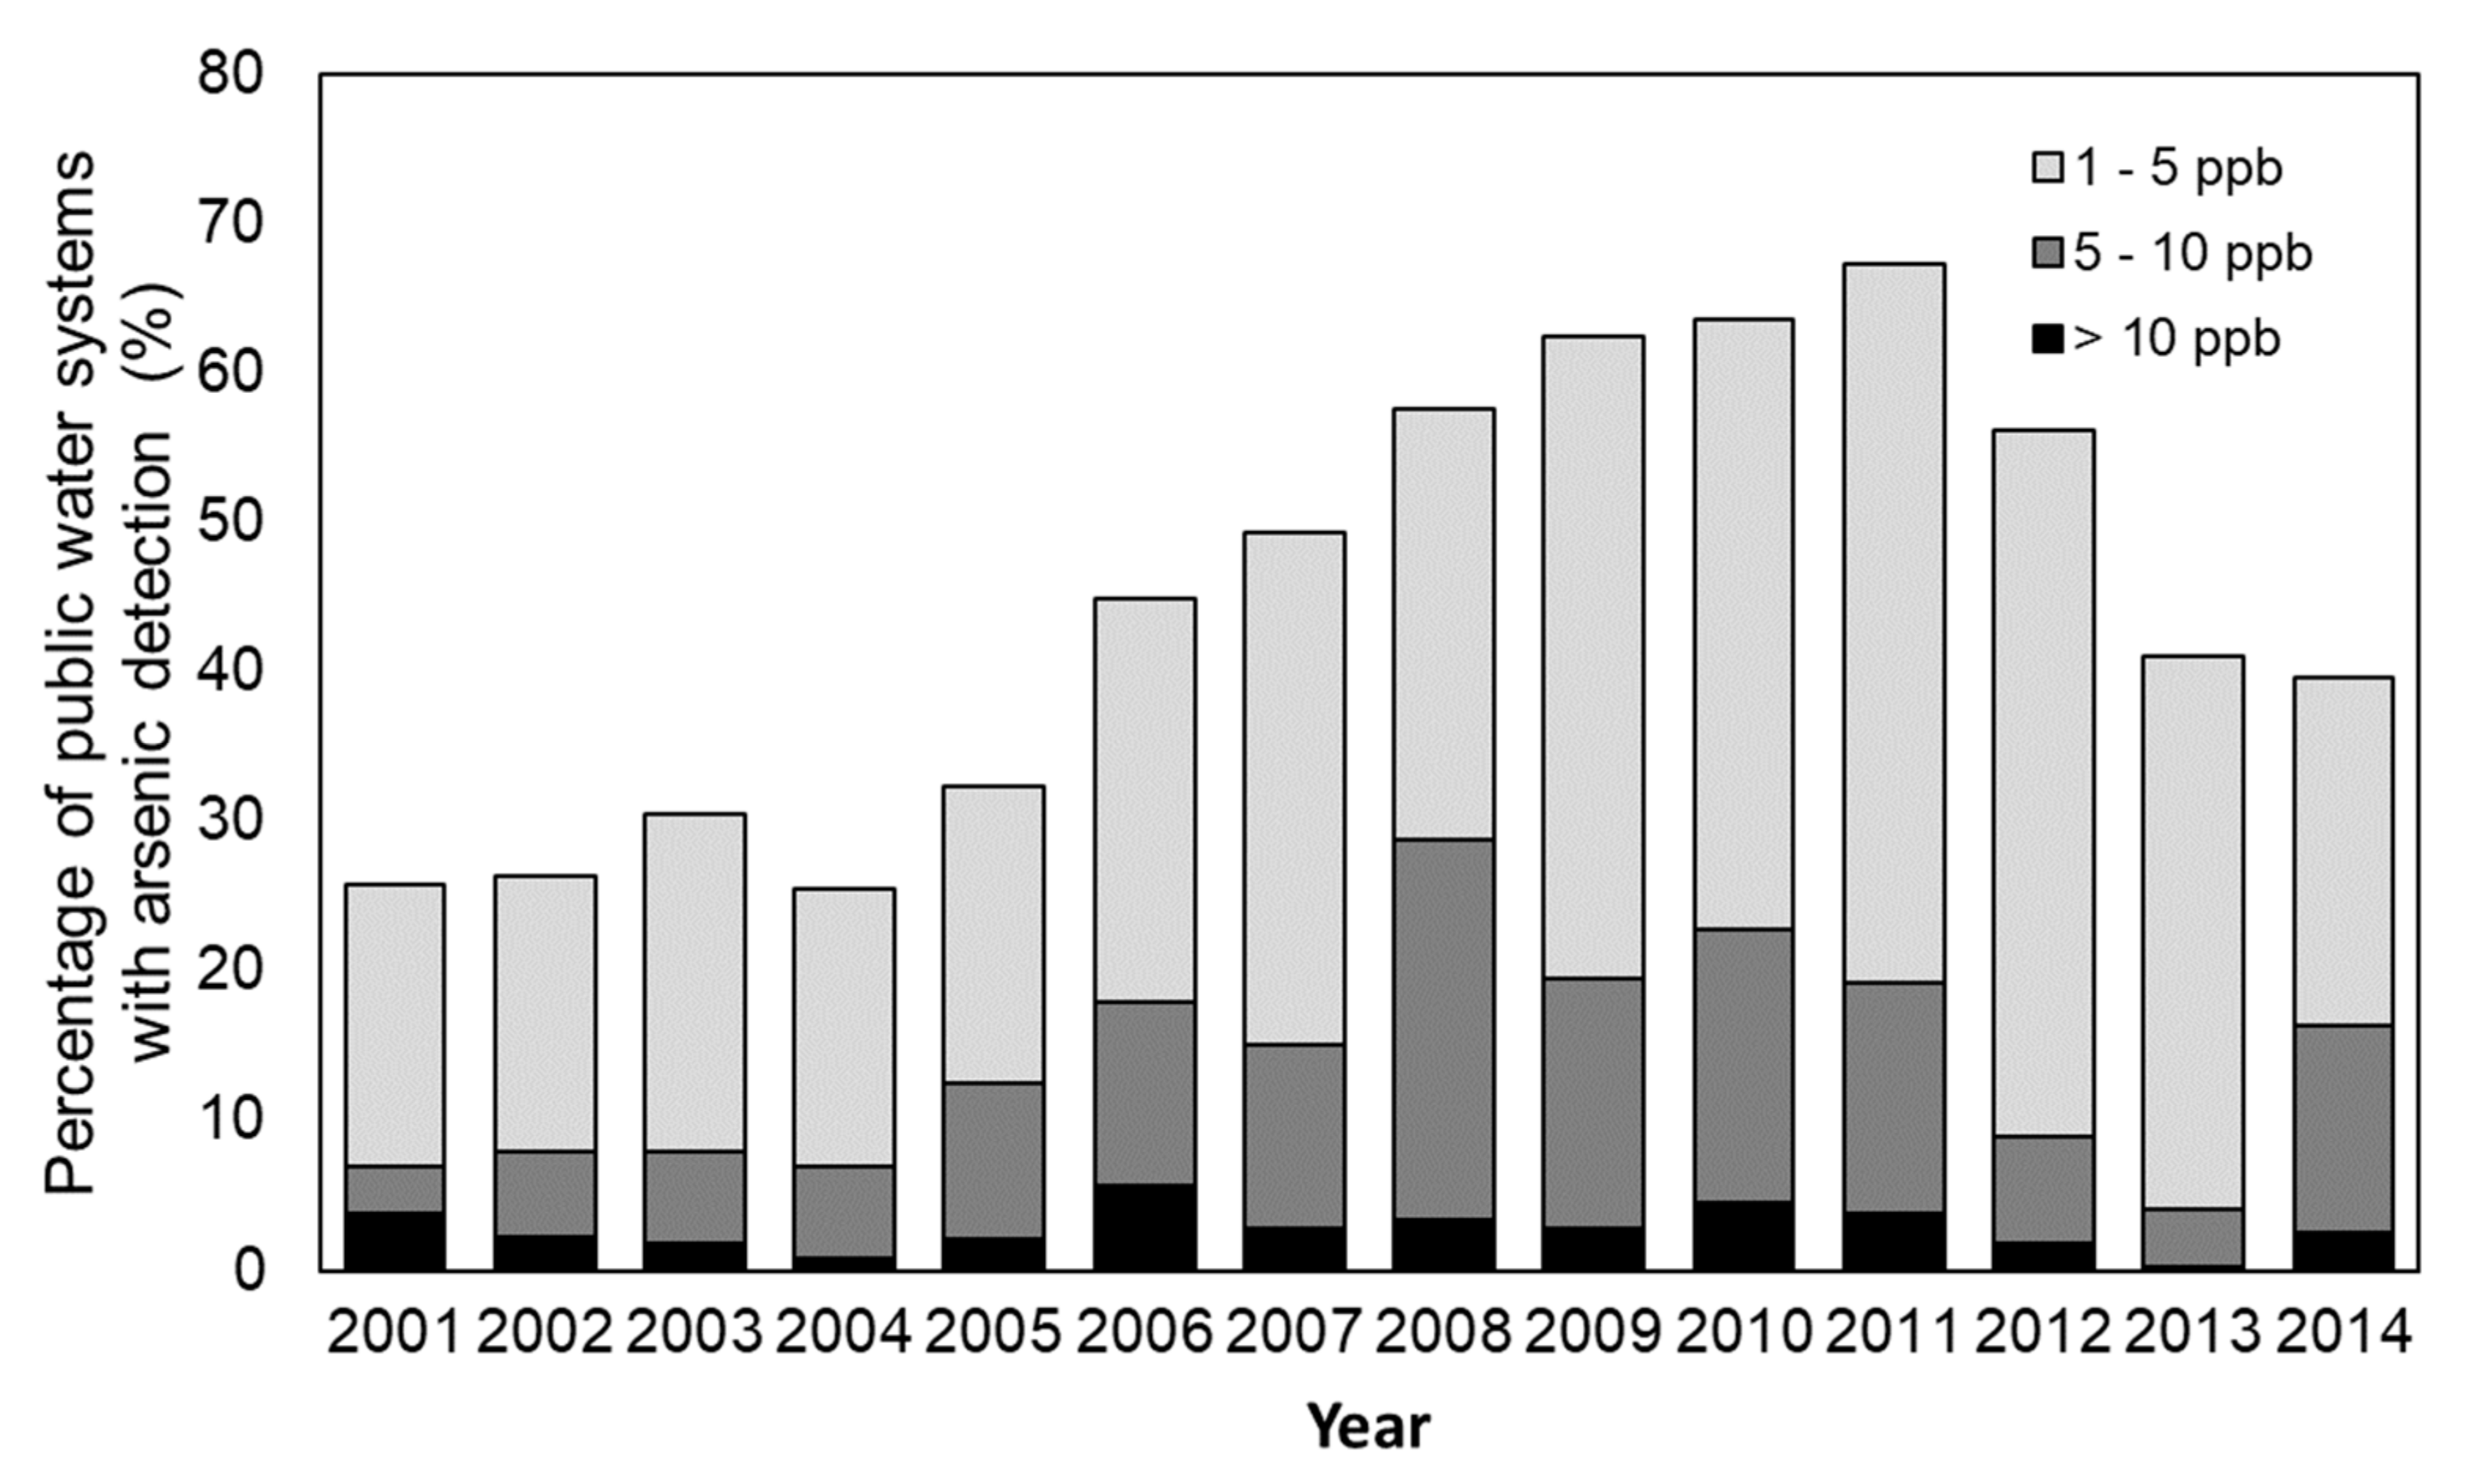
3.1. Occurrence of Arsenic in Public Water Systems
3.2. Occurrence of Arsenic in Public Wells
3.3. Occurrence of Arsenic in Private Wells
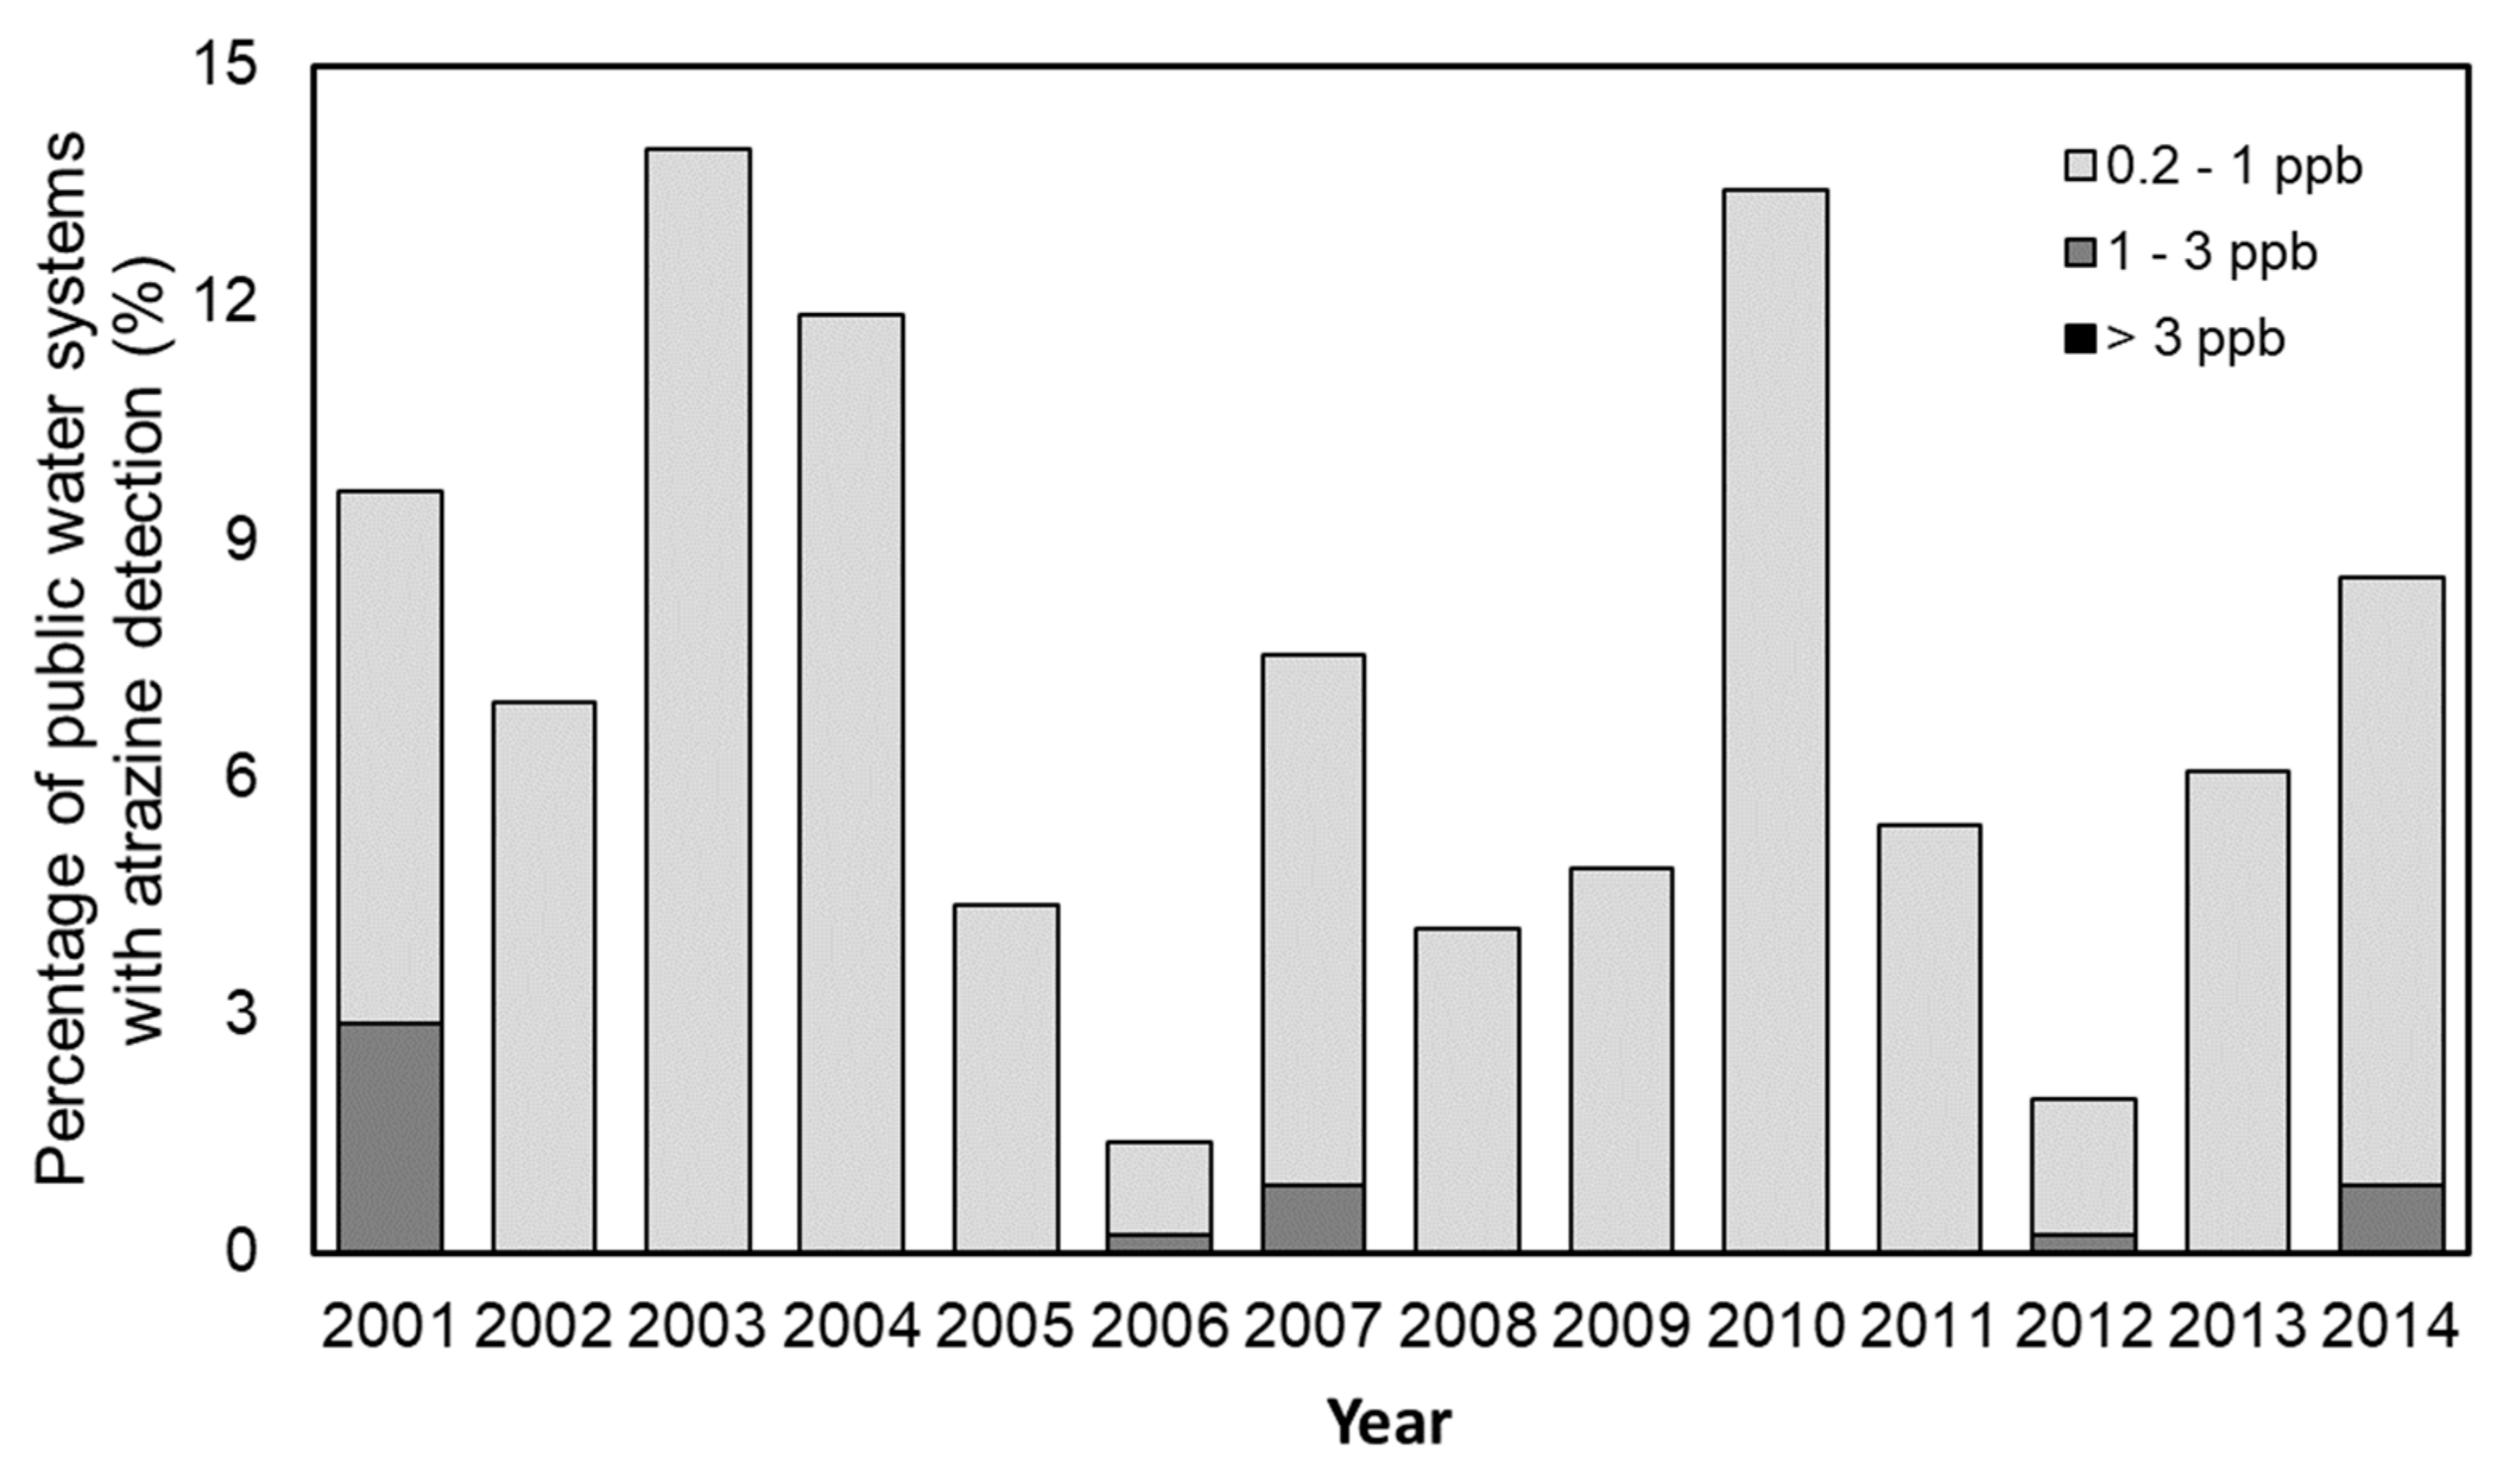
3.4. Occurrence of Atrazine in Public Water System
3.5. Occurrence of Atrazine and its Degradates in Public Wells
3.6. Occurrence of Atrazine and its Degradates in Private Wells
3.7. Occurrence of Atrazine in Surface Water
4. Discussion
5. Conclusions
Author Contributions
Funding
Institutional Review Board Statement
Informed Consent Statement
Data Availability Statement
Acknowledgments
Conflicts of Interest
References
- Akhtar, N.; Syakir Ishak, M.I.; Bhawani, S.A.; Umar, K. Various natural and anthropogenic factors responsible for water quality degradation: A review. Water 2021, 13, 2660. [Google Scholar] [CrossRef]
- Burkholder, J.; Libra, B.; Weyer, P.; Heathcote, S.; Kolpin, D.; Thorne, P.S.; Wichman, M. Impacts of waste from concentrated animal feeding operations on water quality. Environ. Health Perspect. 2007, 115, 308–312. [Google Scholar] [CrossRef] [PubMed] [Green Version]
- ATSDR. ATSDR 2022 Substance Priority List. 2022. Available online: http://www.atsdr.cdc.gov/SPL/index.html (accessed on 7 March 2023).
- Michael, H.A. Geochemistry. An arsenic forecast for China. Science 2013, 341, 852–853. [Google Scholar] [CrossRef] [PubMed]
- Bowell, R.J.; Alpers, C.N.; Jamieson, H.E.; Nordstrom, D.K.; Majzlan, J. The environmental geochemistry of arsenic—An overview. Rev. Mineral. Geochem. 2014, 79, 1–16. [Google Scholar] [CrossRef]
- Erickson, M.L.; Barnes, R.J. Glacial sediment causing regional-scale elevated arsenic in drinking water. Groundwater 2005, 43, 796–805. [Google Scholar] [CrossRef]
- Rowden, R. The Lowa State-Wide Trace Element Soil Sampling Project: Design And Implementation; Iowa Department of Natural Resources: Iowa City, IA, USA, 2010. [Google Scholar]
- Eick, S.M.; Ferreccio, C.; Acevedo, J.; Castriota, F.; Cordero, J.F.; Roh, T.; Smith, A.H.; Smith, M.T.; Steinmaus, C. Socioeconomic status and the association between arsenic exposure and type 2 diabetes. Environ. Res. 2019, 172, 578–585. [Google Scholar] [CrossRef]
- Roh, T.; Steinmaus, C.; Marshall, G.; Ferreccio, C.; Liaw, J.; Smith, A.H. Age at exposure to arsenic in water and mortality 30–40 years after exposure cessation. Am. J. Epidemiol. 2018, 187, 2297–2305. [Google Scholar] [CrossRef] [Green Version]
- Karagas, M.R.; Gossai, A.; Pierce, B.; Ahsan, H. Drinking water arsenic contamination, skin lesions, and malignancies: A systematic review of the global evidence. Curr. Environ. Health Rep. 2015, 2, 52–68. [Google Scholar] [CrossRef]
- Sharma, A.; Kumar, S. Arsenic exposure with reference to neurological impairment: An overview. Rev. Environ. Health 2019, 34, 403–414. [Google Scholar] [CrossRef]
- Almberg, K.S.; Turyk, M.E.; Jones, R.M.; Rankin, K.; Freels, S.; Graber, J.M.; Stayner, L.T. Arsenic in drinking water and adverse birth outcomes in Ohio. Environ. Res. 2017, 157, 52–59. [Google Scholar] [CrossRef]
- Richter, F.; Kloster, S.; Wodschow, K.; Hansen, B.; Schullehner, J.; Kristiansen, S.M.; Petersen, M.M.; Strandberg-Larsen, K.; Ersbøll, A.K. Maternal exposure to arsenic in drinking water and risk of congenital heart disease in the offspring. Environ. Int. 2022, 160, 107051. [Google Scholar] [CrossRef]
- Howe, C.G.; Farzan, S.F.; Garcia, E.; Jursa, T.; Iyer, R.; Berhane, K.; Chavez, T.A.; Hodes, T.L.; Grubbs, B.H.; Funk, W.E. Arsenic and birth outcomes in a predominately lower income Hispanic pregnancy cohort in Los Angeles. Environ. Res. 2020, 184, 109294. [Google Scholar] [CrossRef]
- Tchounwou, P.B.; Yedjou, C.G.; Udensi, U.K.; Pacurari, M.; Stevens, J.J.; Patlolla, A.K.; Noubissi, F.; Kumar, S. State of the science review of the health effects of inorganic arsenic: Perspectives for future research. Environ. Toxicol. 2019, 34, 188–202. [Google Scholar] [CrossRef]
- Zhou, Q.; Xi, S. A review on arsenic carcinogenesis: Epidemiology, metabolism, genotoxicity and epigenetic changes. Regul. Toxicol. Pharmacol. 2018, 99, 78–88. [Google Scholar] [CrossRef]
- CHEEC. Iowa Statewide Rural Well Water Survey Phase 2 (SWRL2)—Results and Analysis; Center for Health Effects of Environmental Contamination: Iowa City, IA, USA, 2009. [Google Scholar]
- Williams, M.M.; Boydston, R.A.; Peachey, R.E.; Robinson, D. Performance consistency of reduced atrazine use in sweet corn. Field Crop. Res. 2011, 121, 96–104. [Google Scholar] [CrossRef]
- EC. Commission Decision of 10 March 2004 concerning the non-inclusion of atrazine in Annex I to Council Directive 91/414/EEC and the withdrawal of authorisations for plant protection products containing this active substance (2004/248/EC). Off. J. Eur. Union 2004, L78, 53–55. [Google Scholar]
- USGS. Pesticide Use Maps - Atrazine. US Geological Survey: Reston, VA, USA. 2021. Available online: https://water.usgs.gov/nawqa/pnsp/usage/maps/show_map.php?year=2019&map=ATRAZINE&hilo=L (accessed on 7 March 2023).
- Kalkhoff, S.J.; Barnes, K.K.; Becher, K.; Savoca, M.E.; Schnoebelen, D.J.; Sadorf, E.M.; Porter, S.D.; Sullivan, D.J. Water Quality in the Eastern Iowa Basins, Iowa and Minnesota, 1996–98. Circular 1210; U.S. Geological Survey: Reston, VA, USA, 2000. [Google Scholar]
- EPA. National Primary Drinking Water Regulation Table. 2009. Available online: https://www.epa.gov/ground-water-and-drinking-water/national-primary-drinking-water-regulation-table (accessed on 7 March 2023).
- Krutz, L.J.; Shaner, D.L.; Zablotowicz, R.M. Enhanced Degradation and Soil Depth Effects on the Fate of Atrazine and Major Metabolites in Colorado and Mississippi Soils. J. Environ. Qual. 2010, 39, 1369–1377. [Google Scholar] [CrossRef]
- Stradtman, S.C.; Freeman, J.L. Mechanisms of neurotoxicity associated with exposure to the herbicide atrazine. Toxics 2021, 9, 207. [Google Scholar] [CrossRef]
- Galbiati, V.; Buoso, E.; d’Emmanuele di Villa Bianca, R.; Paola, R.D.; Morroni, F.; Nocentini, G.; Racchi, M.; Viviani, B.; Corsini, E. Immune and nervous systems interaction in endocrine disruptors toxicity: The case of atrazine. Front. Toxicol. 2021, 3, 649024. [Google Scholar] [CrossRef]
- New-Aaron, M.; Naveed, Z.; Rogan, E.G. Estrogen disrupting pesticides in Nebraska groundwater: Trends between pesticide-contaminated water and estrogen-related cancers in an ecological observational study. Water 2021, 13, 790. [Google Scholar] [CrossRef]
- Burns, C.J.; Juberg, D.R. Cancer and occupational exposure to pesticides: An umbrella review. Int. Arch. Occup. Environ. Health 2021, 94, 945–957. [Google Scholar] [CrossRef] [PubMed]
- Rinsky, J.L.; Hopenhayn, C.; Golla, V.; Browning, S.; Bush, H.M. Atrazine Exposure in Public Drinking Water and Preterm Birth. Public Health Rep. 2012, 127, 72–80. [Google Scholar] [CrossRef] [PubMed] [Green Version]
- Stayner, L.T.; Almberg, K.; Jones, R.; Graber, J.; Pedersen, M.; Turyk, M. Atrazine and nitrate in drinking water and the risk of preterm delivery and low birth weight in four Midwestern states. Environ. Res. 2017, 152, 294–303. [Google Scholar] [CrossRef] [PubMed]
- Schjenken, J.E.; Green, E.S.; Overduin, T.S.; Mah, C.Y.; Russell, D.L.; Robertson, S.A. Endocrine disruptor compounds—A cause of impaired immune tolerance driving inflammatory disorders of pregnancy? Front. Endocrinol. 2021, 12, 607539. [Google Scholar] [CrossRef]
- Möller, T.; Sylvester, P.; Shepard, D.; Morassi, E. Arsenic in groundwater in New England—Point-of-entry and point-of-use treatment of private wells. Desalination 2009, 243, 293–304. [Google Scholar] [CrossRef]
- Woolf, A.D.; Stierman, B.D.; Barnett, E.D.; Byron, L.G. Drinking Water From Private Wells and Risks to Children. Pediatrics 2023, 151, e2022060645. [Google Scholar] [CrossRef]
- Fisher, A.T.; López-Carrillo, L.; Gamboa-Loira, B.; Cebrián, M.E. Standards for arsenic in drinking water: Implications for policy in Mexico. J. Public Health Policy 2017, 38, 395–406. [Google Scholar] [CrossRef] [Green Version]
- Sandhi, A.; Yu, C.; Rahman, M.M.; Amin, M.N. Arsenic in the water and agricultural crop production system: Bangladesh perspectives. Environ. Sci. Pollut. Res. 2022, 29, 51354–51366. [Google Scholar] [CrossRef]
- Health Canada. Guidelines for Canadian Drinking Water Quality - Summary Tables. 2022. Available online: https://www.canada.ca/en/health-canada/services/environmental-workplace-health/reports-publications/water-quality/guidelines-canadian-drinking-water-quality-summary-table.html (accessed on 7 March 2023).
- Chandra, P.N.; Usha, K. Removal of atrazine herbicide from water by polyelectrolyte multilayer membranes. Mater. Today Proc. 2021, 41, 622–627. [Google Scholar] [CrossRef]
- Hallberg, G.R.; Kross, B.; Libra, R.D.; Burmeister, L.; Weih, L.; Lynch, C.; Bruner, D. The Lowa State-Wide Rural Well-Water Survey Design Report: A Systematic Sample Of Domestic Drinking Water Quality; Iowa Department of Natural Resources: Iowa City, IA, USA, 1990. [Google Scholar]
- Littin, G.R. Quality of Ground Water Used for Selected Municipal Water Supplies in Iowa, 1997–2002 Water Years. Open-File Report 2004–1048; U.S. Geological Survey: Reston, VA, USA, 2004. [Google Scholar]
- Schaap, B.D.; Linhart, S.M. Quality of Ground Water Used for Selected Municipal Water Supplies in Iowa, 1982-96 water years. Open-File Report 98-3; U.S. Geological Survey: Iowa City, IA, USA, 1998. [Google Scholar]
- USGS. Water Quality Data for the Nation. National Water Information System. 2016. Available online: https://waterdata.usgs.gov/ia/nwis/nwis (accessed on 7 March 2023).
- Demirel, T.; Özmen, F.K.; Yavuz, Y.; Koparal, A.S. The effect of electrocoagulation (EC) on total arsenic, arsenite (As3+) and arsenate (As5+) species removal from model groundwater investigating toxicity and sludge characteristic. Appl. Water Sci. 2022, 12, 138. [Google Scholar] [CrossRef]
- IAC. Chapter 41 Water Supplies (§ 41.3). Iowa Administrative Code 2011, Code 567 Environmental Protection. Available online: https://www.legis.iowa.gov/docs/ACO/chapter/567.41.pdf (accessed on 7 March 2023).
- Baker, N.T.; Stone, W.W. Estimated Annual Agricultural Pesticide Use for Counties of the Conterminous United States, 2008-12; US Geological Survey: Reston, VA, USA, 2015; ISSN 2327-638X. [Google Scholar]
- Stone, W.W. Estimated Annual Agricultural Pesticide Use for Counties of the Conterminous United States, 1992--2009; US Geological Survey: Reston, VA, USA, 2013; ISSN 2327-638X. [Google Scholar]
- USDA. 2011 Iowa Agricultural Statistics. In National Agricultural Statistics Service; US Department of Agriculture: Des Moines, IA, USA, 2011. Available online: https://www.nass.usda.gov/Statistics_by_State/Iowa/Publications/Annual_Statistical_Bulletin/2011_Iowa_Annual_Bulletin.pdf (accessed on 7 March 2023).
- Littell, R.C.; Henry, P.R.; Ammerman, C.B. Statistical analysis of repeated measures data using SAS procedures. J. Anim. Sci. 1998, 76, 1216–1231. [Google Scholar] [CrossRef] [Green Version]
- Tooze, J.A.; Grunwald, G.K.; Jones, R.H. Analysis of repeated measures data with clumping at zero. Stat. Methods Med. Res. 2002, 11, 341–355. [Google Scholar] [CrossRef]
- Hamlett, A.; Ryan, L.; Serrano-Trespalacios, P.; Wolfinger, R. Mixed models for assessing correlation in the presence of replication. J. Air Waste Manag. 2003, 53, 442–450. [Google Scholar] [CrossRef]
- Roy, A. Estimating correlation coefficient between two variables with repeated observations using mixed effects model. Biom. J. 2006, 48, 286–301. [Google Scholar] [CrossRef]
- Bachetti, R.A.; Urseler, N.; Morgante, V.; Damilano, G.; Porporatto, C.; Agostini, E.; Morgante, C. Monitoring of atrazine pollution and its spatial-seasonal variation on surface water sources of an agricultural river basin. Bull. Environ. Contam. Toxicol. 2021, 106, 929–935. [Google Scholar] [CrossRef]
- Devlin, D.L.; Regehr, D.L.; Barnes, P.L. Managing to Minimize Atrazine Runoff; Kansas State University Agricultural Experiment Station and Cooperative: Manhattan, NY, USA, 2000. [Google Scholar]
- Erickson, M.L.; Elliott, S.M.; Christenson, C.; Krall, A.L. Predicting geogenic arsenic in drinking water wells in glacial aquifers, north-central USA: Accounting for depth-dependent features. Water Resour. Res. 2018, 54, 10172–110187. [Google Scholar] [CrossRef] [Green Version]
- CFR. Definitions (§141.2). Code of Federal Regulations 2016, Title 40: Protection of Environment. Available online: https://www.ecfr.gov/current/title-40/chapter-I/subchapter-D/part-141 (accessed on 7 March 2023).
- Tyner, W.E. The US ethanol and biofuels boom: Its origins, current status, and future prospects. BioScience 2008, 58, 646–653. [Google Scholar] [CrossRef]
- EWG. Glyphosate. Available online: https://www.ewg.org/tapwater/contaminant.php?contamcode=2034 (accessed on 7 March 2023).
- Sakulthaew, C.; Watcharenwong, A.; Chokejaroenrat, C.; Rittirat, A. Leonardite-derived biochar suitability for effective sorption of herbicides. Water Air Soil Pollut. 2021, 232, 1–17. [Google Scholar] [CrossRef]
- Rattray, D.; Standley, J.; Silburn, D.; Freebairn, D.; Spann, K. Atrazine degradation and transport in runoff on a Black Vertosol. Soil Res. 2007, 45, 598–606. [Google Scholar] [CrossRef]
- Barbash, J.; Resek, E. Pesticides in Ground Water—Distribution, Trends, and Governing Factors; Ann Arbor Press: Chelsea, MA, USA, 1996; pp. 418–419. [Google Scholar]
- Kolpin, D.W.; Sneck-Fahrer, D.; Hallberg, G.R.; Libra, R.D. Temporal trends of selected agricultural chemicals in Iowa’s groundwater, 1982–1995: Are things getting better? J. Environ. Qual. 1997, 26, 1007–1017. [Google Scholar] [CrossRef]
- Libra, R.D.; Hallberg, G.R.; Hoyer, B.E. Impacts of agricultural chemicals on ground water quality in Iowa. In Ground Water Quality and Agricultural Practices; CRC Press: Chelsea, MA, USA, 2020; pp. 185–215. [Google Scholar]
- Waller, R.M. Ground Water and the Rural Homeowner; US Department of the Interior. US Geological Survey: Denver, CO, USA, 1994. [Google Scholar]
- Jasechko, S.; Birks, S.J.; Gleeson, T.; Wada, Y.; Fawcett, P.J.; Sharp, Z.D.; McDonnell, J.J.; Welker, J.M. The pronounced seasonality of global groundwater recharge. Water Resour. Res. 2014, 50, 8845–8867. [Google Scholar] [CrossRef] [Green Version]
- Goolsby, D.A.; Pereira, W.E. Pesticides in the Mississippi river. In U.S. GEOLOGICAL SURVEY CIRCULAR; 1133; USGS: Reston, VA, USA, 1996; pp. 87–102. [Google Scholar]
- Pereira, W.E.; Moody, J.A.; Hostettler, F.D.; Rostad, C.E.; Leiker, T.J. Concentrations and mass transport of pesticides and organic contaminants in the Mississippi River and some of its tributaries, 1987–89 and 1991–92. US Geol. Surv. Open-File Rep. 1995, 94, 169. [Google Scholar]
- Moody, J.A. Chemical Data for Water Samples Collected during Four Upriver Cruises on the Mississippi River between New Orleans, Louisiana, and Minneapolis, Minnesota, May 1990-April 1992; US Geological Survey: Denver, CO, USA, 1995; p. 94. [Google Scholar]
- Bussan, D.D.; Ochs, C.A.; Jackson, C.R.; Anumol, T.; Snyder, S.A.; Cizdziel, J.V. Concentrations of select dissolved trace elements and anthropogenic organic compounds in the Mississippi River and major tributaries during the summer of 2012 and 2013. Environ. Monit. Assess. 2017, 189, 1–18. [Google Scholar] [CrossRef] [PubMed]
- Schilling, K.E.; Streeter, M.T.; Seeman, A.; Jones, C.S.; Wolter, C.F. Total phosphorus export from Iowa agricultural watersheds: Quantifying the scope and scale of a regional condition. J. Hydrol. 2020, 581, 124397. [Google Scholar] [CrossRef]
- Lowa Department of Natural Resources. Iowa Geology; Iowa Department of Natural Resources: Iowa City, IA, USA, 1999; Available online: https://iro.uiowa.edu/esploro/outputs/journalIssue/Iowa-Geology-1999/9984110008702771 (accessed on 7 March 2023).
- Chang, J.; Fang, W.; Chen, L.; Zhang, P.; Zhang, G.; Zhang, H.; Liang, J.; Wang, Q.; Ma, W. Toxicological effects, environmental behaviors and remediation technologies of herbicide atrazine in soil and sediment: A comprehensive review. Chemosphere 2022, 307, 136006. [Google Scholar] [CrossRef]
- Liu, C.; Akbariyeh, S.; Bartelt-Hunt, S.; Li, Y. Impacts of Future Climate Variability on Atrazine Accumulation and Transport in Corn Production Areas in the Midwestern United States. Environ. Sci. Technol. 2022, 56, 7873–7882. [Google Scholar] [CrossRef]
- Scribner, E.A.; Thurman, E.; Goolsby, D.A.; Meyer, M.T.; Battaglin, W.A.; Kolpin, D.W. Summary of Significant Results from Studies of Triazine Herbicides and Their Degradation Products in Surface Water, Ground Water, and Precipitation in the Midwestern United States during the 1990s; Technical Report; U.S. Geological Survey: Denver, CO, USA, 2005. [Google Scholar]
- Moody, J.A.; Goolsby, D.A. Spatial variability of triazine herbicides in the lower Mississippi River. Environ. Sci. Technol. 1993, 27, 2120–2126. [Google Scholar] [CrossRef]
- Panshin, S.Y.; Carter, D.S.; Bayless, E.R. Analysis of atrazine and four degradation products in the pore water of the vadose zone, central Indiana. Environ. Sci. Technol. 2000, 34, 2131–2137. [Google Scholar] [CrossRef]
- Liu, J.; Zhou, J.H.; Guo, Q.N.; Ma, L.Y.; Yang, H. Physiochemical assessment of environmental behaviors of herbicide atrazine in soils associated with its degradation and bioavailability to weeds. Chemosphere 2021, 262, 127830. [Google Scholar] [CrossRef]
- Steinheimer, T.R.; Scoggin, K.D. Fate and movement of atrazine, cyanazine, metolachlor and selected degradation products in water resources of the deep Loess Hills of southwestern Iowa, USA. J. Environ. Monit. 2001, 3, 126–132. [Google Scholar] [CrossRef]
- Adams, C.D.; Thurman, E. Formation and transport of deethylatrazine in the soil and vadose zone. J. Environ. Qual. 1991, 20, 540–547. [Google Scholar] [CrossRef]
- Wang, Z.; Ouyang, W.; Tysklind, M.; Lin, C.; Wang, B. Seasonal variations in atrazine degradation in a typical semienclosed bay of the northwest Pacific ocean. Environ. Pollut. 2021, 283, 117072. [Google Scholar] [CrossRef]
- Arar, M.; Bakkour, R.; Elsner, M.; Bernstein, A. Microbial hydrolysis of atrazine in contaminated groundwater. Chemosphere 2023, 322, 138226. [Google Scholar] [CrossRef]
- World Health Organization. Atrazine and its Metabolites in Drinking-Water: Background Document for Development of WHO Guidelines for Drinking-Water Quality; World Health Organization: Geneva, Switzerland, 2011. [Google Scholar]
- Reddy, R.R.; Rodriguez, G.D.; Webster, T.M.; Abedin, M.J.; Karim, M.R.; Raskin, L.; Hayes, K.F. Evaluation of arsenic field test kits for drinking water: Recommendations for improvement and implications for arsenic affected regions such as Bangladesh. Water Res. 2020, 170, 115325. [Google Scholar] [CrossRef]
- Bullen, J.C.; Dworsky, L.N.; Eikelboom, M.; Carriere, M.; Alvarez, A.; Salaün, P. Low-cost electrochemical detection of arsenic in the groundwater of Guanajuato state, central Mexico using an open-source potentiostat. PLoS ONE 2022, 17, e0262124. [Google Scholar] [CrossRef]
- Zheng, Y. Lessons learned from arsenic mitigation among private well households. Curr. Environ. Health Rep. 2017, 4, 373–382. [Google Scholar] [CrossRef]
- Yevenes, M.A.; Pereira, H.; Bermudez, R. Citizen Science as a Co-Creative Measure to Water Quality: Chemical Data and Local Participation in a Rural Territory. Front. Environ. Sci. 2022, 10, 1054. [Google Scholar] [CrossRef]
- Jakositz, S.; Pillsbury, L.; Greenwood, S.; Fahnestock, M.; McGreavy, B.; Bryce, J.; Mo, W. Protection through participation: Crowdsourced tap water quality monitoring for enhanced public health. Water Res. 2020, 169, 115209. [Google Scholar] [CrossRef]
- Deguine, J.-P.; Aubertot, J.-N.; Flor, R.J.; Lescourret, F.; Wyckhuys, K.A.; Ratnadass, A. Integrated pest management: Good intentions, hard realities. A review. Agron. Sustain. Dev. 2021, 41, 38. [Google Scholar] [CrossRef]
- Gu, Q.; Hu, H.; Ma, L.; Sheng, L.; Yang, S.; Zhang, X.; Zhang, M.; Zheng, K.; Chen, L. Characterizing the spatial variations of the relationship between land use and surface water quality using self-organizing map approach. Ecol. Indic. 2019, 102, 633–643. [Google Scholar] [CrossRef]
- Prokopy, L.S.; Floress, K.; Arbuckle, J.G.; Church, S.P.; Eanes, F.R.; Gao, Y.; Gramig, B.M.; Ranjan, P.; Singh, A.S. Adoption of agricultural conservation practices in the United States: Evidence from 35 years of quantitative literature. J. Soil Water Conserv. 2019, 74, 520–534. [Google Scholar] [CrossRef] [Green Version]
- Ernazarovich, M.I.; Ernazarovna, M.D.; Kuvatovich, A.M.; Zhakhbarovich, A.A.; Nigmadjanovna, K.S.; Musaev, S.M. Analysis Of Improved Methods For Determining Last Generations Of Pesticides In Water Water. J. Posit. Sch. Psychol. 2022, 6, 2926–2933. [Google Scholar]
- Dilpazeer, F.; Munir, M.; Baloch, M.Y.J.; Shafiq, I.; Iqbal, J.; Saeed, M.; Abbas, M.M.; Shafique, S.; Aziz, K.H.H.; Mustafa, A. A Comprehensive Review of the Latest Advancements in Controlling Arsenic Contaminants in Groundwater. Water 2023, 15, 478. [Google Scholar] [CrossRef]


| Categories | Site No. | Samples No. | <1 ppb No. (%) | 1–10 ppb No. (%) | >10 ppb No. (%) | Maximum (ppb) | |
|---|---|---|---|---|---|---|---|
| Region | E | 286 | 1002 | 783 (78.1) | 155 (15.5) | 64 (6.4) | 73.0 |
| NC * | 167 | 797 | 321 (40.3) | 415 (52.3) | 61 (7.7) | 66.0 | |
| NE | 172 | 496 | 388 (78.2) | 103 (20.8) | 5 (1.0) | 14.0 | |
| NW | 59 | 161 | 121 (75.2) | 37 (23.0) | 3 (1.9) | 47.0 | |
| SC | 46 | 159 | 107 (67.3) | 51 (32.1) | 1 (0.6) | 12.4 | |
| SW * | 87 | 347 | 171 (49.3) | 162 (46.7) | 14 (4.0) | 83.0 | |
| Season | Spring | 454 | 910 | 622 (68.4) | 241 (26.5) | 47 (5.2) | 83 |
| Summer | 391 | 750 | 472 (62.9) | 248 (33.1) | 30 (4.0) | 66 | |
| Fall | 311 | 620 | 334 (53.9) | 243 (39.2) | 43 (6.9) | 73 | |
| Winter | 352 | 682 | 463 (67.9) | 191 (28.0) | 28 (4.1) | 47 | |
| Source | Ground | 778 | 2673 | 1658 (62.0) | 868 (32.5) | 147 (5.5) | 83 |
| Mix | 8 | 171 | 160 (93.6) | 10 (5.9) | 1 (0.6) | 17 | |
| Surface | 31 | 118 | 73 (61.9) | 45 (38.1) | 0 (0) | 4 | |
| Categories | Site No. | Samples No. | <5 ppb No. (%) | 5–10 ppb No. (%) | >10 ppb No. (%) | Maximum (ppb) | |
|---|---|---|---|---|---|---|---|
| Region | E | 350 | 489 | 475 (97.1) | 10 (2.0) | 4 (0.8) | 20 |
| NC * | 252 | 328 | 278 (84.8) | 24 (7.3) | 26 (7.9) | 110 | |
| NE | 116 | 146 | 139 (95.2) | 3 (2.1) | 4 (2.7) | 21 | |
| NW | 120 | 164 | 152 (92.7) | 9 (5.5) | 3 (1.8) | 22 | |
| SC | 82 | 101 | 96 (95.1) | 4 (4.0) | 1 (1.0) | 30 | |
| SW | 220 | 310 | 283 (91.3) | 14 (4.5) | 13 (4.2) | 125 | |
| Season | Spring | 258 | 281 | 266 (94.7) | 5 (1.8) | 10 (3.6) | 116 |
| Summer | 581 | 698 | 658 (92.4) | 32 (4.5) | 22 (3.1) | 110 | |
| Fall | 385 | 410 | 372 (90.7) | 23 (5.6) | 15 (3.7) | 125 | |
| Winter | 154 | 159 | 150 (94.3) | 4 (2.5) | 5 (3.1) | 20 | |
| Well depth | < 50 ft | 280 | 423 | 396 (93.6) | 20 (4.7) | 7 (1.7) | 90 |
| 50–100 | 193 | 289 | 273 (95.5) | 7 (2.5) | 6 (2.1) | 20 | |
| >100 * | 664 | 841 | 766 (91.1) | 36 (4.3) | 39 (4.6) | 125 | |
| Aquifer | Alluvial | 395 | 592 | 555 (93.8) | 24 (4.1) | 13 (2.2) | 90 |
| Bedrock | 552 | 685 | 637 (93.0) | 25 (3.7) | 23 (3.4) | 125 | |
| Glacial * | 185 | 265 | 235 (88.7) | 14 (5.3) | 16 (6.0) | 90 | |
| Categories | Site No. | Samples No. | <1 ppb No. (%) | 1–10 ppb No. (%) | >10 ppb No. (%) | Maximum (ppb) | |
|---|---|---|---|---|---|---|---|
| Region | E | 490 | 490 | 328 (66.9) | 147 (30.0) | 15 (3.1) | 160 |
| NC * | 183 | 184 | 67 (36.4) | 82 (44.6) | 35 (19.0) | 130 | |
| NE | 236 | 236 | 193 (81.8) | 39 (16.5) | 4 (1.7) | 17 | |
| NW | 43 | 43 | 20 (46.5) | 22 (51.2) | 1 (2.3) | 22 | |
| SC | 43 | 43 | 28 (65.1) | 14 (32.6) | 1 (2.3) | 13 | |
| SW | 200 | 200 | 89 (44.5) | 100 (50.0) | 11 (5.5) | 74 | |
| Season | Spring | 90 | 90 | 56 (62.2) | 29 (32.2) | 5 (5.6) | 40 |
| Summer | 191 | 191 | 100 (52.4) | 81(42.4) | 10 (5.2) | 44 | |
| Fall | 318 | 318 | 198 (62.3) | 98 (30.8) | 22 (6.9) | 160 | |
| Winter | 110 | 110 | 73 (66.4) | 28 (25.5) | 9 (8.2) | 130 | |
| Well depth | < 50 ft † | 112 | 113 | 64 (56.6) | 45 (39.8) | 4 (3.5) | 40 |
| 50–100 | 91 | 91 | 25 (27.5) | 54 (59.3) | 12 (13.2) | 160 | |
| >100 | 179 | 179 | 43 (24.0) | 112 (62.6) | 24 (13.4) | 110 | |
| Well age | < 1991 | 282 | 282 | 90 (31.9) | 161 (57.1) | 31 (11.0) | 160 |
| ≥ 1991 | 85 | 85 | 31 (36.5) | 47 (55.3) | 7 (8.2) | 28 | |
| Categories | Site No. | Samples No. | <0.2 ppb No. (%) | 0.2–3 ppb No. (%) | >3 ppb No. (%) | Maximum (ppb) | |
|---|---|---|---|---|---|---|---|
| Region | E | 292 | 976 | 925 (94.8) | 51 (5.2) | 0 | 2.2 |
| NC | 164 | 377 | 374 (99.2) | 3 (0.8) | 0 | 0.8 | |
| NE | 179 | 523 | 496 (94.8) | 27 (5.2) | 0 | 1.85 | |
| NW | 59 | 129 | 126 (97.7) | 3 (2.3) | 0 | 0.6 | |
| SC * | 47 | 291 | 154 (52.9) | 135 (46.4) | 2 (0.7) | 5.57 | |
| SW | 90 | 229 | 221 (96.5) | 8 (3.5) | 0 | 0.4 | |
| Season | Spring | 357 | 652 | 606 (92.9) | 46 (7.1) | 0 | 2.2 |
| Summer * | 377 | 734 | 646 (88.0) | 86 (11.7) | 2 (0.3) | 5.57 | |
| Fall | 289 | 565 | 520 (92.0) | 45 (8.0) | 0 | 1.76 | |
| Winter | 290 | 574 | 524 (91.3) | 50 (8.7) | 0 | 1.57 | |
| Source | Ground | 791 | 2043 | 2008 (98.3) | 35 (1.7) | 0 | 1.85 |
| Mix | 8 | 176 | 144 (81.8) | 32 (18.2) | 0 | 1.9 | |
| Surface * | 32 | 306 | 144 (47.1) | 160 (52.3) | 2 (0.7) | 5.57 | |
| Categories | Site No. | Samples No. | <0.2 ppb No. (%) | 0.2–3 ppb No. (%) | >3 ppb No. (%) | Maximum (ppb) | |
|---|---|---|---|---|---|---|---|
| Region | E | 255 | 687 | 585 (85.2) | 99 (14.4) | 3 (0.4) | 5.7 |
| NC | 203 | 435 | 403 (92.6) | 31 (7.1) | 1 (0.2) | 3.7 | |
| NE * | 98 | 253 | 211 (83.4) | 39 (15.4) | 3 (1.2) | 14.3 | |
| NW * | 111 | 355 | 275 (77.5) | 73 (20.6) | 7 (2.0) | 21 | |
| SC | 65 | 183 | 163 (89.1) | 20 (10.9) | 0 | 1.6 | |
| SW | 229 | 707 | 637 (90.1) | 65 (9.2) | 5 (0.7) | 7.1 | |
| Season | Spring | 152 | 206 | 138 (67.0) | 61 (29.6) | 7 (3.4) | 13 |
| Summer | 834 | 2257 | 1800 (79.8) | 438 (19.4) | 19 (0.8) | 25.5 | |
| Fall | 340 | 578 | 438 (75.8) | 135 (23.4) | 5 (0.9) | 14 | |
| Winter | 53 | 60 | 53 (83.3) | 6 (10.0) | 1 (1.7) | 14.3 | |
| Well depth | <50 ft | 320 | 986 | 819 (83.1) | 154 (15.6) | 13 (1.3) | 21 |
| 50–100 | 201 | 623 | 507 (81.4) | 111 (17.8) | 5 (0.8) | 12.8 | |
| >100 † | 473 | 1068 | 999 (93.5) | 68 (6.4) | 1 (0.1) | 4.3 | |
| Aquifer | Alluvial * | 380 | 1339 | 1110 (82.9) | 214 (16.0) | 15 (1.1) | 21 |
| Bedrock | 365 | 782 | 703 (89.9) | 78 (10.0) | 1 (0.1) | 4.3 | |
| Glacial | 208 | 511 | 479 (93.7) | 32 (6.3) | 0 (0) | 2.3 | |
| Categories | Site No. | Samples No. | <0.1 ppb No. (%) | ≥0.1 ppb No. (%) | Maximum (ppb) | |
|---|---|---|---|---|---|---|
| Region | E | 103 | 322 | 293 (91.0) | 29 (9.0) | 0.31 |
| NC | 81 | 193 | 185 (95.9) | 8 (4.2) | 0.32 | |
| NE | 46 | 137 | 129 (94.2) | 8 (5.8) | 0.16 | |
| NW | 57 | 158 | 139 (88.0) | 19 (12.0) | 0.24 | |
| SC | 30 | 75 | 74 (98.7) | 1 (1.3) | 0.16 | |
| SW | 64 | 211 | 206 (97.6) | 5 (2.4) | 0.15 | |
| Season | Summer | 317 | 999 | 938 (93.9) | 61 (6.1) | 0.32 |
| Fall | 112 | 119 | 109 (91.6) | 10 (8.4) | 0.31 | |
| Well depth | <50 ft | 71 | 346 | 319 (92.2) | 27 (7.8) | 0.32 |
| 50–100 | 71 | 228 | 205 (89.9) | 23 (10.1) | 0.31 | |
| >100 † | 228 | 537 | 517 (96.3) | 20 (3.7) | 0.26 | |
| Aquifer | Alluvial | 121 | 497 | 456 (91.8) | 41 (8.3) | 0.32 |
| Bedrock | 177 | 398 | 372 (93.2) | 26 (6.5) | 0.31 | |
| Glacial | 83 | 208 | 205 (98.6) | 3 (1.4) | 0.1 | |
| Categories | Site No. | Samples No. | <0.1 ppb No. (%) | ≥0.1 ppb No. (%) | Maximum (ppb) | |
|---|---|---|---|---|---|---|
| Region | E | 103 | 322 | 320 (99.4) | 2 (0.6) | 0.1 |
| NC | 81 | 193 | 184 (95.3) | 9 (4.7) | 0.3 | |
| NE | 46 | 137 | 137 (100) | 0 | - | |
| NW | 57 | 158 | 157 (99.4) | 1 (0.6) | 0.18 | |
| SC | 30 | 75 | 75 (100) | 0 | - | |
| SW | 64 | 211 | 209 (99.1) | 2 (1.0) | 0.1 | |
| Season | Summer | 317 | 909 | 897 (98.7) | 12 (1.3) | 0.3 |
| Fall | 112 | 112 | 111 (99.1) | 1 (0.9) | 0.2 | |
| Well depth | <50 ft | 90 | 346 | 335 (96.8) | 11 (3.2) | 0.3 |
| 50–100 | 71 | 228 | 225 (98.7) | 3 (1.3) | 0.2 | |
| >100 | 228 | 537 | 536 (99.8) | 1 (0.2) | 0.1 | |
| Aquifer | Alluvial | 121 | 497 | 483 (97.2) | 14 (2.8) | 0.3 |
| Bedrock | 177 | 398 | 397 (99.8) | 1 (0.3) | 0.1 | |
| Glacial | 83 | 208 | 208 (100) | 0 | - | |
| Categories | Site No. | Samples No. | <0.2 ppb No. (%) | 0.2–3 ppb No. (%) | >3 ppb No. (%) | Maximum (ppb) | |
|---|---|---|---|---|---|---|---|
| Region | E | 457 | 517 | 499 (96.5) | 18 (3.5) | 0 | 2.3 |
| NC | 203 | 248 | 246 (99.2) | 1 (0.4) | 1 (0.4) | 3.4 | |
| NE | 215 | 249 | 242 (97.2) | 6 (2.4) | 1 (0.4) | 3.2 | |
| NW | 79 | 95 | 91 (95.8) | 4 (4.2) | 0 | 1.7 | |
| SC | 164 | 185 | 184 (97.8) | 2 (1.1) | 2 (1.1) | 6.6 | |
| SW | 158 | 182 | 178 (97.8) | 4 (2.2) | 0 | 1.1 | |
| Season | Spring | 312 | 322 | 316 (98.1) | 5 (1.6) | 1 (0.3) | 6.6 |
| Summer | 397 | 410 | 403 (98.3) | 6 (1.5) | 1 (0.2) | 3.2 | |
| Fall | 459 | 464 | 452 (97.4) | 11 (2.4) | 1 (0.2) | 4.7 | |
| Winter | 278 | 280 | 266 (95.0) | 13 (4.6) | 1 (0.4) | 3.4 | |
| Well depth | < 50 ft | 235 | 277 | 262 (94.6) | 14 (5.1) | 1 (0.4) | 6.6 |
| 50–100 | 184 | 229 | 219 (95.6) | 8 (3.5) | 2 (0.9) | 3.4 | |
| > 100 † | 337 | 432 | 426 (98.6) | 6 (1.4) | 0 | 0.4 | |
| Well age | < 1991 | 671 | 817 | 797 (97.6) | 18 (2.2) | 2 (0.2) | 3.4 |
| ≥ 1991 | 78 | 78 | 75 (96.2) | 3 (3.9) | 0 (0.0) | 0.8 | |
| Categories | Site No. | Samples No. | <0.1 ppb No. (%) | ≥0.1 ppb No. (%) | Maximum (ppb) | |
|---|---|---|---|---|---|---|
| Region | E | 457 | 558 | 510 (91.4) | 48 (8.6) | 0.86 |
| NC | 203 | 272 | 268 (98.5) | 4 (1.5) | 1.3 | |
| NE | 215 | 259 | 235 (90.7) | 24 (9.3) | 0.42 | |
| NW | 79 | 115 | 104 (90.4) | 11 (9.6) | 2.86 | |
| SC | 164 | 202 | 196 (97.0) | 6 (3.0) | 0.72 | |
| SW | 158 | 204 | 200 (98.0) | 4 (1.9) | 0.24 | |
| Season | Spring | 374 | 386 | 376 (97.4) | 10 (2.6) | 2.86 |
| Summer | 399 | 412 | 389 (94.4) | 23 (5.6) | 0.64 | |
| Fall | 521 | 532 | 484 (91.0) | 48 (9.0) | 0.72 | |
| Winter | 278 | 280 | 264 (94.3) | 16 (5.7) | 1.3 | |
| Well depth | <50 ft * | 235 | 309 | 268 (86.7) | 41 (13.3) | 2.86 |
| 50–100 | 184 | 262 | 252 (96.2) | 10 (3.8) | 1.3 | |
| >100 | 337 | 483 | 470 (97.3) | 13 (2.7) | 0.3 | |
| Well age | <1991 | 671 | 902 | 850 (94.2) | 52 (5.8) | 2.79 |
| ≥1991 | 78 | 78 | 69 (88.5) | 9 (11.5) | 0.28 | |
| Categories | Site No. | Samples No. | <0.1 ppb No. (%) | ≥0.1 ppb No. (%) | Maximum (ppb) | |
|---|---|---|---|---|---|---|
| Region | E | 457 | 517 | 501 (96.9) | 16 (3.1) | 1.38 |
| NC | 201 | 248 | 241 (97.2) | 7 (2.8) | 0.92 | |
| NE | 215 | 249 | 245 (98.4) | 4 (1.6) | 0.49 | |
| NW | 79 | 95 | 90 (94.7) | 5 (5.3) | 3.54 | |
| SC | 164 | 185 | 181 (97.8) | 4 (2.2) | 3.1 | |
| SW | 158 | 182 | 177 (97.3) | 5 (2.8) | 0.2 | |
| Season | Spring | 374 | 386 | 385 (99.7) | 1 (0.3) | 3.54 |
| Summer | 399 | 412 | 401 (97.3) | 11 (2.7) | 0.67 | |
| Fall * | 521 | 532 | 514 (96.6) | 18 (3.4) | 3.1 | |
| Winter * | 278 | 280 | 265 (94.6) | 15 (5.4) | 1.38 | |
| Well depth | <50 ft | 235 | 277 | 263 (95.0) | 14 (5.1) | 3.54 |
| 50–100 | 184 | 229 | 222 (96.9) | 7 (3.1) | 3.1 | |
| >100 | 337 | 432 | 419 (97.0) | 13 (3.0) | 1.38 | |
| Well age | <1991 | 671 | 817 | 793 (97.1) | 24 (2.9) | 3.1 |
| ≥1991 | 78 | 78 | 76 (97.4) | 2 (2.6) | 0.26 | |
| Categories | Site No. | Samples No. | <0.1 ppb No. (%) | 0.1–3 ppb No. (%) | ≥3 ppb No. (%) | Maximum (ppb) | |
|---|---|---|---|---|---|---|---|
| Region | E | 61 | 113 | 8 (7.1) | 101 (89.4) | 4 (3.5) | 5.8 |
| NC | 13 | 19 | 4 (21.1) | 15 (79.0) | 0 | 0.5 | |
| NE | 44 | 75 | 9 (12.0) | 66 (88.0) | 0 | 2.5 | |
| NW | 1 | 1 | 0 | 1 (100) | 0 | 1.6 | |
| SC * | 46 | 74 | 3 (4.1) | 65 (87.8) | 6 (8.1) | 12 | |
| SW | 15 | 26 | 1 (3.85) | 24 (92.3) | 1 (3.9) | 4.9 | |
| Season | Spring * | 73 | 127 | 6 (4.7) | 111 (87.4) | 10 (7.9) | 11.2 |
| Summer * | 107 | 169 | 15 (8.9) | 132 (78.1) | 22 (13.0) | 25 | |
| Fall | 35 | 82 | 8 (9.8) | 74 (90.2) | 0 | 1.9 | |
| Winter | 72 | 118 | 8 (6.8) | 109 (92.4) | 1 (0.9) | 3.6 | |
Disclaimer/Publisher’s Note: The statements, opinions and data contained in all publications are solely those of the individual author(s) and contributor(s) and not of MDPI and/or the editor(s). MDPI and/or the editor(s) disclaim responsibility for any injury to people or property resulting from any ideas, methods, instructions or products referred to in the content. |
© 2023 by the authors. Licensee MDPI, Basel, Switzerland. This article is an open access article distributed under the terms and conditions of the Creative Commons Attribution (CC BY) license (https://creativecommons.org/licenses/by/4.0/).
Share and Cite
Roh, T.; Knappett, P.S.K.; Han, D.; Ludewig, G.; Kelly, K.M.; Wang, K.; Weyer, P.J. Characterization of Arsenic and Atrazine Contaminations in Drinking Water in Iowa: A Public Health Concern. Int. J. Environ. Res. Public Health 2023, 20, 5397. https://doi.org/10.3390/ijerph20075397
Roh T, Knappett PSK, Han D, Ludewig G, Kelly KM, Wang K, Weyer PJ. Characterization of Arsenic and Atrazine Contaminations in Drinking Water in Iowa: A Public Health Concern. International Journal of Environmental Research and Public Health. 2023; 20(7):5397. https://doi.org/10.3390/ijerph20075397
Chicago/Turabian StyleRoh, Taehyun, Peter S. K. Knappett, Daikwon Han, Gabriele Ludewig, Kevin M. Kelly, Kai Wang, and Peter J. Weyer. 2023. "Characterization of Arsenic and Atrazine Contaminations in Drinking Water in Iowa: A Public Health Concern" International Journal of Environmental Research and Public Health 20, no. 7: 5397. https://doi.org/10.3390/ijerph20075397