
Physical Activity in Adults with Schizophrenia and Bipolar Disorder: A Large Cross-Sectional Survey Exploring Patterns, Preferences, Barriers, and Motivating Factors
 , , , , , , , , ,
Abstract
:1. Introduction
- What are the patterns of physical activity and sedentary behaviour in people with SMI? (RQ1)
- What are the associations between physical activity status (meeting national physical activity guidelines or not) and selected sociodemographic and health variables in this population? (RQ2)
- What are the physical activity preferences of people with SMI? (RQ3)
- What barriers to participating in physical activity are reported by people with SMI? (RQ4)
- What motivating factors for participating in physical activity are reported by people with SMI? (RQ5)
- Do physical activity preferences, barriers, and motivating factors differ by gender, age group, physical activity status, and self-rated mental health in this population? (RQ6)
2. Materials and Methods
2.1. Ethics Approval
2.2. Study Design
2.3. Participants
2.4. Recruitment and Procedures
2.5. Measures
2.6. Data Analysis
- ≥150 min/week aerobic physical activity of at least a moderate intensity, including walking (not sufficiently active: <150 min/week)
- ≥150 min/week aerobic physical activity of at least a moderate intensity, excluding walking (not sufficiently active: <150 min/week)
- ≥2 sessions/week muscle-strengthening activity (not sufficiently active: <2 sessions/week)
3. Results
3.1. What Are the Patterns of Physical Activity and Sedentary Behaviour in People with SMI? (RQ1)
3.2. What Are the Associations between Physical Activity Status (Defined as Sufficiently Active or Not) and Selected Sociodemographic and Health Variables in this Population? (RQ2)
3.2.1. Unadjusted Associations
- Professionally active vs. not professionally active (inc. walking): 90% vs. 76%
- Professionally active vs. not professionally active (exc. walking): 74% vs. 57%
- Healthy and underweight (BMI <25 kg/m2) vs. with obesity (BMI ≥30 kg/m2) (inc. walking): 85% vs. 73%
- Never smoked vs. previous smoker and current smoker (inc. walking): 85% vs. 76% vs. 74%
- No fatigue vs. severe fatigue (inc. walking): 86% vs. 67%
- Excellent-good mental health vs. poor-very poor mental health (inc. walking): 84% vs. 72%
- Excellent-good mental health vs. poor-very poor mental health (exc. walking): 65% vs. 52%
- Minimal depression vs. severe depression (inc. walking): 85% vs. 57%
- Minimal depression vs. severe depression (exc. walking): 63% vs. 40%
- Male vs. female: 33% vs. 22%
- Age 18–34 years vs. ≥65 years: 39% vs. 21%
- Excellent-good mental health vs. moderate mental health and poor-very poor mental health: 39% vs. 28% vs. 18%
- Minimal depression vs. moderate depression and severe depression: 35% vs. 20% vs. 22%
3.2.2. Adjusted Associations
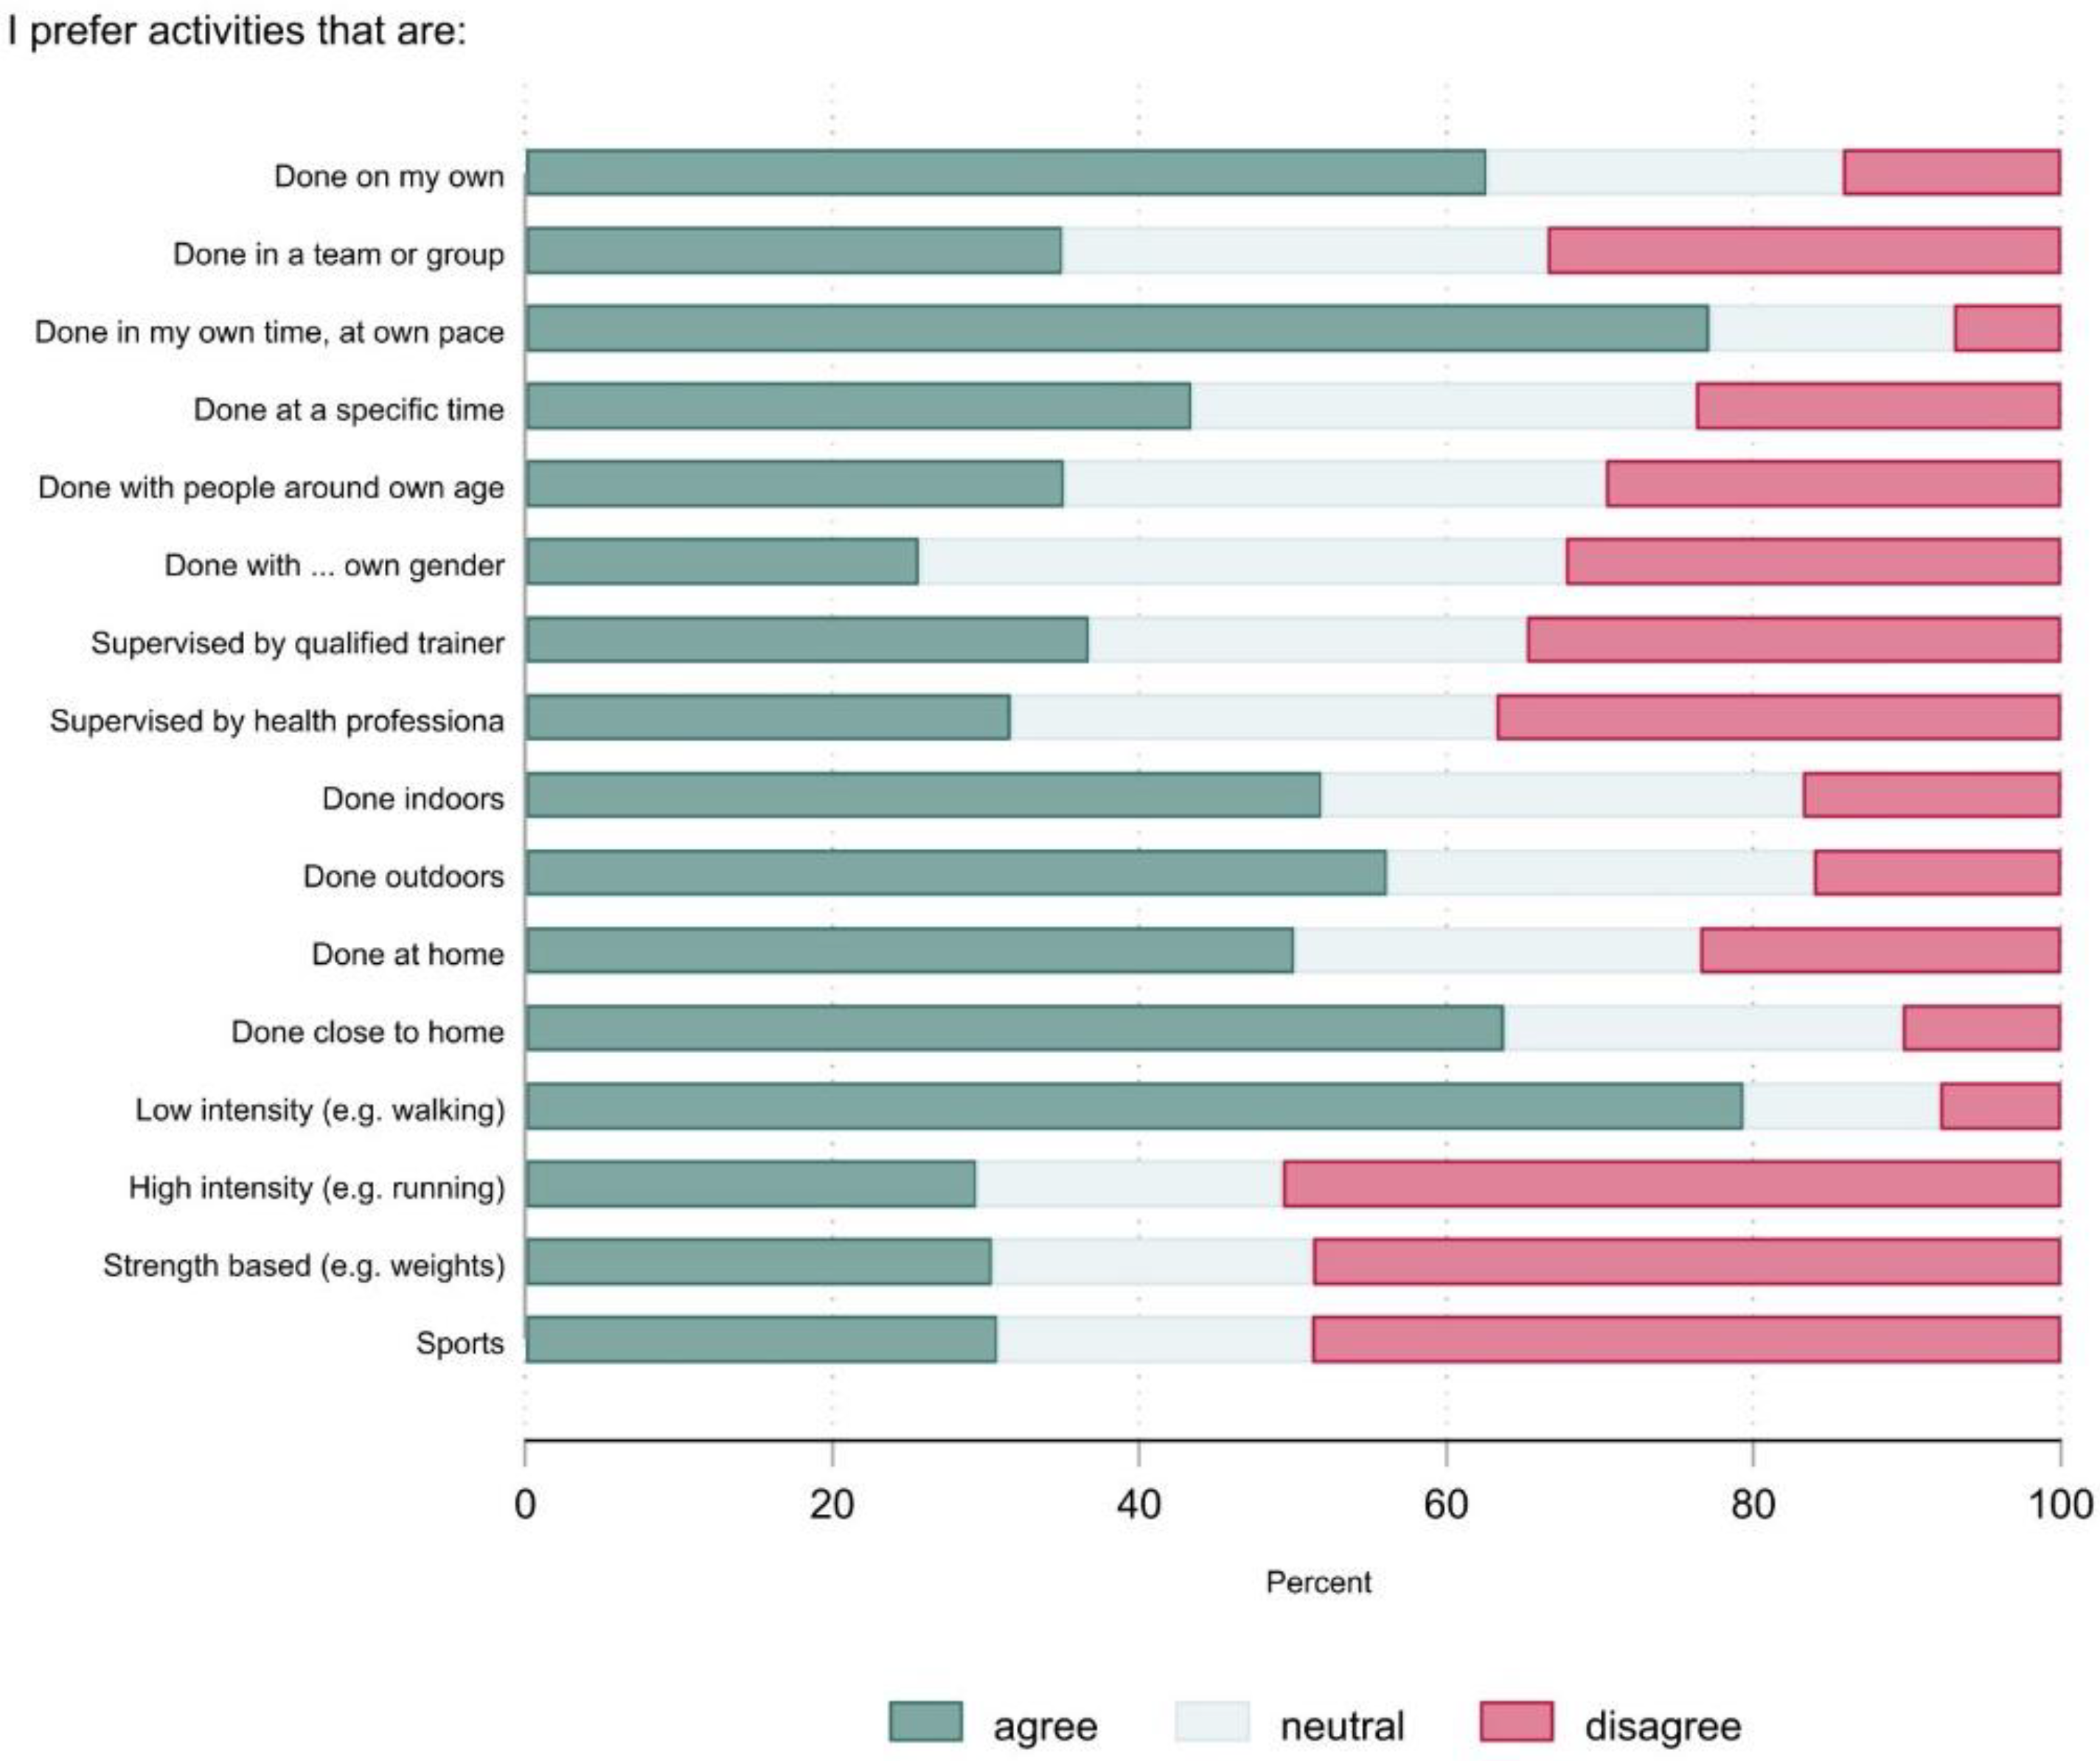
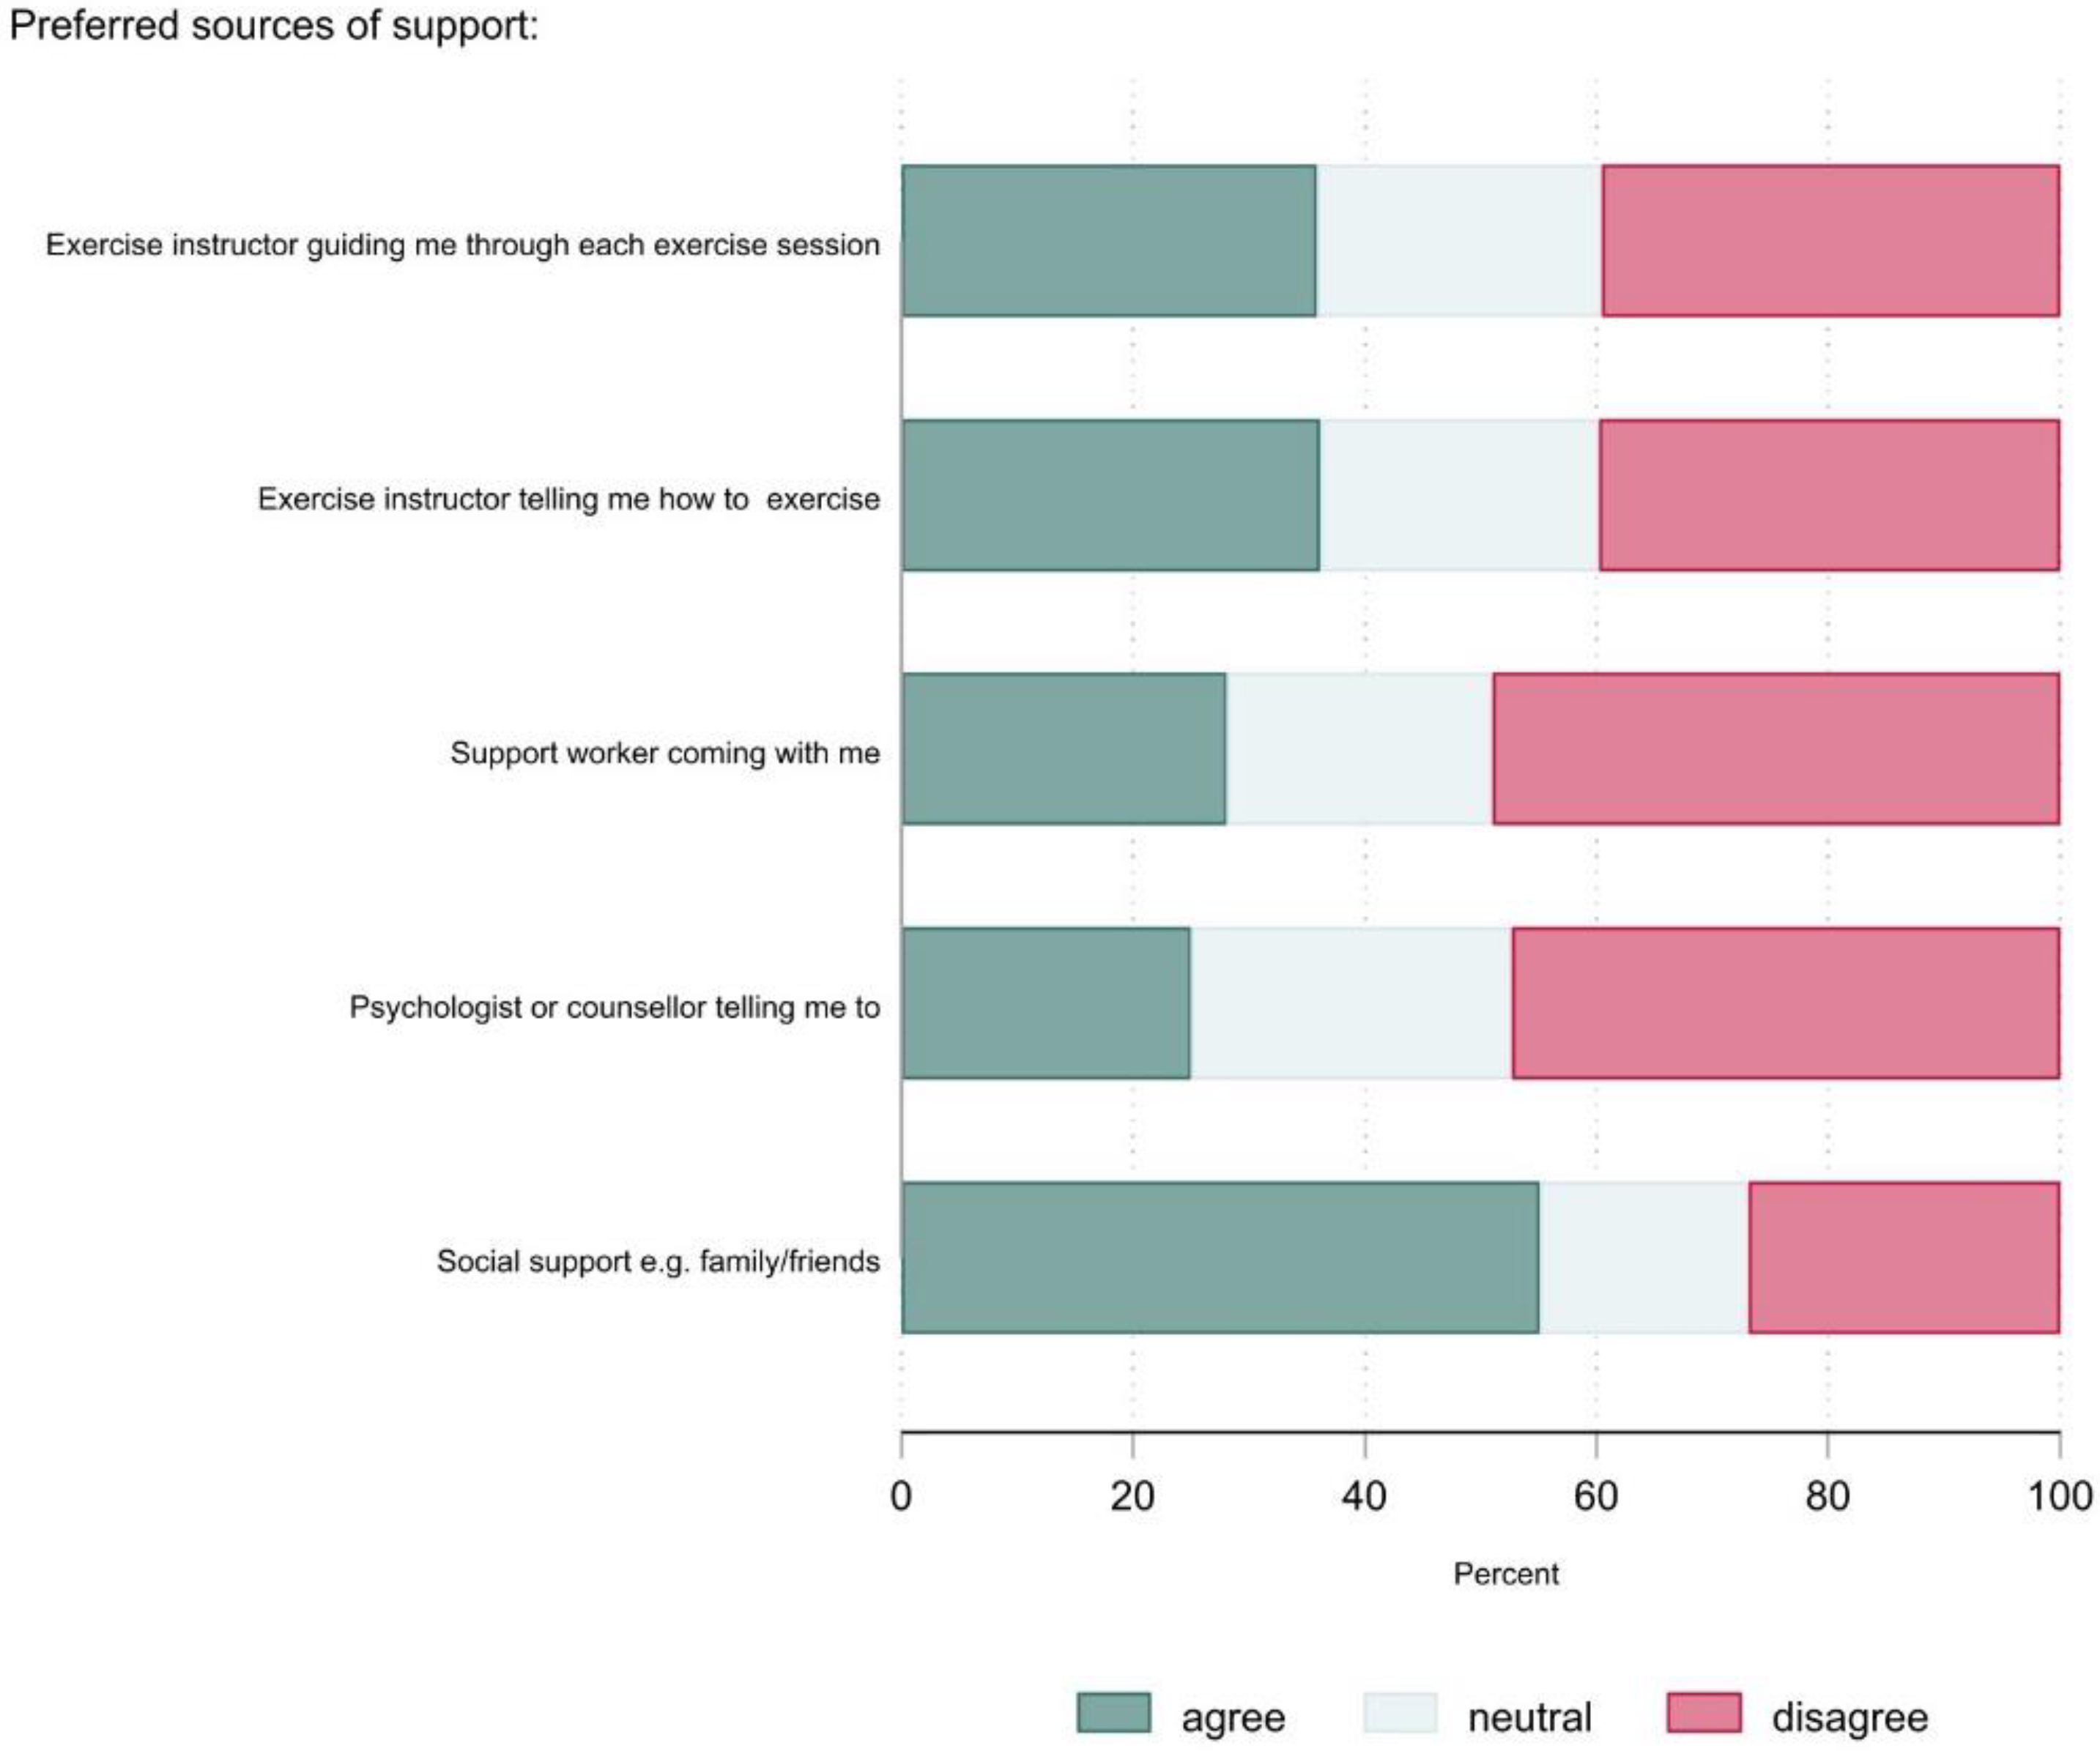
3.3. What Are the Physical Activity Preferences of People with SMI and Do They Differ by Gender, Age Group, Physical Activity Status, and Mental Health Status? (RQ3, RQ6)
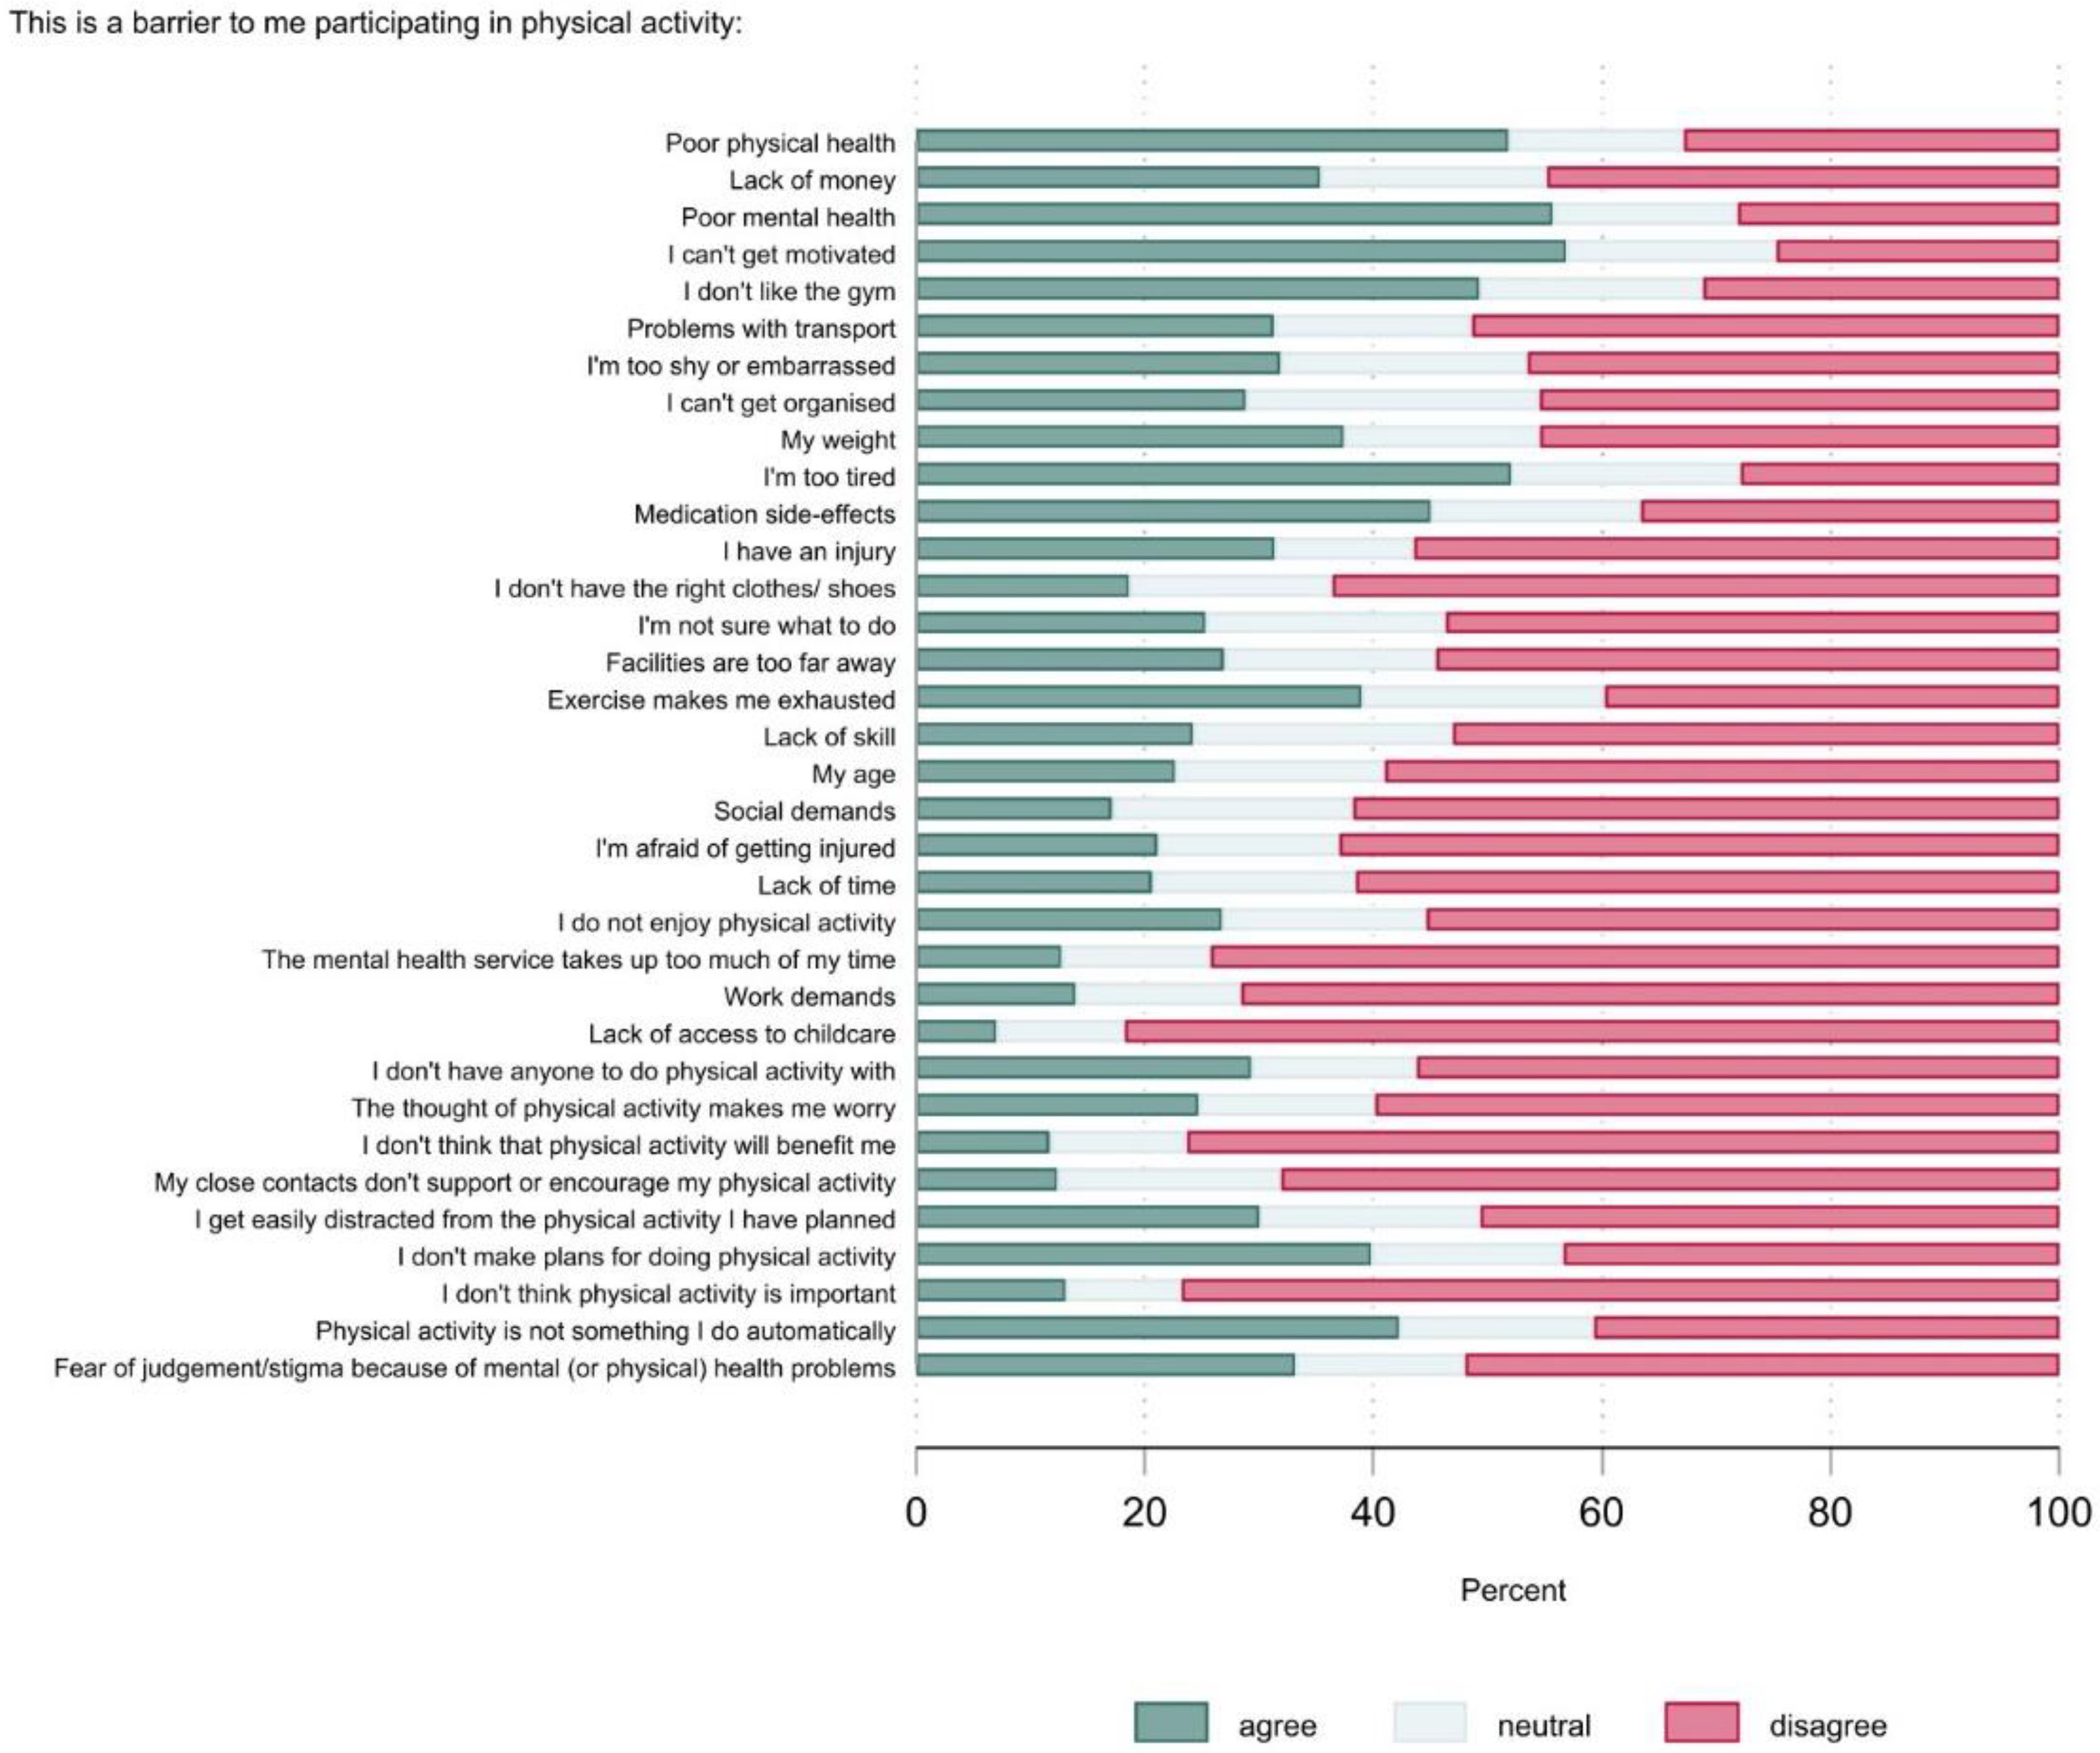
3.4. What Barriers to Participating in Physical Activity Are Reported by People with SMI and Do They Differ by Gender, Age Group, Physical Activity Status, and Mental Health Status? (RQ4, RQ6)
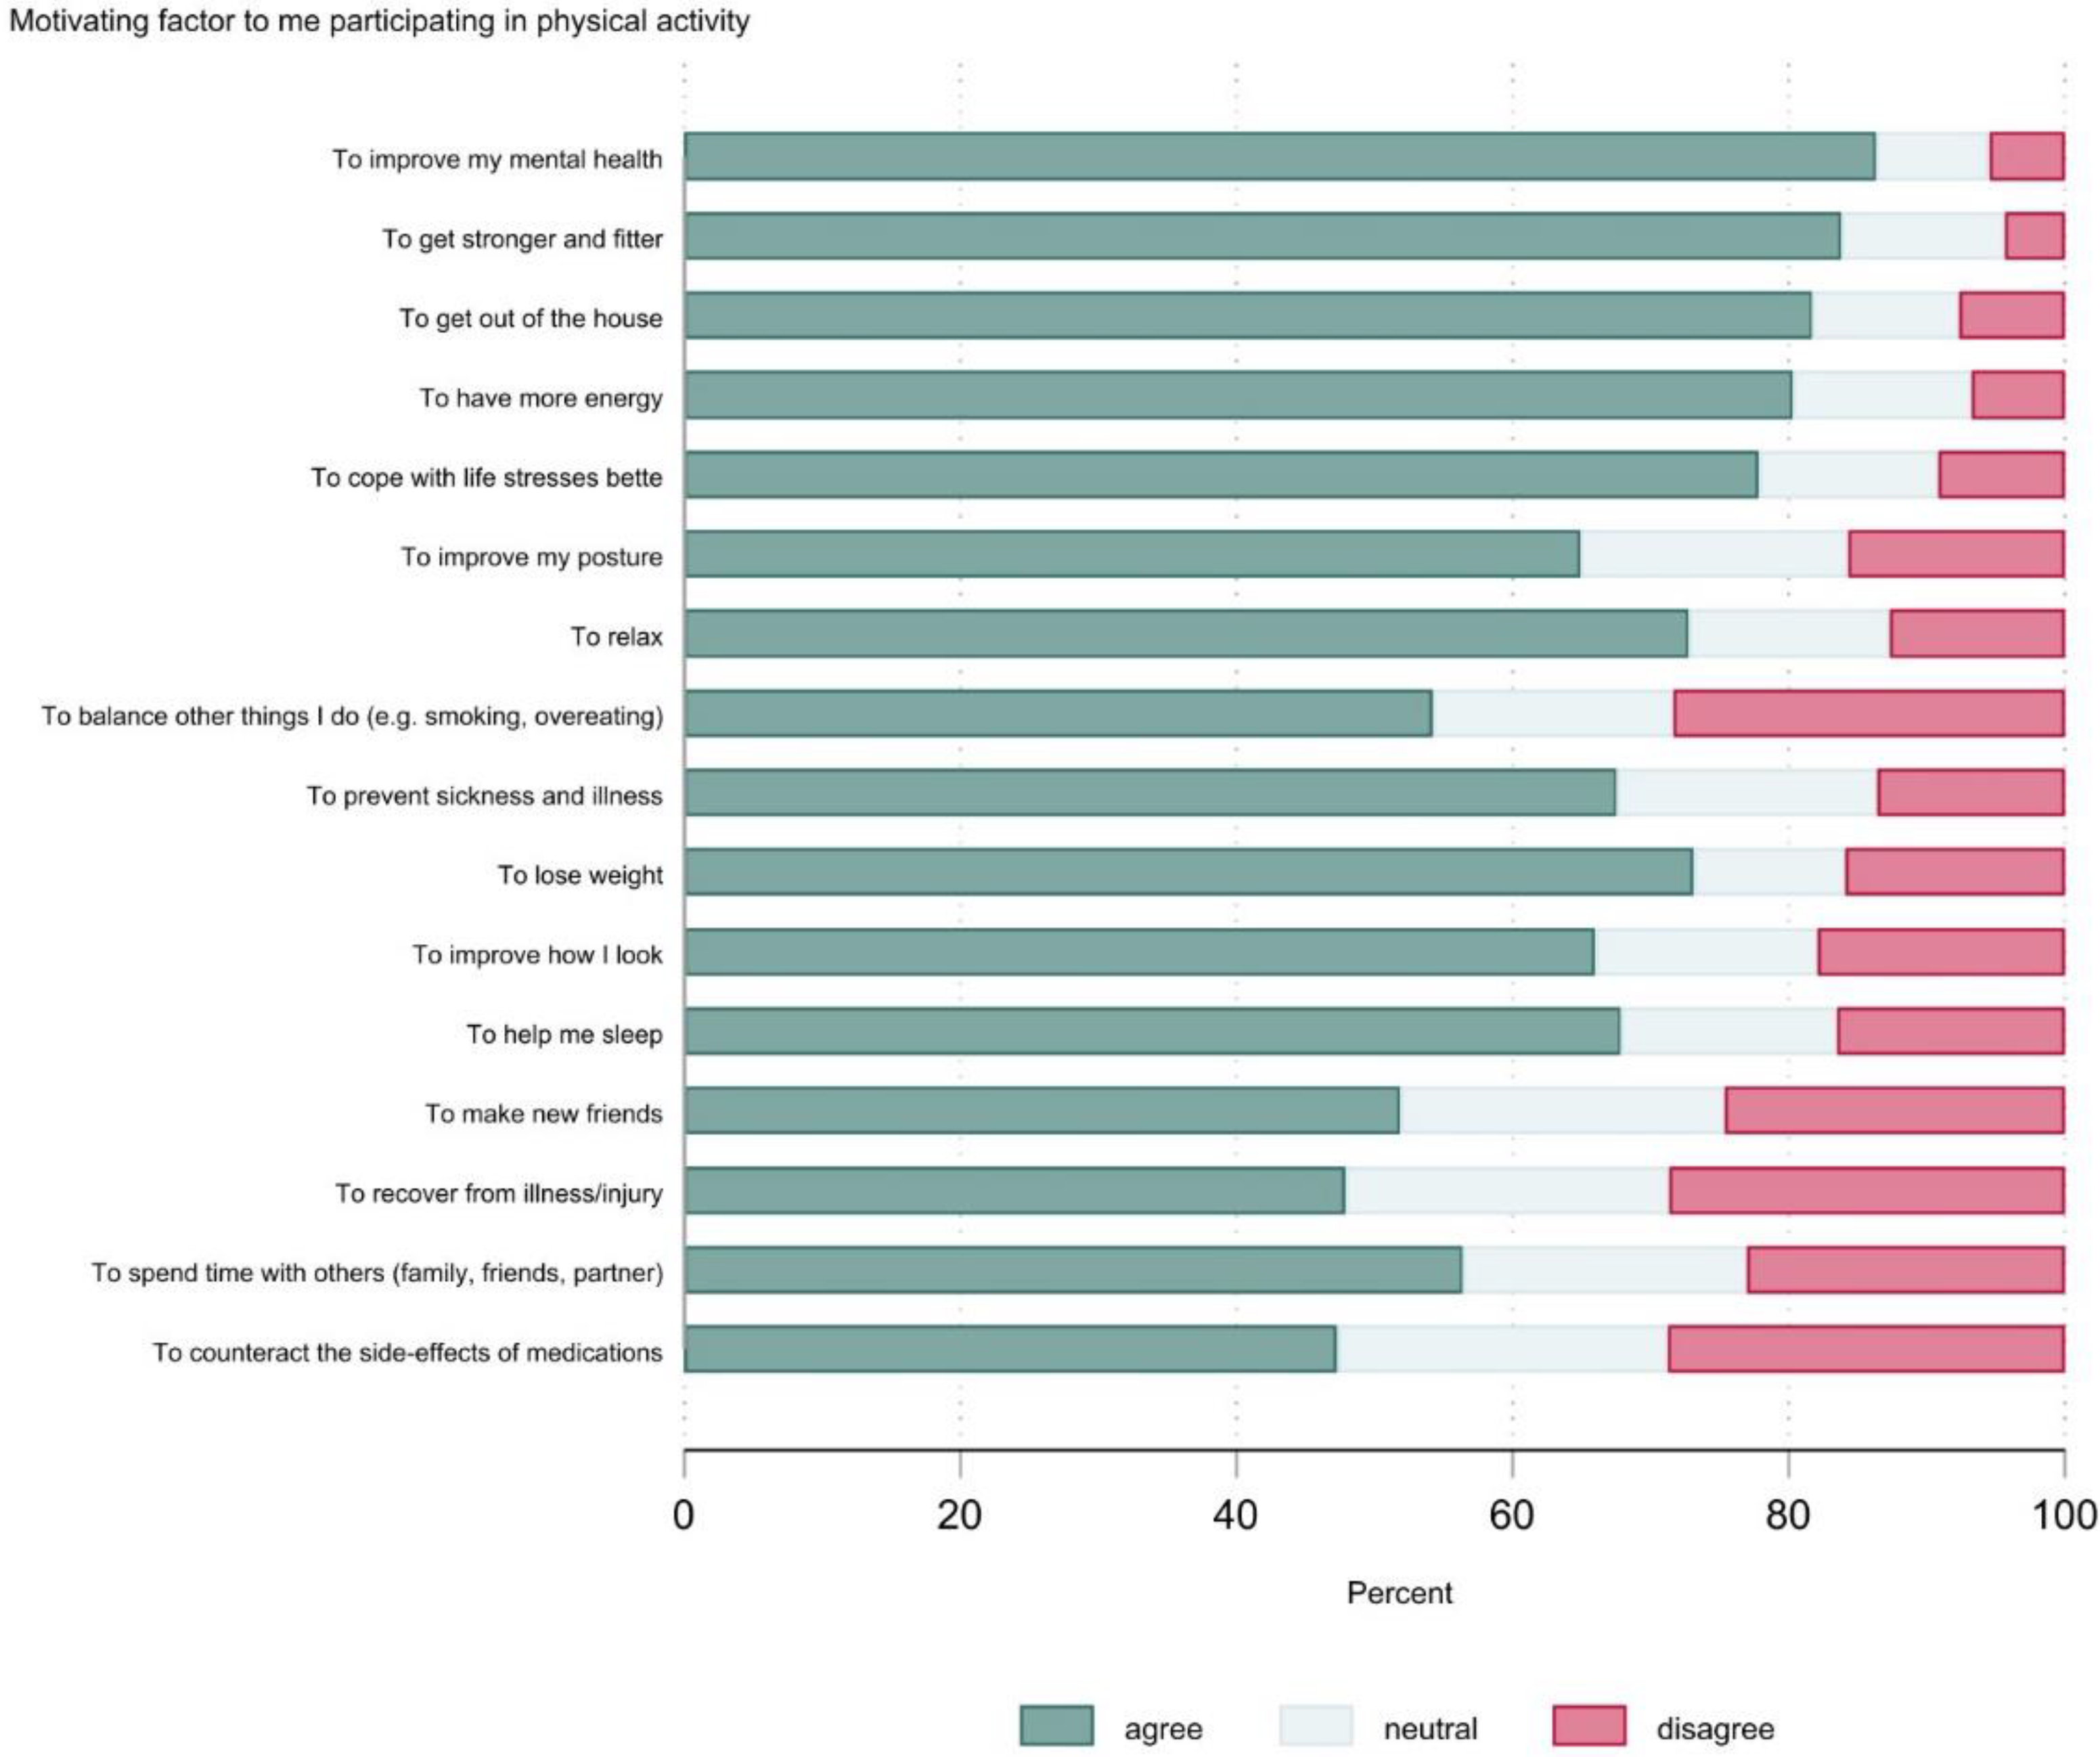
3.5. What Motivating Factors for Participating in Physical Activity Are Reported by People with SMI and Do They Differ by Gender, Age Group, Physical Activity Status, and Mental Health Status? (RQ5, RQ6)
4. Discussion
4.1. Patterns of Physical Activity and Sedentary Behaviour in People with SMI
4.2. Physical Activity Preferences of People with SMI
4.3. Barriers and Motivating Factors for Physical Activity of People with SMI
4.4. Implications
4.5. Limitations
5. Conclusions
Supplementary Materials
Author Contributions
Funding
Institutional Review Board Statement
Informed Consent Statement
Data Availability Statement
Acknowledgments
Conflicts of Interest
References
- Stubbs, B.; Vancampfort, D.; Solmi, M.; Veronese, N.; Fornaro, M. How Common Is Bipolar Disorder in General Primary Care Attendees? A Systematic Review and Meta-Analysis Investigating Prevalence Determined According to Structured Clinical Assessments. Aust. N. Z. J. Psychiatry 2016, 50, 631–639. [Google Scholar] [CrossRef] [PubMed]
- Hayes, J.F.; Marston, L.; Walters, K.; King, M.B.; Osborn, D.P.J. Mortality Gap for People with Bipolar Disorder and Schizophrenia: UK-Based Cohort Study 2000–2014. Br. J. Psychiatry 2017, 211, 175–181. [Google Scholar] [CrossRef] [PubMed] [Green Version]
- Osborn, D.P.J.; Levy, G.; Nazareth, I.; Petersen, I.; Islam, A.; King, M.B. Relative Risk of Cardiovascular and Cancer Mortality in People With Severe Mental Illness From the United Kingdom’s General Practice Research Database. Arch. Gen. Psychiatry 2007, 64, 242. [Google Scholar] [CrossRef] [PubMed] [Green Version]
- Ribe, A.R.; Laursen, T.M.; Sandbaek, A.; Charles, M.; Nordentoft, M.; Vestergaard, M. Long-Term Mortality of Persons with Severe Mental Illness and Diabetes: A Population-Based Cohort Study in Denmark. Psychol. Med. 2014, 44, 3097–3107. [Google Scholar] [CrossRef]
- Correll, C.U.; Solmi, M.; Veronese, N.; Bortolato, B.; Rosson, S.; Santonastaso, P.; Thapa-Chhetri, N.; Fornaro, M.; Gallicchio, D.; Collantoni, E.; et al. Prevalence, Incidence and Mortality from Cardiovascular Disease in Patients with Pooled and Specific Severe Mental Illness: A Large-Scale Meta-Analysis of 3,211,768 Patients and 113,383,368 Controls. World Psychiatry 2017, 16, 163–180. [Google Scholar] [CrossRef] [Green Version]
- Alderwick, H.; Dixon, J. The NHS Long Term Plan. BMJ 2019, 364. [Google Scholar] [CrossRef] [Green Version]
- Lee, I.-M.; Shiroma, E.J.; Lobelo, F.; Puska, P.; Blair, S.N.; Katzmarzyk, P.T. Effect of Physical Inactivity on Major Non-Communicable Diseases Worldwide: An Analysis of Burden of Disease and Life Expectancy. Lancet 2012, 380, 219–229. [Google Scholar] [CrossRef] [Green Version]
- World Health Organization. Global Action Plan on Physical Activity 2018–2030: More Active People for a Healthier World; World Health Organization: Geneva, Switzerland, 2018.
- Biswas, A.; Oh, P.I.; Faulkner, G.E.; Bajaj, R.R.; Silver, M.A.; Mitchell, M.S.; Alter, D.A. Sedentary Time and Its Association With Risk for Disease Incidence, Mortality, and Hospitalization in Adults. Ann. Intern. Med. 2015, 162, 123–132. [Google Scholar] [CrossRef]
- Stubbs, B.; Vancampfort, D.; Hallgren, M.; Firth, J.; Veronese, N.; Solmi, M.; Brand, S.; Cordes, J.; Malchow, B.; Gerber, M.; et al. EPA Guidance on Physical Activity as a Treatment for Severe Mental Illness: A Meta-Review of the Evidence and Position Statement from the European Psychiatric Association (EPA), Supported by the International Organization of Physical Therapists in Mental Health (IOPTMH). Eur. Psychiatry 2018, 54, 124–144. [Google Scholar] [CrossRef] [Green Version]
- Firth, J.; Rosenbaum, S.; Stubbs, B.; Gorczynski, P.; Yung, A.R.; Vancampfort, D. Motivating Factors and Barriers towards Exercise in Severe Mental Illness: A Systematic Review and Meta-Analysis. Psychol. Med. 2016, 46, 2869–2881. [Google Scholar] [CrossRef]
- Stubbs, B.; Williams, J.; Gaughran, F.; Craig, T. How Sedentary Are People with Psychosis? A Systematic Review and Meta-Analysis. Schizophr. Res. 2016, 171, 103–109. [Google Scholar] [CrossRef] [PubMed] [Green Version]
- Mishu, M.P.; Peckham, E.J.; Heron, P.N.; Tew, G.A.; Stubbs, B.; Gilbody, S. Factors Associated with Regular Physical Activity Participation among People with Severe Mental Ill Health. Soc. Psychiatry Psychiatr. Epidemiol. 2019, 54, 887–895. [Google Scholar] [CrossRef] [PubMed] [Green Version]
- Tew, G.A.; Jones, K.; Mikocka-Walus, A. Physical Activity Habits, Limitations, and Predictors in People with Inflammatory Bowel Disease. Inflamm. Bowel Dis. 2016, 22, 2933–2942. [Google Scholar] [CrossRef] [PubMed] [Green Version]
- Orrell, A.; Doherty, P.; Miles, J.; Lewin, R. Development and Validation of a Very Brief Questionnaire Measure of Physical Activity in Adults with Coronary Heart Disease. Eur. J. Cardiovasc. Prev. Rehabil. 2007, 14, 615–623. [Google Scholar] [CrossRef]
- Health Survey for England 2019. 2019. Available online: http://Healthsurvey.Hscic.Gov.Uk/Support-Guidance/Public-Health/Health-Survey-for-England-2019.Aspx (accessed on 1 January 2020).
- Rosenbaum, S.; Morell, R.; Abdel-Baki, A.; Ahmadpanah, M.; Anilkumar, T.V.; Baie, L.; Bauman, A.; Bender, S.; Boyan Han, J.; Brand, S.; et al. Assessing Physical Activity in People with Mental Illness: 23-Country Reliability and Validity of the Simple Physical Activity Questionnaire (SIMPAQ). BMC Psychiatry 2020, 20, 108. [Google Scholar] [CrossRef] [Green Version]
- Sport England Active Lives Survey Results. Available online: https://activelives.sportengland.org/Result?viewStateId=3 (accessed on 1 November 2022).
- Scholes, S.; Bridges, S.; Ng Fat, L.; Mindell, J.S. Comparison of the Physical Activity and Sedentary Behaviour Assessment Questionnaire and the Short-Form International Physical Activity Questionnaire: An Analysis of Health Survey for England Data. PLoS ONE 2016, 11, e0151647. [Google Scholar] [CrossRef]
- Chapman, J.J.; Fraser, S.J.; Brown, W.J.; Burton, N.W. Physical Activity Preferences, Motivators, Barriers and Attitudes of Adults with Mental Illness. J. Ment. Health 2016, 25, 448–454. [Google Scholar] [CrossRef]
- Michie, S. Making Psychological Theory Useful for Implementing Evidence Based Practice: A Consensus Approach. Qual. Saf. Health Care 2005, 14, 26–33. [Google Scholar] [CrossRef] [Green Version]
- Michie, S.; van Stralen, M.M.; West, R. The Behaviour Change Wheel: A New Method for Characterising and Designing Behaviour Change Interventions. Implement. Sci. 2011, 6, 42. [Google Scholar] [CrossRef] [Green Version]
- Taylor, N.; Lawton, R.; Conner, M. Development and Initial Validation of the Determinants of Physical Activity Questionnaire. Int. J. Behav. Nutr. Phys. Act. 2013, 10, 74. [Google Scholar] [CrossRef]
- Keyworth, C.; Epton, T.; Goldthorpe, J.; Calam, R.; Armitage, C.J. Acceptability, Reliability, and Validity of a Brief Measure of Capabilities, Opportunities, and Motivations (“COM-B”). Br. J. Health Psychol. 2020, 25, 474–501. [Google Scholar] [CrossRef] [PubMed]
- Kroenke, K.; Strine, T.W.; Spitzer, R.L.; Williams, J.B.W.; Berry, J.T.; Mokdad, A.H. The PHQ-8 as a Measure of Current Depression in the General Population. J. Affect. Disord. 2009, 114, 163–173. [Google Scholar] [CrossRef] [PubMed]
- Department of Health & Social Care UK Chief Medical Officers’ Physical Activity Guidelines. Available online: https://assets.publishing.service.gov.uk/government/uploads/system/uploads/attachment_data/file/832868/uk-chief-medical-officers-physical-activity-guidelines.pdf (accessed on 16 November 2022).
- Hallal, P.C.; Andersen, L.B.; Bull, F.C.; Guthold, R.; Haskell, W.; Ekelund, U. Global Physical Activity Levels: Surveillance Progress, Pitfalls, and Prospects. Lancet 2012, 380, 247–257. [Google Scholar] [CrossRef]
- Vancampfort, D.; Firth, J.; Schuch, F.B.; Rosenbaum, S.; Mugisha, J.; Hallgren, M.; Probst, M.; Ward, P.B.; Gaughran, F.; de Hert, M.; et al. Sedentary Behavior and Physical Activity Levels in People with Schizophrenia, Bipolar Disorder and Major Depressive Disorder: A Global Systematic Review and Meta-Analysis. World Psychiatry 2017, 16, 308–315. [Google Scholar] [CrossRef] [Green Version]
- Liu, N.H.; Daumit, G.L.; Dua, T.; Aquila, R.; Charlson, F.; Cuijpers, P.; Druss, B.; Dudek, K.; Freeman, M.; Fujii, C.; et al. Excess Mortality in Persons with Severe Mental Disorders: A Multilevel Intervention Framework and Priorities for Clinical Practice, Policy and Research Agendas. World Psychiatry 2017, 16, 30–40. [Google Scholar] [CrossRef] [Green Version]
- Saxena, S.; Maj, M. Physical Health of People with Severe Mental Disorders: Leave No One Behind. World Psychiatry 2017, 16, 1–2. [Google Scholar] [CrossRef] [PubMed] [Green Version]
- Strain, T.; Fitzsimons, C.; Kelly, P.; Mutrie, N. The Forgotten Guidelines: Cross-Sectional Analysis of Participation in Muscle Strengthening and Balance & Co-Ordination Activities by Adults and Older Adults in Scotland. BMC Public Health 2016, 16, 1108. [Google Scholar] [CrossRef] [PubMed] [Green Version]
- Bennie, J.A.; Shakespear-Druery, J.; de Cocker, K. Muscle-Strengthening Exercise Epidemiology: A New Frontier in Chronic Disease Prevention. Sport. Med. Open 2020, 6, 40. [Google Scholar] [CrossRef]
- Plessz, M.; Ezdi, S.; Airagnes, G.; Parizot, I.; Ribet, C.; Goldberg, M.; Zins, M.; Meneton, P. Association between Unemployment and the Co-Occurrence and Clustering of Common Risky Health Behaviors: Findings from the Constances Cohort. PLoS ONE 2020, 15, e0232262. [Google Scholar] [CrossRef]
- Paterson, D.H.; Warburton, D.E. Physical Activity and Functional Limitations in Older Adults: A Systematic Review Related to Canada’s Physical Activity Guidelines. Int. J. Behav. Nutr. Phys. Act. 2010, 7, 38. [Google Scholar] [CrossRef]
- Rubenstein, L.Z. Falls in Older People: Epidemiology, Risk Factors and Strategies for Prevention. Age Ageing 2006, 35, ii37–ii41. [Google Scholar] [CrossRef] [PubMed] [Green Version]
- Fraser, S.J.; Chapman, J.J.; Brown, W.J.; Whiteford, H.A.; Burton, N.W. Physical Activity Attitudes and Preferences among Inpatient Adults with Mental Illness. Int. J. Ment. Health Nurs. 2015, 24, 413–420. [Google Scholar] [CrossRef] [PubMed]
- Romain, A.J.; Longpré-Poirier, C.; Tannous, M.; Abdel-Baki, A. Physical Activity for Patients with Severe Mental Illness: Preferences, Barriers and Perceptions of Counselling. Sci. Sport. 2020, 35, 289–299. [Google Scholar] [CrossRef]
- Ashdown-Franks, G.; Williams, J.; Vancampfort, D.; Firth, J.; Schuch, F.; Hubbard, K.; Craig, T.; Gaughran, F.; Stubbs, B. Is It Possible for People with Severe Mental Illness to Sit Less and Move More? A Systematic Review of Interventions to Increase Physical Activity or Reduce Sedentary Behaviour. Schizophr. Res. 2018, 202, 3–16. [Google Scholar] [CrossRef] [PubMed]
- Quirk, H.; Hock, E.; Harrop, D.; Crank, H.; Peckham, E.; Traviss-Turner, G.; Machaczek, K.; Stubbs, B.; Horspool, M.; Weich, S.; et al. Understanding the Experience of Initiating Community-Based Group Physical Activity by People with Serious Mental Illness: A Systematic Review Using a Meta-Ethnographic Approach. Eur. Psychiatry 2020, 63, e95. [Google Scholar] [CrossRef]
- Such, E.; Burton, H.; Copeland, R.J.; Davies, R.; Goyder, E.; Jeanes, R.; Kesterton, S.; Mackenzie, K.; Magee, J. Developing a Theory-Driven Framework for a Football Intervention for Men with Severe, Moderate or Enduring Mental Health Problems: A Participatory Realist Synthesis. J. Ment. Health 2020, 29, 277–288. [Google Scholar] [CrossRef] [Green Version]
- Brawn, P.; Combes, H.; Ellis, N. Football Narratives: Recovery & Mental Health. J. New Writ. Health Soc. Care 2015, 2, 30–46. [Google Scholar]
- Macdonald, L. Associations between Spatial Access to Physical Activity Facilities and Frequency of Physical Activity; How Do Home and Workplace Neighbourhoods in West Central Scotland Compare? Int. J. Health Geogr. 2019, 18, 2. [Google Scholar] [CrossRef] [Green Version]
- Public Health England Severe Mental Illness (SMI) and Physical Health Inequalities: Briefing. Available online: https://www.gov.uk/government/publications/severe-mental-illness-smi-physical-health-inequalities/severe-mental-illness-and-physical-health-inequalities-briefing (accessed on 1 November 2022).
- Sport England This Girl Can Campaign Summary. Available online: https://sportengland-production-files.s3.eu-west-2.amazonaws.com/s3fs-public/2020-01/Campaign-Summary.pdf?VersionId=Yu_jmNiqPxjL8IlJC0EqvKXjJ_GOFpfx (accessed on 1 November 2022).
- Eime, R.; Charity, M.; Harvey, J.; Westerbeek, H. Five-Year Changes in Community-Level Sport Participation, and the Role of Gender Strategies. Front. Sport. Act. Living 2021, 3, 710666. [Google Scholar] [CrossRef]
- Williamson, C.; Baker, G.; Tomasone, J.R.; Bauman, A.; Mutrie, N.; Niven, A.; Richards, J.; Oyeyemi, A.; Baxter, B.; Rigby, B.; et al. The Physical Activity Messaging Framework (PAMF) and Checklist (PAMC): International Consensus Statement and User Guide. Int. J. Behav. Nutr. Phys. Act. 2021, 18, 164. [Google Scholar] [CrossRef]
- Smith, B.; Mallick, K.; Monforte, J.; Foster, C. Disability, the Communication of Physical Activity and Sedentary Behaviour, and Ableism: A Call for Inclusive Messages. Br. J. Sport. Med. 2021, 55, 1121–1122. [Google Scholar] [CrossRef] [PubMed]
- Edwards, A.; Abonie, U.; Hettinga, F.; Pyne, D.; Oh, T.; Polman, R. Practical and Clinical Approaches Using Pacing to Improve Self-Regulation in Special Populations Such as Children and People with Mental Health or Learning Disabilities. J. Rehabil. Med. Clin. Commun. 2021, 4, jrmcc00057. [Google Scholar] [CrossRef] [PubMed]
- Martin Ginis, K.A.; van der Ploeg, H.P.; Foster, C.; Lai, B.; McBride, C.B.; Ng, K.; Pratt, M.; Shirazipour, C.H.; Smith, B.; Vásquez, P.M.; et al. Participation of People Living with Disabilities in Physical Activity: A Global Perspective. Lancet 2021, 398, 443–455. [Google Scholar] [CrossRef]
- Peckham, E.; Gilbody, S.; Stubbs, B.; Tew, G.; Traviss-Turner, G.; Quirk, H.; Machaczek, K.; Horspool, M.; Beeken, R.; Wildbore, E.; et al. Supporting Physical and Activity through Co-Production in People with Severe Mental Illness (SPACES). Available online: https://fundingawards.nihr.ac.uk/award/NIHR201618 (accessed on 1 November 2022).
- Sorić, M.; Meh, K.; Rocha, P.; Wendel-Vos, W.; de Hollander, E.; Jurak, G. An Inventory of National Surveillance Systems Assessing Physical Activity, Sedentary Behaviour and Sport Participation of Adults in the European Union. BMC Public Health 2021, 21, 1797. [Google Scholar] [CrossRef] [PubMed]
- Firth, J.; Stubbs, B.; Vancampfort, D.; Schuch, F.B.; Rosenbaum, S.; Ward, P.B.; Firth, J.A.; Sarris, J.; Yung, A.R. The Validity and Value of Self-Reported Physical Activity and Accelerometry in People with Schizophrenia: A Population-Scale Study of the UK Biobank. Schizophr. Bull. 2018, 44, 1293–1300. [Google Scholar] [CrossRef]
- Prince, S.A.; Adamo, K.B.; Hamel, M.; Hardt, J.; Connor Gorber, S.; Tremblay, M. A Comparison of Direct versus Self-Report Measures for Assessing Physical Activity in Adults: A Systematic Review. Int. J. Behav. Nutr. Phys. Act. 2008, 5, 56. [Google Scholar] [CrossRef] [PubMed]


| Characteristics | % (n) | |
|---|---|---|
| Age | 18–34 years | 15 (81) |
| 35–64 years | 70 (371) | |
| >65 years | 13 (67) | |
| Missing | 2 (10) | |
| Gender | Male | 58 (308) |
| Female | 40 (212) | |
| Transgender | 1 (3) | |
| Preferred not to say | 1 (4) | |
| Missing | 0 (2) | |
| Ethnicity | White—UK/Irish/other | 79 (416) |
| Asian | 4 (21) | |
| Black/African/Caribbean | 5 (26) | |
| Mixed multiple groups | 3 (14) | |
| Other | 2 (12) | |
| Missing | 8 (40) | |
| Employment | Professionally active | 19 (99) |
| Not professionally active | 67 (356) | |
| Other | 4 (21) | |
| Missing | 10 (53) | |
| Body mass index | <18.5 kg/m2 | 0 (2) |
| 18.5–24.9 kg/m2 | 18 (93) | |
| 25–29.9 kg/m2 | 22 (119) | |
| ≥30 kg/m2 | 42 (223) | |
| Missing | 17 (92) | |
| Self-rated mental health | Excellent-good | 38 (199) |
| Moderate | 31 (166) | |
| Poor-very poor | 30 (157) | |
| Missing | 1 (7) | |
| PHQ-8 depression severity | 0–4 (minimal) | 30 (159) |
| 5–9 (mild) | 23 (120) | |
| 10–14 (moderate) | 16 (85) | |
| 15–19 (moderately severe) | 14 (72) | |
| 20–24 (severe) | 9 (47) | |
| Missing | 9 (46) | |
| Smoking | Smoker | 35 (185) |
| Used to smoke | 31 (166) | |
| Never smoked | 32 (171) | |
| Missing | 1 (7) | |
| Consumption of fruit and vegetables | ≥5 portions per day | 17 (91) |
| ≤4 portions per day | 82 (433) | |
| Missing | 1 (5) | |
| Fatigue | 0 (none) | 13 (71) |
| 1–10 (slight to moderate) | 68 (359) | |
| 11–20 (severe) | 14 (73) | |
| Missing | 5 (26) | |
| Variable | % (n) | Minutes per Day | Minutes per Week | ||
|---|---|---|---|---|---|
| Mean (SD) | Median (IQR) | Mean (SD) | Median (IQR) | ||
| Time spent in vigorous PA | 97 (515) | 12 (25) | 0 (0, 21) | 85 (176) | 0 (0, 105) |
| Time spent in moderate PA, inc. walking | 95 (501) | 58 (68) | 39 (17, 72) | 403 (477) | 270 (120, 510) |
| Time spent in moderate PA, exc. walking | 96 (510) | 28 (44) | 15 (4, 34) | 197 (306) | 105 (30, 240) |
| Time spent walking | 97 (515) | 31 (52) | 18 (9, 39) | 216 (361) | 125 (60, 270) |
| Time spent in SB | 90 (478) | 388 (254) | 360 (180, 600) | ||
| Time spent in bed per night | 91 (483) | 522 (138) | 510 (450, 600) | ||
| Active ≥150 min/week, including walking | 76 (400) | ||||
| Active ≥150 min/week, excluding walking | 57 (304) | ||||
| Active <30 min/week, including walking | 5 (29) | ||||
| Active <30 min/week, excluding walking | 18 (96) | ||||
| Sedentary ≥540 min/day | 26 (136) | ||||
| Muscle strengthening sessions | |||||
| 0 per week | 58 (309) | ||||
| 1 per week | 10 (52) | ||||
| ≥2 per week | 28 (147) | ||||
| Missing | 4 (21) | ||||
| Variable | Active ≥ 150 min/week inc. Walking a | Active ≥ 150 min/week exc. Walking b | MSA ≥ 2 sessions/week c | ||||||
|---|---|---|---|---|---|---|---|---|---|
| % (n) | Unadjusted d OR (95% CI) | Adjusted e OR (95% CI) | % (n) | Unadjusted d OR (95% CI) | Adjusted e OR (95% CI) | % (n) | Unadjusted d OR (95% CI) | Adjusted e OR (95% CI) | |
| Gender | |||||||||
| Female | 78 (159/203) | 57 (115/203) | 22 (45/203) | ||||||
| Male | 79 (237/301) | 1.02 (0.66–1.58) | 1.22 (0.70–2.13) | 62 (186/300) | 1.25 (0.87–1.79) | 1.41 (0.88–2.25) | 33 (97/297) | 1.70 (1.13–2.57) | 1.33 (0.79–2.23) |
| Ethnicity | |||||||||
| White | 78 (312/401) | 60 (241/402) | 29 (117/400) | ||||||
| Other than white | 83 (60/72) | 1.43 (0.73–2.77) | 1.04 (0.46–2.33) | 61 (43/71) | 1.03 (0.61–1.72) | 0.87 (0.45–1.69) | 31 (22/72) | 1.06 (0.62–1.84) | 0.91 (0.45–1.83) |
| Consumption of fruit and vegetables | |||||||||
| ≤4 portions per day | 77 (323/420) | 58 (243/421) | 29 (119/416) | ||||||
| ≥5 portions per day | 85 (74/87) | 1.71 (0.91–3.21) | 2.24 (0.97–5.18) | 69 (59/86) | 1.60 (0.98–2.63) | 1.92 (1.02–3.62) | 30 (27/89) | 1.09 (0.66–1.79) | 1.19 (0.64–2.23) |
| Age (years) | |||||||||
| 18–34 | 86 (70/81) | 65 (53/81) | 39 (31/80) | ||||||
| 35–64 | 77 (275/358) | 0.52 (0.26–1.03) | 0.73 (0.32–1.68) | 59 (208/355) | 0.75 (0.45–1.24) | 0.76 (0.40–1.44) | 28 (99/354) | 0.61 (0.37–1.02) | 0.54 (0.29–1.00) |
| ≥65 | 73 (47/64) | 0.43 (0.19–1.01) | 0.55 (0.19–1.56) | 55 (36/65) | 0.66 (0.34–1.28) | 0.98 (0.41–2.32) | 21 (14/66) | 0.43 (0.20–0.89) | 0.27 (0.11–0.69) |
| Employment | |||||||||
| Professionally active | 90 (86/96) | 74 (72/97) | 37 (35/95) | ||||||
| Not professionally active | 76 (261/345) | 0.36 (0.18–0.73) | 0.39 (0.18–0.89) | 57 (196/345) | 0.46 (0.28–0.75) | 0.49 (0.27–0.88) | 29 (99/346) | 0.69 (0.43–1.11) | 1.08 (0.60–1.92) |
| Other | 80 (16/20) | 0.47 (0.13–0.67) | 0.65 (0.12–3.63) | 55 (11/20) | 0.42 (0.16–1.14) | 0.34 (0.10–1.14) | 11 (2/19) | 0.20 (0.04–0.93) | 0.31 (0.06–1.61) |
| BMI (kg/m2) | |||||||||
| <25 | 85 (77/91) | 66 (61/93) | 33 (30/91) | ||||||
| 25–29.9 | 83 (95/115) | 0.86 (0.41–1.82) | 0.96 (0.41–2.23) | 64 (73/114) | 0.93 (0.53–1.66) | 0.97 (0.51–1.87) | 36 (43/118) | 1.17 (0.66–2.07) | 1.21 (0.62–2.36) |
| ≥30 | 73 (158/217) | 0.49 (0.26–0.93) | 0.51 (0.25–1.02) | 56 (122/216) | 0.68 (0.41–1.13) | 0.71 (0.40–1.25) | 26 (55/213) | 0.71 (0.41–1.21) | 0.66 (0.36–1.21) |
| Smoking | |||||||||
| Never smoked | 85 (140/165) | 63 (104/164) | 33 (53/161) | ||||||
| Previous smoker | 76 (123/162) | 0.56 (0.32–0.98) | 0.70 (0.36–1.37) | 57 (93/163) | 0.77 (0.49–1.19) | 0.69 (0.40–1.19) | 26 (42/160) | 0.73 (0.45–1.17) | 0.85 (0.48–1.52) |
| Current smoker | 74 (132/179) | 0.50 (0.29–0.86) | 0.52 (0.26–1.03) | 58 (103/177) | 0.80 (0.52–1.24) | 0.82 (0.47–1.43) | 27 (49/181) | 0.76 (0.48–1.20) | 0.63 (0.35–1.15) |
| Fatigue score | |||||||||
| 0 (none) | 86 (60/70) | 58 (40/69) | 30 (20/67) | ||||||
| 1–10 (slight to moderate) | 79 (277/350) | 0.63 (0.31–1.30) | 0.84 (0.35–2.01) | 61 (215/350) | 1.15 (0.68–1.95) | 1.53 (0.78–2.99) | 30 (104/346) | 1.01 (0.57–1.79) | 1.50 (0.73–3.10) |
| 11–20 (severe) | 67 (45/67) | 0.34 (0.15–0.79) | 0.56 (0.19–1.63) | 49 (33/67) | 0.70 (0.36–1.38) | 1.62 (0.66–3.96) | 22 (16/72) | 0.67 (0.31–1.44) | 1.17 (0.45–3.04) |
| Self-rated mental health | |||||||||
| Excellent–good | 84 (162/194) | 65 (125/191) | 39 (74/191) | ||||||
| Moderate | 78 (126/162) | 0.69 (0.41–1.17) | 0.77 (0.40–1.50) | 60 (98/162) | 0.81 (0.52–1.25) | 0.61 (0.35–1.06) | 28 (45/160) | 0.62 (0.39–0.97) | 0.60 (0.34–1.05) |
| Poor–very poor | 72 (107/149) | 0.50 (0.30–0.85) | 0.63 (0.32–1.24) | 52 (78/151) | 0.56 (0.36–0.87) | 0.59 (0.33–1.05) | 18 (27/151) | 0.34 (0.21–0.57) | 0.35 (0.18–0.65) |
| PHQ-8 depression score | |||||||||
| 0–4 (minimal) | 85 (133/156) | 63 (99/156) | 35 (55/155) | ||||||
| 5–9 (mild) | 76 (90/118) | 0.56 (0.30–1.03) | 0.73 (0.33–1.65) | 64 (75/118) | 1.00 (0.61–1.65) | 1.39 (0.72–2.70) | 30 (35/117) | 0.78 (0.46–1.30) | 0.74 (0.37–1.48) |
| 10–14 (moderate) | 75 (60/80) | 0.52 (0.26–1.02) | 0.60 (0.24–1.51) | 56 (45/81) | 0.72 (0.42–1.24) | 0.87 (0.40–1.87) | 20 (16/82) | 0.44 (0.23–0.83) | 0.42 (0.18–1.03) |
| 15–19 (moderate/severe) | 80 (55/69) | 0.68 (0.33–1.42) | 0.79 (0.29–2.15) | 59 (40/68) | 0.82 (0.46–1.47) | 1.13 (0.49–2.60) | 26 (18/70) | 0.63 (0.34–1.18) | 0.61 (0.25–1.48) |
| 20–24 (severe) | 57 (25/44) | 0.23 (0.11–0.48) | 0.36 (0.13–1.06) | 40 (18/45) | 0.38 (0.19–0.76) | 0.66 (0.25–1.72) | 22 (10/46) | 0.44 (0.23–0.83) | 0.42 (0.18–1.03) |
| Gender | Age | Physical Activity Status | Mental Health Status | ||||||||
|---|---|---|---|---|---|---|---|---|---|---|---|
| Total | Male | Female | 18–34 | 35–64 | ≥65 | Active * | Inactive | Excellent–Good | Moderate | Poor–Very Poor | |
| % (n) | (n = 529) | (n = 212) | (n = 308) | (n = 81) | (n = 371) | (n = 67) | (n = 304) | (n = 206) | (n = 199) | (n = 166) | (n = 157) |
| I prefer activities that are … | |||||||||||
| Done on my own | 60 (318) | 54 (114) | 66 (202) | 65 (53) | 59 (218) | 60 (40) | 62 (189) | 59 (122) | 56 (111) | 66 (109) | 60 (94) |
| Done in a team or group | 33 (177) | 31 (66) | 36 (110) | 36 (29) | 35 (129) | 22 (15) | 37 (112) | 29 (60) | 45 (89) | 34 (57) | 20 (31) |
| Done in my own time, at my own pace | 74 (391) | 75 (159) | 74 (227) | 75 (61) | 74 (276) | 70 (47) | 72 (219) | 77 (159) | 70 (140) | 76 (126) | 76 (119) |
| Done at a specific time | 41 (219) | 39 (82) | 44 (135) | 48 (39) | 43 (160) | 25 (17) | 44 (134) | 39 (81) | 40 (80) | 45 (74) | 39 (62) |
| Done with people around my own age | 34 (179) | 28 (59) | 38 (118) | 37 (30) | 31 (116) | 39 (26) | 38 (115) | 30 (61) | 41 (82) | 36 (59) | 24 (37) |
| Done with people of my own gender | 24 (129) | 25 (53) | 23 (72) | 35 (28) | 23 (84) | 18 (12) | 25 (77) | 24 (49) | 24 (48) | 24 (40) | 25 (39) |
| Supervised by a qualified trainer | 35 (185) | 35 (74) | 36 (110) | 44 (36) | 35 (129) | 22 (15) | 32 (98) | 39 (81) | 41 (82) | 31 (52) | 31 (48) |
| Supervised by a health professional | 30 (159) | 30 (63) | 31 (96) | 28 (23) | 32 (119) | 18 (12) | 24 (74) | 37 (77) | 32 (64) | 31 (52) | 27 (42) |
| Done indoors | 50 (263) | 53 (112) | 48 (148) | 52 (42) | 51 (191) | 37 (25) | 49 (150) | 51 (105) | 49 (97) | 54 (90) | 46 (72) |
| Done outdoors | 54 (287) | 50 (106) | 58 (178) | 58 (47) | 52 (194) | 63 (42) | 55 (167) | 54 (112) | 56 (112) | 60 (99) | 45 (71) |
| Done at home | 47 (250) | 49 (103) | 46 (142) | 48 (39) | 48 (177) | 39 (26) | 47 (143) | 48 (98) | 47 (93) | 51 (84) | 45 (71) |
| Done close to home | 61 (322) | 64 (135) | 59 (181) | 63 (51) | 61 (227) | 57 (38) | 61 (186) | 63 (129) | 58 (116) | 67 (112) | 57 (90) |
| Low intensity (e.g., walking) | 76 (404) | 79 (167) | 76 (233) | 69 (56) | 78 (288) | 82 (55) | 76 (232) | 79 (162) | 78 (155) | 78 (130) | 74 (116) |
| High intensity (e.g., running, aerobics) | 28 (149) | 27 (58) | 29 (89) | 56 (45) | 24 (90) | 16 (11) | 38 (116) | 15 (30) | 34 (67) | 28 (46) | 23 (36) |
| Strength based (e.g., weight training) | 29 (153) | 25 (53) | 32 (98) | 51 (41) | 27 (102) | 10 (7) | 36 (110) | 19 (40) | 36 (72) | 27 (45) | 22 (35) |
| Sports | 29 (152) | 19 (41) | 36 (110) | 53 (43) | 27 (99) | 12 (8) | 36 (109) | 20 (41) | 39 (78) | 27 (44) | 18 (28) |
| Preferred sources of support: | |||||||||||
| Exercise instructor guiding me through each session | 34 (181) | 39 (82) | 31 (97) | 35 (28) | 35 (130) | 25 (17) | 32 (97) | 38 (79) | 40 (80) | 31 (51) | 31 (48) |
| Exercise instructor telling me how to exercise | 35 (183) | 37 (79) | 33 (102) | 40 (32) | 34 (127) | 27 (18) | 33 (101) | 37 (77) | 42 (83) | 34 (57) | 27 (43) |
| Support worker coming with me | 27 (142) | 23 (49) | 29 (90) | 27 (22) | 28 (105) | 18 (12) | 23 (70) | 33 (69) | 27 (54) | 27 (44) | 28 (44) |
| Psychologist or counsellor telling me to | 24 (126) | 18 (38) | 29 (88) | 27 (22) | 25 (94) | 12 (8) | 22 (68) | 25 (52) | 21 (42) | 23 (39) | 29 (45) |
| Social support (e.g., family/friends) a | 54 (201) | 53 (68) | 55 (132) | 71 (51) | 51 (130) | 43 (16) | 55 (118) | 53 (78) | 59 (84) | 50 (58) | 52 (59) |
| I prefer doing activity b: | |||||||||||
| Before 8 am | 10 (55) | 9 (20) | 11 (33) | 9 (7) | 11 (40) | 9 (6) | 13 (38) | 7 (14) | 13 (26) | 10 (17) | 8 (12) |
| 8–11 am | 32 (170) | 36 (77) | 30 (91) | 28 (23) | 32 (117) | 40 (27) | 34 (104) | 29 (59) | 29 (58) | 37 (61) | 31 (49) |
| 11 a.m.–2 p.m. | 40 (209) | 42 (90) | 38 (118) | 35 (28) | 40 (149) | 40 (27) | 41 (125) | 37 (76) | 41 (81) | 39 (65) | 37 (58) |
| 2–5 p.m. | 34 (182) | 33 (69) | 35 (109) | 30 (24) | 35 (129) | 40 (27) | 34 (104) | 34 (70) | 33 (65) | 36 (60) | 34 (53) |
| 5–8 p.m. | 21 (111) | 21 (45) | 20 (63) | 30 (24) | 22 (80) | 9 (6) | 22 (68) | 18 (38) | 20 (40) | 18 (30) | 25 (40) |
| No preference | 11 (57) | 8 (17) | 13 (39) | 11 (9) | 12 (44) | 6 (4) | 11 (34) | 10 (20) | 13 (26) | 8 (14) | 11 (17) |
| Gender | Age | Physical Activity Status | Mental Health Status | ||||||||
|---|---|---|---|---|---|---|---|---|---|---|---|
| Total | Male | Female | 18–34 | 35–64 | ≥65 | Active * | Inactive | Excellent–Good | Moderate | Poor–Very Poor | |
| % (n) | (n = 529) | (n = 212) | (n = 308) | (n = 81) | (n = 371) | (n = 67) | (n = 304) | (n = 206) | (n = 199) | (n = 166) | (n = 157) |
| Poor physical health | 50 (266) | 53 (112) | 48 (148) | 44 (36) | 51 (191) | 49 (33) | 41 (124) | 65 (133) | 37 (74) | 55 (91) | 63 (99) |
| Lack of money | 34 (180) | 40 (84) | 30 (93) | 36 (29) | 36 (135) | 18 (12) | 33 (100) | 35 (72) | 28 (56) | 37 (61) | 39 (61) |
| Poor mental health | 54 (285) | 56 (119) | 53 (162) | 52 (42) | 57 (212) | 37 (25) | 51 (156) | 59 (121) | 29 (58) | 59 (98) | 80 (125) |
| I can’t get motivated | 55 (290) | 58 (123) | 53 (164) | 62 (50) | 57 (211) | 37 (25) | 48 (145) | 67 (138) | 40 (80) | 57 (94) | 71 (111) |
| I don’t like the gym ‘scene’ | 48 (252) | 53 (112) | 44 (136) | 40 (32) | 49 (183) | 46 (31) | 41 (126) | 56 (116) | 38 (76) | 49 (82) | 59 (92) |
| Problems with transport | 30 (159) | 34 (72) | 27 (84) | 25 (20) | 32 (120) | 21 (14) | 28 (84) | 33 (68) | 24 (47) | 30 (50) | 39 (62) |
| I’m too shy or embarrassed | 31 (162) | 35 (75) | 27 (82) | 32 (26) | 32 (118) | 21 (14) | 29 (87) | 36 (74) | 19 (37) | 31 (52) | 46 (73) |
| I can’t get organised | 28 (146) | 25 (54) | 29 (90) | 27 (22) | 29 (108) | 19 (13) | 24 (74) | 33 (69) | 19 (37) | 31 (51) | 36 (56) |
| My weight | 36 (189) | 45 (96) | 30 (91) | 26 (21) | 39 (143) | 31 (21) | 29 (88) | 46 (95) | 25 (50) | 37 (62) | 48 (75) |
| I’m too tired | 50 (266) | 55 (116) | 48 (147) | 51 (41) | 52 (193) | 42 (28) | 45 (138) | 58 (119) | 36 (72) | 50 (83) | 69 (108) |
| Medication side-effects | 43 (230) | 43 (91) | 44 (136) | 41 (33) | 47 (175) | 28 (19) | 39 (119) | 50 (102) | 31 (62) | 39 (65) | 64 (100) |
| I have an injury | 30 (159) | 28 (60) | 31 (95) | 27 (22) | 30 (113) | 33 (22) | 32 (98) | 26 (53) | 27 (54) | 30 (50) | 34 (54) |
| I don’t have the right clothes/shoes | 18 (94) | 18 (39) | 17 (51) | 15 (12) | 19 (72) | 12 (8) | 16 (49) | 19 (39) | 16 (31) | 14 (23) | 25 (40) |
| I’m not sure what to do | 24 (128) | 25 (53) | 23 (72) | 22 (18) | 26 (98) | 15 (10) | 20 (60) | 31 (64) | 20 (40) | 22 (36) | 33 (52) |
| Facilities are too far away | 26 (136) | 30 (64) | 22 (69) | 21 (17) | 27 (99) | 24 (16) | 24 (72) | 30 (61) | 23 (46) | 21 (35) | 34 (54) |
| Exercise makes me exhausted | 37 (198) | 37 (78) | 38 (117) | 32 (26) | 39 (144) | 37 (25) | 27 (83) | 52 (107) | 28 (56) | 39 (64) | 49 (77) |
| Lack of skill | 23 (122) | 24 (50) | 22 (69) | 23 (19) | 25 (91) | 12 (8) | 21 (63) | 27 (56) | 17 (33) | 23 (39) | 31 (49) |
| My age | 22 (115) | 20 (43) | 23 (70) | 2 (2) | 25 (91) | 28 (19) | 19 (59) | 26 (53) | 18 (36) | 20 (34) | 28 (44) |
| Social demands | 16 (86) | 18 (39) | 15 (46) | 17 (14) | 18 (65) | 7 (5) | 16 (48) | 18 (37) | 13 (26) | 14 (24) | 22 (35) |
| I’m afraid of getting injured | 20 (106) | 17 (37) | 22 (67) | 12 (10) | 22 (81) | 18 (12) | 16 (49) | 26 (53) | 18 (36) | 17 (29) | 26 (41) |
| Lack of time | 20 (104) | 23 (48) | 18 (55) | 31 (25) | 18 (68) | 13 (9) | 18 (56) | 23 (47) | 19 (37) | 22 (37) | 19 (30) |
| I do not enjoy PA | 26 (135) | 26 (56) | 25 (76) | 19 (15) | 27 (100) | 25 (17) | 16 (50) | 39 (81) | 18 (35) | 25 (42) | 35 (55) |
| Mental health service takes up too much of my time | 12 (64) | 8 (18) | 15 (46) | 10 (8) | 14 (52) | 3 (2) | 11 (33) | 14 (28) | 13 (26) | 8 (14) | 15 (24) |
| Work demands | 13 (70) | 15 (31) | 12 (37) | 19 (15) | 13 (48) | 6 (4) | 15 (46) | 11 (23) | 13 (25) | 15 (25) | 13 (20) |
| Lack of access to childcare | 7 (35) | 8 (16) | 6 (19) | 9 (7) | 6 (24) | 3 (2) | 7 (20) | 7 (14) | 6 (11) | 5 (9) | 10 (15) |
| Asked in updated version of survey only: | |||||||||||
| I don’t have anyone to do PA with | 18 (93) | 15 (31) | 19 (59) | 25 (20) | 16 (61) | 13 (9) | 14 (42) | 23 (47) | 15 (30) | 17 (29) | 22 (34) |
| The thought of PA makes me worry | 15 (78) | 13 (28) | 16 (48) | 16 (13) | 15 (57) | 10 (7) | 11 (33) | 21 (44) | 8 (15) | 12 (20) | 27 (43) |
| I don’t think that PA will benefit me | 7 (37) | 5 (11) | 8 (26) | 7 (6) | 8 (29) | 1 (1) | 5 (15) | 11 (22) | 7 (14) | 6 (10) | 8 (13) |
| My close contacts don’t support or encourage my PA | 7 (39) | 6 (12) | 9 (27) | 12 (10) | 7 (27) | 3 (2) | 6 (18) | 10 (21) | 6 (12) | 8 (13) | 9 (14) |
| I get easily distracted from the PA I have planned | 18 (95) | 17 (37) | 19 (57) | 27 (22) | 17 (64) | 12 (8) | 15 (46) | 22 (46) | 12 (23) | 20 (34) | 24 (37) |
| I don’t make plans for doing PA | 24 (125) | 20 (42) | 27 (82) | 28 (23) | 24 (90) | 15 (10) | 13 (38) | 39 (81) | 16 (32) | 25 (42) | 32 (50) |
| I don’t think PA is important | 8 (41) | 5 (10) | 10 (31) | 7 (6) | 9 (32) | 3 (2) | 7 (20) | 9 (18) | 8 (15) | 8 (13) | 8 (12) |
| PA is not something I do automatically | 25 (133) | 24 (50) | 27 (82) | 28 (23) | 26 (96) | 18 (12) | 18 (54) | 36 (74) | 20 (40) | 24 (40) | 33 (52) |
| Fear of judgement/stigma because of mental (or physical) health problems | 20 (104) | 16 (34) | 22 (69) | 23 (19) | 21 (77) | 10 (7) | 17 (53) | 24 (50) | 12 (24) | 17 (28) | 33 (52) |
| Gender | Age | Physical Activity Status | Mental Health Status | ||||||||
|---|---|---|---|---|---|---|---|---|---|---|---|
| Total | Male | Female | 18–34 | 35–64 | >65 | Active * | Inactive | Excellent–Good | Moderate | Poor–Very Poor | |
| % (n) | (n = 529) | (n = 212) | (n = 308) | (n = 81) | (n = 371) | (n = 67) | (n = 273) | (n = 229) | (n = 199) | (n = 166) | (n = 157) |
| To improve my mental health | 84 (443) | 84 (179) | 83 (257) | 88 (71) | 84 (313) | 76 (51) | 88 (241) | 79 (180) | 82 (164) | 84 (140) | 85 (133) |
| To get stronger and fitter | 81 (431) | 81 (171) | 82 (252) | 88 (71) | 81 (300) | 78 (52) | 86 (236) | 77 (176) | 84 (168) | 78 (130) | 82 (128) |
| To get out of the house | 79 (420) | 79 (168) | 81 (250) | 79 (64) | 80 (295) | 81 (54) | 83 (227) | 76 (175) | 85 (169) | 80 (132) | 73 (115) |
| To have more energy | 77 (408) | 78 (165) | 77 (238) | 86 (70) | 77 (287) | 67 (45) | 81 (220) | 73 (167) | 78 (155) | 77 (128) | 77 (121) |
| To cope with life stresses better | 74 (394) | 76 (161) | 75 (230) | 79 (64) | 76 (281) | 66 (44) | 81 (221) | 67 (154) | 79 (157) | 75 (124) | 69 (109) |
| To improve my posture | 62 (328) | 60 (127) | 64 (196) | 65 (53) | 63 (232) | 57 (38) | 64 (176) | 61 (139) | 68 (135) | 59 (98) | 58 (91) |
| To relax | 70 (369) | 68 (145) | 72 (221) | 67 (54) | 72 (268) | 63 (42) | 73 (200) | 66 (152) | 77 (153) | 69 (115) | 61 (96) |
| To balance other things I do (e.g., smoking) | 52 (274) | 52 (110) | 52 (159) | 58 (47) | 54 (199) | 33 (22) | 55 (151) | 47 (108) | 53 (105) | 50 (83) | 54 (84) |
| To prevent sickness and illness | 65 (344) | 58 (123) | 70 (215) | 65 (53) | 65 (241) | 66 (44) | 69 (188) | 62 (143) | 71 (142) | 63 (105) | 60 (94) |
| To lose weight | 71 (373) | 73 (155) | 68 (210) | 81 (66) | 71 (264) | 55 (37) | 72 (196) | 71 (163) | 75 (150) | 69 (115) | 67 (105) |
| To improve how I look | 64 (336) | 62 (132) | 64 (198) | 81 (66) | 63 (233) | 45 (30) | 64 (176) | 65 (148) | 70 (140) | 58 (97) | 61 (95) |
| To help me sleep | 65 (342) | 62 (131) | 68 (208) | 78 (63) | 64 (237) | 55 (37) | 70 (190) | 59 (134) | 69 (137) | 61 (102) | 64 (100) |
| To make new friends | 50 (264) | 48 (101) | 52 (160) | 53 (43) | 49 (181) | 55 (37) | 55 (150) | 44 (101) | 61 (122) | 46 (76) | 41 (64) |
| To recover from illness/injury | 46 (243) | 41 (87) | 49 (152) | 58 (47) | 44 (165) | 43 (29) | 48 (130) | 44 (100) | 49 (98) | 43 (71) | 45 (70) |
| To spend time with others (family, friends, partner) | 54 (285) | 53 (113) | 56 (171) | 60 (49) | 53 (197) | 54 (36) | 57 (155) | 50 (114) | 62 (123) | 49 (82) | 49 (77) |
| To counteract the side-effects of medications | 45 (239) | 42 (89) | 47 (146) | 52 (42) | 45 (168) | 37 (25) | 45 (123) | 44 (101) | 47 (94) | 43 (71) | 46 (72) |
Disclaimer/Publisher’s Note: The statements, opinions and data contained in all publications are solely those of the individual author(s) and contributor(s) and not of MDPI and/or the editor(s). MDPI and/or the editor(s) disclaim responsibility for any injury to people or property resulting from any ideas, methods, instructions or products referred to in the content. |
© 2023 by the authors. Licensee MDPI, Basel, Switzerland. This article is an open access article distributed under the terms and conditions of the Creative Commons Attribution (CC BY) license (https://creativecommons.org/licenses/by/4.0/).
Share and Cite
Tew, G.A.; Bailey, L.; Beeken, R.J.; Cooper, C.; Copeland, R.; Brady, S.; Heron, P.; Hill, A.; Lee, E.; Spanakis, P.; et al. Physical Activity in Adults with Schizophrenia and Bipolar Disorder: A Large Cross-Sectional Survey Exploring Patterns, Preferences, Barriers, and Motivating Factors. Int. J. Environ. Res. Public Health 2023, 20, 2548. https://doi.org/10.3390/ijerph20032548
Tew GA, Bailey L, Beeken RJ, Cooper C, Copeland R, Brady S, Heron P, Hill A, Lee E, Spanakis P, et al. Physical Activity in Adults with Schizophrenia and Bipolar Disorder: A Large Cross-Sectional Survey Exploring Patterns, Preferences, Barriers, and Motivating Factors. International Journal of Environmental Research and Public Health. 2023; 20(3):2548. https://doi.org/10.3390/ijerph20032548
Chicago/Turabian StyleTew, Garry A., Laura Bailey, Rebecca J. Beeken, Cindy Cooper, Robert Copeland, Samantha Brady, Paul Heron, Andrew Hill, Ellen Lee, Panagiotis Spanakis, and et al. 2023. "Physical Activity in Adults with Schizophrenia and Bipolar Disorder: A Large Cross-Sectional Survey Exploring Patterns, Preferences, Barriers, and Motivating Factors" International Journal of Environmental Research and Public Health 20, no. 3: 2548. https://doi.org/10.3390/ijerph20032548