
Evaluation of Pollution Level, Spatial Distribution, and Ecological Effects of Antimony in Soils of Mining Areas: A Review

Abstract
:
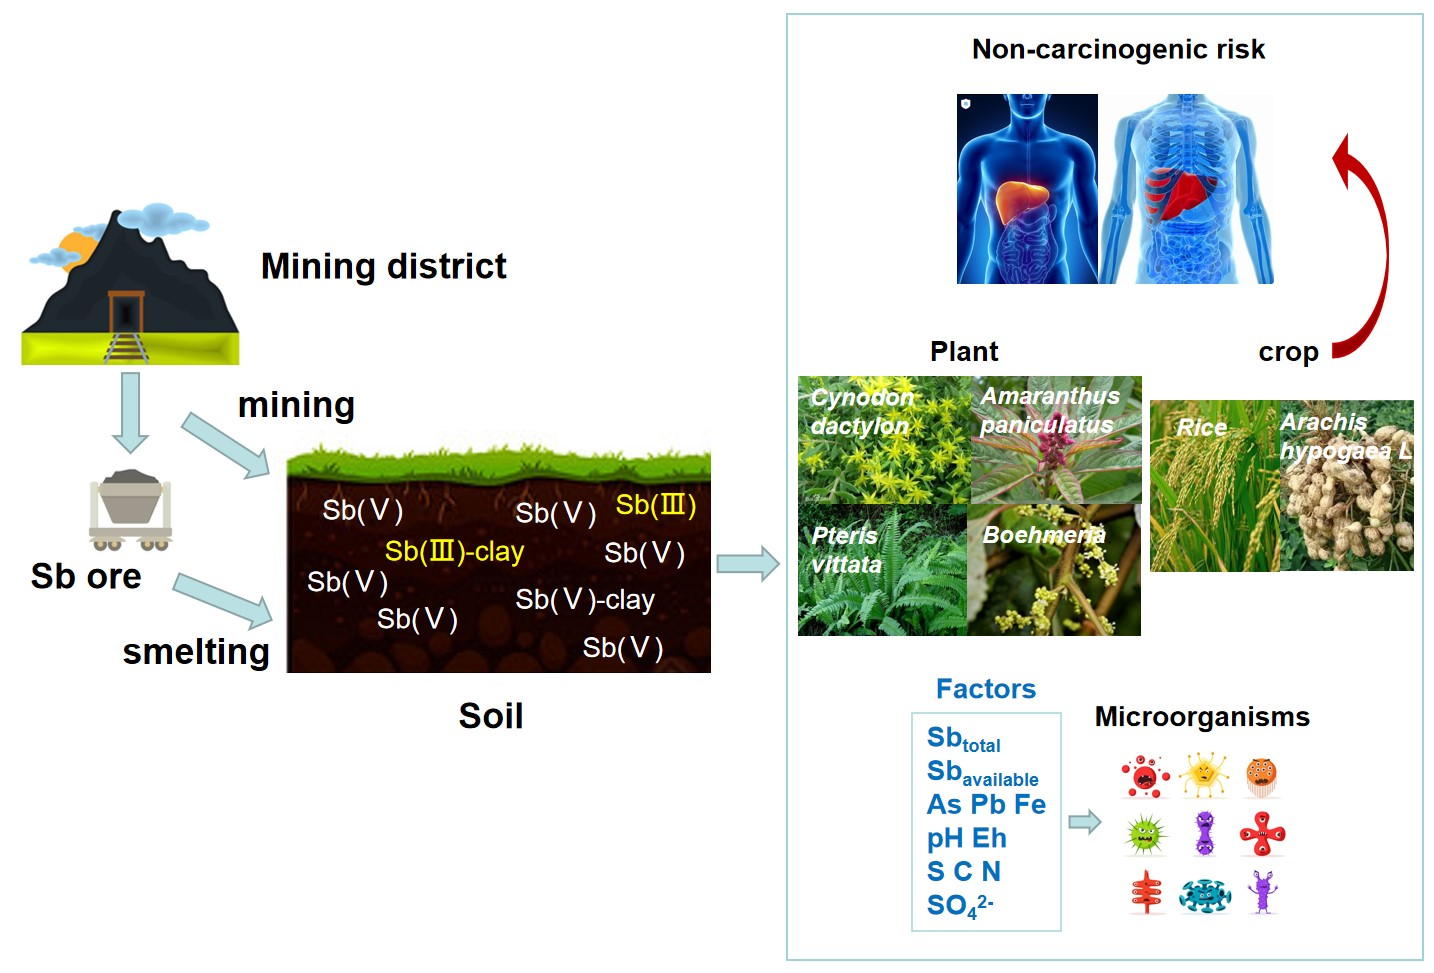
1. Introduction
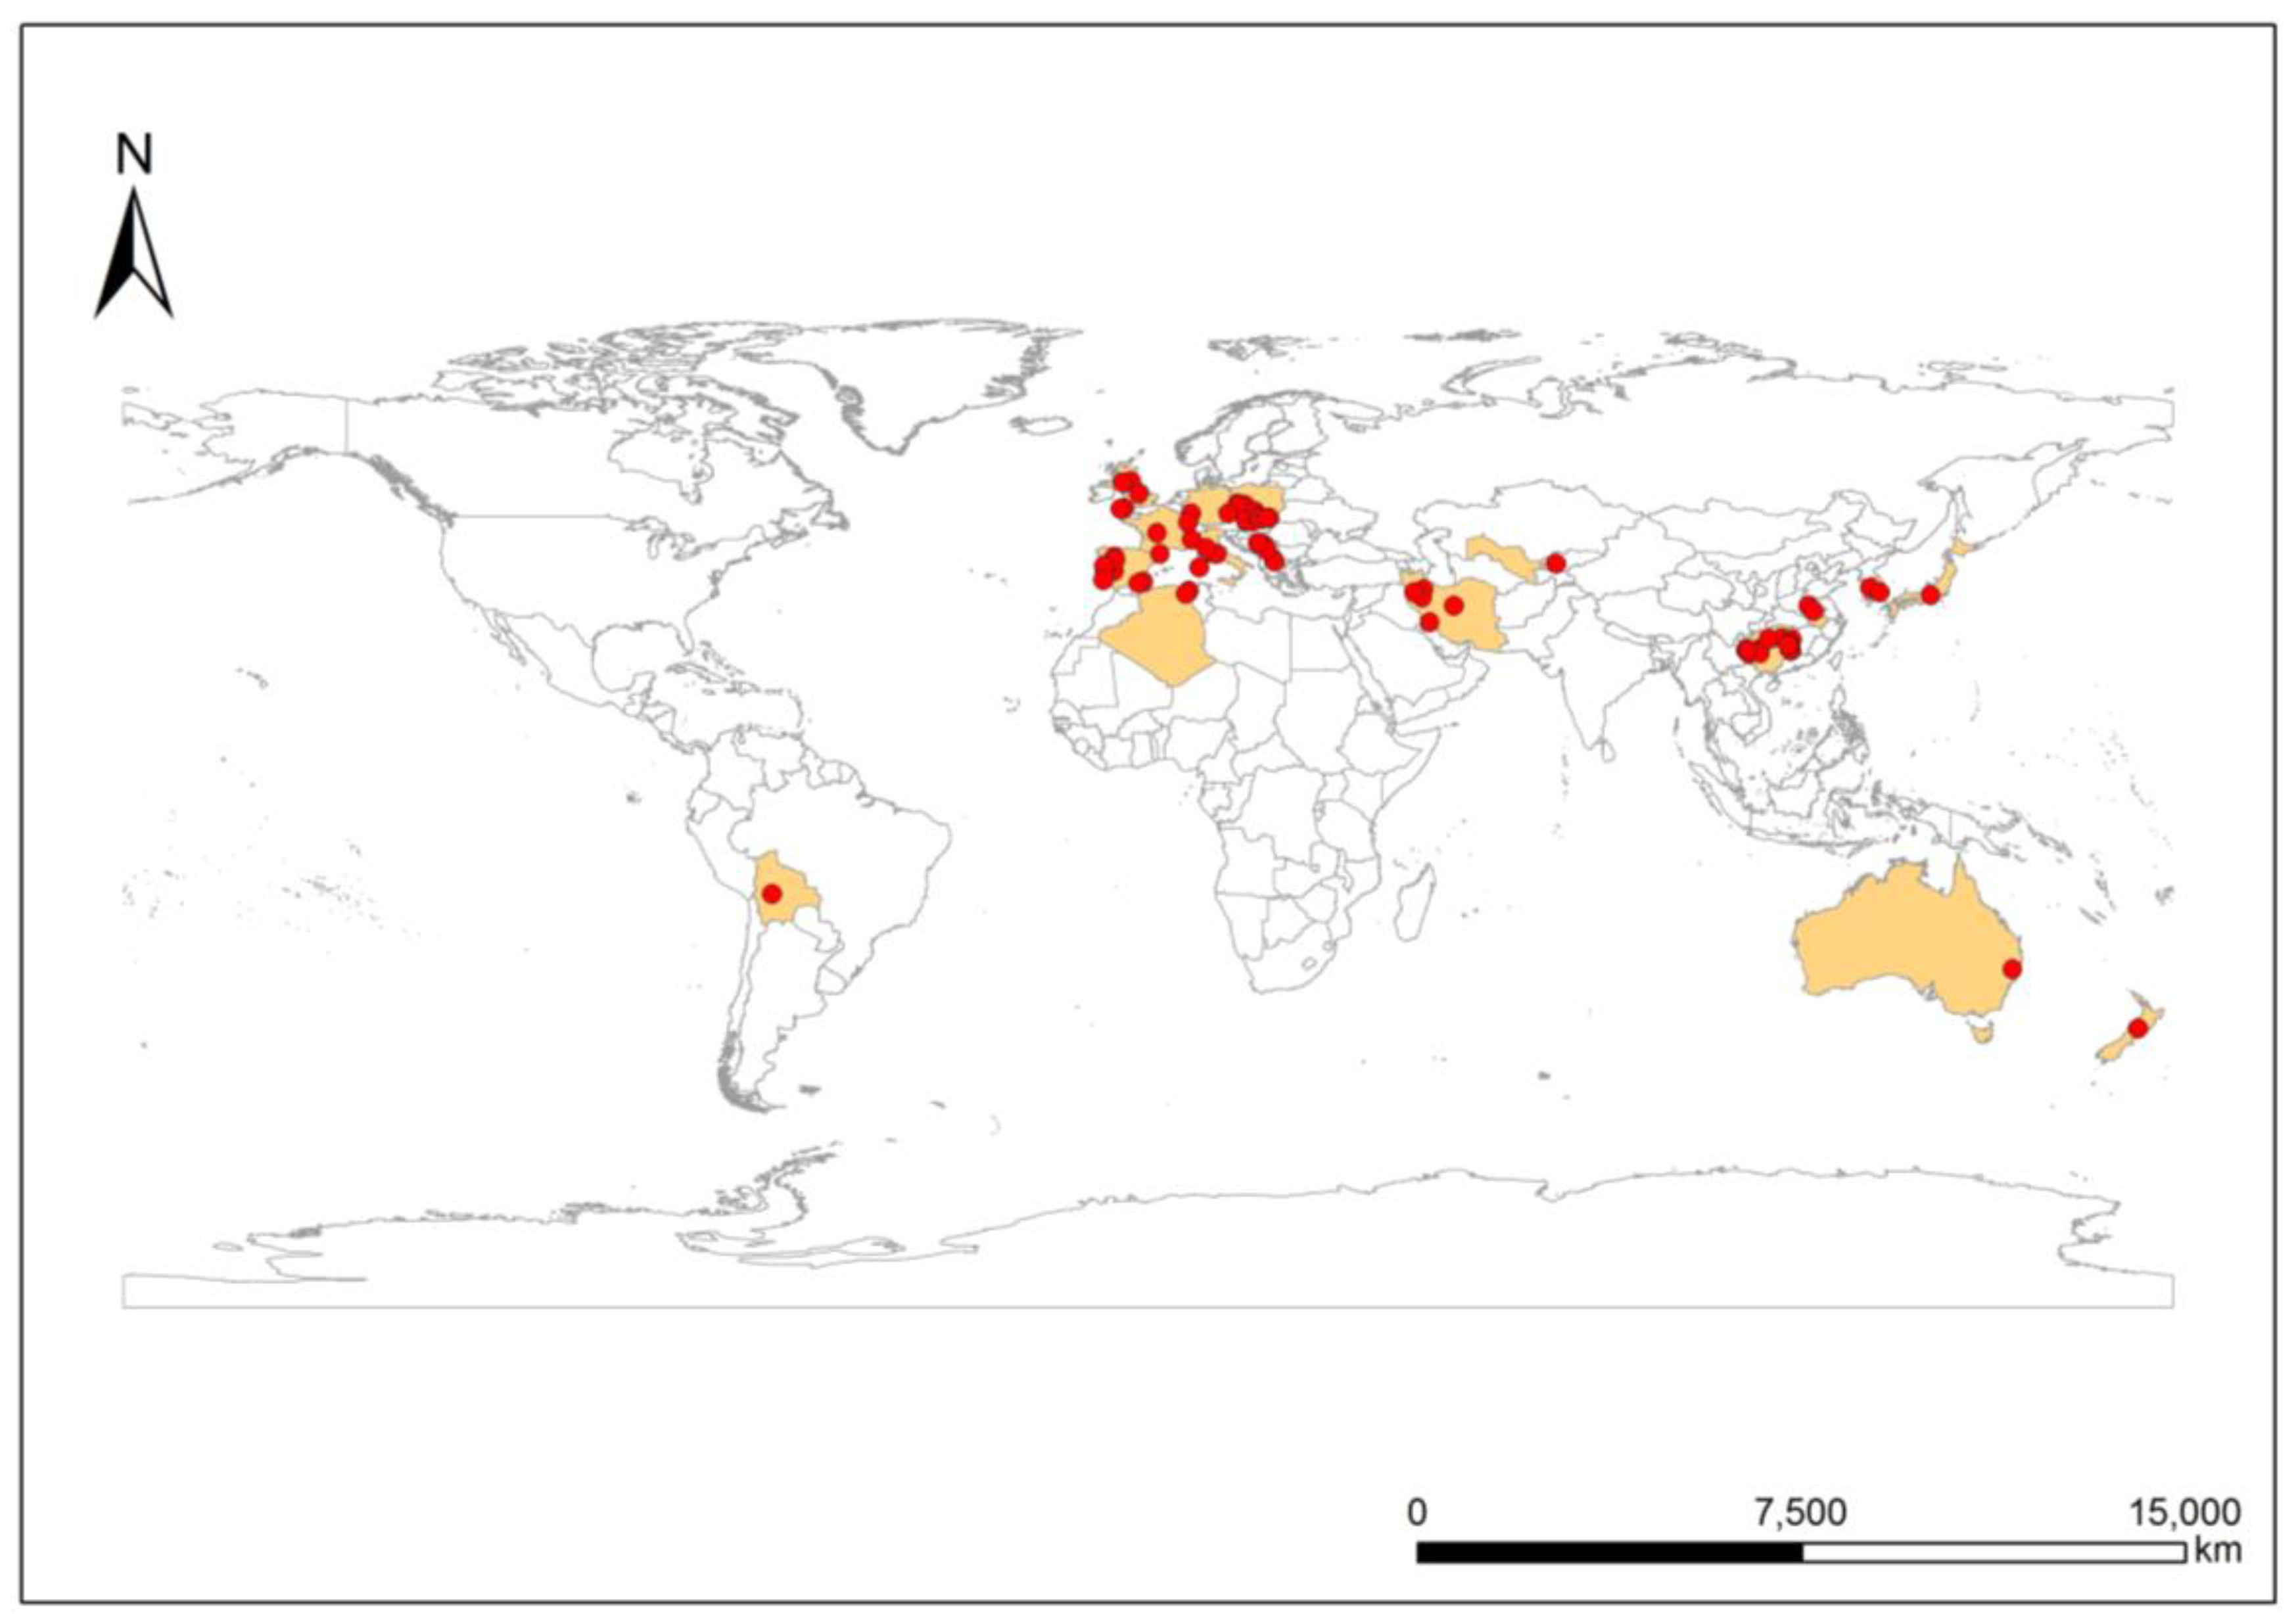
2. Data Sources and Collection
3. Results and Discussion
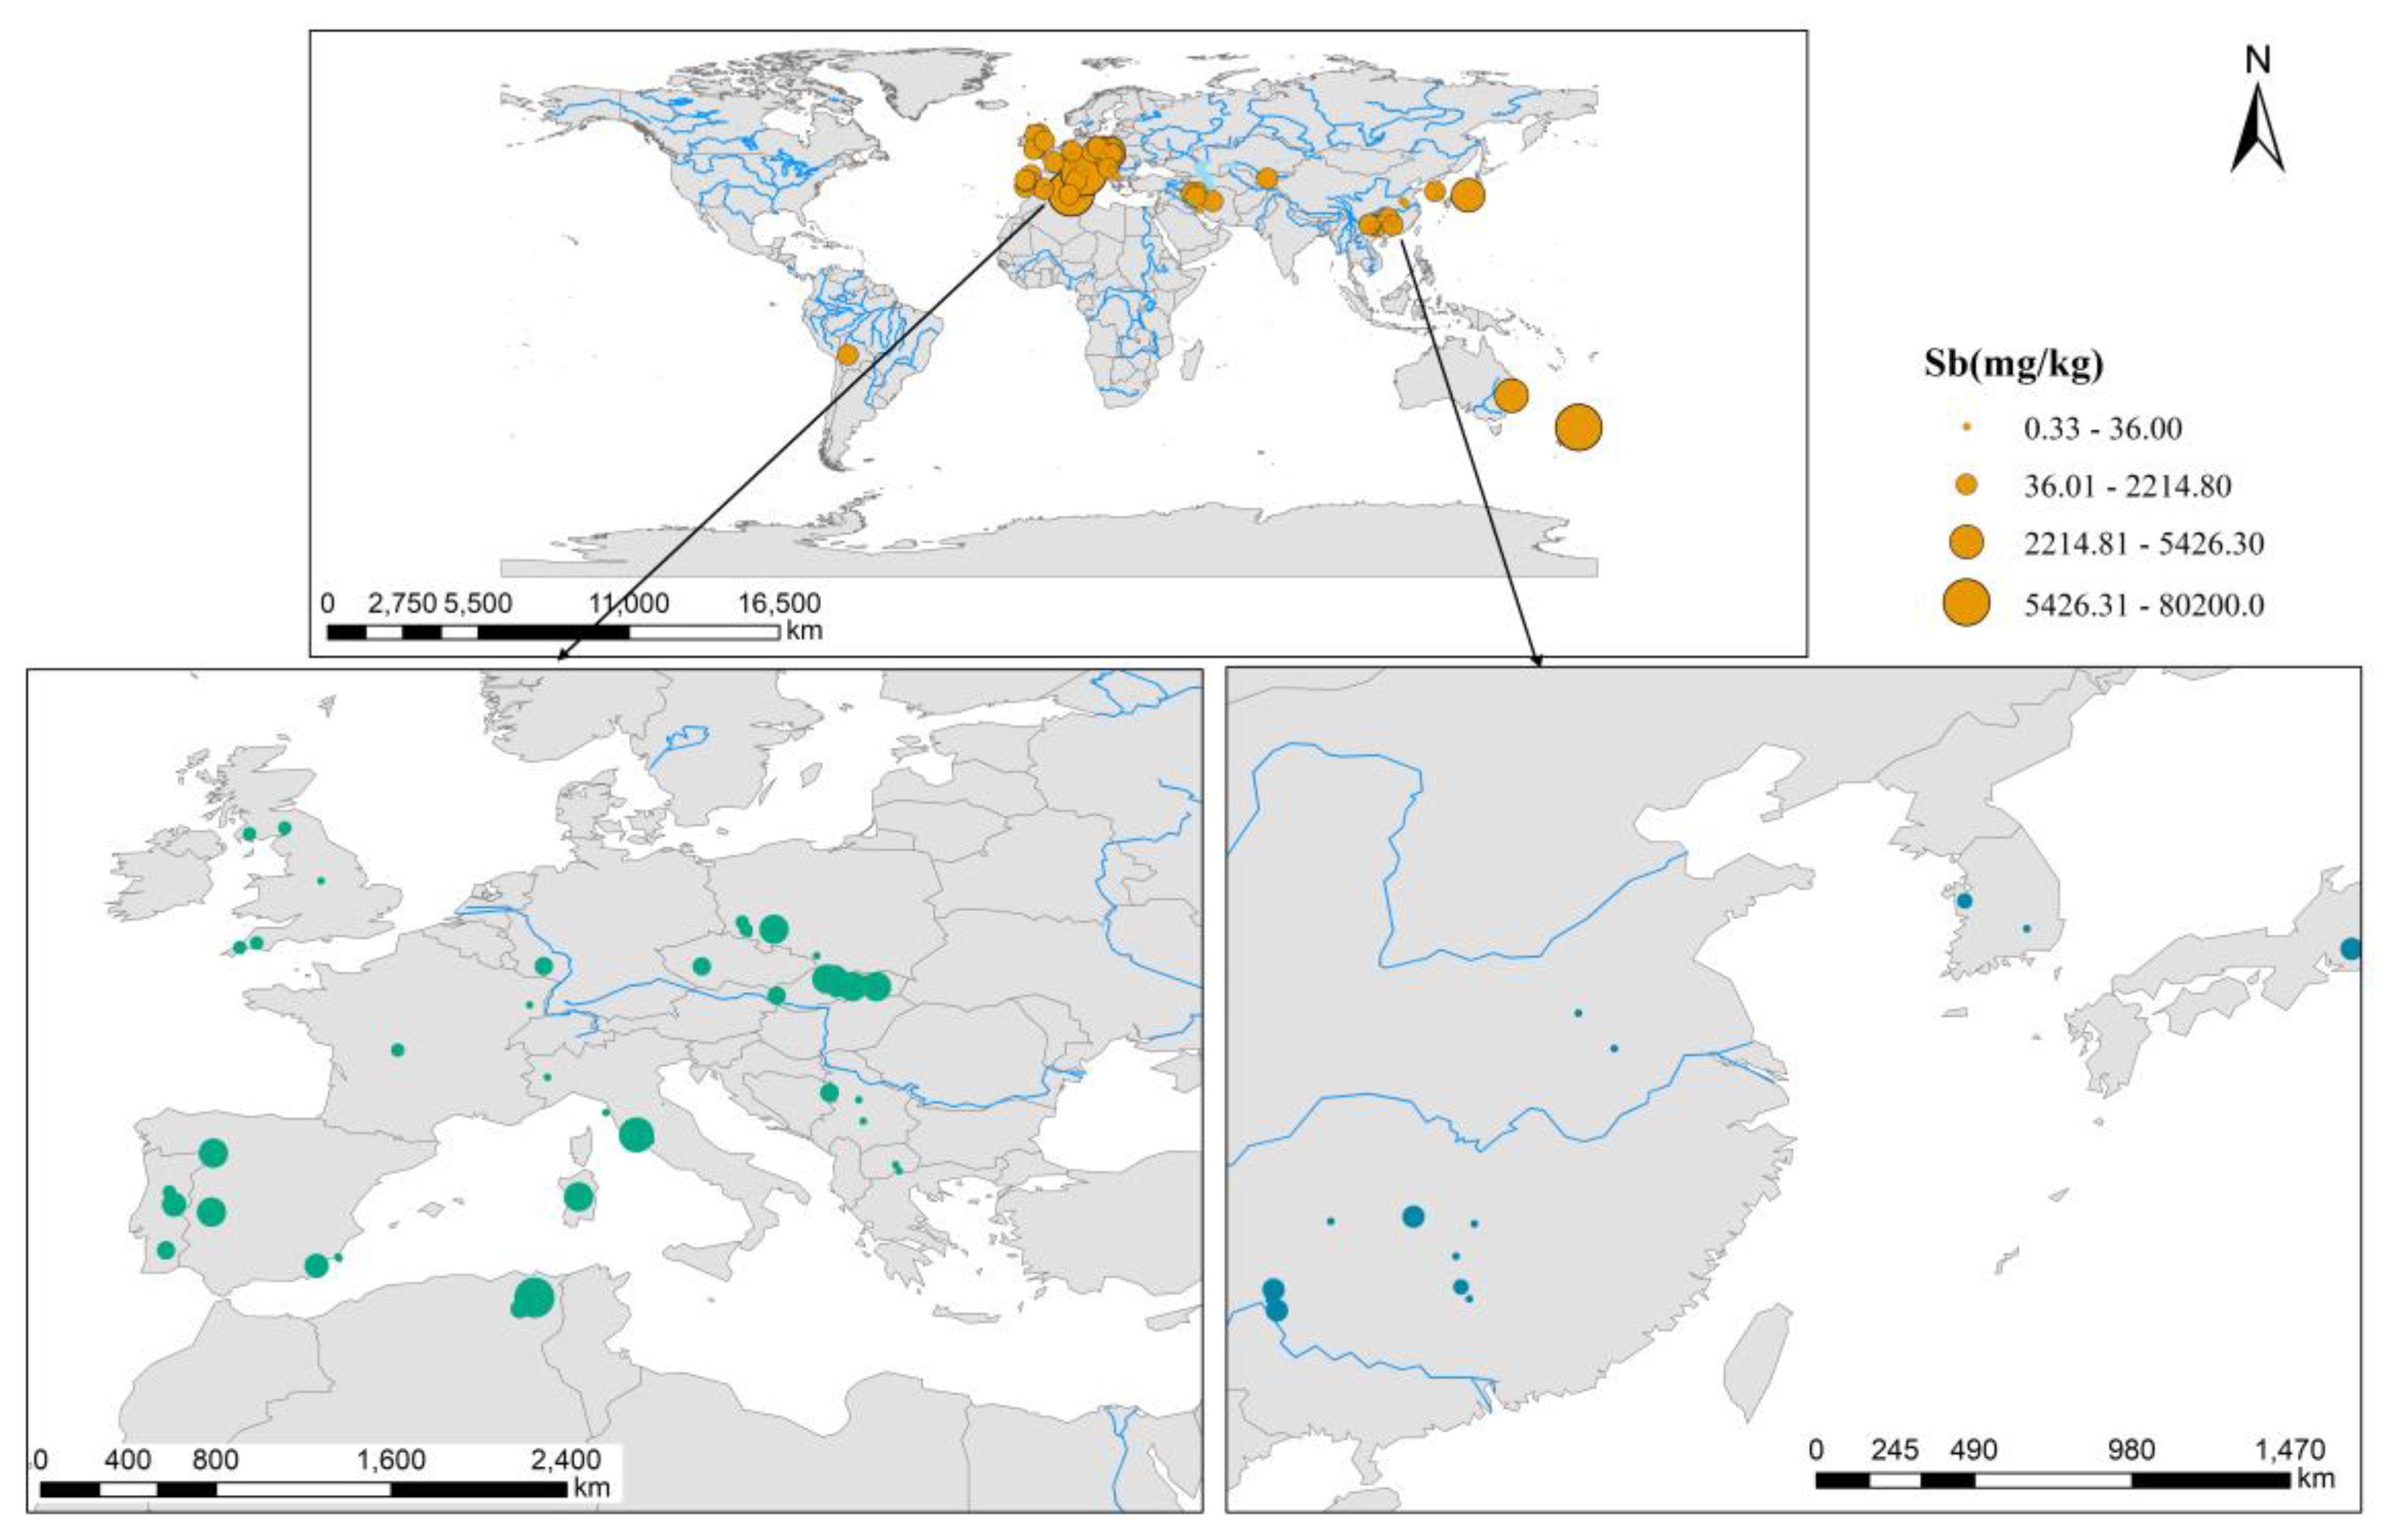
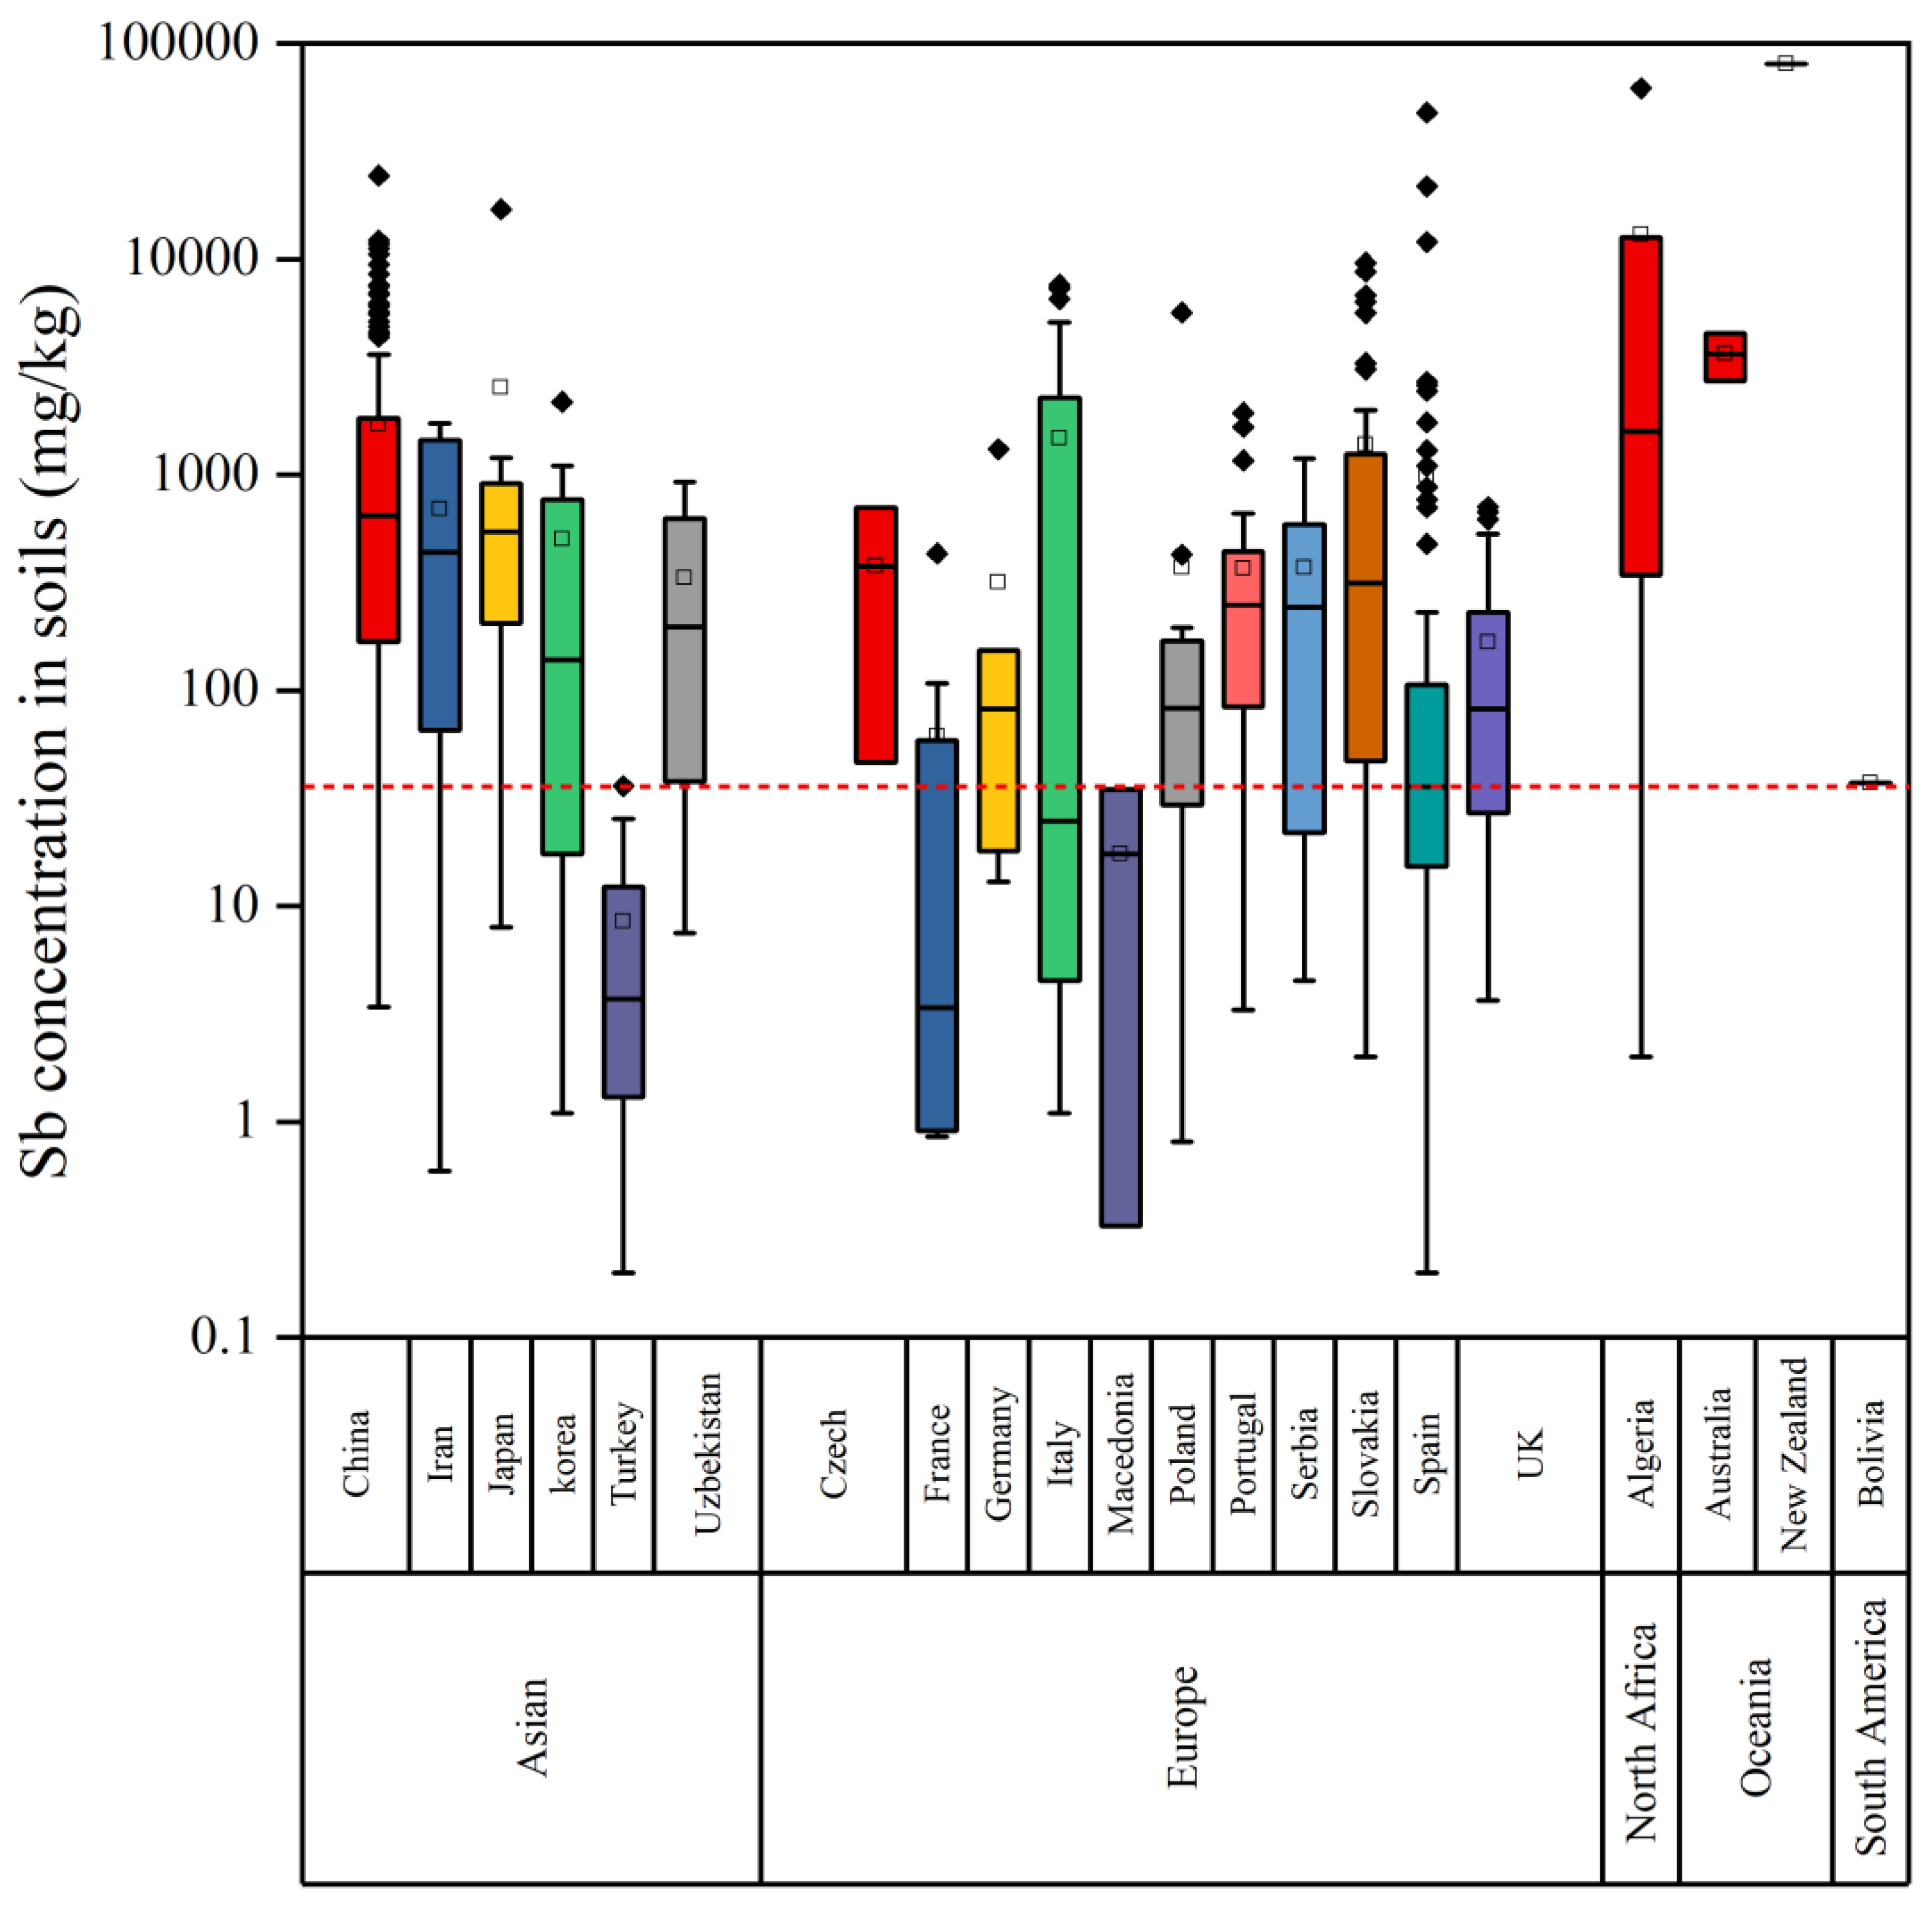
3.1. Geographical Variation and Pollution Levels
3.2. Chemical Speciation and Bioavailability
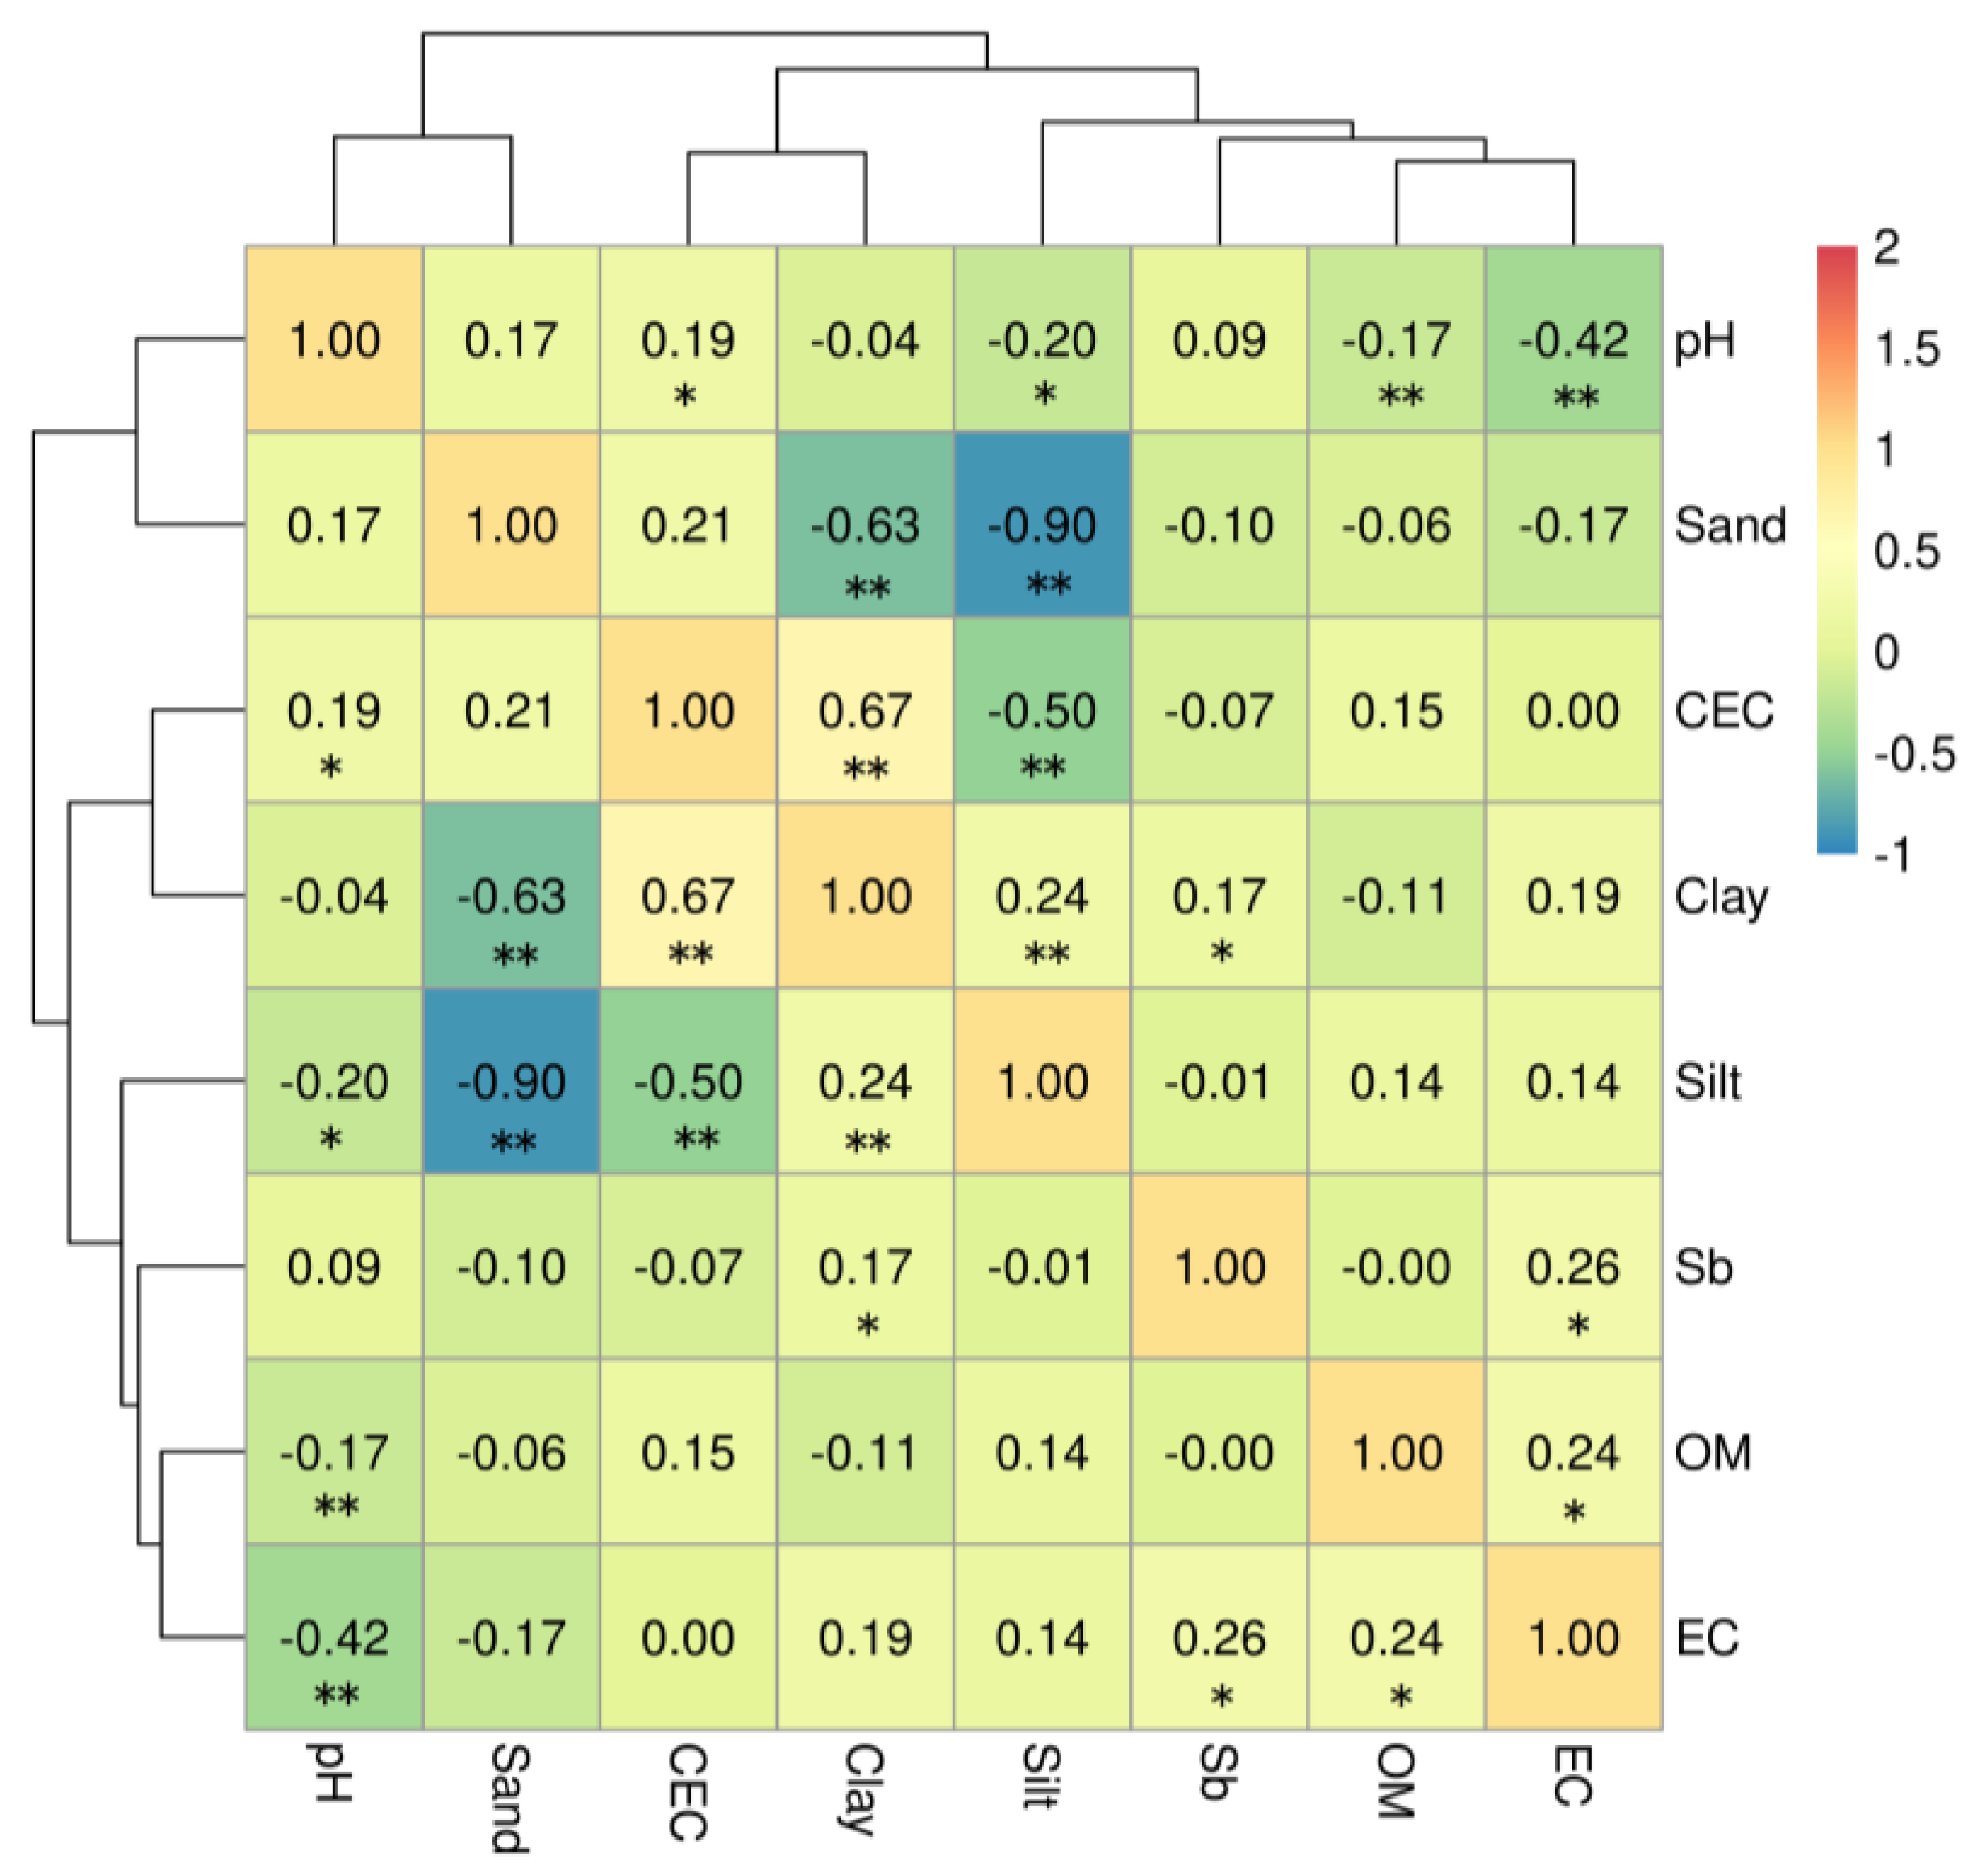
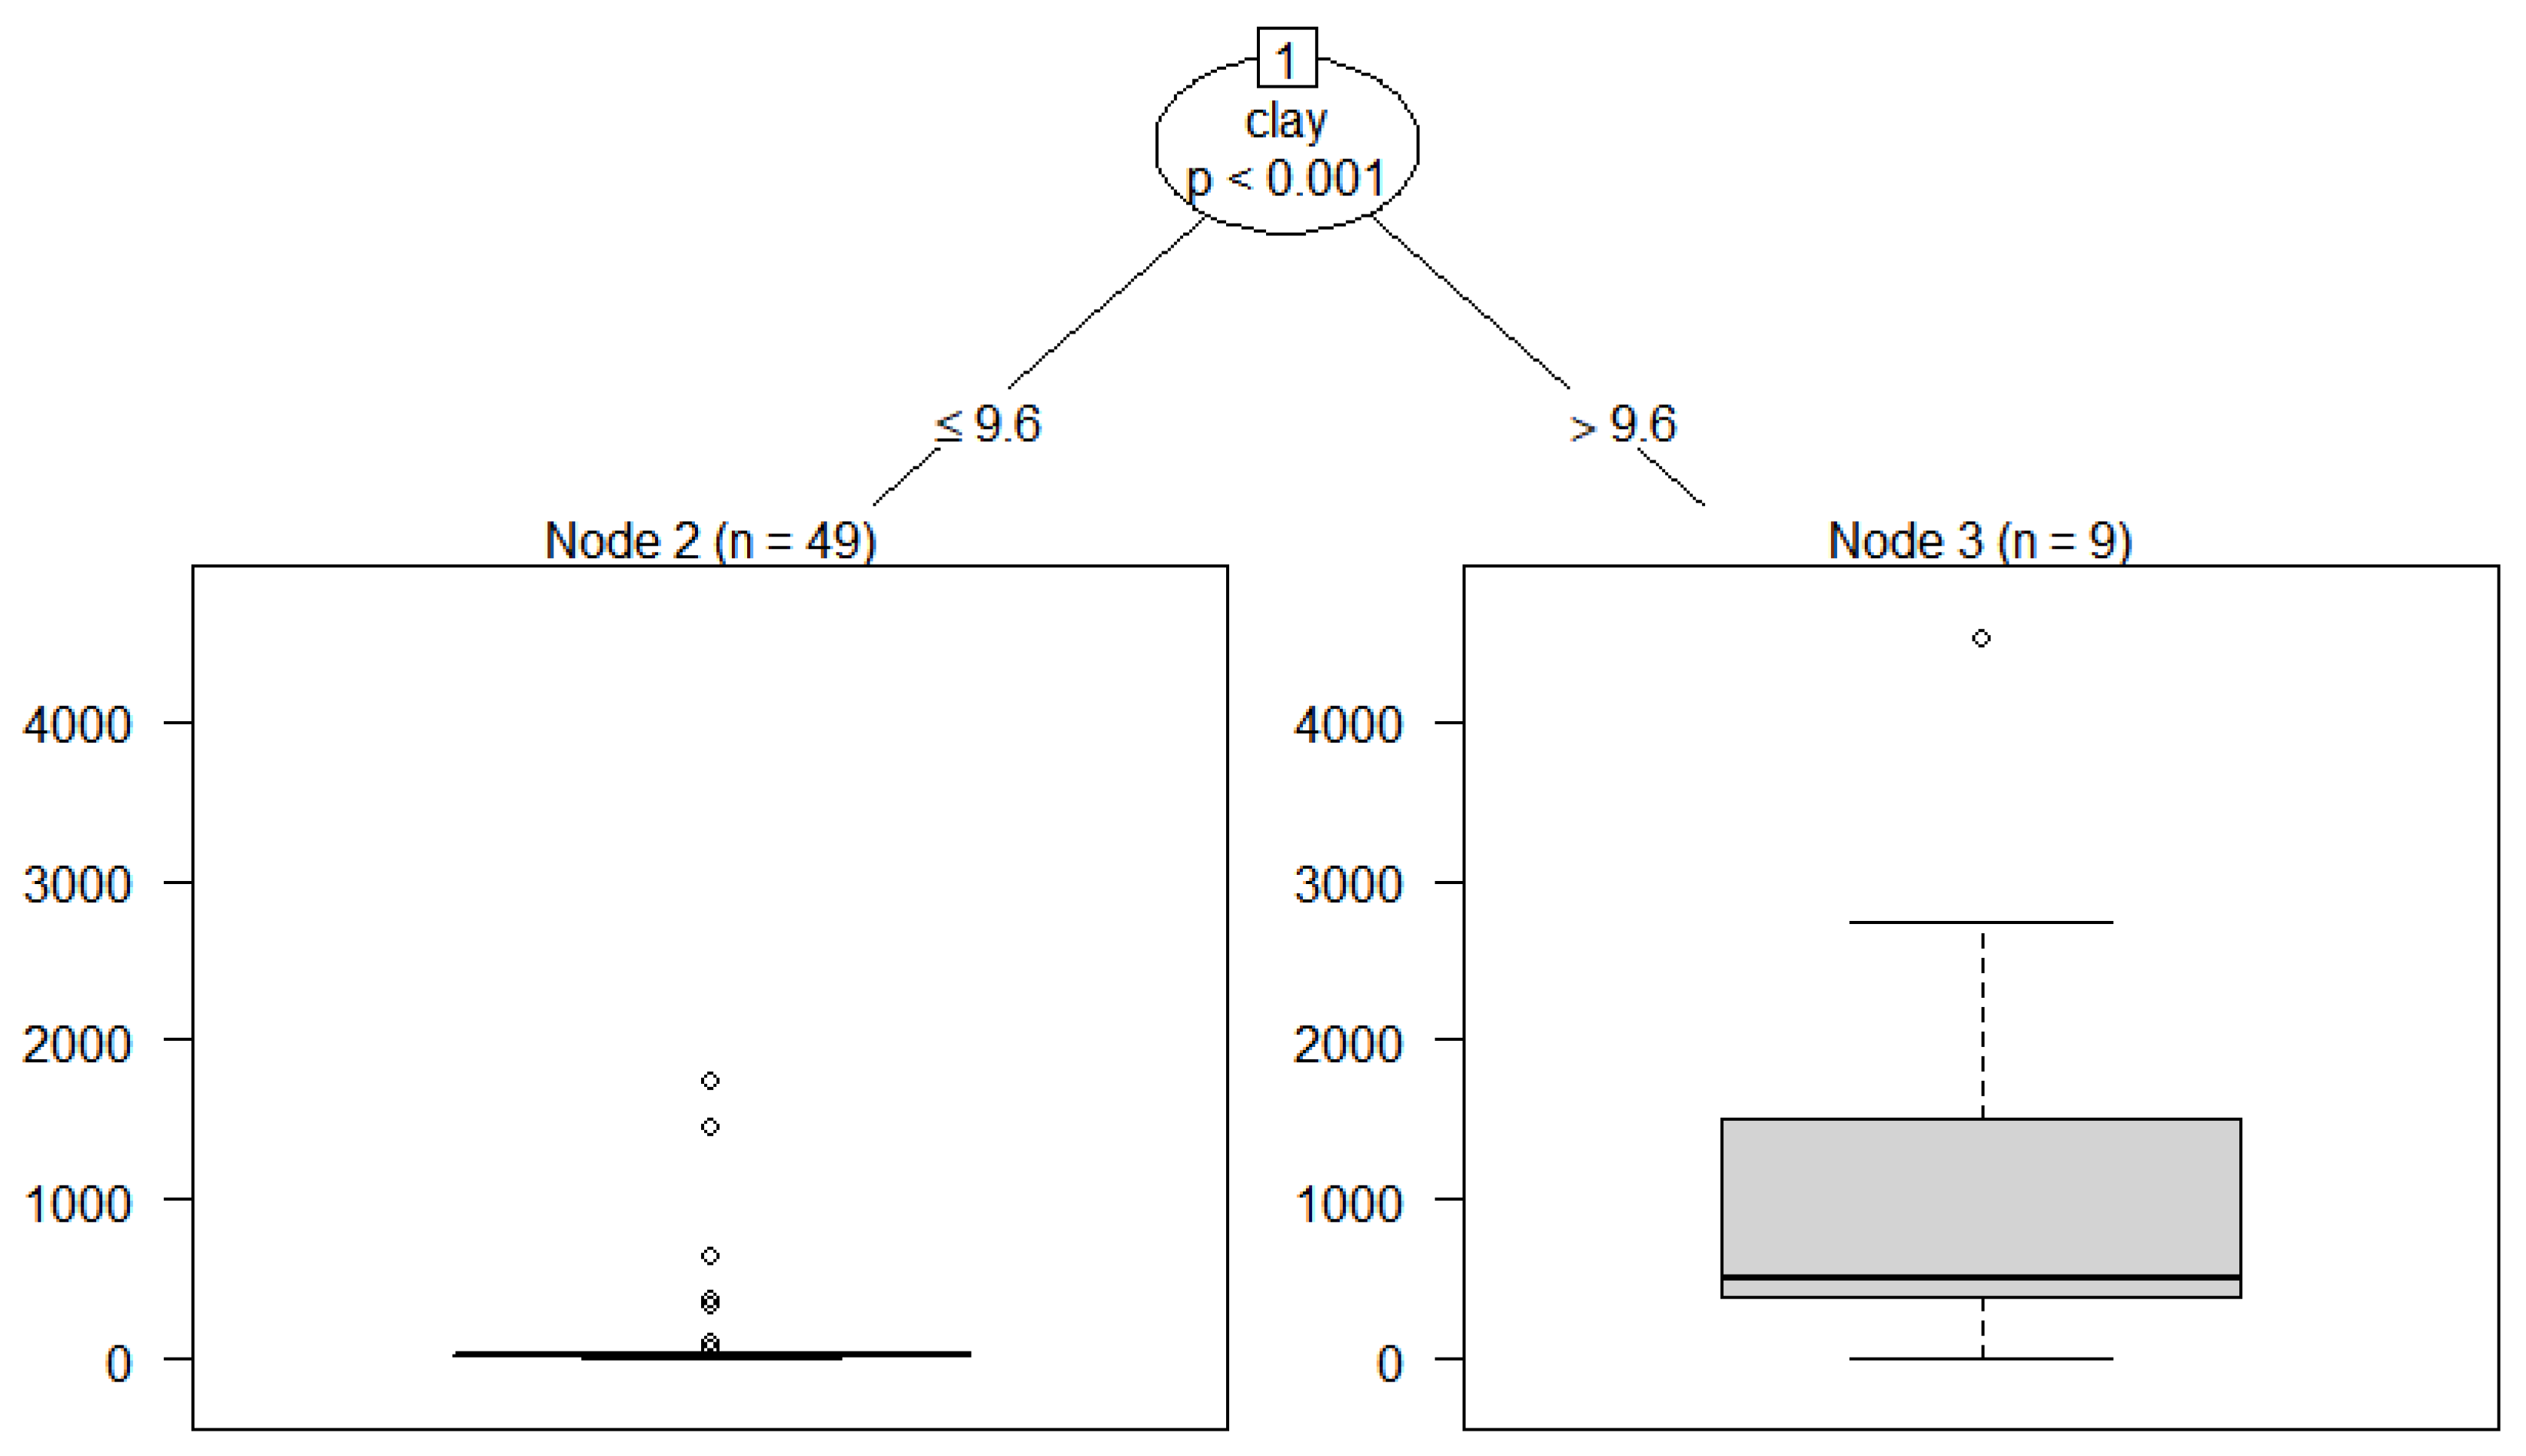
3.3. Influencing Factors of Soil Sb Accumulation
3.4. Toxicity and Ecological Effects of Sb
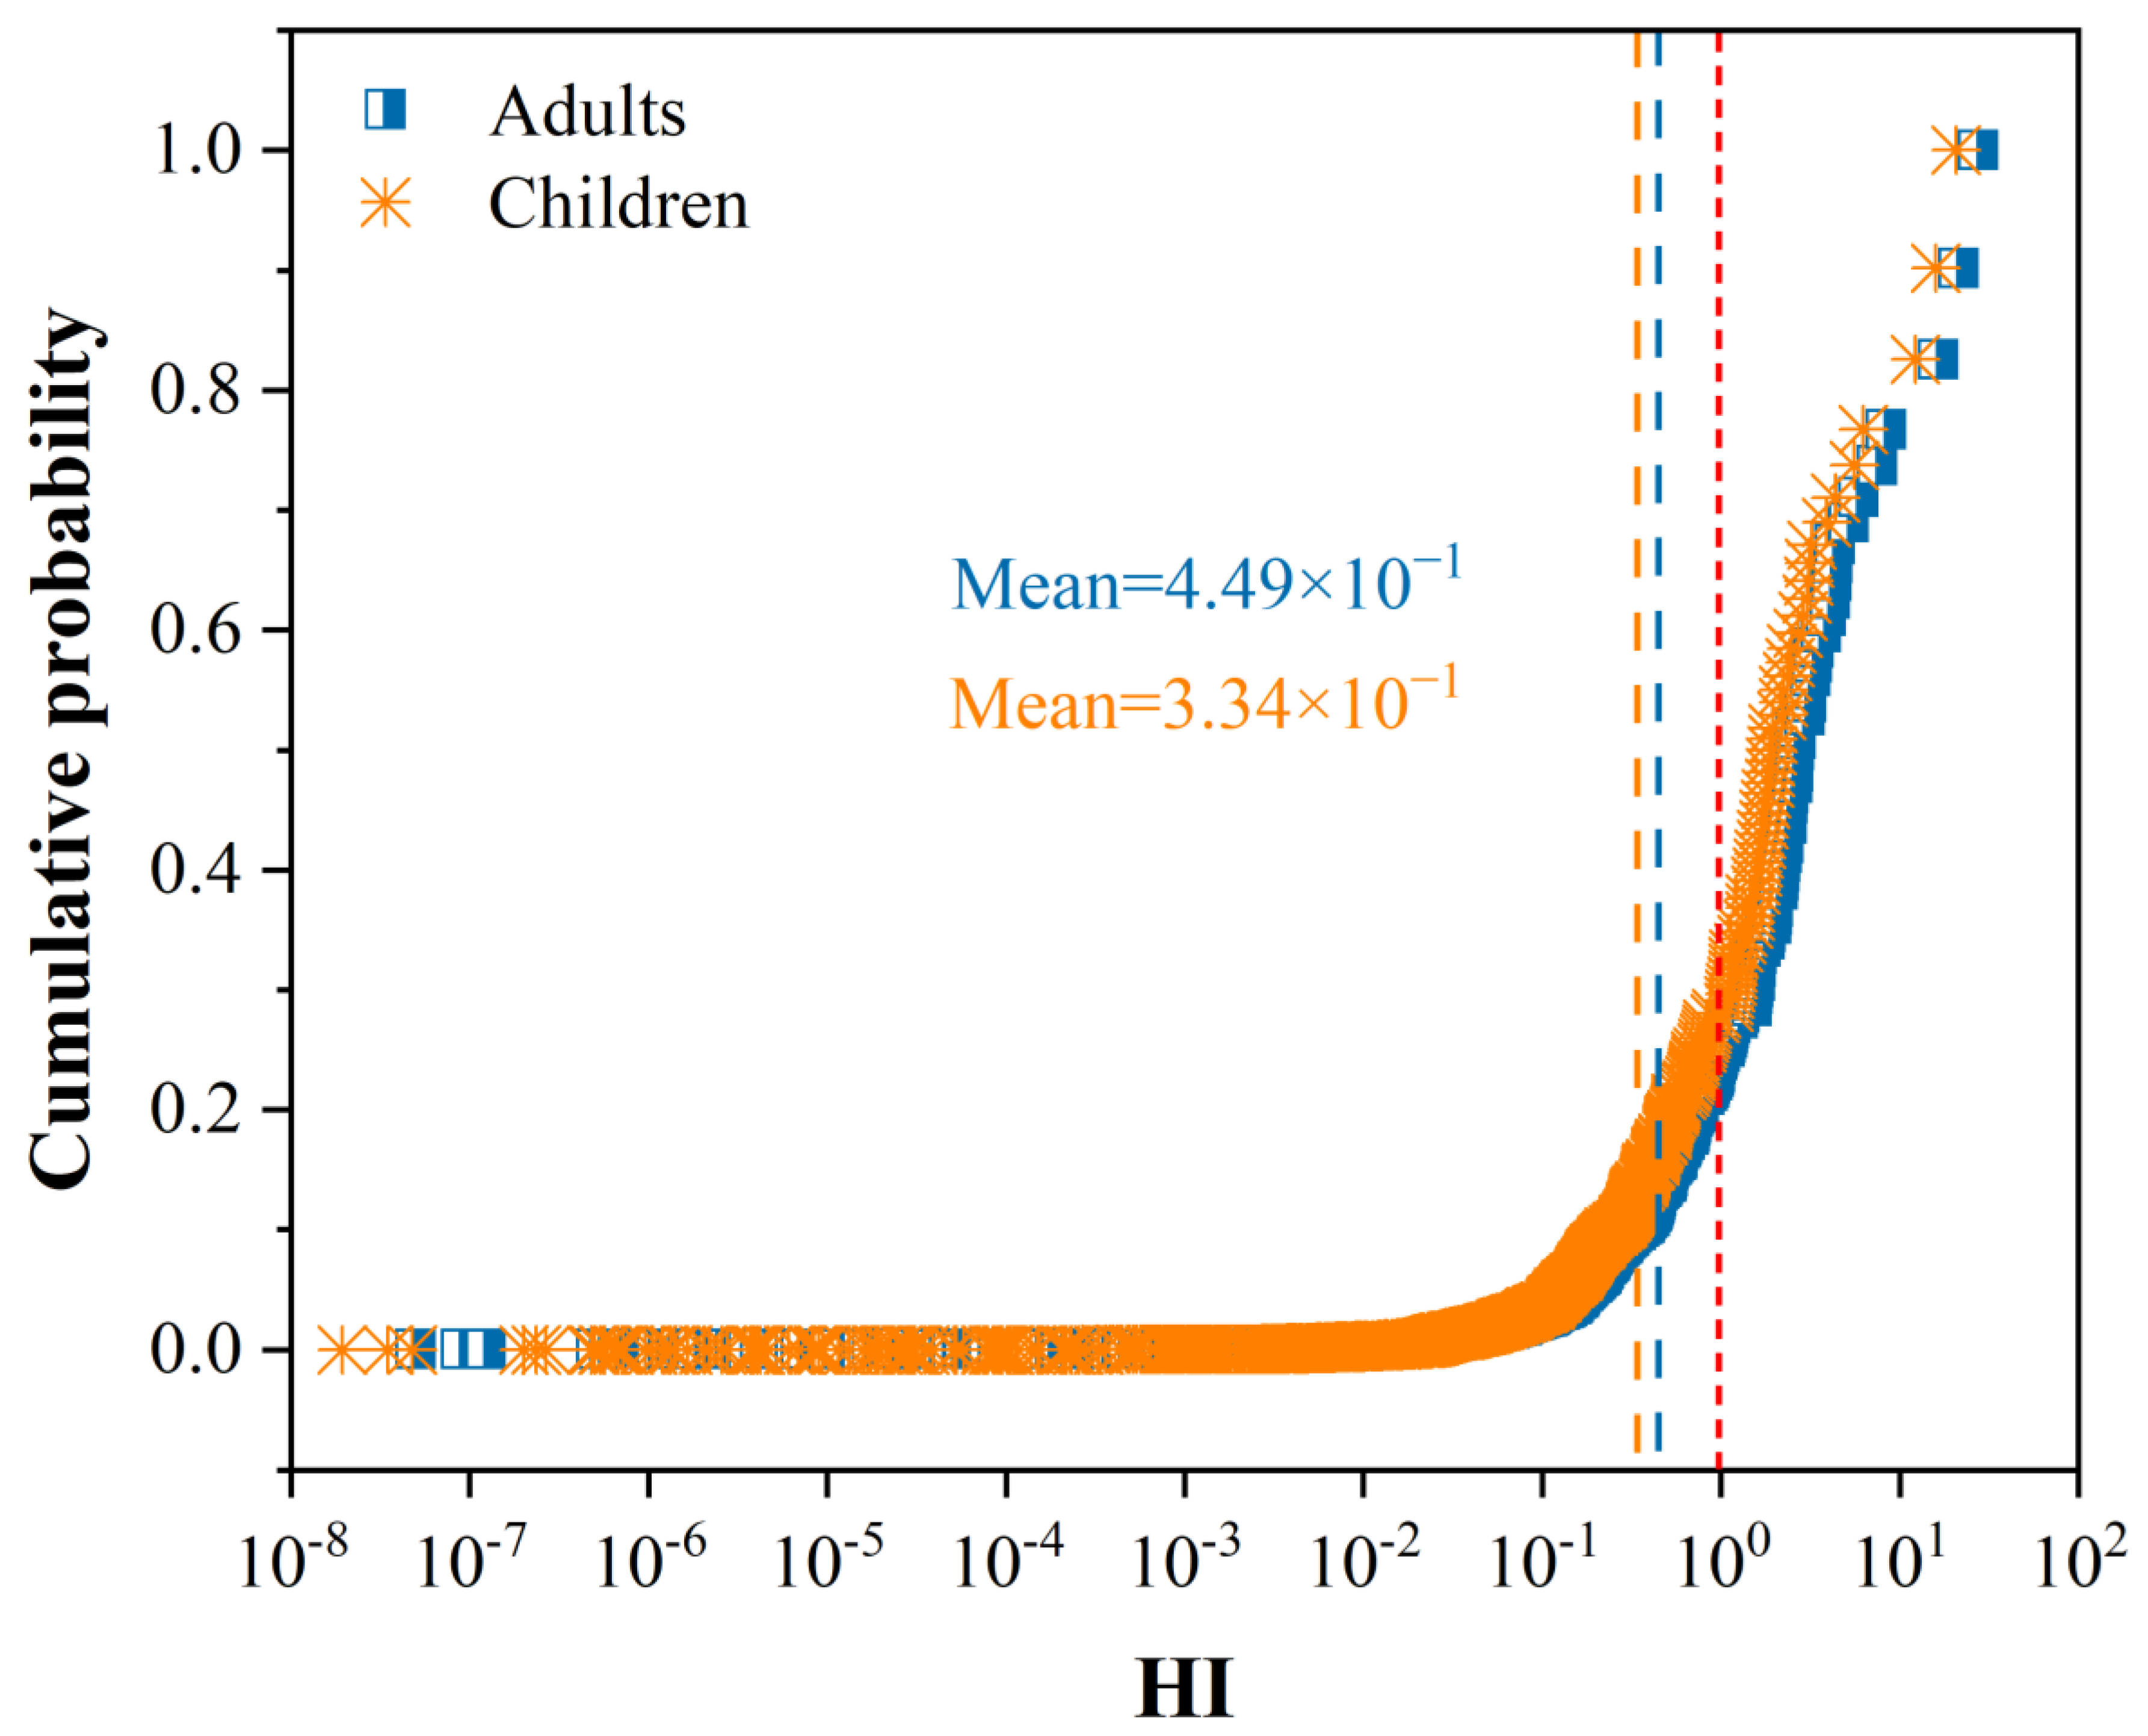
3.4.1. Health Risk of Exposure to Soil Sb
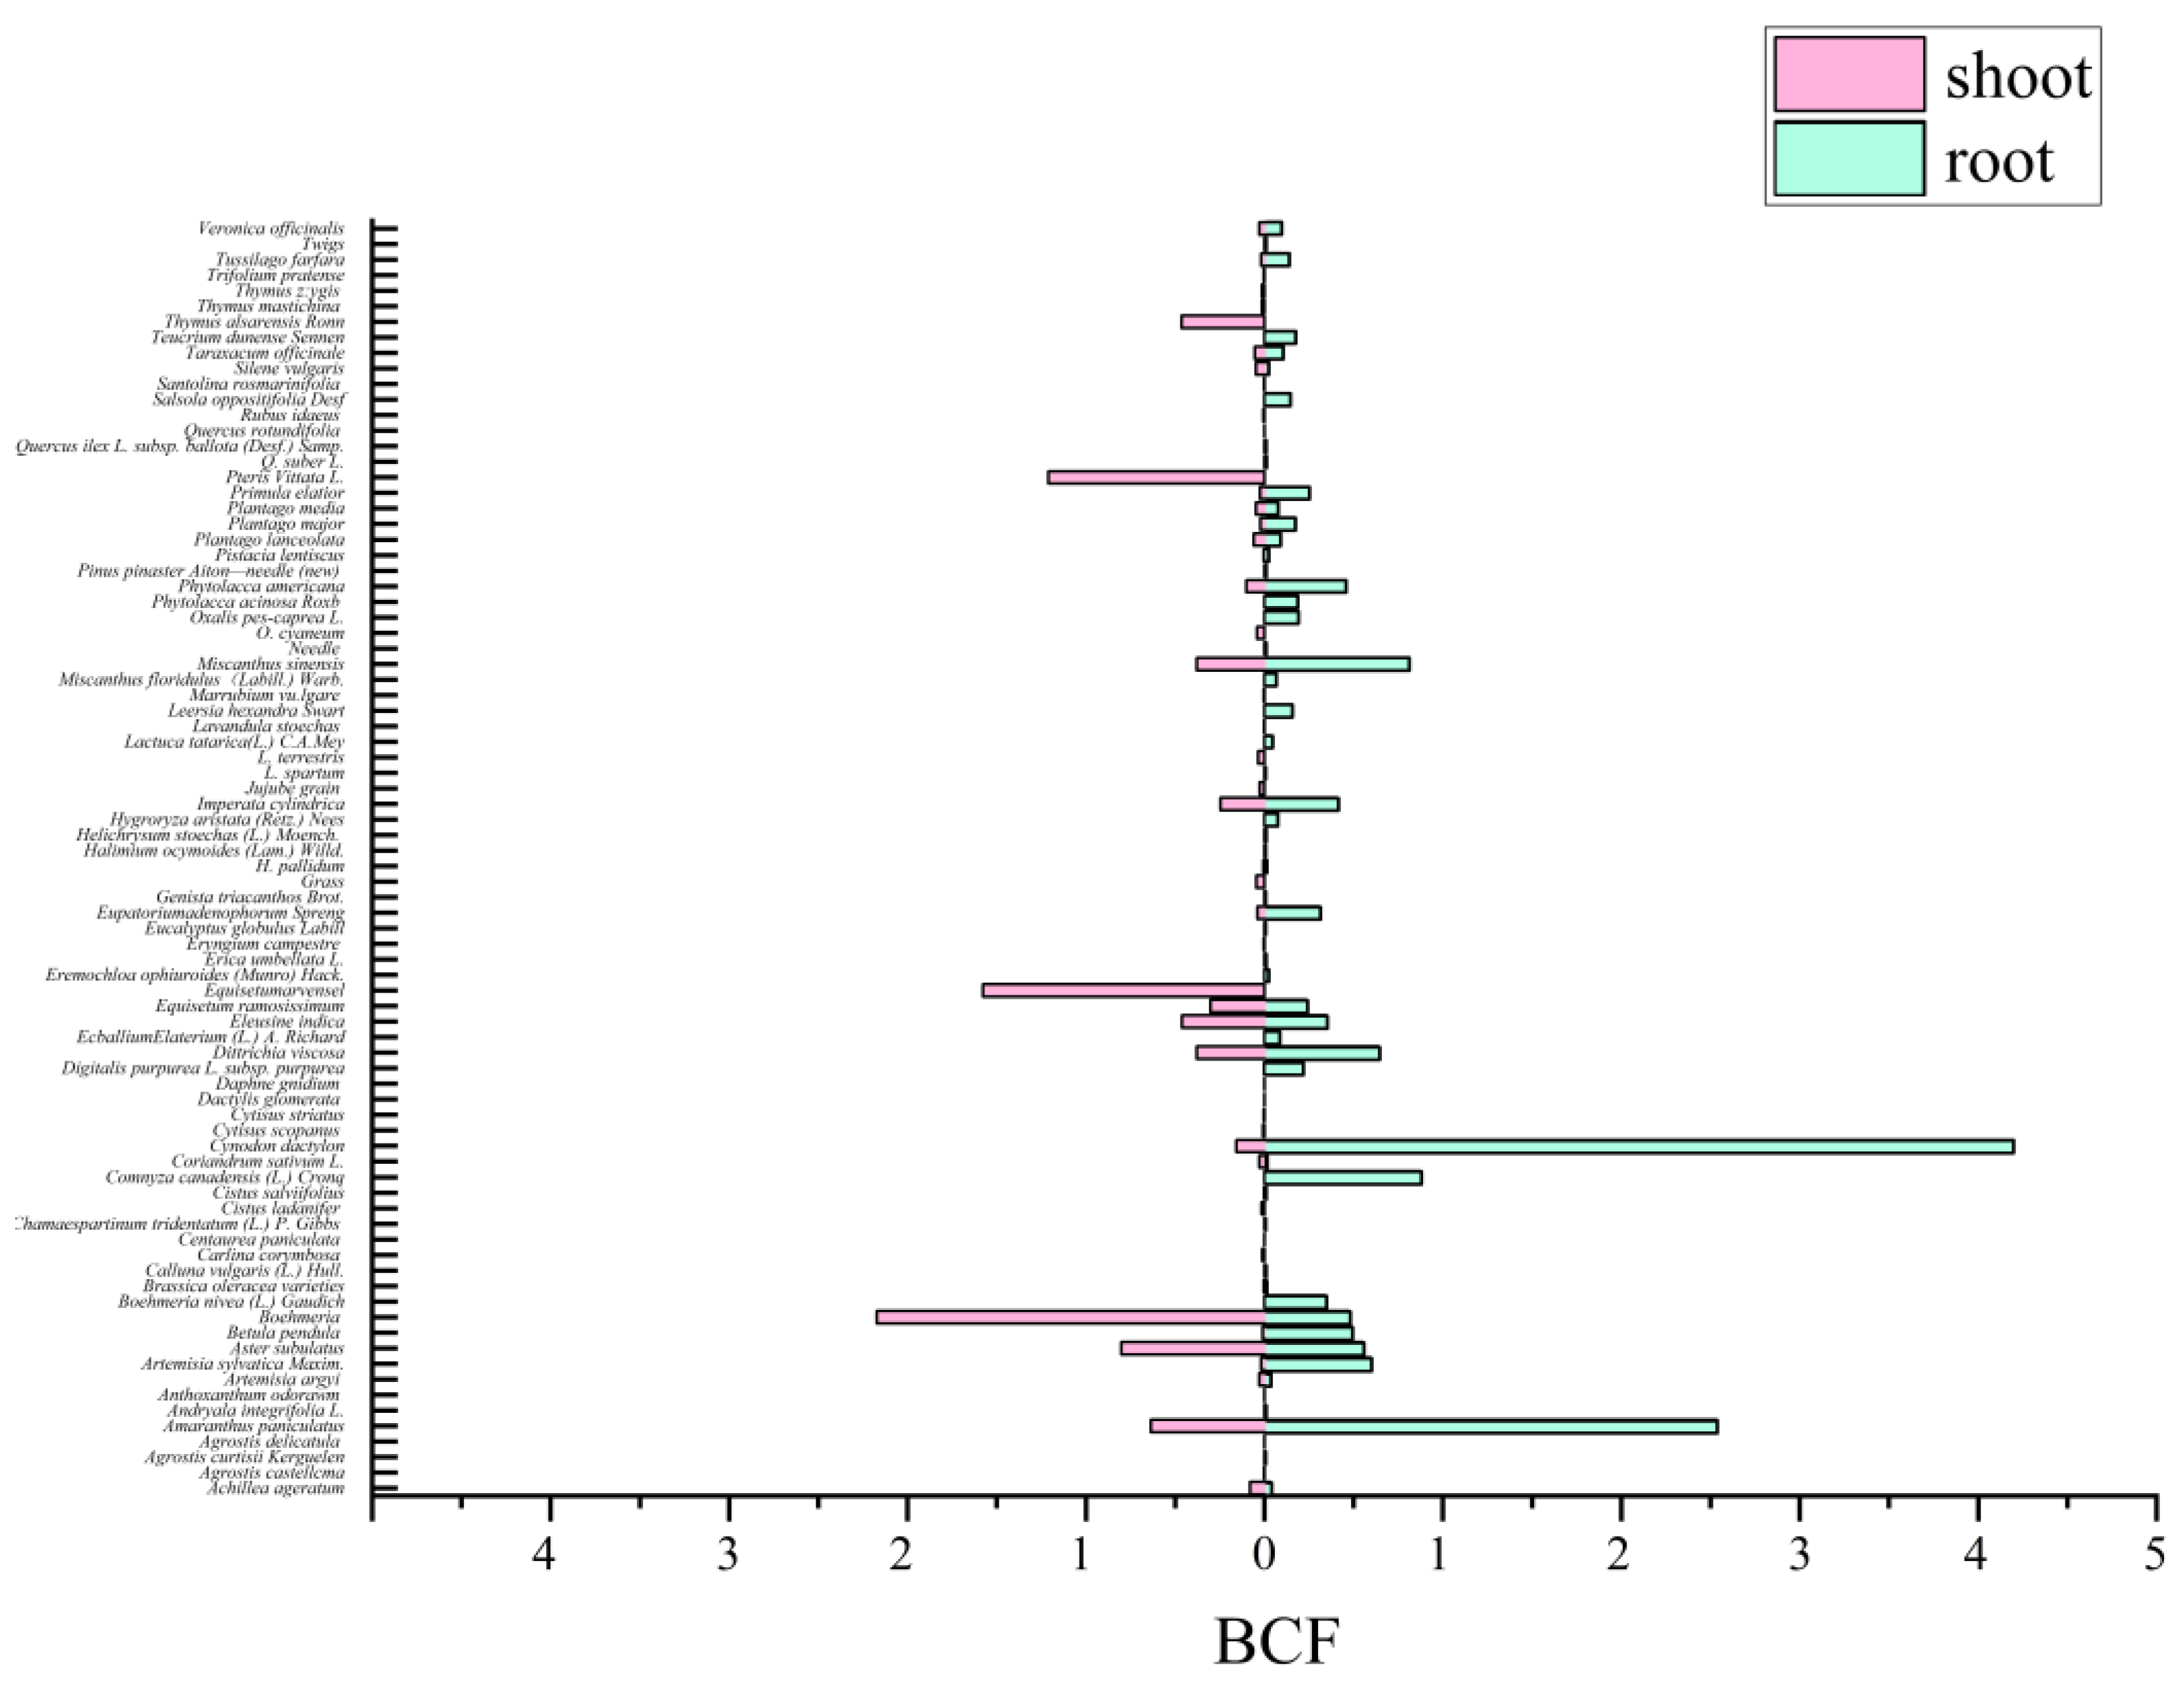
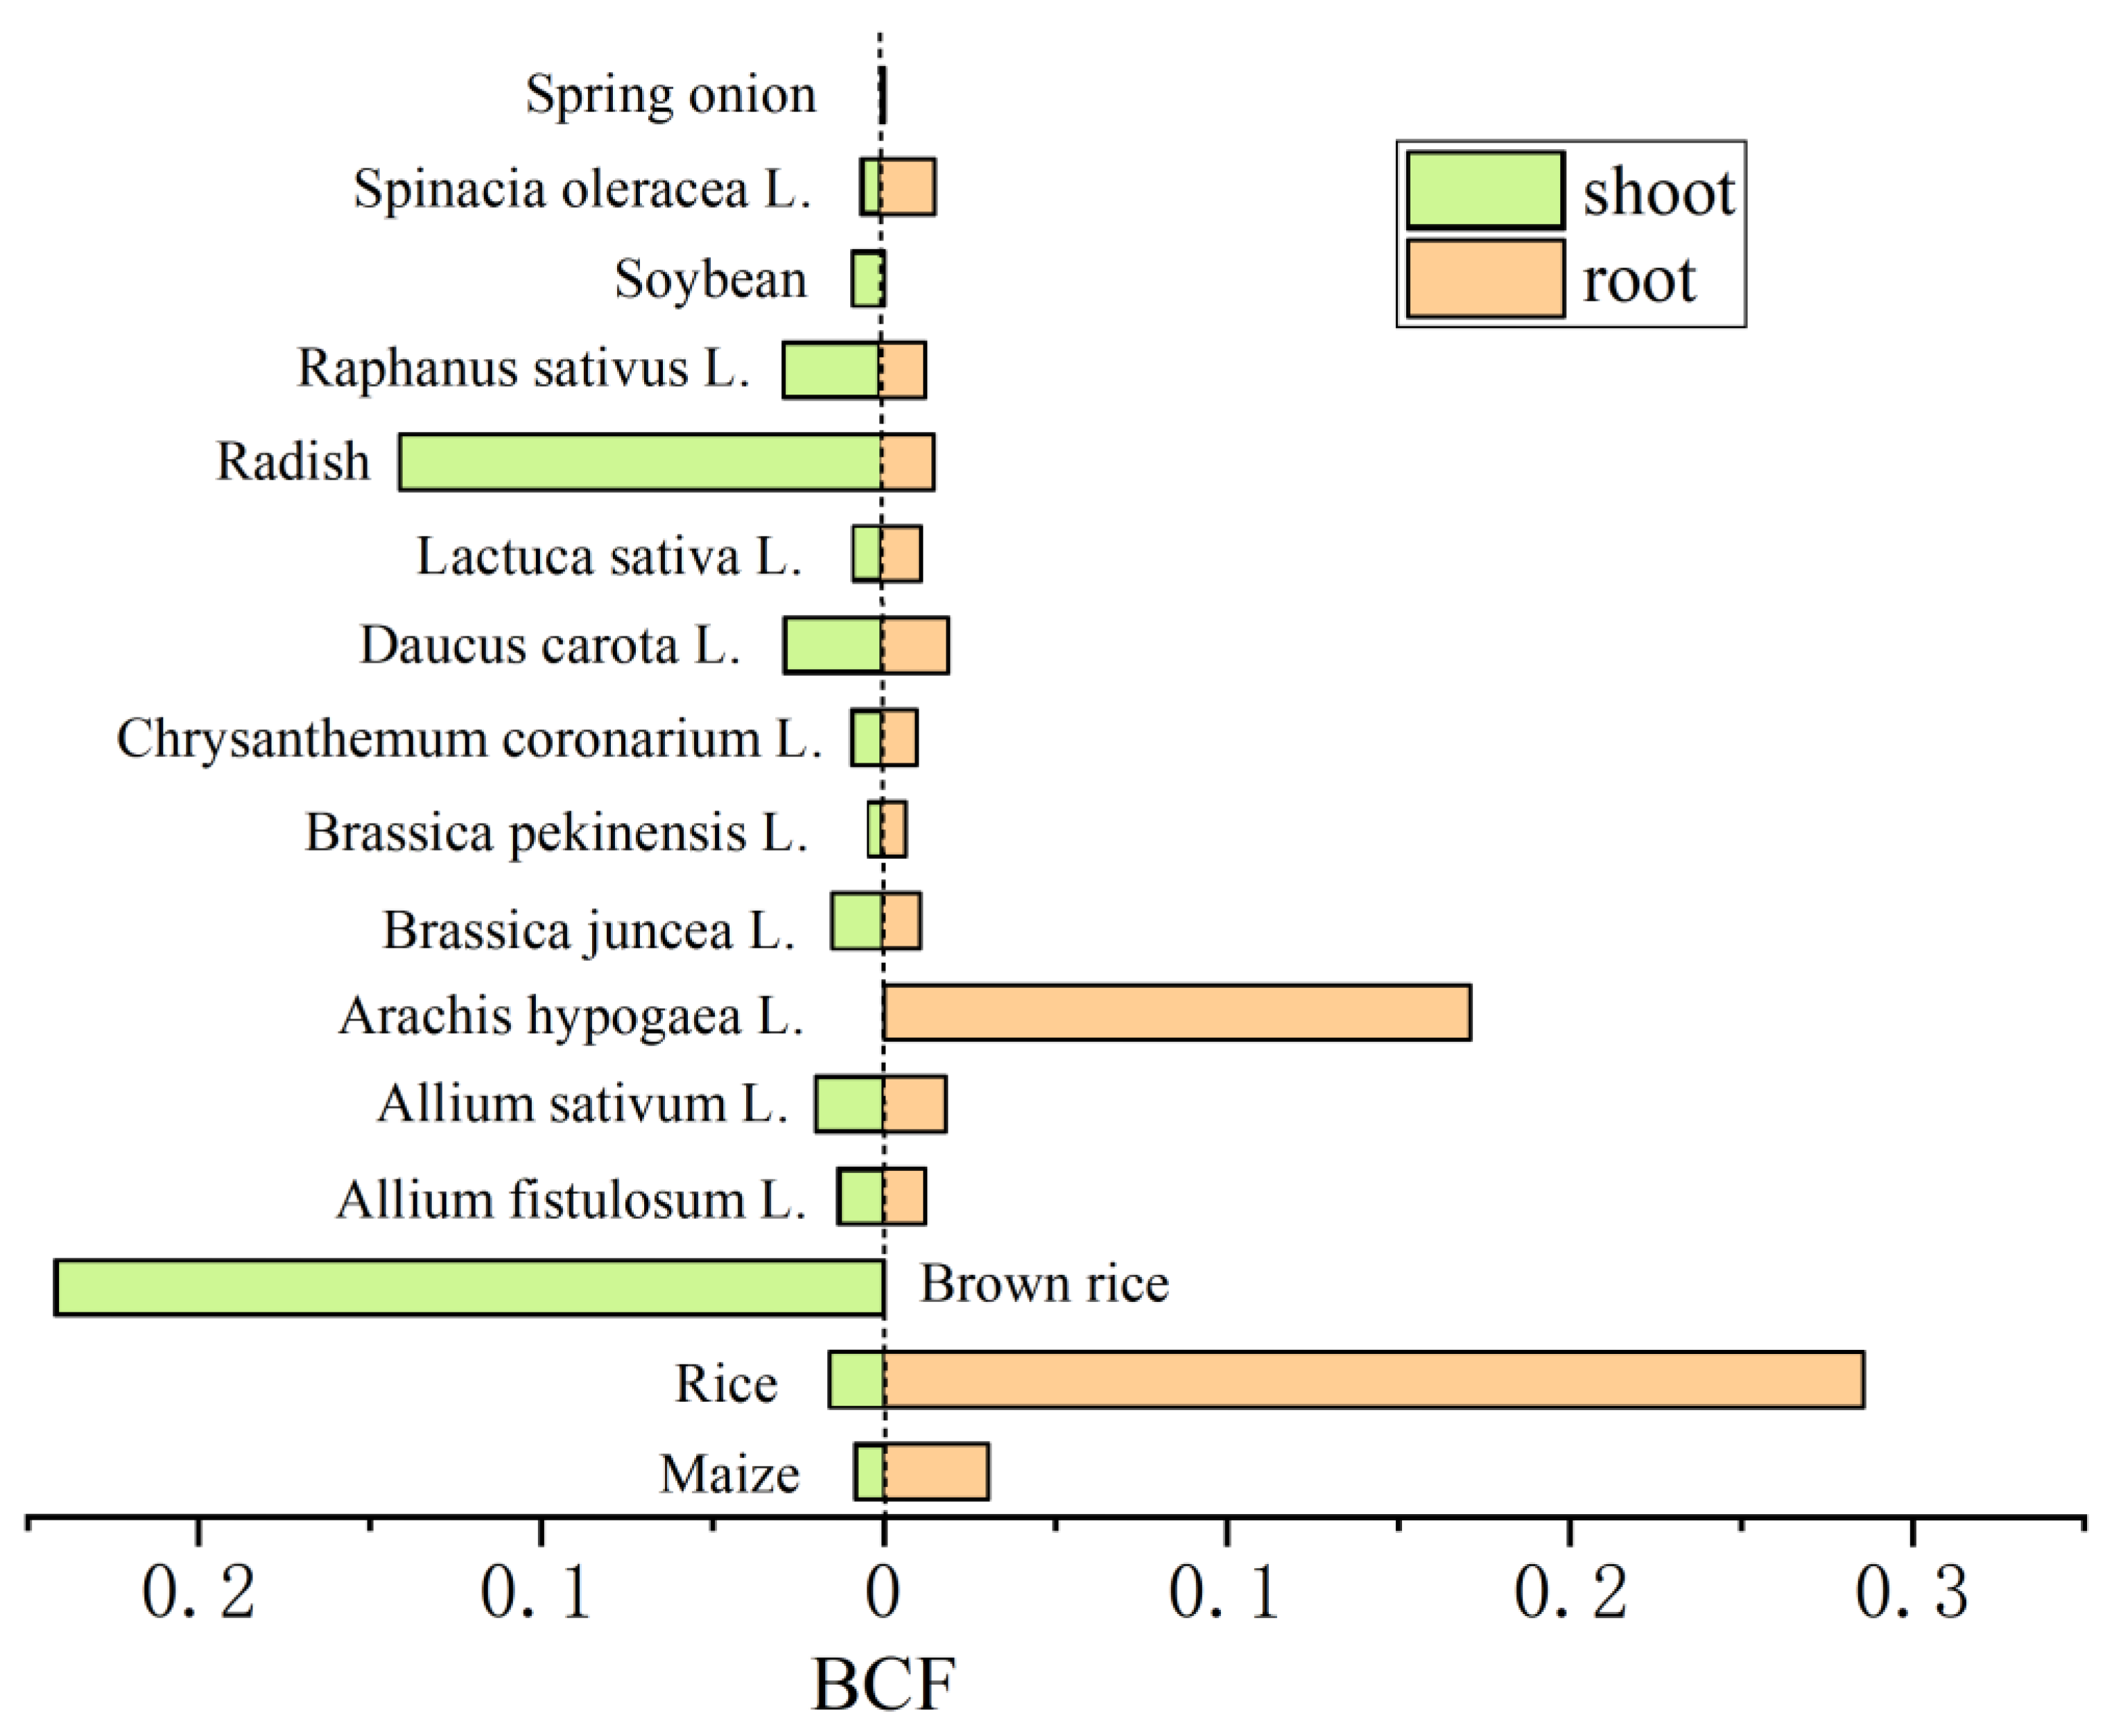
3.4.2. Plants/Crops Uptake
3.4.3. Microbial Characteristics
Microbial Diversity and Population
Factors Controlling Microbial Community Compositions
4. Conclusions and Perspectives
Supplementary Materials
Author Contributions
Funding
Conflicts of Interest
References
- Filella, M.; Belzile, N.; Chen, Y. Antimony in the environment: A review focused on natural waters I. Occurrence. Earth Sci. Rev. 2002, 57, 125–176. [Google Scholar] [CrossRef]
- Daellenbach, K.R.; Uzu, G.; Jiang, J.H.; Cassagnes, L.E.; Leni, Z.; Vlachou, A.; Stefenelli, G.; Canonaco, F.; Weber, S.; Segers, A.; et al. Sources of particulate-matter air pollution and its oxidative potential in Europe. Nature 2020, 587, 414–419. [Google Scholar] [CrossRef] [PubMed]
- Berg, T.; Steinnes, E. Use of mosses (Hylocomium splendens and Pleurozium schreberi) as biomonitors of heavy metal deposition: From relative to absolute deposition values. Environ. Pollut. 1997, 98, 61. [Google Scholar] [CrossRef] [PubMed]
- Hong, S.; Lee, K.; Hou, S.G.; Hur, S.D.; Ren, J.W.; Burn, L.J.; Rosman, K.J.R.; Barbante, C.; Boutron, C.F. An 800-year record of atmospheric As, Mo, Sn, and Sb in Central Asia in high-altitude ice cores from Mt. Qomolangma (Everest), Himalayas. Environ. Sci. Technol. 2009, 43, 8060–8065. [Google Scholar] [CrossRef] [PubMed]
- Cloy, J.M.; Farmer, J.G.; Graham, M.C.; MacKenzie, A.B.; Cook, G.T. A comparison of antimony and lead profiles over the past 2500 years in Flanders Moss ombrotrophic peat bog, Scotland. J. Environ. Monit. 2005, 7, 1137. [Google Scholar] [CrossRef] [Green Version]
- Grousset, F.E.; Quetel, C.R.; Thomas, B.; Donard, O.F.X.; Lambert, C.E.; Guillard, F.; Monaco, A. Anthropogenic vs. lithogenic origins of trace elements (As, Cd, Pb, Rb, Sb, SC, Sn, Zn) in water column particles: Northwestern Mediterranean Sea. Mar. Chem. 1995, 48, 291–310. [Google Scholar] [CrossRef]
- Gebel, T. Arsenic and antimony: Comparative approach on mechanistic toxicology. Chem. Biol. Interact. 1997, 107, 131–144. [Google Scholar] [CrossRef]
- Agency for Toxic Substances and Disease Registry. Toxicological Profile for Antimony. 2019. Available online: https://www.atsdr.cdc.gov/ToxProfiles/tp.asp?id¼332&tid¼58 (accessed on 25 February 2021).
- Schildroth, S.; Osborne, G.; Smith, A.; Yip, C.; Collins, C.; Smith, M.; Sandy, M.S.; Zhang, L.P. Occupational exposure to antimony trioxide: A risk assessment. Occup. Environ. Med. 2020, 78, 106980. [Google Scholar] [CrossRef]
- Belzile, N.; Chen, Y.W.; Filella, M. Human exposure to antimony: I. Sources and intake. Crit. Rev. Environ. Sci. Tec. 2011, 41, 1309–1373. [Google Scholar] [CrossRef]
- He, M.C.; Wang, N.N.; Long, X.J.; Zhang, C.J.; Ma, C.L.; Zhong, Q.Y.; Wang, A.H.; Wang, Y.; Pervaiz, A.; Shan, J. Antimony speciation in the environment: Recent advances in understanding the biogeochemical processes and ecological effects. J. Environ. Sci. 2019, 75, 14–39. [Google Scholar] [CrossRef]
- Zhu, C.Y.; Tian, H.Z.; Hao, J.M. Global anthropogenic atmospheric emission inventory of twelve typical hazardous trace elements, 1995–2012. Atmos. Environ. 2020, 220, 117061. [Google Scholar] [CrossRef]
- Li, H.B.; Yang, Z.H.; Yuan, P.F.; Deng, L.C.; Wang, B.; Su, C.Q. Characteristics of antimony pollution in soils at mining areas in Central Hunan Province. Environ. Sci. Technol. 2011, 1, 18. [Google Scholar]
- Li, J.K.; Yu, H.; Wu, X.L.; Shen, L.; Liu, Y.D.; Qiu, G.Z.; Zeng, W.M.; Yu, R.L. Novel hyper antimony-oxidizing bacteria isolated from contaminated mine soils in China. Geomicrobiol. J. 2018, 35, 713–720. [Google Scholar] [CrossRef]
- National Pollutant Inventory. Available online: https://www.epa.nsw.gov.au/licensing-and-regulation/licensing/environment-protection-licences/national-pollutant-inventory (accessed on 31 October 2022).
- MEMSC. The Background Values of Soil Elements in China; Meterological Press: Beijing, China, 1990; p. 364. [Google Scholar]
- European Commission. Critical Raw Materials for the EU: Report of the Ad-Hoc Working Group on Defining Critical Raw Materials. 2010. Available online: http://ec.europa.eu/enterprise (accessed on 30 August 2011).
- Qin, Z.M.; Zhao, S.T.; Shi, T.R.; Zhang, F.Y.; Pei, Z.R.; Wang, Y.H.; Yanru Liang, Y.R. Accumulation, regional distribution, and environmental effects of Sb in the largest Hg–Sb mine area in Qinling Orogen, China. Sci. Total Environ. 2022, 804, 150218. [Google Scholar] [CrossRef]
- CCME. Canadian Council of Ministers of the Environment, Antimomny Factsheet. 1991. Available online: http://st-ts.ccme.ca/en/index.html?lang=en&factsheet=8 (accessed on 23 August 2018).
- USEPA. Ecological Soil Screening Levels for Antimony Interim Final; OSWER Directive 9285.7-61; U.S. Environmental Protection Agency Office of Solid Waste and Emergency Response: Washington, DC, USA, 2005.
- Carlon, C.E. Derivation Methods of Soil Screening Values in Europe. A Review and Evaluation of National Procedures towards Harmonization; European Commission, Joint Research Centre: Ispra, Italy, 2007. [Google Scholar]
- Chang, A.C.; Pan, G.X.; Page, A.L.; Asano, T. Developing Human Health-Related Chemical Guidelines for Reclaimed Water and Sewage Sludge Applications in Agriculture; WHO/EOS/95.20; Division of Environmental Health, World Health Organization: Geneva, Switzerland, 2002. [Google Scholar]
- Amarasiriwardena, D.; Wu, F.C. Antimony: Emerging toxic contaminant in the environment. Microchem. J. 2011, 97, 1–3. [Google Scholar] [CrossRef]
- Shotyk, W.; Krachler, M.; Chen, B. Antimony: Global environmental contaminant. J. Environ. Monit. 2005, 7, 1135–1136. [Google Scholar]
- Herath, I.; Vithanage, M.; Bundschuh, J. Antimony as a global dilemma: Geochemistry, mobility, fate and transport. Environ. Pollut. 2017, 223, 545–559. [Google Scholar] [CrossRef]
- Wilson, S.C.; Lockwood, P.V.; Ashley, P.M.; Tighe, M. The chemistry and behaviour of antimony in the soil environment with comparisons to arsenic: A critical review. Environ. Pollut. 2010, 158, 1169–1181. [Google Scholar] [CrossRef]
- Li, J.Y.; Zheng, B.H.; He, Y.Z.; Zhou, Y.Y.; Chen, X.; Ruane, S.; Yang, Y.; Dai, C.H.; Tang, L. Antimony contamination, consequences and removal techniques: A review. Ecotox. Environ. Safe 2018, 156, 125–134. [Google Scholar] [CrossRef]
- Pierart, A.; Shahid, M.; Séjalon-Delmas, N.; Dumat, C. Antimony bioavailability: Knowledge and research perspectives for sustainable agricultures. J. Hazard. Mater. 2015, 289, 219–234. [Google Scholar] [CrossRef] [Green Version]
- Chu, J.W.; Mao, J.S.; He, M.C. Anthropogenic antimony flow analysis and evaluation in China. Sci. Total Environ. 2019, 683, 659–667. [Google Scholar] [CrossRef] [PubMed]
- Benhamdi, A.; Bentellis, A.; Rached, O.; Laing, G.D.; Mechakra, A. Effects of antimony and arsenic on antioxidant enzyme activities of two steppic plant species in an old antimony mining area. Biol. Trace Elem. Res. 2014, 158, 96–104. [Google Scholar] [CrossRef] [PubMed]
- Hammel, W.; Steubing, L.; Debus, R. Assessment of the ecotoxic potential of soil contaminants by using a soil-algae test. Ecotox. Environ. Safe 1998, 40, 173–176. [Google Scholar] [CrossRef] [PubMed]
- Jurkovič, Ľ.; Majzlan, J.; Hiller, E.; Klimko, T.; Voleková-Lalinská, B.; Méres, Š.; Göttlicher, J.; Steininger, R. Natural attenuation of antimony and arsenic in soils at the abandoned Sb-deposit Poproč, Slovakia. Environ. Earth Sci. 2019, 78, 672. [Google Scholar] [CrossRef]
- Lewińska, K.; Karczewska, A.; Siepak, M.; Gałka, B.; Stysz, M.; Kaźmierowski, C. Recovery and leachability of antimony from mine- and shooting range soils. J. Elementol. 2016, 22, 79–90. [Google Scholar] [CrossRef]
- Lewińska, K.; Karczewska, A.; Siepak, M.; Bernard Gałka, B. The release of antimony from mine dump soils in the presence and absence of forest litter. Int. J. Environ. Res. Public Health 2018, 15, 2631. [Google Scholar] [CrossRef] [Green Version]
- Villarroel, L.F.; Miller, J.R.; Lechler, P.J.; Germanoski, D. Lead, zinc, and antimony contamination of the Rio Chilco-Rio Tupiza drainage system, Southern Bolivia. Environ. Geol. 2006, 51, 283–299. [Google Scholar] [CrossRef]
- Yang, H.L.; He, M.C. Adsorption of methylantimony and methylarsenic on soils, sediments, and mine tailings from antimony mine area. Microchem. J. 2015, 123, 158–163. [Google Scholar] [CrossRef]
- Wei, C.Y.; Deng, Q.J.; Wu, F.C.; Fu, Z.Y.; Xu, L.B. Arsenic, antimony, and bismuth uptake and accumulation by plants in an old antimony mine, China. Biol. Trace Elem. Res. 2011, 144, 1150–1158. [Google Scholar] [CrossRef]
- He, M.C. Distribution and phytoavailability of antimony at an antimony mining and smelting area, Hunan, China. Environ. Geochem. Health 2007, 29, 209–219. [Google Scholar] [CrossRef]
- Li, J.N.; Wei, Y.; Zhao, L.; Zhang, J.; Shangguan, Y.X.; Li, F.S.; Hou, H. Bioaccessibility of antimony and arsenic in highly polluted soils of the mine area and health risk assessment associated with oral ingestion exposure. Ecotox. Environ. Safe 2014, 110, 308–315. [Google Scholar] [CrossRef]
- Okkenhaug, G.; Zhu, Y.G.; Luo, L.; Lei, M.; Li, X.; Mulder, J. Distribution, speciation and availability of antimony (Sb) in soils and terrestrial plants from an active Sb mining area. Environ. Pollut. 2011, 159, 2427–2434. [Google Scholar] [CrossRef]
- Wang, N.N.; Zhang, S.H.; He, M.C. Bacterial community profile of contaminated soils in a typical antimony mining site. Environ. Sci. Pollut. Res. 2018, 25, 141–152. [Google Scholar] [CrossRef]
- Labay, K.; Burger, M.H.; Bellora, J.D.; Schulz, K.J.; DeYoung, J.H.; Seal, R.R., Jr.; Bradley, D.C., II; Mauk, J.L.; San Juan, C.A. Global Distribution of Selected Mines, Deposits, and Districts of Critical Minerals; U.S. Geological Survey Data Release: Reston, VA, USA, 2017. [CrossRef]
- Lewińska, K.; Karczewska, A. Antimony in soils of SW Poland-an overview of potentially enriched sites. Environ. Monit. Assess. 2019, 191, 70. [Google Scholar] [CrossRef] [Green Version]
- Baroni, F.; Boscagli, A.; Protano, G.; Riccobono, F. Antimony accumulation in Achillea ageratum, Plantago lanceolata and Silene vulgaris growing in an old Sb-mining area. Environ. Pollut. 2000, 109, 347–352. [Google Scholar] [CrossRef]
- Cidu, R.; Biddau, R.; Dore, E.; Vacca, A.; Marini, L. Antimony in the soil-water-plant system at the Su Suergiu abandoned mine (Sardinia, Italy): Strategies to mitigate contamination. Sci. Total Environ. 2014, 497–498, 319–331. [Google Scholar] [CrossRef]
- Casado, M.; Anawar, H.M.; Garcia-Sanchez, A.; Regina, I.S. Antimony and arsenic uptake by plants in an abandoned mining area. Commun. Soil Sci. Plan. 2007, 38, 1255–1275. [Google Scholar] [CrossRef]
- Murciego, A.M.; Sánchez, A.G.; González, M.A.R.; Gil, E.P.; Gordillo, C.T.; Fernández, J.C.; Triguero, T.B. Antimony distribution and mobility in topsoils and plants (Cytisus striatus, Cistus ladanifer and Dittrichia viscosa) from polluted Sb-mining areas in Extremadura (Spain). Environ. Pollut. 2007, 145, 15–21. [Google Scholar] [CrossRef]
- Pratas, J.; Prasad, M.N.V.; Freitas, H.; Conde, L. Plants growing in abandoned mines of Portugal are useful for biogeochemical exploration of arsenic, antimony, tungsten and mine reclamation. J. Geochem. Explor. 2005, 85, 99–107. [Google Scholar] [CrossRef] [Green Version]
- Anawar, H.M.; Canha, N.; Santa-Regina, I.; Freitas, M.C. Adaptation, tolerance, and evolution of plant species in a pyrite mine in response to contamination level and properties of mine tailings: Sustainable rehabilitation. J. Soils Sediments 2013, 13, 730–741. [Google Scholar] [CrossRef]
- Wilson, N.J.; Craw, D.; Hunter, K. Antimony distribution and environmental mobility at an historic antimony smelter site, New Zealand. Environ. Pollut. 2004, 129, 257–266. [Google Scholar] [CrossRef] [PubMed]
- Wilson, S.C.; Leech, C.D.; Butler, L.; Lisle, L.; Ashley, P.M.; Lockwood, P.V. Effects of nutrient and lime additions in mine site rehabilitation strategies on the accumulation of antimony and arsenic by native Australian plants. J. Hazard. Mater. 2013, 261, 801–807. [Google Scholar] [CrossRef] [PubMed]
- Ning, Z.P.; Xiao, T.F.; Xiao, E.Z. Antimony in the soil-plant system in an Sb mining/smelting area of Southwest China. Int. J. Phytoremediat. 2015, 17, 1081–1089. [Google Scholar] [CrossRef] [PubMed]
- Li, L.; Liao, L.; Fan, Y.H.; Tu, H.; Zhang, S.; Wang, B.; Liu, T.Z.; Wu, P.; Han, Z.W. Accumulation and transport of antimony and arsenic in terrestrial and aquatic plants in an antimony ore concentration area (south-west China). Environ. Chem. 2020, 17, 314–322. [Google Scholar] [CrossRef]
- Hiller, E.; Lalinská, B.; Chovan, M.; Jurkovič, Ľ.; Klimko, T.; Jankulár, M.; Hovorič, R.; Šottník, P.; Fľaková, R.; Ženišová, Z.; et al. Arsenic and antimony contamination of waters, stream sediments and soils in the vicinity of abandoned antimony mines in the Western Carpathians, Slovakia. Appl. Geochem. 2012, 27, 598–614. [Google Scholar] [CrossRef]
- Carvalho, P.C.S.; Neiva, A.M.R.; Silva, M.M.V.G. Assessment to the potential mobility and toxicity of metals and metalloids in soils contaminated by old Sb-Au and As-Au mines (NW Portugal). Environ. Earth Sci. 2012, 65, 1215–1230. [Google Scholar] [CrossRef]
- Huang, B.C.; Long, J.; Liao, H.K.; Liu, L.F.; Li, J.; Zhang, J.M.; Li, Y.R.; Wang, X.; Yang, R. Characteristics of bacterial community and function in paddy soil profile around antimony mine and its response to antimony and arsenic contamination. Int. J. Environ. Res. Public Health 2019, 16, 4883. [Google Scholar] [CrossRef] [Green Version]
- Protano, G.; Nannoni, F. Influence of ore processing activity on Hg, As and Sb contamination and fractionation in soils in a former mining site of Monte Amiata ore district (Italy). Chemosphere 2018, 199, 320–330. [Google Scholar] [CrossRef]
- Deng, R.J.; Tang, Z.E.; Hou, B.L.; Ren, B.Z.; Wang, Z.H.; Zhu, C.Q.; Kelly, S.; Hursthouse, A. Microbial diversity in soils from antimony mining sites: Geochemical control promotes species enrichment. Environ. Chem. Lett. 2020, 18, 911–922. [Google Scholar] [CrossRef] [Green Version]
- Ettler, V.; Mihaljevič, M.; Šebek, O.; Nechutný, Z. Antimony availability in highly polluted soils and sediments-A comparison of single extractions. Chemosphere 2007, 68, 455–463. [Google Scholar] [CrossRef]
- Flynn, H.C.; Meharg, A.A.; Bowyer, P.K.; Paton, G.I. Antimony bioavailability in mine soils. Environ. Pollut. 2003, 124, 93–100. [Google Scholar] [CrossRef]
- Pérez-Sirvent, C.; Martínez-Sánchez, M.J.; Martínez-López, S.; Bech, J.; Nanthi Bolan, N. Distribution and bioaccumulation of arsenic and antimony in Dittrichia viscosa growing in mining-affected semiarid soils in southeast Spain. J. Geochem. Explor. 2012, 123, 128–135. [Google Scholar] [CrossRef]
- Vaculík, M.; Jurkovič, Ľ.; Matejkovič, P.; Molnárová, M.; Lux, A. Potential risk of arsenic and antimony accumulation by medicinal plants naturally growing on old mining sites. Water Air Soil Poll. 2013, 224, 1546. [Google Scholar] [CrossRef]
- Wei, Y.; Chen, Z.P.; Wu, F.C.; Hou, H.; Li, J.N.; Shangguan, Y.X.; Zhang, J.; Li, F.S.; Zeng, Q.R. Molecular diversity of arbuscular mycorrhizal fungi at a large-scale antimony mining area in southern China. J. Environ. Sci. 2015, 29, 18–26. [Google Scholar] [CrossRef]
- Tan, D.; Long, J.M.; Li, B.Y.; Ding, D.; Du, H.H.; Lei, M. Fraction and mobility of antimony and arsenic in three polluted soils: A comparison of single extraction and sequential extraction. Chemosphere 2018, 213, 533–540. [Google Scholar] [CrossRef]
- Gál, J.; Hursthouse, A.S.; Cuthbert, S.J. Chemical availability of arsenic and antimony in industrial soils. Environ. Chem. Lett. 2006, 3, 149–153. [Google Scholar] [CrossRef]
- Mariet, A.L.; de Vaufleury, A.; Bégeot, C.; Walter-Simonnet, A.V.; Gimbert, F. Palaeo-pollution from mining activities in the Vosges Mountains: 1000 years and still bioavailable. Environ. Pollut. 2016, 214, 575–584. [Google Scholar] [CrossRef]
- Ngo, L.K.; Pinch, B.M.; Bennett, W.W.; Teasdale, P.R.; Jolley, D.F. Assessing the uptake of arsenic and antimony from contaminated soil by radish (Raphanus sativus) using DGT and selective extractions. Environ. Pollut. 2016, 216, 104–114. [Google Scholar] [CrossRef]
- Park, S.C.; Boyanov, M.I.; Kemner, K.M.; O’Loughlin, E.J.; Kwon, M.J. Distribution and speciation of Sb and toxic metal(loid)s near an antimony refinery and their effects on indigenous microorganisms. J. Hazard. Mater. 2021, 403, 123625. [Google Scholar] [CrossRef]
- Mitsunobu, S.; Harada, T.; Takahashi, Y. Comparison of antimony behavior with that of arsenic under various soil redox conditions. Environ. Sci. Technol. 2006, 40, 7270–7276. [Google Scholar] [CrossRef]
- Xiao, E.Z.; Ning, Z.P.; Xiao, T.F.; Sun, W.M.; Qiu, Y.Q.; Zhang, Y.; Chen, J.Y.; Gou, Z.L.; Chen, Y.X. Variation in rhizosphere microbiota correlates with edaphic factor in an abandoned antimony tailing dump. Environ. Pollut. 2019, 253, 141–151. [Google Scholar] [CrossRef] [PubMed]
- Liang, Z.W.; Hua, Z.S.; Jia, P.; Liu, J.; Luo, Z.H.; Chen, W.C.; Kuang, J.L.; Liao, B.; Shu, W.S.; Li, J.T. Strong associations between biogeochemical factors and Sb species in sediments of the world’s largest Sb mine (Xikuangshan) in China. J. Geophys. Res. Biogeo. 2018, 123, 1548–1556. [Google Scholar] [CrossRef]
- García-Lorenzo, M.L.; Martínez-Sánchez, M.J.; Pérez-Sirvent, C.; López-Sánchez, J.; Molina-Ruiz, J.; Tudela, M.L. Geogenic distribution of arsenic (As) and antimony (Sb) in soils of the Murcia region in Spain. Environ. Forensics 2015, 16, 88–95. [Google Scholar] [CrossRef]
- Zhang, C.; Liu, L.B.; Chen, X.Y.; Dai, Y.C.; Jia, H.Z. Mechanistic understanding of antimony(V) complexation on montmorillonite surfaces: Insights from first-principles molecular dynamics. Chem. Eng. J. 2022, 428, 131157. [Google Scholar] [CrossRef]
- McBride, M.B. Environmental Chemistry of Soils; Oxford University Press: Oxford, UK, 1994. [Google Scholar]
- Xi, J.; He, M.; Lin, C. Adsorption of antimony(III) and antimony(V) on bentonite: Kinetics, thermodynamics and anion competition. Microchem. J. 2011, 97, 85–91. [Google Scholar] [CrossRef]
- Duester, L.; Hartmann, L.M.; Luemers, L.; Hirner, A.V. Particle size distribution of organometal(loid) compounds in freshwater sediments. Appl. Organomet. Chem. 2007, 21, 441–446. [Google Scholar] [CrossRef]
- Fan, Y.; Zhu, T.P.; Li, M.T.; He, J.Y.; Huang, R.X. Heavy metal contamination in soil and brown rice and human health risk assessment near three mining areas in central China. J. Healthc. Eng. 2017, 2017, 4124302. [Google Scholar] [CrossRef] [Green Version]
- Tserenpil, S.; Liu, C.Q. Study of antimony(Ⅲ) binding to soil humic acid from an antimony smelting site. Microchem. J. 2011, 98, 15–20. [Google Scholar] [CrossRef]
- Sun, X.X.; Li, B.Q.; Han, F.; Xiao, E.Z.; Wang, Q.; Xiao, T.F.; Sun, W.M. Vegetation type impacts microbial interaction with antimony contaminants in a mining-contaminated soil environment. Environ. Pollut. 2019, 252, 1872–1881. [Google Scholar] [CrossRef]
- USEPA. Risk-Based Concentration Table; United States Environmental Protection Agency: Philadelphia, PA, USA, 2000.
- Bolan, N.; Kumar, M.; Singh, E.; Kumar, A.; Singh, L.; Kumar, S.; Keerthanan, S.; Hoang, S.A.; El-Naggar, A.; Vithanage, M.; et al. Antimony contamination and its risk management in complex environmental settings: A review. Environ. Int. 2022, 158, 106908. [Google Scholar] [CrossRef]
- Denys, S.; Tack, K.; Caboche, J.; Delalain, P. Bioaccessibility, solid phase distribution, and speciation of Sb in soils and in digestive fluids. Chemosphere 2009, 74, 711–716. [Google Scholar] [CrossRef]
- Xue, L.; Liu, J.F.; Shi, S.Q.; Wei, Y.; Chang, E.M.; Gao, M.; Chen, L.Z.; Jiang, Z.P. Uptake of heavy metals by native herbaceous plants in an antimony mine (Hunan, China). Clean Soil Air Water 2014, 42, 81–87. [Google Scholar] [CrossRef]
- Zhang, G.P.; Liu, C.Q.; Liu, H.; Hu, J.; Han, G.L.; Li, L. Mobilisation and transport of arsenic and antimony in the adjacent environment of Yata gold mine, Guizhou province, China. J. Environ. Monit. 2009, 11, 1570–1578. [Google Scholar] [CrossRef]
- Wan, X.M.; Lei, M.; Yang, J.X. Two potential multi-metal hyperaccumulators found in four mining sites in Hunan Province, China. Catena 2017, 148, 67–73. [Google Scholar] [CrossRef]
- Tisarum, R.; Lessl, J.T.; Dong, X.; de Oliveira, L.M.; Rathinasabapathi, B.; Ma, L.Q. Antimony uptake, efflux and speciation in arsenic hyperaccumulator Pteris vittate. Environ. Pollut. 2014, 186, 110–114. [Google Scholar] [CrossRef]
- Feng, R.W.; Wei, C.Y.; Tu, S.X.; Tang, S.R.; Wu, F.C. Simultaneous hyperaccumulation of arsenic and antimony in Cretan brake fern: Evidence of plant uptake and subcellular distributions. Microchem. J. 2011, 97, 38–43. [Google Scholar] [CrossRef]
- Barajas-Aceves, M.; Camarillo-Ravelo, D.; Juarez-Sanchez, F.; Rodriguez-Vazquez, R. Lead and zinc distribution in Brassica Juncea and arid soil amended with mine tailings and Bokashi. Fresen. Environ. Bull. 2012, 21, 2626–2637. [Google Scholar]
- Xue, L.; Ren, H.D.; Li, S.; Gao, M.; Shi, S.Q.; Chang, E.M.; Wei, Y.; Yao, X.H.; Jiang, Z.P.; Liu, J.F. Comparative proteomic analysis in Miscanthus sinensis, exposed to antimony stress. Environ. Pollut. 2015, 201, 150–160. [Google Scholar] [CrossRef]
- Zeng, D.F.; Zhou, S.J.; Ren, B.Z.; Chen, T.S. Bioaccumulation of antimony and arsenic in vegetables and health risk assessment in the superlarge antimony-mining area, China. J. Anal. Methods Chem. 2015, 2015, 909724. [Google Scholar] [CrossRef] [Green Version]
- Wu, F.; Fu, Z.; Liu, B.; Mo, C.; Chen, B.; Corns, W.; Liao, H. Health risk associated with dietary co-exposure to high levels of antimony and arsenic in the world’s largest antimony mine area. Sci. Total Environ. 2011, 409, 3344–3351. [Google Scholar] [CrossRef]
- Xu, R.; Sun, X.X.; Lin, H.Z.; Han, F.; Xiao, E.Z.; Li, B.Q.; Qiu, L.; Song, B.R.; Yang, Z.H.; Sun, W.M. Microbial adaptation in vertical soil profiles contaminated by an antimony smelting plant. FEMS Microbiol. Ecol. 2020, 96, fiaa188. [Google Scholar] [CrossRef] [PubMed]
- Šimonovičová, A.; Kraková, L.; Pauditšová, E.; angallo, D. Occurrence and diversity of cultivable autochthonous microscopic fungi in substrates of old environmental loads from mining activities in Slovakia. Ecotox. Environ. Safe 2019, 172, 194–202. [Google Scholar] [CrossRef] [PubMed]
- Raynaud, X.; Nunan, N. Spatial ecology of bacteria at the microscale in soil. PLoS ONE 2014, 9, e87217. [Google Scholar] [CrossRef] [PubMed] [Green Version]
- Wang, Y.; Li, C.; Tu, C.; Hoyt, G.D.; DeForest, J.L.; Hu, S. Long-term no-tillage and organic input management enhanced the diversity and stability of soil microbial community. Sci. Total Environ. 2017, 609, 341–347. [Google Scholar] [CrossRef]
- Li, Q.; Hu, Q.; Zhang, C.; Müller, W.E.G.; Schroder, H.C.; Li, Z.; Zhang, Y.; Liu, C.; Jin, Z. The effect of toxicity of heavy metals contained in tailing sands on the organic carbon metabolic activity of soil microorganisms from different land use types in the karst region. Environ. Earth Sci. 2015, 74, 6747–6756. [Google Scholar] [CrossRef]
- Boer, T.E.D.; Ta, N.; Braster, M.; Temminghoff, E.J.M.; Röling, W.F.M.; Roelofs, D. The influence of long-term copper contaminated agricultural soil at different pH levels on microbial communities and springtail transcriptional regulation. Environ. Sci. Technol. 2012, 46, 60–68. [Google Scholar] [CrossRef]
- Rousk, J.; Baath, E.; Brookes, P.C.; Lauber, C.L.; Lozupone, C.; Caporaso, J.G.; Knight, R.; Fierer, N. Soil bacterial and fungal communities across a pH gradient in an arable soil. ISME J. 2010, 4, 1340–1351. [Google Scholar] [CrossRef]
- Hothorn, T.; Hornik, K.; Zeileisa, A. Unbiased recursive partitioning A conditional inference framework. J. Comput. Graph. Stat. 2006, 15, 651–674. [Google Scholar] [CrossRef]
- USEPA. Risk Assessment Guidance for Superfund. Human Health Evaluation Manual, (Part A); EPA/540/1-89/002; Office of Emergency and Remedial Response: Washington, DC, USA, 1989; Volume 1.


| Fraction of Sb in Soils | Procedure and Reagent | Reference | |||||
|---|---|---|---|---|---|---|---|
| Exchangable | Reducible | Oxizable | Residual | BCR | Carvalho et al., 2012 [55] | ||
| 0.05–1.38% | 0.15–4.07% | 0.11–1.34% | 84.55–108.4% | ||||
| exchangable | specifically-sorbed surface-bound | Xiao et al., 2019 [70] | |||||
| 13.64% | 9.17% | ||||||
| exchangable | reducible | oxizable | residual | Protano and Nannoni, 2018 [57] | |||
| 0.48–5% | 1.82–7% | 3.04–40% | 60.47–95.95% | ||||
| complexing-reducing medium | acidic medium | oxidising medium | olsen extraction | acidic medium (1 g of solid in 25 mL 0.5 M HCl); the classical complexing-reducing medium containing citrateand dithionite, which is an oxidising medium containing H2O2, HNO3, and a 0.5 M NaHCO3 (Olsen extraction) | Pérez-Sirvent et al., 2011 [61] | ||
| 25.6–81.01% | 1.76–9.89% | 0.28–4.51% | 0–1.63% | ||||
| water-soluble | water: soil = 1000 mL: 100 g, shaken for 24 h | Murciego et al., 2007 [47] | |||||
| 0.74–2.45% | |||||||
| water-soluble | water: soil = 10:1, shaken for 24 h | Casado et al., 2007 [46] | |||||
| 0.02–0.27% | |||||||
| water-soluble | water: soil = 10 mL: 1 g, shaken for 2 h | Flynn et al., 2003 [60] | |||||
| 0–41.64% | |||||||
| water-soluble | water: soil = 20 mL: 2 g, shaken for 2.5 h | Li et al., 2020 [53] | |||||
| 0.01–0.76% | |||||||
| water-soluble | Wei et al., 2015 [63] | ||||||
| 0.36–2.7% | |||||||
| water-soluble | water: soil = 1:1 (v/w), shaken for 24 h | Pérez-Sirvent 2012 [61] | |||||
| 0.004–0.3% | |||||||
| water-soluble | Sb(III) | Sb(V) | water: soil = 16 mL: 1.6 g, shaken for 24 h | Okkenhaug et al., 2011 [40] | |||
| 0.6–10.2% | 0.001–0.04% | 0.59–10.15% | |||||
| water-soluble | extractable | water: soil = 100 mL: 50 g, shaken for 24 h; acetic acid: soil = 200 mL 0.43 mol acetic acid: 5 g, shaken for 16 h | Baroni et al., 2000 [44] | ||||
| 0.01–0.34% | 0.03–8.62% | ||||||
| water soluble | extractable | carbonatic | Fe and Mn oxides | sulphidic/organic | residual | Tessier method | He 2007 [38] |
| 0.09–2.5% | 0.31–2.11% | 0.19–2.76% | 0.52–3.39% | 0.91–4.59% | 88.2–97.92% | ||
| extractable | carbonatic | Fe–Mn oxides | sulphidic/organic | residual | Deng et al., 2020 [58] | ||
| 0.82–2.88% | 2.88–9.74% | 11.76–22.51% | 3.87–6.11% | 56.84–81.4% | |||
| extractable | carbonatic | Fe and Mn oxides | sulphidic/organic | residual | Ning et al., 2015 [52] | ||
| 0.15–2.48% | 0.35–10.57% | 0.79–3.89% | 0.99–8.05% | 84.55–95.98% | |||
| soluble | 1 M NH4NO3 | Gál 2006 [65] | |||||
| 0.74% | |||||||
| ionically bound | strongly absorbed | carbonates, Mn, Fe, Al oxides | co-precipitated with amorphous Fe oxides | co-precipitated with crystalline Fe oxides | co-precipitated with silicates | 0.05 M (NH4)2SO4; 1 M NaH2PO4; 1 M HCl; 0.2 M NH4-oxalate; 1 M NaHCO3; 10 M HF; 16 N HNO3 +30% H2O2; HNO3:HCl:H2O = 1:3:4 | Tan et al., 2018 [64] |
| 1.56–1.67% | 14.6–24.8% | 9.02–11.1% | 2.27–3.88% | 14.7–27.3% | 0.97–1.7% | ||
| sulphidic/ organic | residual | ||||||
| 1.4–3.9% | 27.1–52.6% | ||||||
| CaCl2 | Na2HPO4 | HCl | EDTA | tartaric acid | citric acid | ||
| 0.6–0.86% | 3.05–5.1% | 2.46–6.95% | 5.99–17.7% | 9.01–14.97% | 16.25–23.72% | ||
| NH4NO3 | CaCl2 | 1M NH4NO3; 0.01 M CaCl2 | Lewińska et al., 2018 [64] | ||||
| 0.02–0.66% | 0.05–1.12% | ||||||
| water | NH4NO3 | acetic acid | EDTA | water; 1 M NH4NO3; 0.05 M EDTA; 0.43 M acetic acid | Vaculík et al., 2013 [62] | ||
| 0.03–10.11% | 0.004–1.13% | 0.11–9.33% | 0.12–10.07% | ||||
| EDTA | 0.05 M EDTA | Mariet et al., 2016 [66] | |||||
| 2.6–7.9% | |||||||
| water | CaCl2 | NH4NO3 | DTPA | Na2HPO4 | water; 0.01 M CaCl2; 1 M NH4NO3; 0.005 M DTPA; 0.1 M Na2HPO4 | Ettler et al., 2007 [59] | |
| 1.55–1.75% | 0.94–1.12% | 0.86–0.89% | 0.67–1.47% | 2.2–9.11% | |||
| SBET | PEBT Gastric | PEBT Intestinal | SBET; PEBT | Li et al., 2014 [39] | |||
| 0.13–5.67% | 0.49–13.25% | 0.44–4.57% | |||||
| DGT (μg/L) | DGT | Wang et al., 2018 [41] | |||||
| 11.55–876.6 | |||||||
| Site | Basic Information | Dominant Microbial Community | Precentage/% | Note | Environmental Drivers of Microbial Community Structure | Reference | |
|---|---|---|---|---|---|---|---|
| Chungcheongnam-do, Republic of Korea | Sb refinery | Proteobacteria | 29.6 | Gammaproteobacteria, Alphaproteobacteria | Pb might play a role in the differences in microbial community compositions; Sb content cannot explain the differences in microbial community composition. | Park et al., 2021 [68] | |
| Acidobacteria | 23.1 | ||||||
| Chloroflexi | 11.8 | ||||||
| Actinobacteria | 8.8 | ||||||
| Arthrobacter | 0.04 | Sb-oxidizing bacteria | |||||
| Bacillus | 0.38 | ||||||
| Ensifer | 0.01 | ||||||
| Comamonas | 0.05 | ||||||
| Cupriavidus | 0.14 | ||||||
| Variovorax | 0.03 | ||||||
| Acinetobacter | 0.06 | ||||||
| Pseudomonas | 0.86 | ||||||
| Stenotrophomonas | 0.02 | ||||||
| p_WPS_2 | Sb > 10,000 mg/kg | ||||||
| o_Subgroup2 | |||||||
| o_KF_JG30_C25 | |||||||
| o_Subgroup13 | |||||||
| f_Acidiferrobacteraceae | |||||||
| g_Sulfurifustis | |||||||
| o_Acidiferrobacterales | |||||||
| g_Granulicella | |||||||
| o_Betaproteobacteriales | Sb > 200 mg/kg | ||||||
| o_Acidobacteriales | |||||||
| p_Verrucomicrobia | |||||||
| Xiaohe tailing dump, Guizhou, Southwest China | Sb tailing dump | Devosia | N fixing | Assrp, Sbtot, and Sb(V)-C were the main influence factors. The relative importance of Sbexe, Sbsrp, and Asexe >10%. | Xiao et al., 2019 [70] | ||
| Cellvibrio | 3.14 | C/N, Assrp, | |||||
| Lysobacter | 4.26 | C/N, Sulfate | |||||
| Cohnella | |||||||
| Flavobacterium | 2.97 | P solubilizing | C/N, TOC, Assrp, Sb(V) | ||||
| Paenibacillus | Sb and As oxidation | ||||||
| Bacillus | 5.39 | ||||||
| Pseudomonas | 6.25 | ||||||
| Thiobacillus | |||||||
| Agrobacterium | |||||||
| Corynebacterium | |||||||
| Methylotenera | |||||||
| Mycoplana | |||||||
| Paenisporosarcina | |||||||
| Pedobacter | |||||||
| Sphingobium | 5.76 | ||||||
| Yonghaparkia | |||||||
| Janthinobacterium | 2.94 | ||||||
| Sphingomonas | 3.08 | ||||||
| Dushan County, Guizhou, Southwest China | Banpo antimony mine and Xiaohe antimony mine mmelter | Chloroflexi | Positively associated with Asrec, Astot, and Sbrec | The direct impact of As contamination fractions on bacterial community structure was greater than Sb, while the direct impact of Sb contamination fractions on bacterial function was more remarkable than As. | Huang et al., 2019 [56] | ||
| Rokubacteria | |||||||
| Proteobacteria | Negatively associated with Asrec, Astot, and Sbrec | ||||||
| Actinobacteria | |||||||
| Lengshuijiang City, Hunan Province | Yanshan Sb mine smelter | Acidobacteria | Sbtot, Astot, pH, and Eh are more important based on the RF model; different components of the microbial communities responded differently to Sb and As contamination at different soil depths. | Xu et al., 2020 [92] | |||
| Chloroflexi | |||||||
| Proteobacteria | |||||||
| Thaumarchaeota | |||||||
| Lengshuijiang City, Hunan Province | Xikuangshan Sb mine | Proteobacteria | pH, SbDGT, and AsDGT emerged as the most important factors. | Wang et al., 2018 [41] | |||
| Acidobacteria | |||||||
| Chloroflexi | |||||||
| Bacteroidetes | |||||||
| Actinobacteria | |||||||
| Gemmatimonadetes | |||||||
| Cyanobacteria | |||||||
| Lengshuijiang City, Hunan Province | Xikuangshan Sb mine | Proteobacteria | 36.2–83.2 | Deng et al., 2020 [58] | |||
| Acidobacteria | 36.2–83.2 | ||||||
| Bacteroidetes | 2.4–12.9 | ||||||
| Actinobacteria | 1.3–12.3 | ||||||
| Planctomycetes | 0.3–11.3 | ||||||
| Sideroxydans | Sbtot, Sbpavail | ||||||
| Luteolibacter | Sbavail | ||||||
| Povalibacter | Sbtot, Sbpavail, Sbavail | ||||||
| Lacibacterium | Sbavail | ||||||
| Gemmatimonas | Sbavail | ||||||
| Pirellula | Sbavail | ||||||
| Gp | Sbtot, Sbavail | ||||||
| Hydrogenophaga | Sbtot, Sbavail | ||||||
| Sphingomonas | Sbtot, Sbavail | ||||||
| Arthrobacter | Sbtot, Sbavail | ||||||
| Noviherbaspirillum | Sbtot, Sbavail | ||||||
| Escherichia/Shigella | Sbtot, Sbpavail, Sbavail | ||||||
| Arthrobacter | bioremediation potential for Sb control | ||||||
| Escherichia/Shigella | bioremediation potential for Sb control | ||||||
| Banská Štiavnica-Šobov, Zemianske Kostoľany, Smolník, Slovinky, Poproč, Slovakia | Old environmental loads from mining activities | Penicillium chrysogenum var. chrysogenum | The highest biodiversity of microfungal community was recorded in the extreme acidic environment, followed by the neutral, the ultra-acidic, and the very strong acidic ones. | Šimonovičová et al., 2019 [93] | |||
| Aspergillus niger | |||||||
| Neosartorya fischeri | |||||||
| Bionectria ochroleuca | |||||||
| Lewia infectoria | |||||||
| Phoma macrostoma | |||||||
| Phlebia acerina | |||||||
| Xiaohe Yelian smelting factory near the Dushan Sb mining area | Qinglong Sb mining area | Proteobacteria | 12–50 | The primary controlling factor of community richness was Sbtot, which explained 7% of the variation, followed by Fe(II) (6.7%) and pH (5%). | Sun et al., 2019 [79] | ||
| Alphaproteobacteria | 12.7 | Proteobacteria | |||||
| Betaproteobacteria | 7.6 | ||||||
| Gammaproteobacteria | 5 | ||||||
| Deltaproteobacteria | 3.5 | ||||||
| Acidobacteria | 7.9–68 | ||||||
| Actinobacteria | |||||||
| Chloroflexi | |||||||
| Planctomycetes | |||||||
| Bacteroidetes, | |||||||
| Firmicutes | |||||||
| Geobacter | As(V)-reducing bacteria | ||||||
| Pseudomonas | As(V)-reducing or As(III)-oxidizing bacteria | ||||||
| Geobacter | core microbiota in soils contaminated by As and Sb | ||||||
| Pseudomonas | |||||||
| Janthinobacterium | Sb-rich habitats | ||||||
| Bradyrhizobium | contain known nitrogen fixing members | ||||||
| Rhodoplanes | |||||||
| Burkholderia | |||||||
| Clostridium | |||||||
| Corynebacterium | |||||||
Disclaimer/Publisher’s Note: The statements, opinions and data contained in all publications are solely those of the individual author(s) and contributor(s) and not of MDPI and/or the editor(s). MDPI and/or the editor(s) disclaim responsibility for any injury to people or property resulting from any ideas, methods, instructions or products referred to in the content. |
© 2022 by the authors. Licensee MDPI, Basel, Switzerland. This article is an open access article distributed under the terms and conditions of the Creative Commons Attribution (CC BY) license (https://creativecommons.org/licenses/by/4.0/).
Share and Cite
Zhao, S.; Shi, T.; Terada, A.; Riya, S. Evaluation of Pollution Level, Spatial Distribution, and Ecological Effects of Antimony in Soils of Mining Areas: A Review. Int. J. Environ. Res. Public Health 2023, 20, 242. https://doi.org/10.3390/ijerph20010242
Zhao S, Shi T, Terada A, Riya S. Evaluation of Pollution Level, Spatial Distribution, and Ecological Effects of Antimony in Soils of Mining Areas: A Review. International Journal of Environmental Research and Public Health. 2023; 20(1):242. https://doi.org/10.3390/ijerph20010242
Chicago/Turabian StyleZhao, Shuting, Taoran Shi, Akihiko Terada, and Shohei Riya. 2023. "Evaluation of Pollution Level, Spatial Distribution, and Ecological Effects of Antimony in Soils of Mining Areas: A Review" International Journal of Environmental Research and Public Health 20, no. 1: 242. https://doi.org/10.3390/ijerph20010242