The Relationship between Obesity and Childhood Dental Caries in the United States


Abstract
:1. Introduction
2. Materials and Methods
2.1. Study Population
2.2. Variables Selected
2.3. Statistical Analysis
3. Results
4. Discussion
5. Conclusions
Author Contributions
Funding
Institutional Review Board Statement
Informed Consent Statement
Data Availability Statement
Conflicts of Interest
References
- Abarca-Gómez, L.; Abdeen, Z.A.; Hamid, Z.A.; Abu-Rmeileh, N.M.; Acosta-Cazares, B.; Acuin, C.; Adams, R.J.; Aekplakorn, W.; Afsana, K.; Aguilar-Salinas, C.A.; et al. Worldwide trends in body-mass index, underweight, overweight, and obesity from 1975 to 2016: A pooled analysis of 2416 population-based measurement studies in 128·9 million children, adolescents, and adults. Lancet 2017, 390, 2627–2642. [Google Scholar] [CrossRef] [Green Version]
- Tinanoff, N.; Baez, R.J.; Diaz Guillory, C.; Donly, K.J.; Feldens, C.A.; McGrath, C.; Phantumvanit, P.; Pitts, N.B.; Seow, W.K.; Sharkov, N.; et al. Early childhood caries epidemiology, aetiology, risk assessment, societal burden, management, education, and policy: Global perspective. Int. J. Paediatr. Dent. 2019, 29, 238–248. [Google Scholar] [CrossRef] [PubMed]
- World Health Organization. Fact Sheet: Overweight and Obesity; World Health Organization: Geneva, Switzerland, 2020.
- United Nations Children’s Fund; World Health Organization; World Bank Group. Levels and Trends in Child Malnutrition: UNICEF/WHO/The World Bank Group Joint Child Malnutrition Estimates: Key Findings of the 2021 Edition; World Health Organization: Geneva, Switzerland, 2022.
- Bernabe, E.; Marcenes, W.; Hernandez, C.R.; Bailey, J.; Abreu, L.G.; Alipour, V.; Amini, S.; Arabloo, J.; Arefi, Z.; Arora, A.; et al. Global, Regional, and National Levels and Trends in Burden of Oral Conditions from 1990 to 2017: A Systematic Analysis for the Global Burden of Disease 2017 Study. J. Dent. Res. 2020, 99, 362–373. [Google Scholar] [CrossRef] [Green Version]
- Chen, D.; Zhi, Q.; Zhou, Y.; Tao, Y.; Wu, L.; Lin, H. Association between Dental Caries and BMI in Children: A Systematic Review and Meta-Analysis. Caries Res. 2018, 52, 230–245. [Google Scholar] [CrossRef] [PubMed]
- Paisi, M.; Kay, E.; Bennett, C.; Kaimi, I.; Witton, R.; Nelder, R.; Lapthorne, D. Body mass index and dental caries in young people: A systematic review. BMC Pediatr. 2019, 19, 122. [Google Scholar] [CrossRef]
- Angelopoulou, M.V.; Beinlich, M.; Crain, A. Early Childhood Caries and Weight Status: A Systematic Review and Meta-Analysis. Pediatr. Dent. 2019, 41, 261–272. [Google Scholar]
- Manohar, N.; Hayen, A.; Fahey, P.; Arora, A. Obesity and dental caries in early childhood: A systematic review and meta-analyses. Obes. Rev. 2020, 21, e12960. [Google Scholar] [CrossRef]
- Vazquez, C.E.; Cubbin, C. Socioeconomic Status and Childhood Obesity: A Review of Literature from the Past Decade to Inform Intervention Research. Curr. Obes. Rep. 2020, 9, 562–570. [Google Scholar] [CrossRef]
- Moores, C.J.; Kelly, S.A.M.; Moynihan, P.J. Systematic Review of the Effect on Caries of Sugars Intake: Ten-Year Update. J. Dent. Res. 2022, 101, 1034–1045. [Google Scholar] [CrossRef]
- Abbasalizad Farhangi, M.; Mohammadi Tofigh, A.; Jahangiri, L.; Nikniaz, Z.; Nikniaz, L. Sugar-sweetened beverages intake and the risk of obesity in children: An updated systematic review and dose-response meta-analysis. Pediatr. Obes. 2022, 17, e12914. [Google Scholar] [CrossRef]
- Coker, M.O.; Lebeaux, R.M.; Hoen, A.G.; Moroishi, Y.; Gilbert-Diamond, D.; Dade, E.F.; Palys, T.J.; Madan, J.C.; Karagas, M.R. Metagenomic analysis reveals associations between salivary microbiota and body composition in early childhood. Sci. Rep. 2022, 12, 13075. [Google Scholar] [CrossRef] [PubMed]
- Hatipoglu, O.; Maras, E.; Hatipoglu, F.P.; Saygin, A.G. Salivary flow rate, pH, and buffer capacity in the individuals with obesity and overweight; A meta-analysis. Niger. J. Clin. Pr. 2022, 25, 1126–1142. [Google Scholar] [CrossRef] [PubMed]
- Leme, L.; Rizzardi, K.F.; Santos, I.B.; Parisotto, T.M. Exploring the Relationship between Salivary Levels of TNF-α, Lactobacillus acidophilus, Lactobacillus gasseri, Obesity, and Caries in Early Childhood. Pathogens 2022, 11, 579. [Google Scholar] [CrossRef] [PubMed]
- Marshall, T.A.; Eichenberger-Gilmore, J.M.; Broffitt, B.A.; Warren, J.J.; Levy, S.M. Dental caries and childhood obesity: Roles of diet and socioeconomic status. Community Dent. Oral Epidemiol. 2007, 35, 449–458. [Google Scholar] [CrossRef] [PubMed]
- von Philipsborn, P.; Stratil, J.M.; Burns, J.; Busert, L.K.; Pfadenhauer, L.M.; Polus, S.; Holzapfel, C.; Hauner, H.; Rehfuess, E. Environmental interventions to reduce the consumption of sugar-sweetened beverages and their effects on health. Cochrane Database Syst. Rev. 2019, 6, Cd012292. [Google Scholar] [CrossRef] [PubMed]
- Sheiham, A.; Watt, R.G. The common risk factor approach: A rational basis for promoting oral health. Community Dent. Oral Epidemiol. 2000, 28, 399–406. [Google Scholar] [CrossRef]
- Center for Disease Control and Prevention. NHANES Response Rates and Population Totals; National Center for Health Statistics: Hyattsville, MD, USA, 2022.
- Radike, A.W. Criteria for diagnosing dental caries. In Proceedings of the Conference on the Clinical Testing of Cariostatic Agents, Chicago, IL, USA, 14–16 October 1968; American Dental Association: Chicago, IL, USA, 1972; pp. 87–88. [Google Scholar]
- Dye, B.A.; Afful, J.; Thornton-Evans, G.; Iafolla, T. Overview and quality assurance for the oral health component of the National Health and Nutrition Examination Survey (NHANES), 2011–2014. BMC Oral Health 2019, 19, 95. [Google Scholar] [CrossRef] [Green Version]
- Center for Disease Control and Prevention. NHANES Anthropometry Procedures Manual; National Center for Health Statistics: Hyattsville, MD, USA, 2011; Volume 2022.
- WHO Multicentre Growth Reference Study Group. WHO Child Growth Standards based on length/height, weight and age. Acta Paediatr. Suppl. 2006, 450, 76–85. [Google Scholar] [CrossRef]
- de Onis, M.; Onyango, A.W.; Borghi, E.; Siyam, A.; Nishida, C.; Siekmann, J. Development of a WHO growth reference for school-aged children and adolescents. Bull. World Health Organ. 2007, 85, 660–667. [Google Scholar] [CrossRef]
- Kuczmarski, R.J.; Ogden, C.L.; Guo, S.S.; Grummer-Strawn, L.M.; Flegal, K.M.; Mei, Z.; Wei, R.; Curtin, L.R.; Roche, A.F.; Johnson, C.L. 2000 CDC Growth Charts for the United States: Methods and development. Vital Health Stat. 2002, 246, 1–190. [Google Scholar]
- Cole, T.J.; Lobstein, T. Extended international (IOTF) body mass index cut-offs for thinness, overweight and obesity. Pediatr. Obes. 2012, 7, 284–294. [Google Scholar] [CrossRef]
- Ahluwalia, N.; Dwyer, J.; Terry, A.; Moshfegh, A.; Johnson, C. Update on NHANES Dietary Data: Focus on Collection, Release, Analytical Considerations, and Uses to Inform Public Policy. Adv. Nutr. 2016, 7, 121–134. [Google Scholar] [CrossRef] [PubMed]
- Bowman, S.A.; Clemens, J.C.; Shimizu, M.; Friday, J.E.; Moshfegh, A.J. Food Patterns Equivalents Database 2015–2016: Methodology and User Guide [Online]; Food Surveys Research Group, Beltsville Human Nutrition Research Center, Agricultural Research Service, U.S. Department of Agriculture: Beltsville, MD, USA, 2018.
- Bowman, S.A. Added sugars: Definition and estimation in the USDA Food Patterns Equivalents Databases. J. Food Compos. Anal. 2017, 64, 64–67. [Google Scholar] [CrossRef]
- Willett, W.C.; Howe, G.R.; Kushi, L.H. Adjustment for total energy intake in epidemiologic studies. Am. J. Clin. Nutr. 1997, 65, 1220S–1228S; discussion 1229S–1231S. [Google Scholar] [CrossRef] [PubMed] [Green Version]
- Llorca-Colomer, F.; Murillo-Llorente, M.T.; Legidos-García, M.E.; Palau-Ferré, A.; Pérez-Bermejo, M. Differences in Classification Standards for the Prevalence of Overweight and Obesity in Children. A Systematic Review and Meta-Analysis. Clin. Epidemiol. 2022, 14, 1031–1052. [Google Scholar] [CrossRef]
- Hayden, C.; Bowler, J.O.; Chambers, S.; Freeman, R.; Humphris, G.; Richards, D.; Cecil, J.E. Obesity and dental caries in children: A systematic review and meta-analysis. Community Dent. Oral Epidemiol. 2013, 41, 289–308. [Google Scholar] [CrossRef]
- Cole, T.J.; Lobstein, T. An improved algorithm to harmonize child overweight and obesity prevalence rates. Pediatr. Obes. 2022, e12970. [Google Scholar] [CrossRef]
- Ravaghi, V.; Rezaee, A.; Pallan, M.; Morris, A.J. Childhood obesity and dental caries: An ecological investigation of the shape and moderators of the association. BMC Oral Health 2020, 20, 338. [Google Scholar] [CrossRef]
- Elger, W.; Kiess, W.; Körner, A.; Schrock, A.; Vogel, M.; Hirsch, C. Influence of overweight/obesity, socioeconomic status, and oral hygiene on caries in primary dentition. J. Investig. Clin. Dent. 2019, 10, e12394. [Google Scholar] [CrossRef]
- Kopycka-Kedzierawski, D.T.; Auinger, P.; Billings, R.J.; Weitzman, M. Caries status and overweight in 2- to 18-year-old US children: Findings from national surveys. Community Dent. Oral Epidemiol. 2008, 36, 157–167. [Google Scholar] [CrossRef]
- Hong, L.; Ahmed, A.; McCunniff, M.; Overman, P.; Mathew, M. Obesity and dental caries in children aged 2-6 years in the United States: National Health and Nutrition Examination Survey 1999–2002. J. Public Health Dent. 2008, 68, 227–233. [Google Scholar] [CrossRef] [PubMed]
- Macek, M.D.; Mitola, D.J. Exploring the association between overweight and dental caries among US children. Pediatr. Dent. 2006, 28, 375–380. [Google Scholar] [PubMed]
- Chi, D.L.; Luu, M.; Chu, F. A scoping review of epidemiologic risk factors for pediatric obesity: Implications for future childhood obesity and dental caries prevention research. J. Public Health Dent. 2017, 77 (Suppl. 1), S8–S31. [Google Scholar] [CrossRef] [PubMed] [Green Version]
- Bernabé, E.; Ballantyne, H.; Longbottom, C.; Pitts, N.B. Early Introduction of Sugar-Sweetened Beverages and Caries Trajectories from Age 12 to 48 Months. J. Dent. Res. 2020, 99, 898–906. [Google Scholar] [CrossRef] [PubMed]


| n | % | dt | dft | |||
|---|---|---|---|---|---|---|
| Mean | (SD) | Mean | (SD) | |||
| Child sex | ||||||
| Boys | 1117 | 49.1 | 0.38 | (1.56) | 1.10 | (2.96) |
| Girls | 1158 | 50.9 | 0.27 | (1.36) | 0.92 | (2.82) |
| p value a | 0.084 | 0.172 | ||||
| Child age | ||||||
| 2 years | 659 | 24.5 | 0.21 | (1.30) | 0.27 | (1.49) |
| 3 years | 533 | 26.1 | 0.29 | (1.31) | 0.70 | (2.25) |
| 4 years | 550 | 24.9 | 0.38 | (1.49) | 1.11 | (2.98) |
| 5 years | 533 | 24.6 | 0.41 | (1.66) | 1.96 | (3.74) |
| p value for trend | 0.025 | <0.001 | ||||
| Child race/ethnicity | ||||||
| Non-Hispanic White | 669 | 52.5 | 0.24 | (0.97) | 0.75 | (1.89) |
| Non-Hispanic Black | 576 | 13.6 | 0.38 | (2.05) | 1.06 | (3.87) |
| Hispanic | 655 | 23.5 | 0.41 | (1.65) | 1.54 | (3.91) |
| Asian | 193 | 4.0 | 0.52 | (3.13) | 1.12 | (4.71) |
| Other | 182 | 6.4 | 0.48 | (2.13) | 0.96 | (2.87) |
| p value | 0.250 | 0.017 | ||||
| Poverty income ratio | ||||||
| <1.00 | 817 | 28.1 | 0.59 | (2.25) | 1.55 | (3.92) |
| 1.00–1.99 | 610 | 25.3 | 0.35 | (1.56) | 1.01 | (2.83) |
| 2.00–2.99 | 317 | 14.9 | 0.22 | (1.00) | 1.13 | (3.28) |
| ≥3 | 531 | 31.6 | 0.12 | (0.73) | 0.46 | (1.60) |
| p value for trend | <0.001 | <0.001 | ||||
| Parental education | ||||||
| Below high school | 472 | 15.8 | 0.54 | (2.15) | 1.92 | (4.40) |
| High school | 1246 | 53.5 | 0.41 | (1.66) | 1.08 | (3.00) |
| Above high school | 557 | 30.7 | 0.06 | (0.50) | 0.40 | (1.58) |
| p value for trend | <0.001 | <0.001 | ||||
| Child intake of added sugars | ||||||
| Q1 (lowest) | 666 | 29.2 | 0.27 | (1.29) | 0.87 | (2.60) |
| Q2 | 811 | 36.6 | 0.31 | (1.44) | 0.90 | (2.72) |
| Q3 | 576 | 25.0 | 0.39 | (1.61) | 1.22 | (3.26) |
| Q4 (highest) | 222 | 9.3 | 0.36 | (1.63) | 1.25 | (3.30) |
| p value trend | 0.215 | 0.023 | ||||
| WHO Standards | CDC Standards | IOTF Standards | ||||
|---|---|---|---|---|---|---|
| n | % | n | % | n | % | |
| Child sex | ||||||
| Boys | 108 | 9.9 | 121 | 10.9 | 55 | 5.5 |
| Girls | 112 | 9.2 | 134 | 11.6 | 74 | 6.3 |
| p value b | 0.665 | 0.723 | 0.531 | |||
| Child age | ||||||
| 2 years | 58 | 8.8 | 55 | 8.3 | 19 | 2.7 |
| 3 years | 43 | 6.4 | 52 | 8.1 | 18 | 3.2 |
| 4 years | 52 | 10.1 | 69 | 13.5 | 36 | 6.5 |
| 5 years | 67 | 12.9 | 79 | 15.2 | 56 | 11.3 |
| p value for trend | 0.035 | 0.006 | <0.001 | |||
| Child race/ethnicity | ||||||
| Non-Hispanic White | 51 | 7.4 | 63 | 9.2 | 30 | 4.2 |
| Non-Hispanic Black | 58 | 10.7 | 62 | 11.4 | 32 | 6.9 |
| Hispanic | 90 | 15.2 | 105 | 17.7 | 55 | 9.9 |
| Asian | 7 | 3.6 | 9 | 4.7 | 3 | 1.7 |
| O ther | 14 | 6.5 | 16 | 8.3 | 9 | 5.2 |
| p value | <0.001 | <0.001 | 0.003 | |||
| Poverty income ratio | ||||||
| <1.00 | 91 | 12.0 | 100 | 12.6 | 55 | 8.1 |
| 1.00–1.99 | 64 | 10.3 | 80 | 13.3 | 40 | 6.7 |
| 2.00–2.99 | 35 | 11.1 | 38 | 13.2 | 19 | 6.2 |
| ≥3 | 30 | 5.9 | 37 | 7.5 | 15 | 3.0 |
| p value for trend | 0.031 | 0.076 | 0.029 | |||
| Parental education | ||||||
| Below high school | 64 | 13.0 | 69 | 13.2 | 34 | 7.2 |
| High school | 127 | 10.7 | 151 | 13.4 | 79 | 7.4 |
| Above high school | 29 | 5.7 | 35 | 6.5 | 16 | 2.5 |
| p value for trend | 0.004 | 0.002 | 0.002 | |||
| Child intake of added sugars | ||||||
| Q1 (lowest) | 54 | 6.9 | 60 | 8.5 | 23 | 3.2 |
| Q2 | 79 | 9.5 | 90 | 10.7 | 51 | 6.5 |
| Q3 | 62 | 11.6 | 72 | 14.1 | 37 | 6.9 |
| Q4 (highest) | 25 | 12.2 | 33 | 14.7 | 18 | 9.0 |
| p value for trend | 0.097 | 0.036 | 0.044 | |||
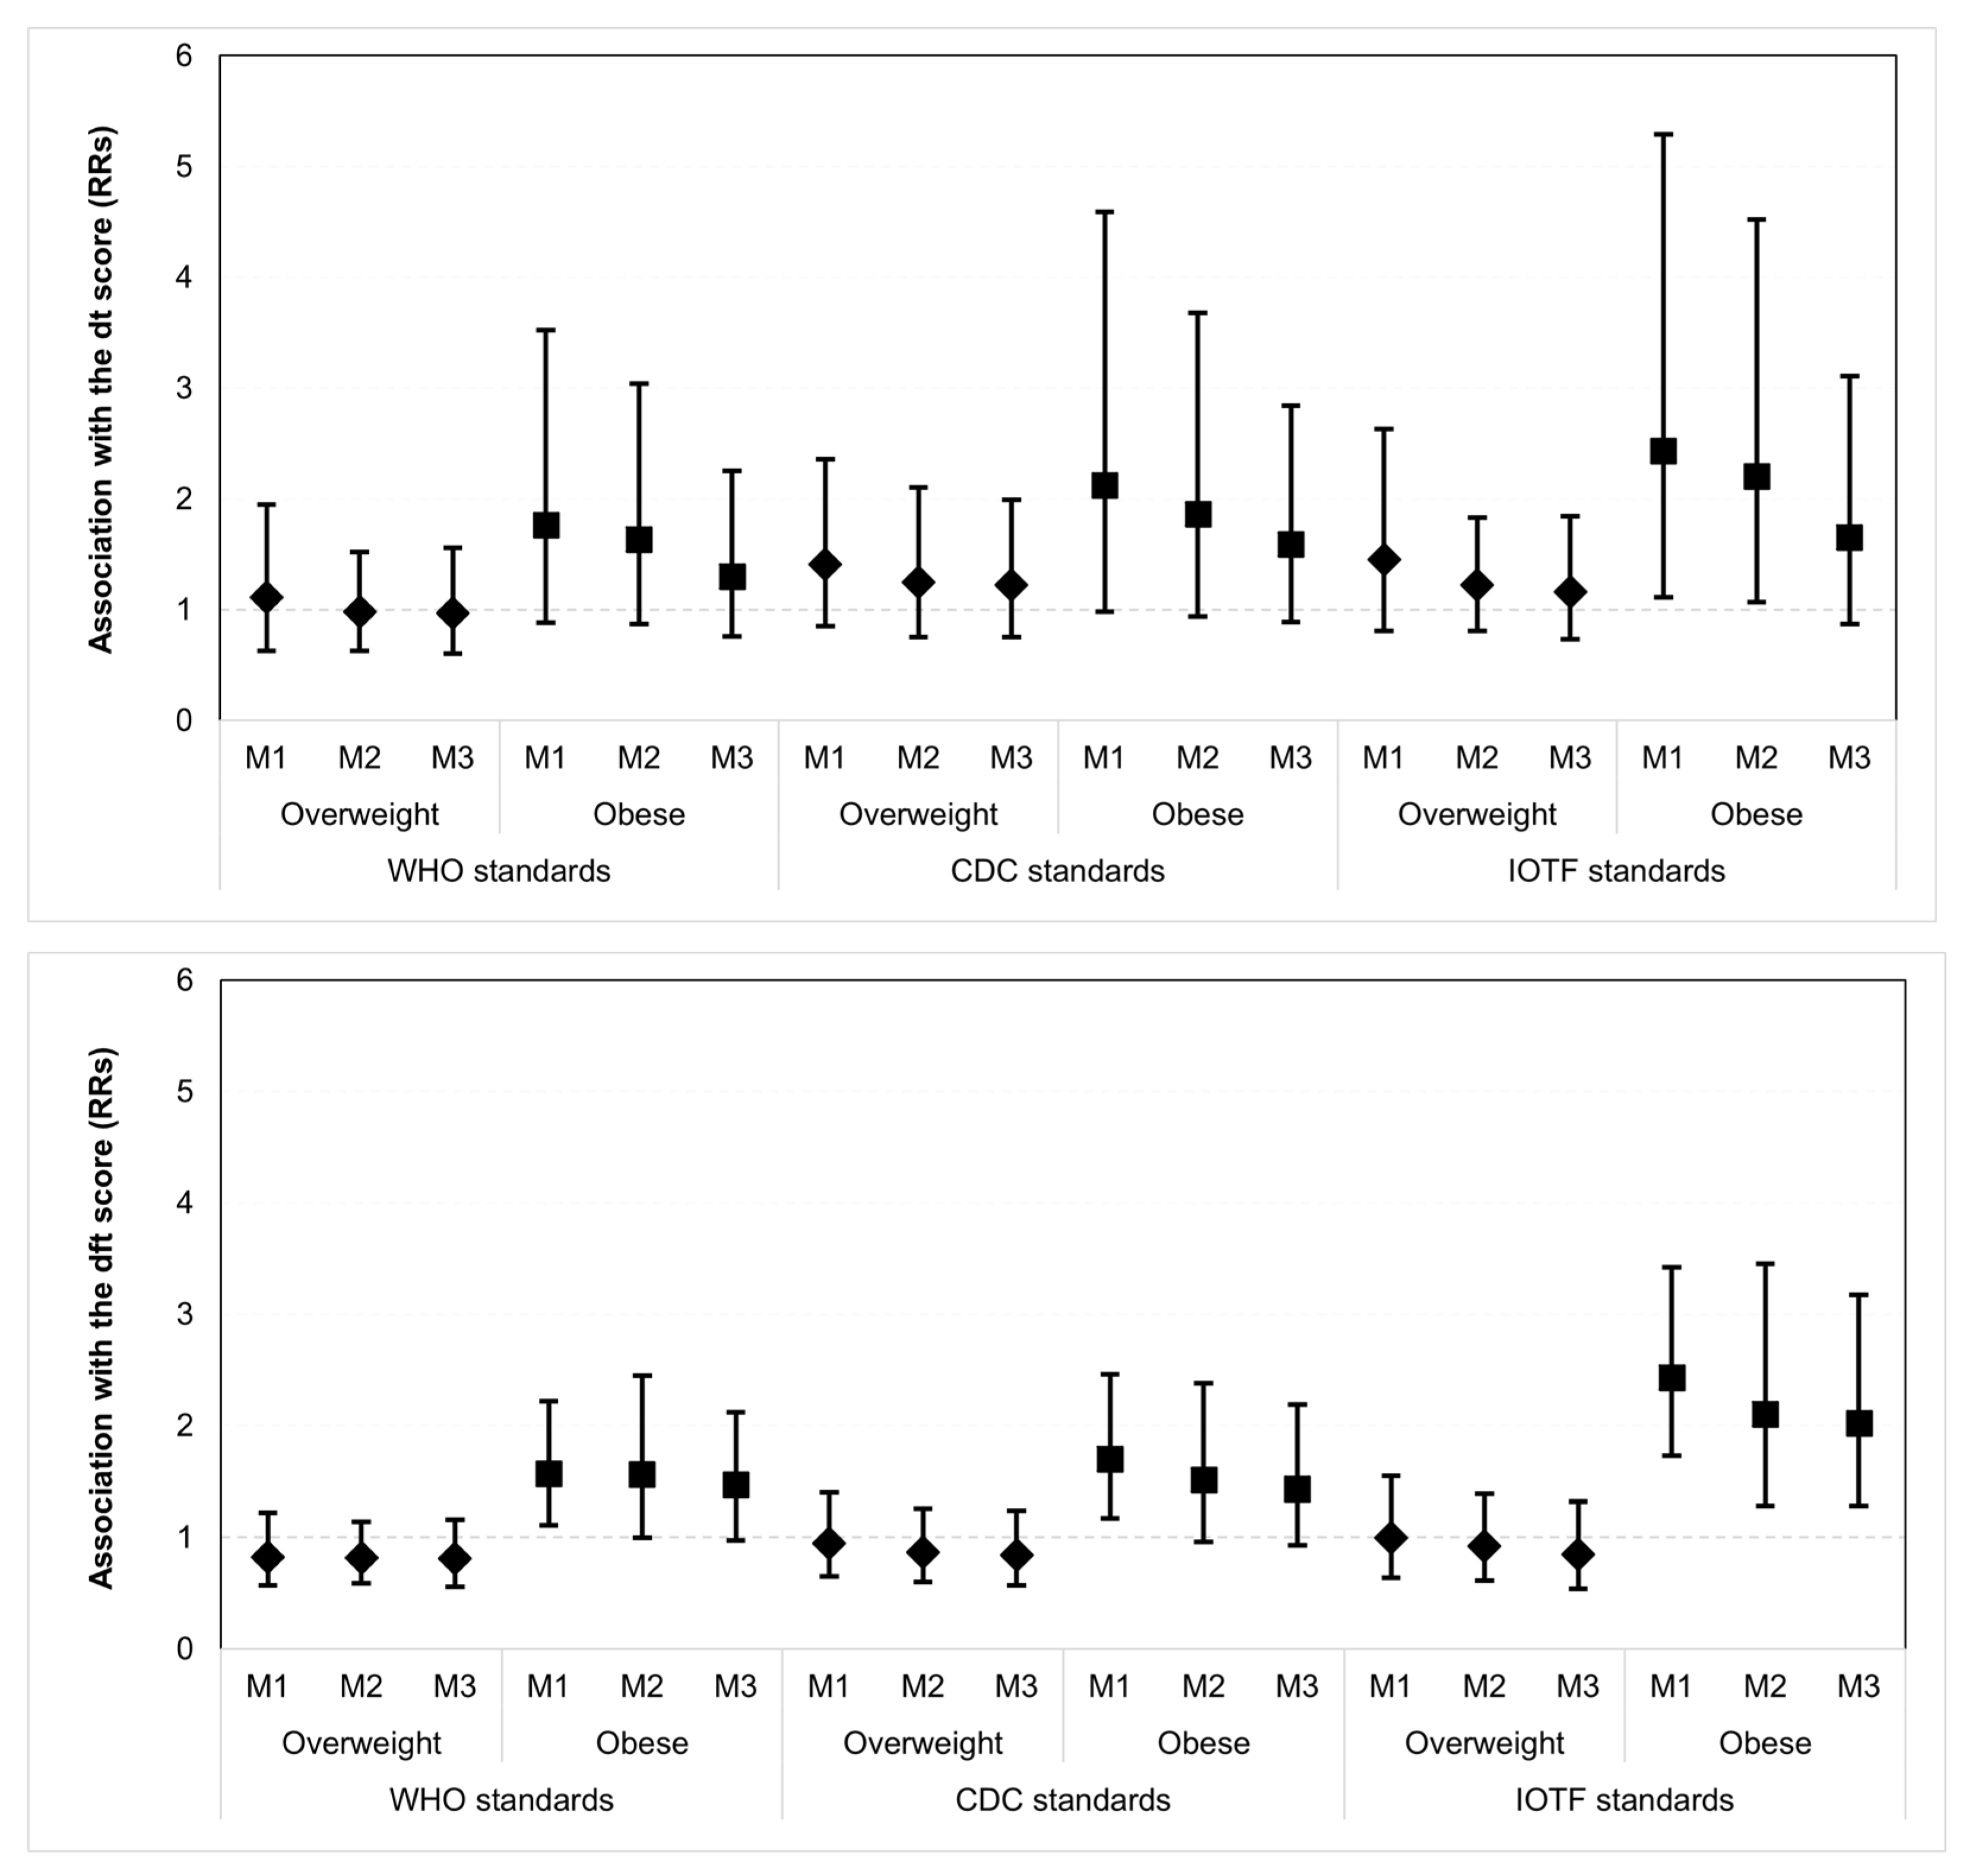
| Mean | (SD) | Model 1 | Model 2 | Model 3 | |
|---|---|---|---|---|---|
| RR [95%CI] | RR [95%CI] | RR [95%CI] | |||
| Untreated Caries: | |||||
| WHO standards | |||||
| Normal | 0.29 | (1.41) | 1.00 [Reference] | 1.00 [Reference] | 1.00 [Reference] |
| Overweight | 0.33 | (1.27) | 1.11 [0.63–1.95] | 0.98 [0.63–1.52] | 0.97 [0.60–1.56] |
| Obese | 0.52 | (2.10) | 1.76 [0.88–3.52] | 1.63 [0.87–3.04] | 1.30 [0.76–2.25] |
| Underweight | 0.97 | (3.70) | 3.31 [0.58–18.75] | 2.58 [0.42–15.95] | 1.42 [0.27–7.41] |
| CDC standards | |||||
| Normal | 0.27 | (1.29) | 1.00 [Reference] | 1.00 [Reference] | 1.00 [Reference] |
| Overweight | 0.38 | (1.32) | 1.41 [0.85–2.36] | 1.25 [0.75–2.10] | 1.22 [0.75–1.99] |
| Obese | 0.56 | (2.10) | 2.12 [0.98–4.59] | 1.86 [0.94–3.68] | 1.59 [0.89–2.84] |
| Underweight | 0.55 | (2.68) | 2.07 [0.85–5.06] | 1.63 [0.68–3.89] | 1.37 [0.67–2.81] |
| IOTF standards | |||||
| Normal | 0.28 | (1.31) | 1.00 [Reference] | 1.00 [Reference] | 1.00 [Reference] |
| Overweight | 0.41 | (1.46) | 1.45 [0.81–2.63] | 1.22 [0.81–1.83] | 1.16 [0.73–1.84] |
| Obese | 0.68 | (2.36) | 2.43 [1.11–5.29] * | 2.20 [1.07–4.52] * | 1.65 [0.87–3.11] |
| Underweight | 0.35 | (1.88) | 1.26 [0.67–2.37] | 0.92 [0.53–1.62] | 0.93 [0.52–1.68] |
| Caries Experience: | |||||
| WHO standards | |||||
| Normal | 0.99 | (2.96) | 1.00 [Reference] | 1.00 [Reference] | 1.00 [Reference] |
| Overweight | 0.82 | (2.32) | 0.83 [0.57–1.22] | 0.82 [0.59–1.14] | 0.81 [0.56–1.16] |
| Obese | 1.56 | (3.66) | 1.57 [1.11–2.22] * | 1.56 [1.00–2.45] | 1.47 [0.97–2.12] |
| Underweight | 1.08 | (3.78) | 1.09 [0.22–5.28] | 0.69 [0.15–3.19] | 0.42 [0.11–1.66] |
| CDC standards | |||||
| Normal | 0.93 | (2.82) | 1.00 [Reference] | 1.00 [Reference] | 1.00 [Reference] |
| Overweight | 0.88 | (2.36) | 0.95 [0.65–1.40] | 0.87 [0.60–1.26] | 0.84 [0.57–1.24] |
| Obese | 1.58 | (3.57) | 1.70 [1.17–2.46] * | 1.51 [0.96–2.38] | 1.43 [0.93–2.19] |
| Underweight | 1.21 | (4.08) | 1.30 [0.66–2.55] | 1.15 [0.52–2.55] | 0.83 [0.45–1.54] |
| IOTF standards | |||||
| Normal | 0.90 | (2.69) | 1.00 [Reference] | 1.00 [Reference] | 1.00 [Reference] |
| Overweight | 0.90 | (2.37) | 1.00 [0.64–1.55] | 0.92 [0.61–1.39] | 0.85 [0.54–1.32] |
| Obese | 2.19 | (4.12) | 2.43 [1.73–3.42] * | 2.10 [1.28–3.45] * | 2.02 [1.28–3.17] * |
| Underweight | 1.29 | (4.15) | 1.43 [0.85–2.40] | 1.16 [0.67–2.02] | 1.01 [0.59–1.73] |
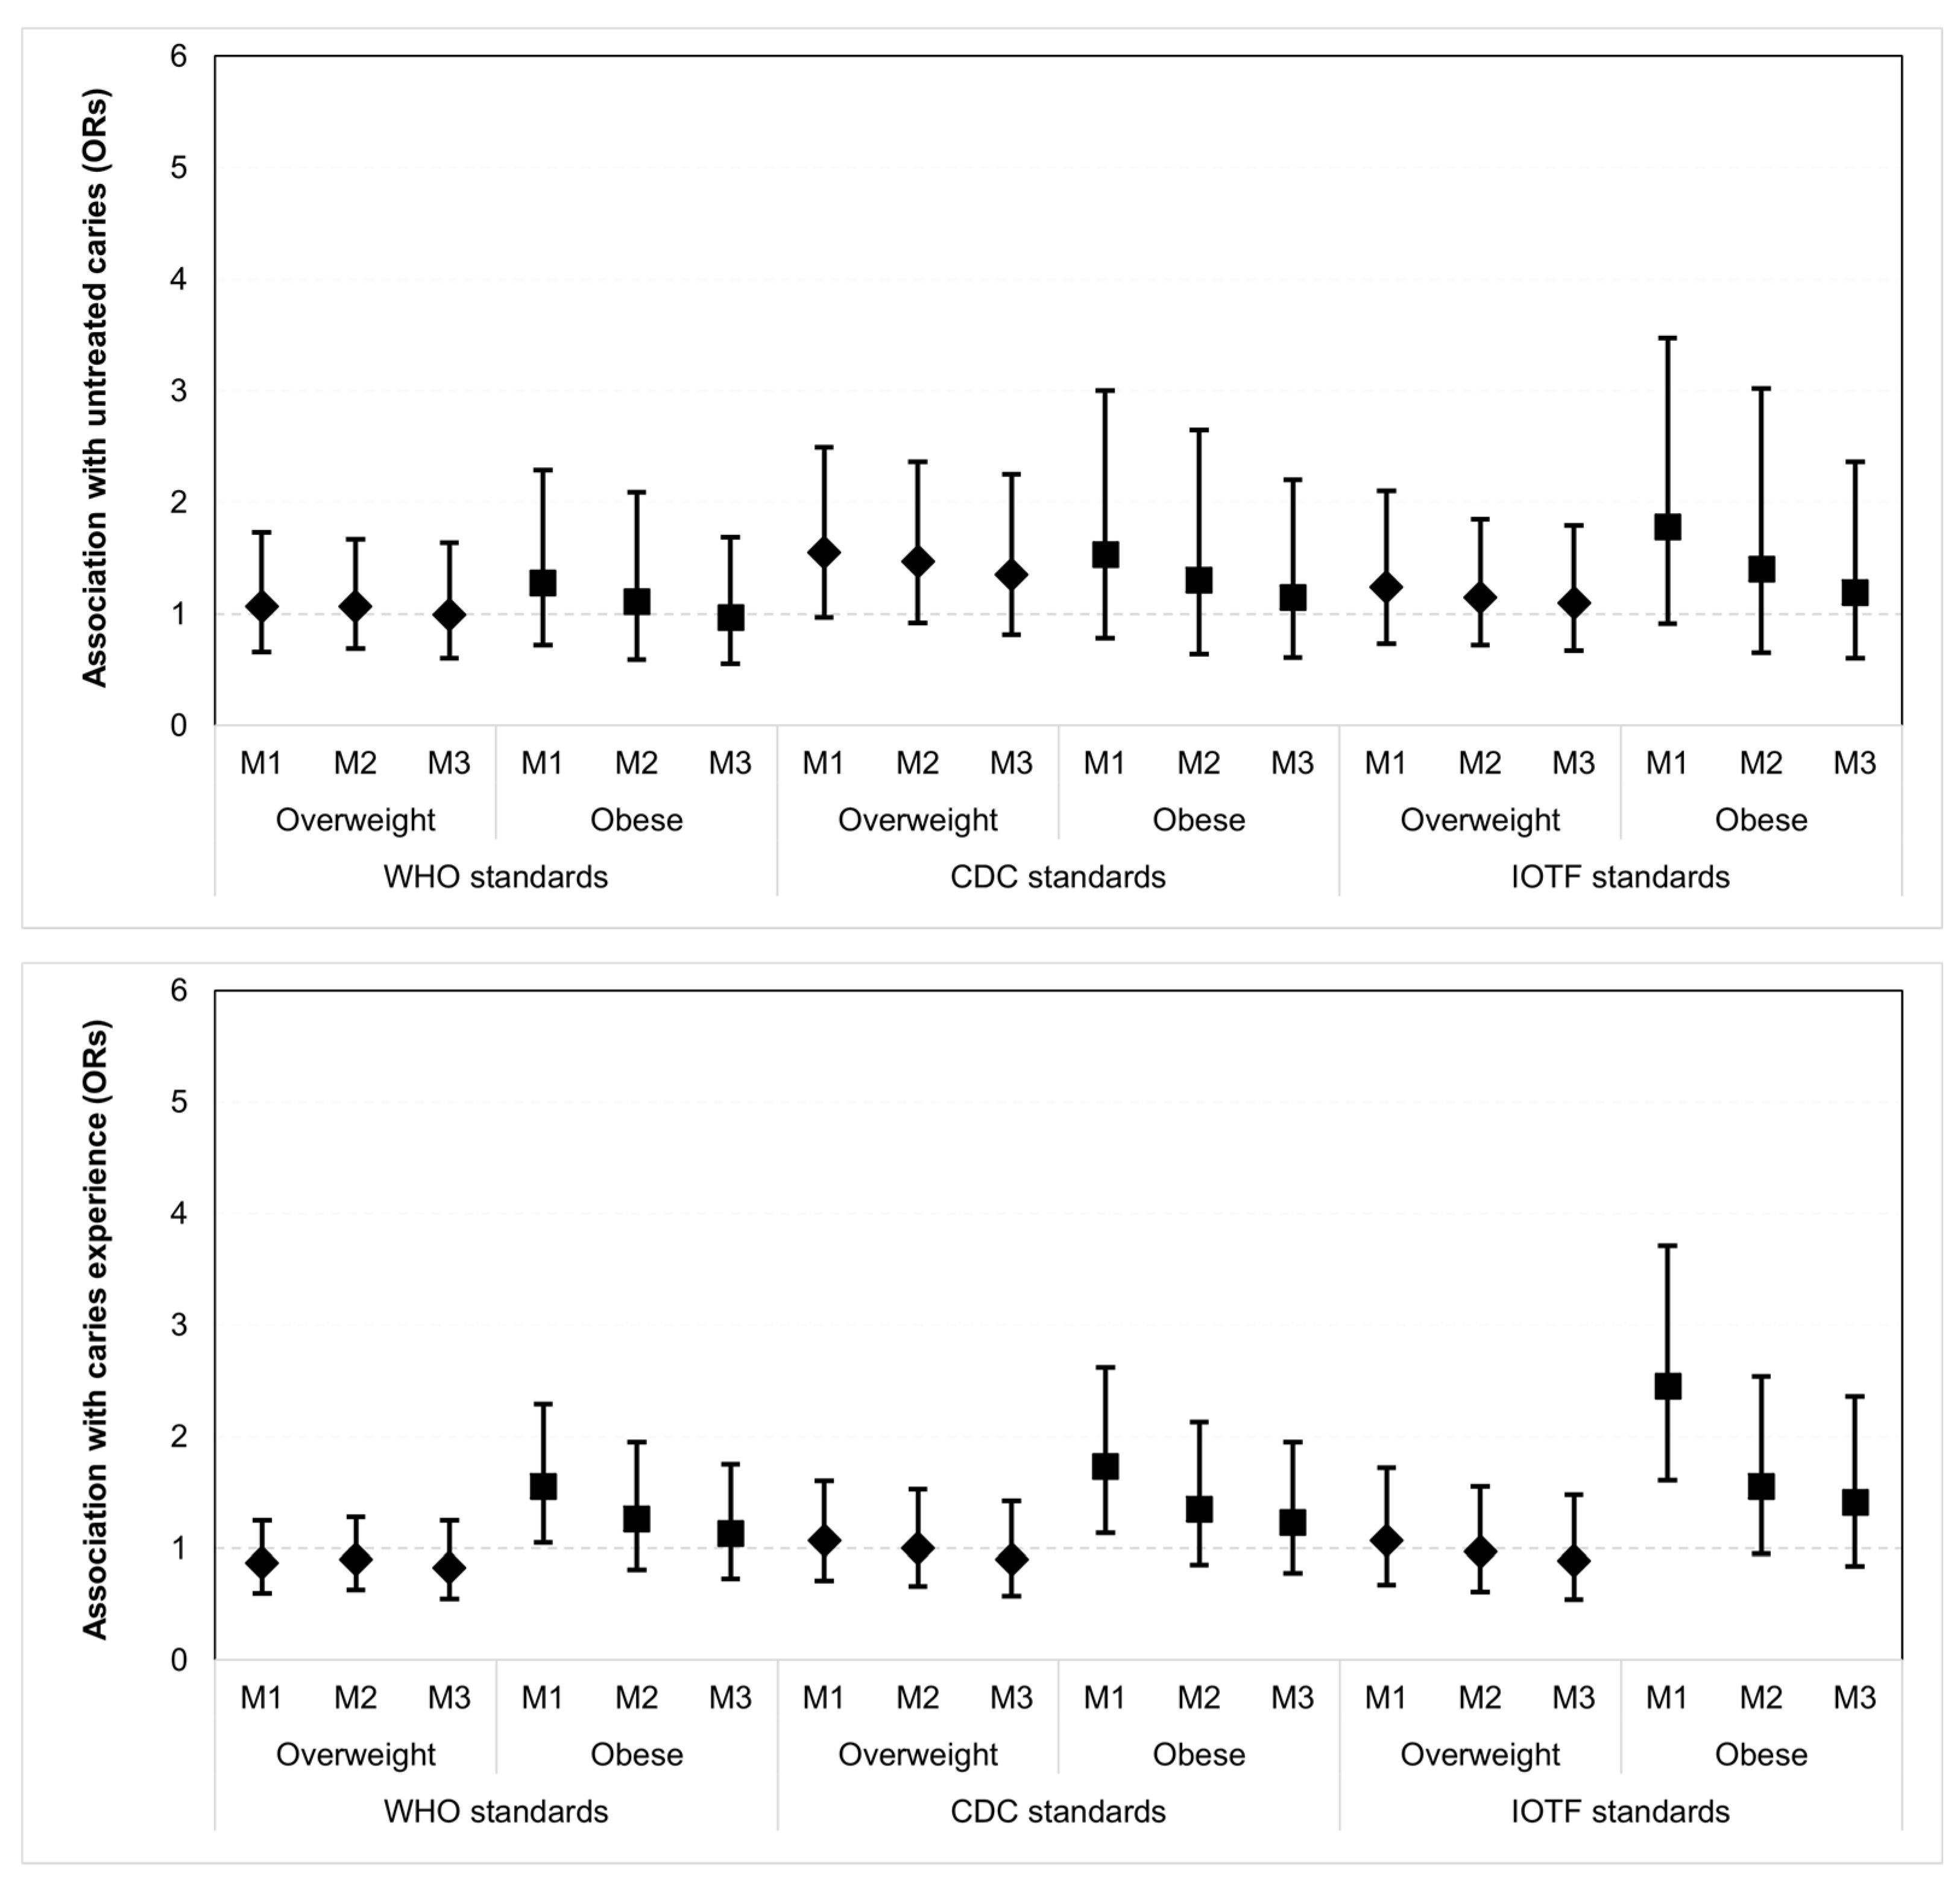
| n | % | Model 1 | Model 2 | Model 3 | |
|---|---|---|---|---|---|
| OR [95%CI] | OR [95%CI] | OR [95%CI] | |||
| Untreated Caries: | |||||
| WHO standards | |||||
| Normal | 190 | 10.0 | Reference | Reference | Reference |
| Overweight | 53 | 10.6 | 1.07 [0.66–1.73] | 1.07 [0.69–1.67] | 0.99 [0.60–1.64] |
| Obese | 29 | 12.5 | 1.28 [0.72–2.29] | 1.11 [0.59–2.09] | 0.97 [0.55–1.69] |
| Underweight | 2 | 20.5 | 2.31 [0.38–14.0] | 1.75 [0.25–12.0] | 1.46 [0.27–7.94] |
| CDC standards | |||||
| Normal | 183 | 9.3 | Reference | Reference | Reference |
| Overweight | 40 | 13.6 | 1.55 [0.97–2.49] | 1.47 [0.92–2.36] | 1.35 [0.81–2.25] |
| Obese | 38 | 13.5 | 1.53 [0.78–3.00] | 1.30 [0.64–2.65] | 1.15 [0.61–2.20] |
| Underweight | 13 | 10.8 | 1.19 [0.58–2.45] | 1.17 [0.58–2.37] | 1.35 [0.64–2.86] |
| IOTF standards | |||||
| Normal | 189 | 9.8 | Reference | Reference | Reference |
| Overweight | 38 | 11.8 | 1.24 [0.73–2.10] | 1.15 [0.72–1.85] | 1.10 [0.67–1.79] |
| Obese | 20 | 16.2 | 1.78 [0.91–3.47] | 1.40 [0.65–3.02] | 1.19 [0.60–2.36] |
| Underweight | 27 | 10.1 | 1.04 [0.58–1.85] | 0.95 [0.54–1.68] | 1.07 [0.57–2.00] |
| Caries Experience: | |||||
| WHO standards | |||||
| Normal | 377 | 21.7 | Reference | Reference | Reference |
| Overweight | 107 | 19.3 | 0.87 [0.60–1.25] | 0.90 [0.63–1.28] | 0.83 [0.55–1.25] |
| Obese | 58 | 30.0 | 1.55 [1.05–2.29] * | 1.26 [0.81–1.95] | 1.13 [0.73–1.75] |
| Underweight | 2 | 20.5 | 0.93 [0.15–5.67] | 0.65 [0.11–3.90] | 0.56 [1.22–2.61] |
| CDC standards | |||||
| Normal | 378 | 20.7 | Reference | Reference | Reference |
| Overweight | 73 | 21.7 | 1.07 [0.71–1.60] | 1.00 [0.66–1.53] | 0.90 [0.57–1.42] |
| Obese | 73 | 31.1 | 1.73 [1.14–2.62] * | 1.35 [0.85–2.13] | 1.23 [0.78–1.95] |
| Underweight | 20 | 17.9 | 0.84 [0.43–1.63] | 0.87 [0.44–1.73] | 1.00 [0.56–1.80] |
| IOTF standards | |||||
| Normal | 388 | 20.7 | Reference | Reference | Reference |
| Overweight | 65 | 22.0 | 1.07 [0.67–1.72] | 0.97 [0.61–1.55] | 0.89 [0.54–1.48] |
| Obese | 42 | 39.0 | 2.45 [1.61–3.71] * | 1.55 [0.95–2.54] | 1.41 [0.84–2.36] |
| Underweight | 49 | 20.3 | 0.98 [0.59–1.61] | 0.91 [0.58–1.43] | 1.03 [0.65–1.62] |
Publisher’s Note: MDPI stays neutral with regard to jurisdictional claims in published maps and institutional affiliations. |
© 2022 by the authors. Licensee MDPI, Basel, Switzerland. This article is an open access article distributed under the terms and conditions of the Creative Commons Attribution (CC BY) license (https://creativecommons.org/licenses/by/4.0/).
Share and Cite
Piovesan, É.T.d.A.; Leal, S.C.; Bernabé, E. The Relationship between Obesity and Childhood Dental Caries in the United States. Int. J. Environ. Res. Public Health 2022, 19, 16160. https://doi.org/10.3390/ijerph192316160
Piovesan ÉTdA, Leal SC, Bernabé E. The Relationship between Obesity and Childhood Dental Caries in the United States. International Journal of Environmental Research and Public Health. 2022; 19(23):16160. https://doi.org/10.3390/ijerph192316160
Chicago/Turabian StylePiovesan, Érica Torres de Almeida, Soraya Coelho Leal, and Eduardo Bernabé. 2022. "The Relationship between Obesity and Childhood Dental Caries in the United States" International Journal of Environmental Research and Public Health 19, no. 23: 16160. https://doi.org/10.3390/ijerph192316160