
Identification of the Mechanical Failure Factors with Potential Influencing Road Accidents in Ecuador

 , and
, and
Abstract
:
1. Introduction
2. Literature Review
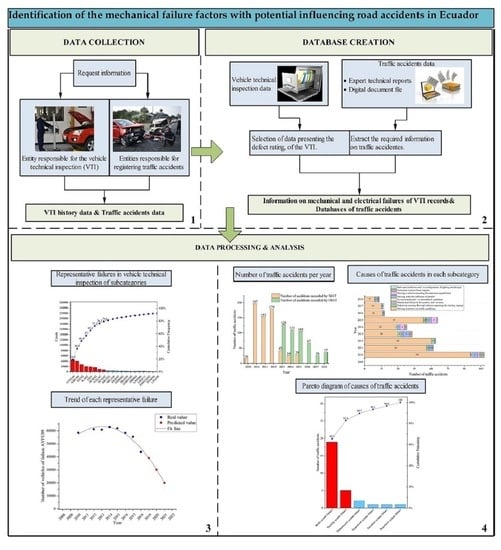
3. Materials and Methods
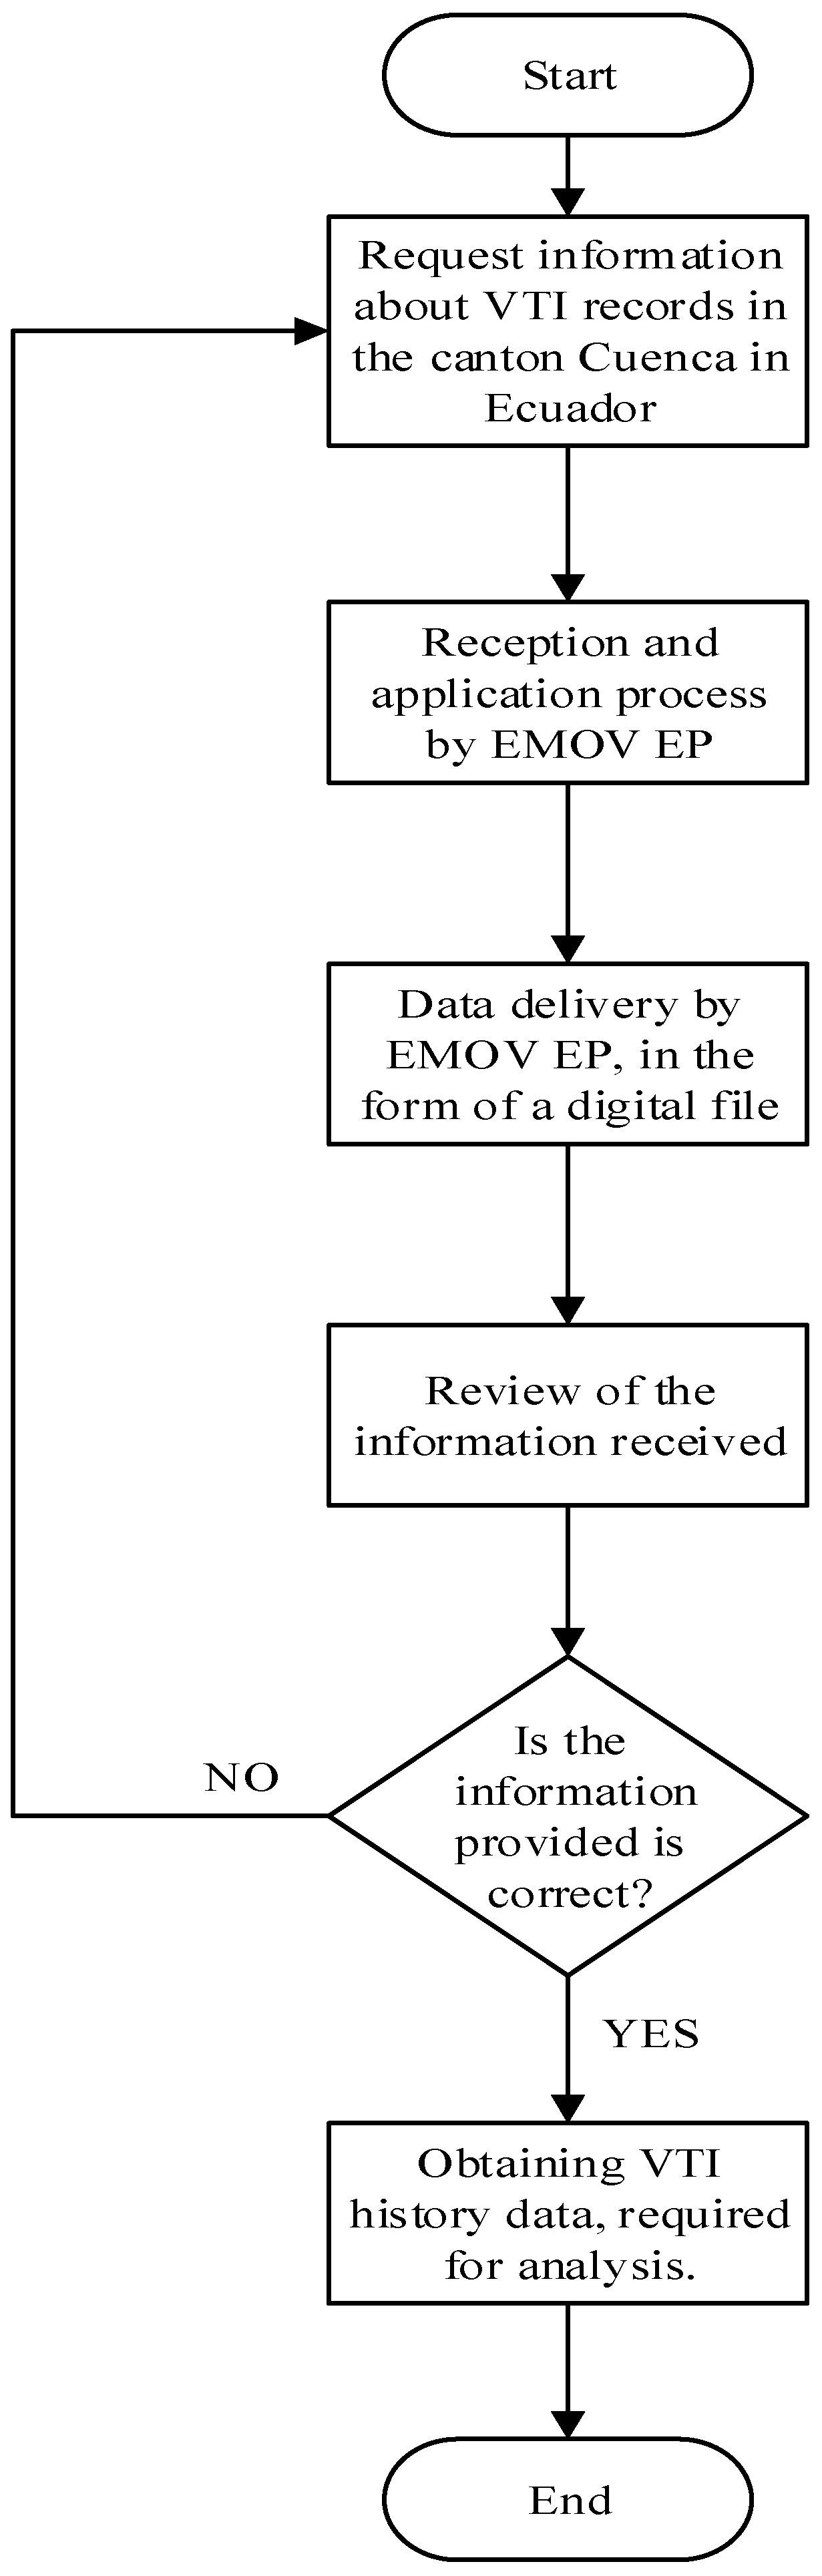
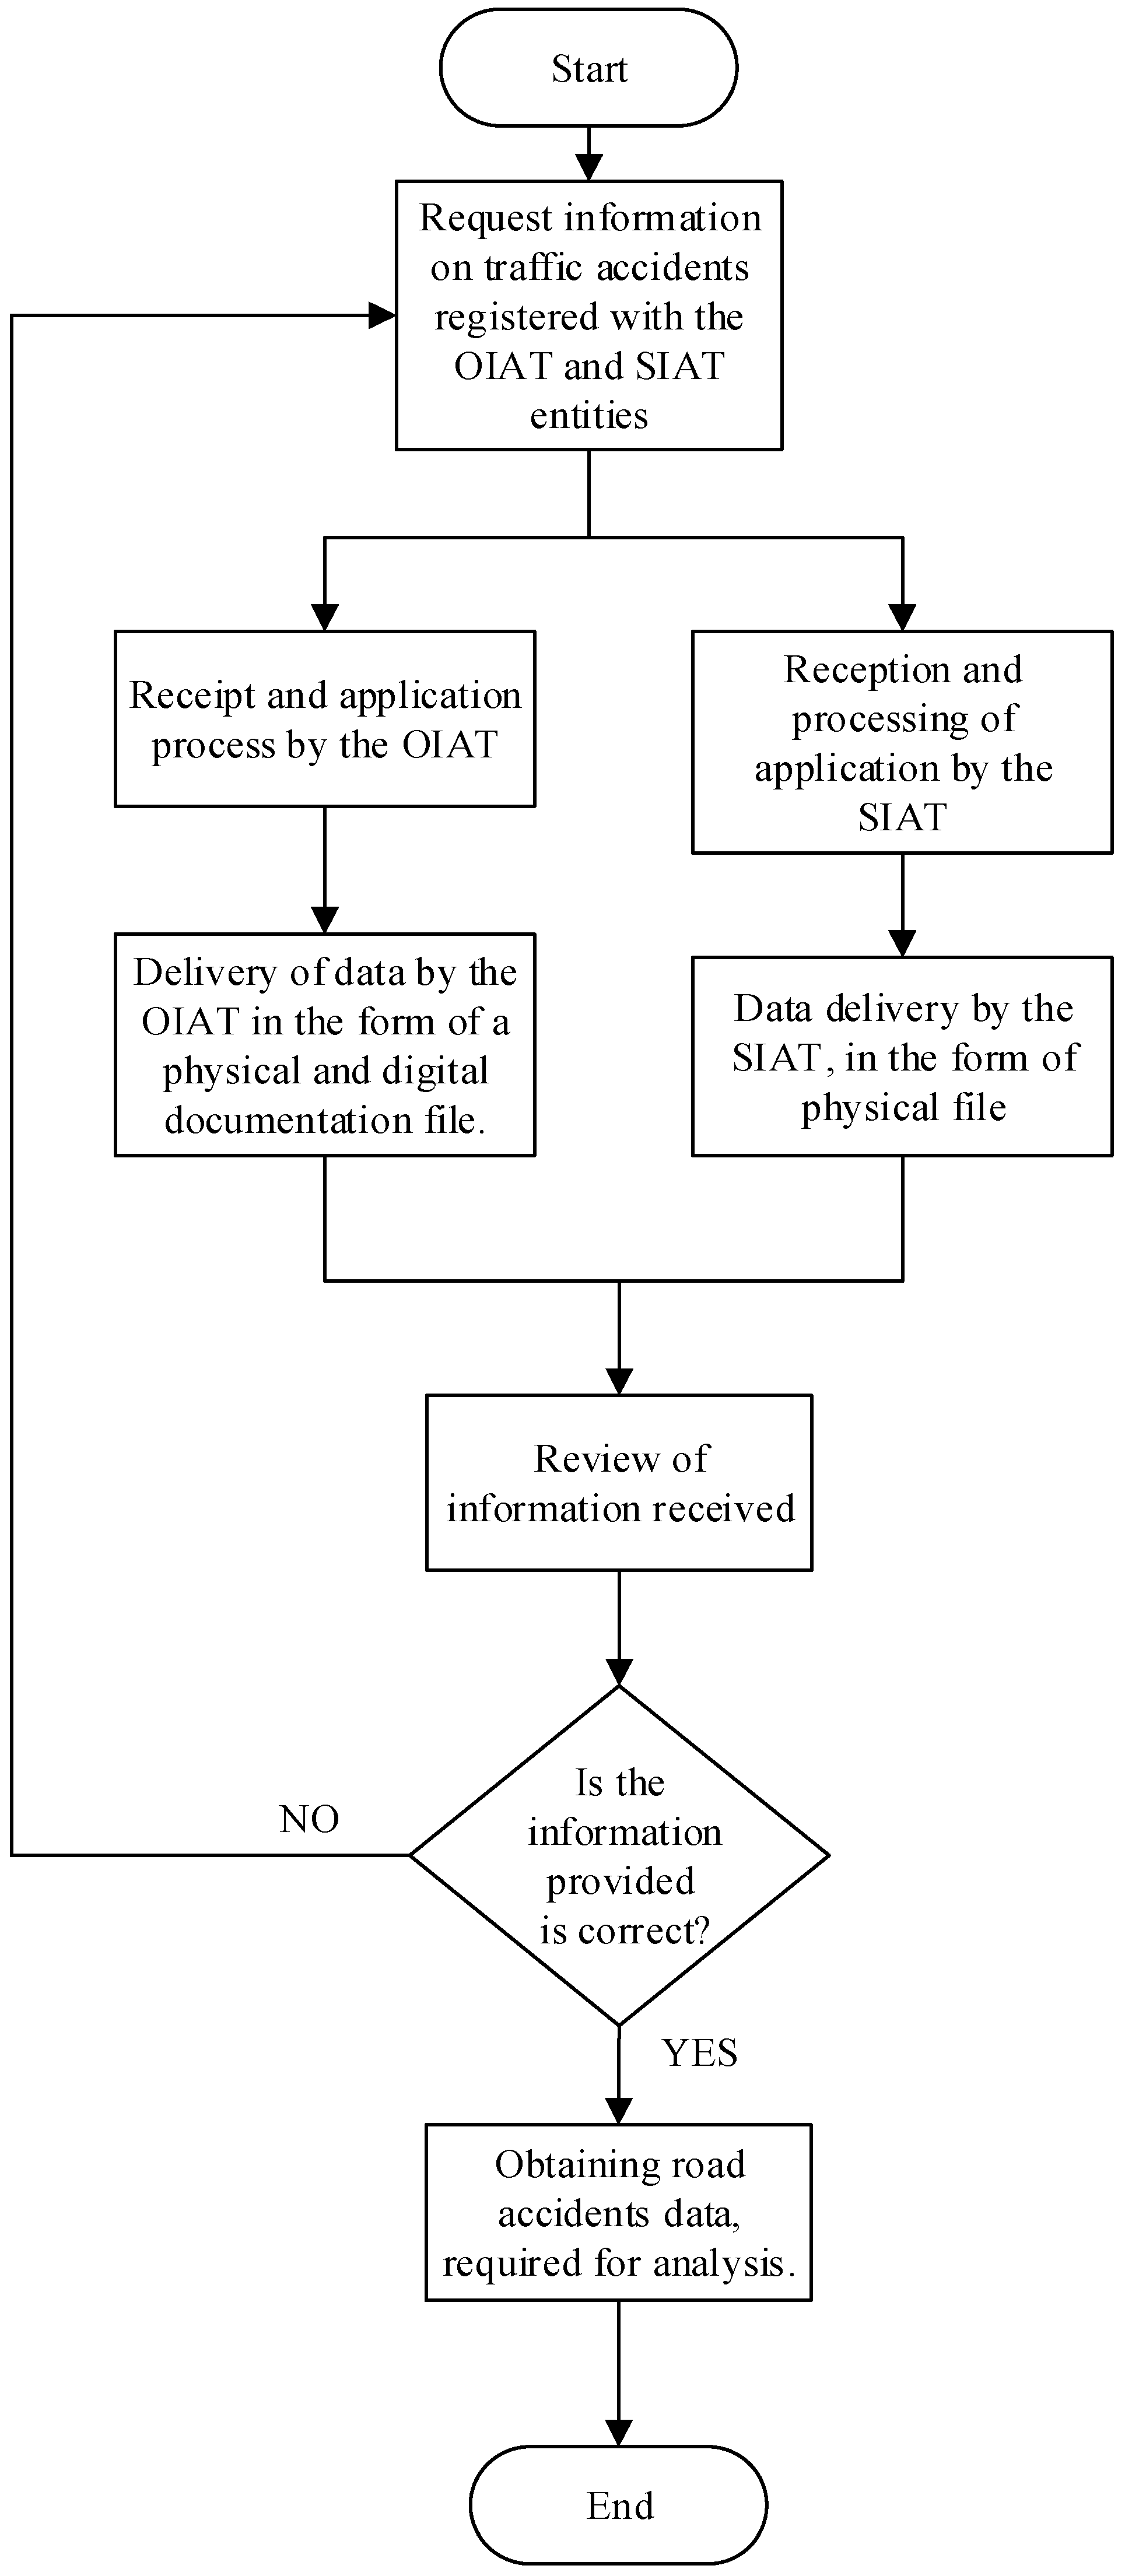
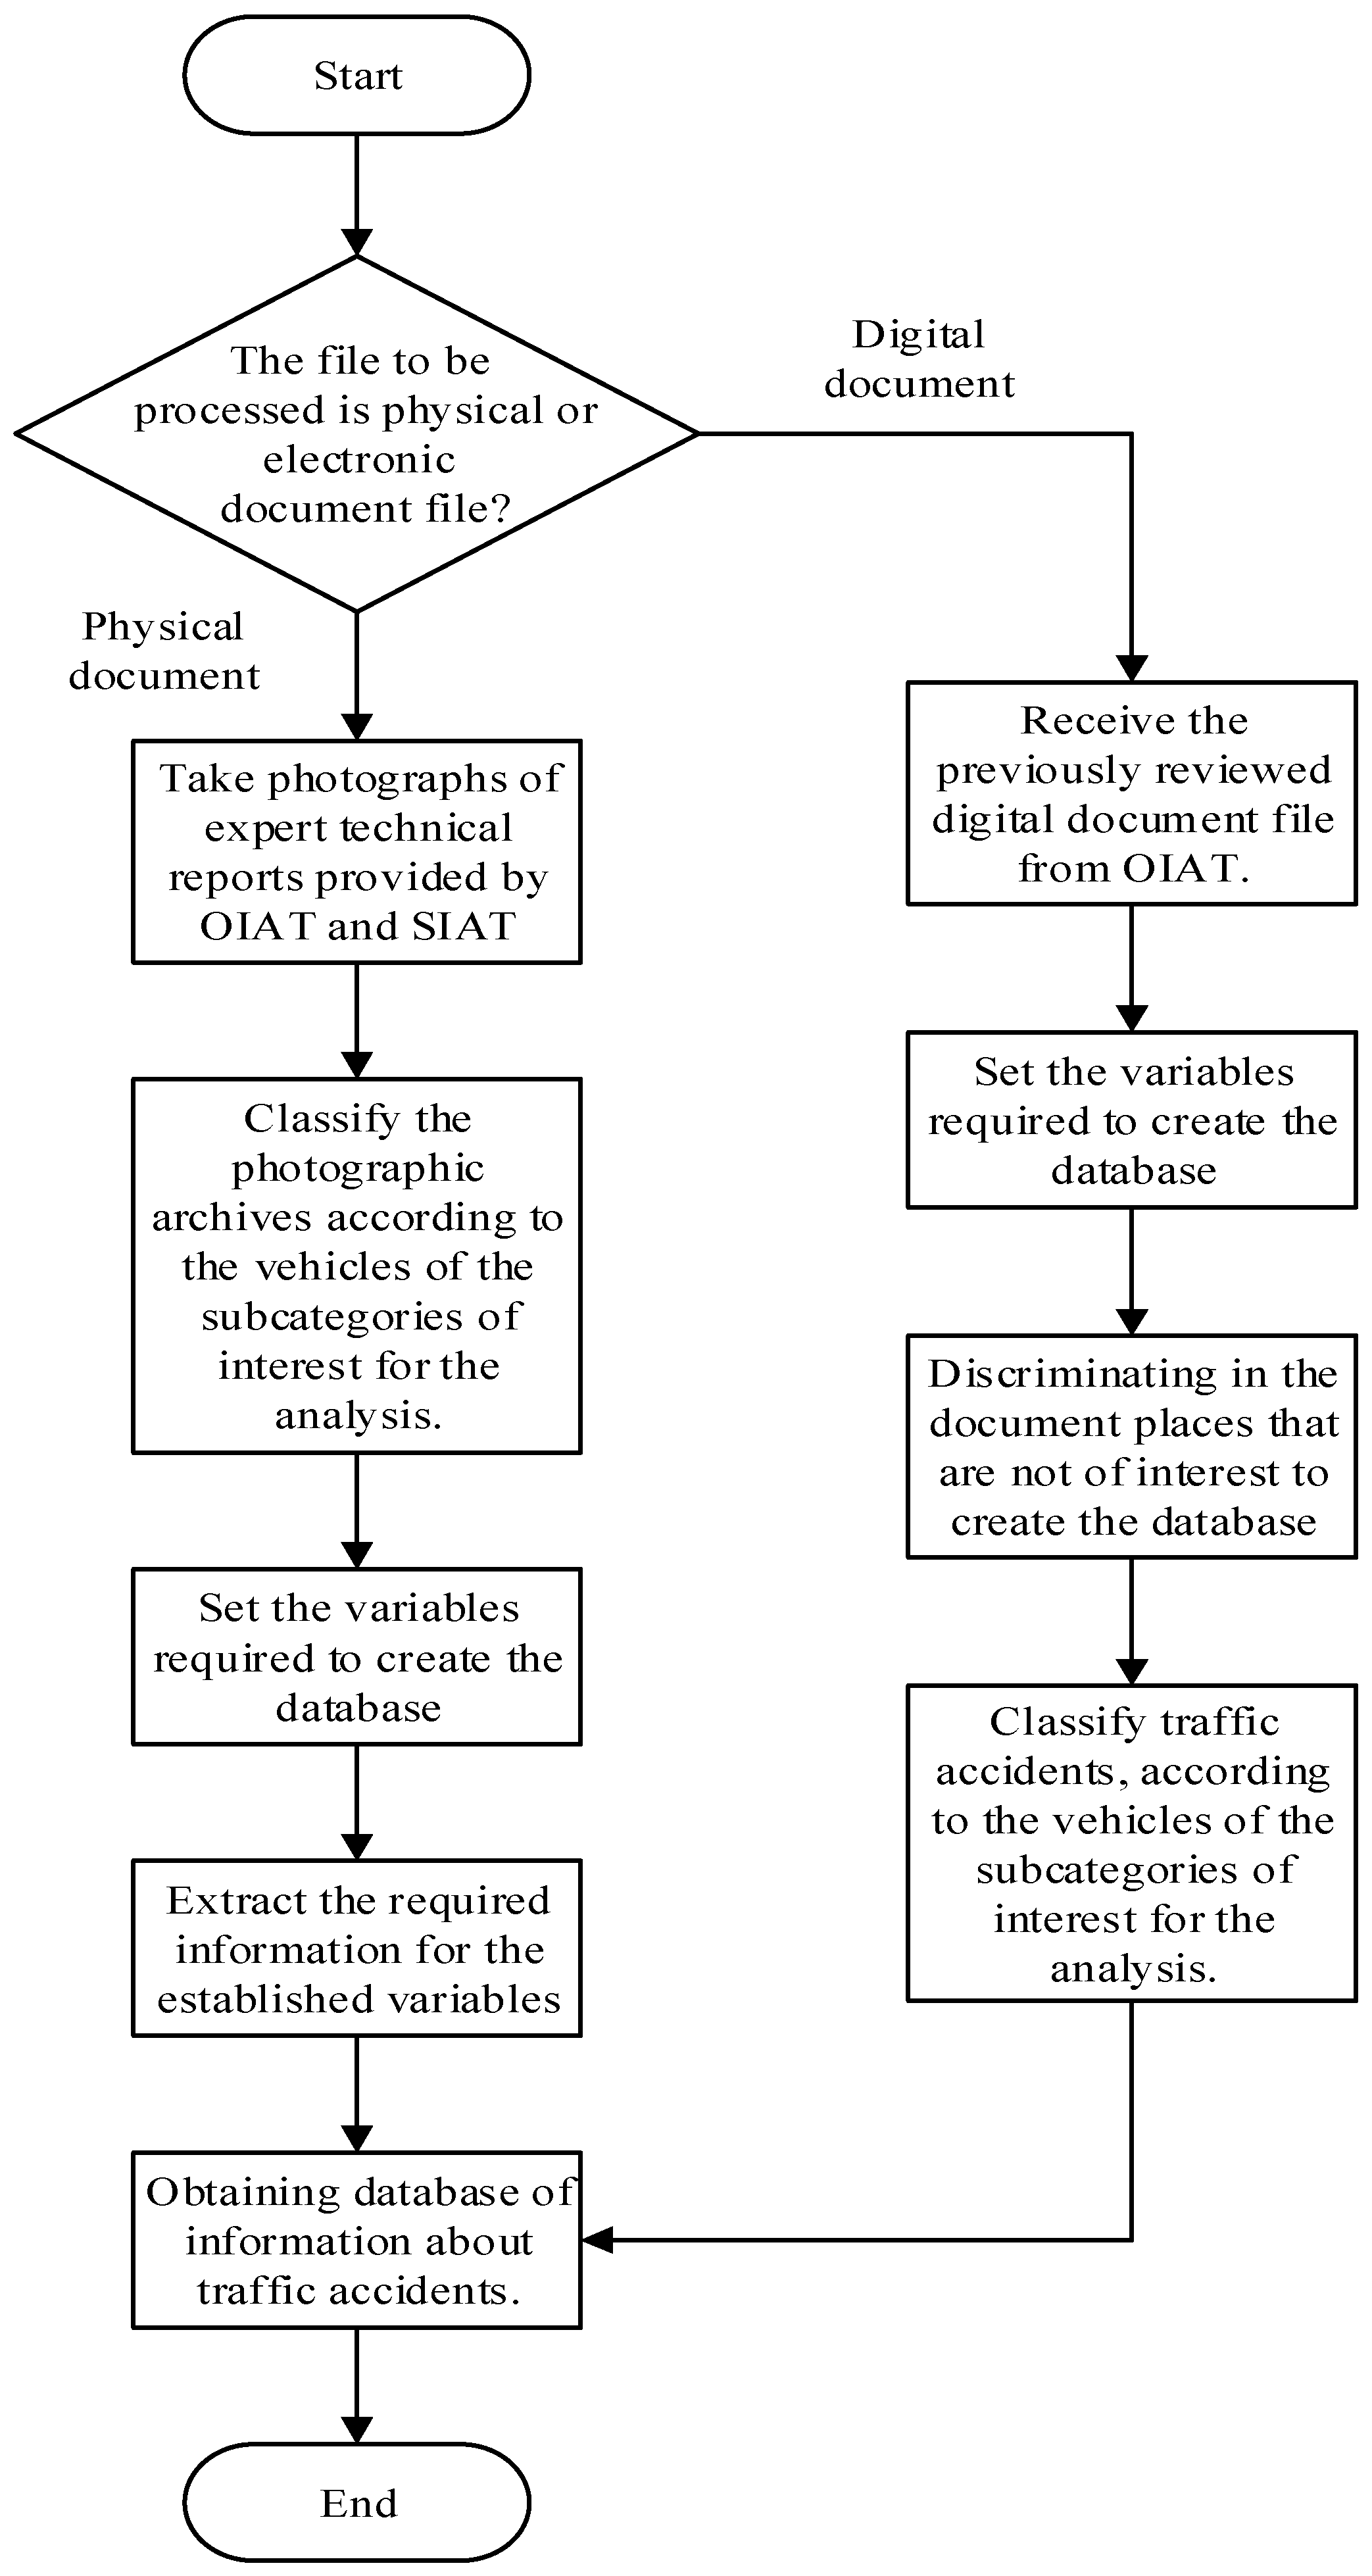
3.1. Data Collection for the Research
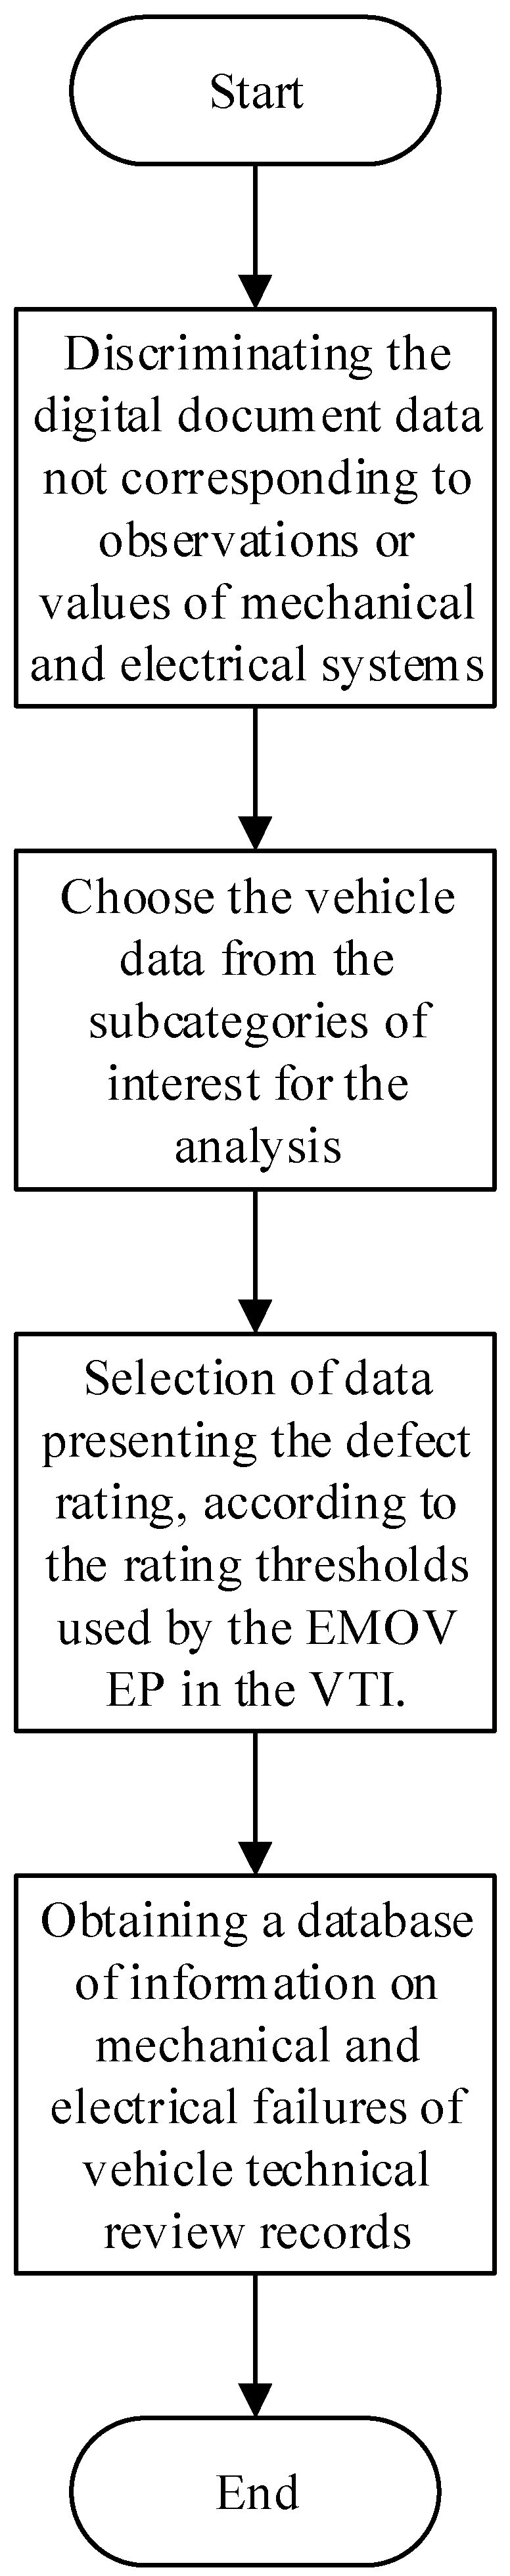
3.2. Database Creation Required for the Research
3.3. Statistical Procedures
3.3.1. Descriptive Statistics
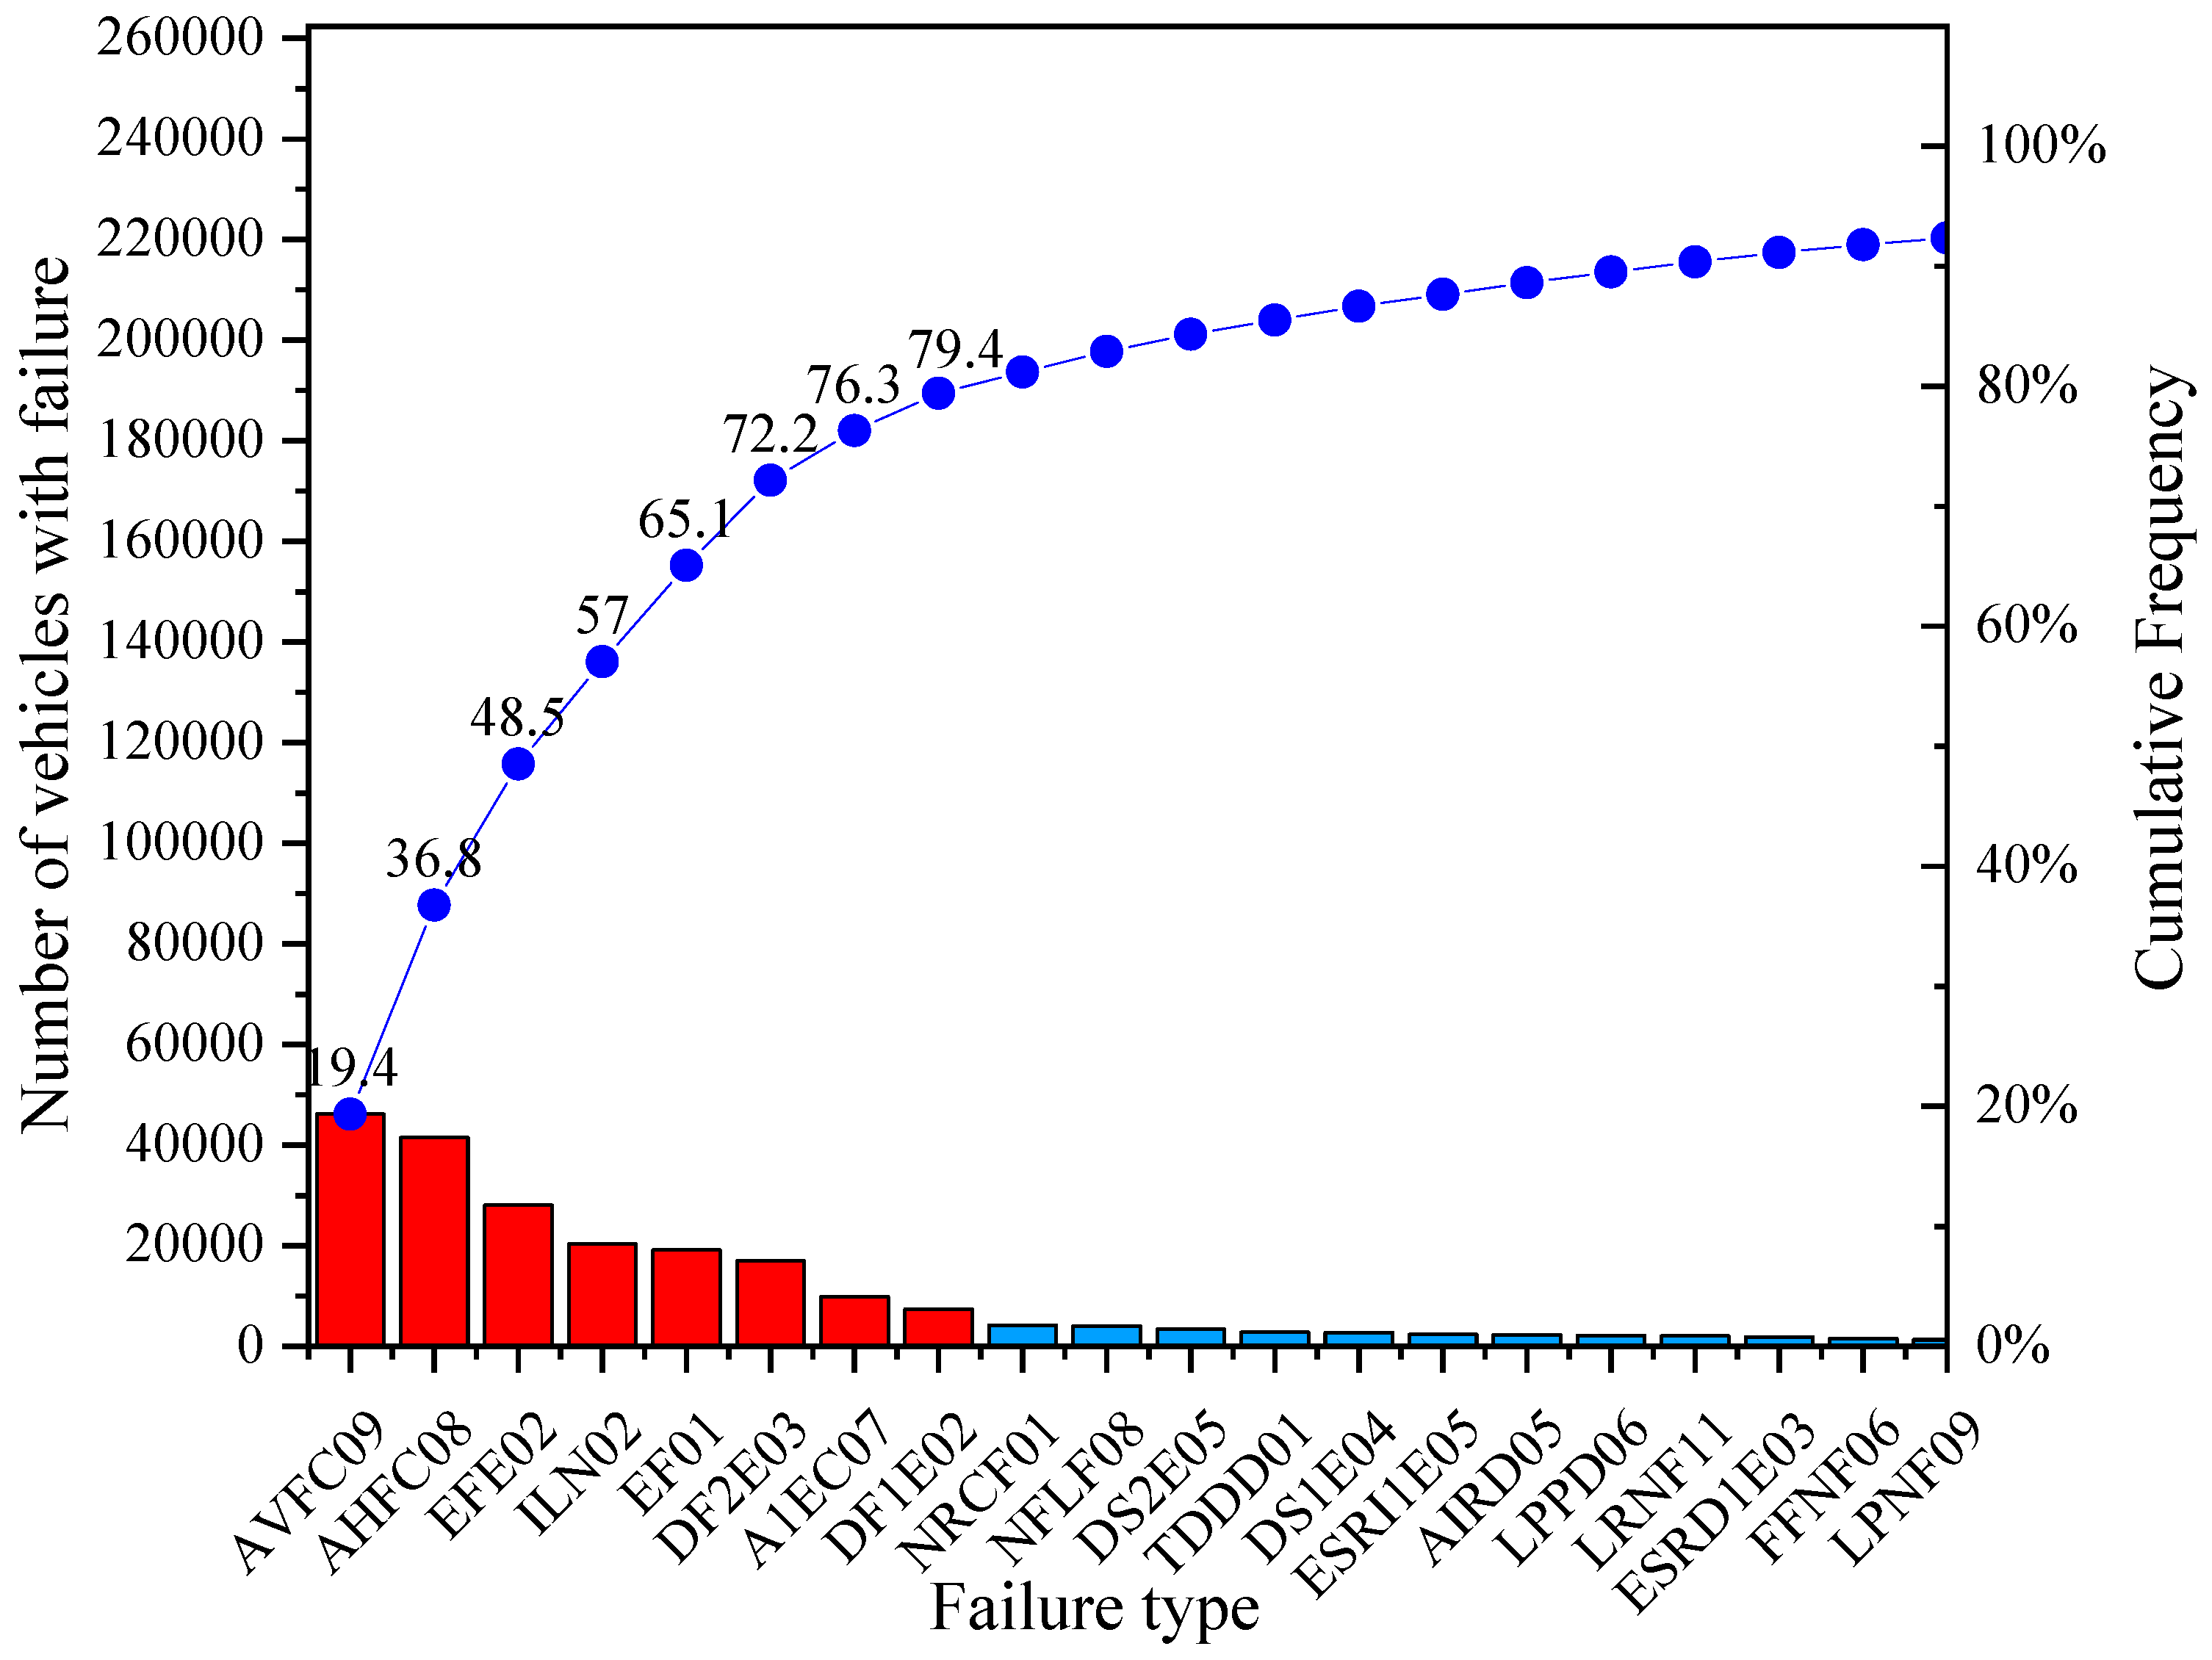
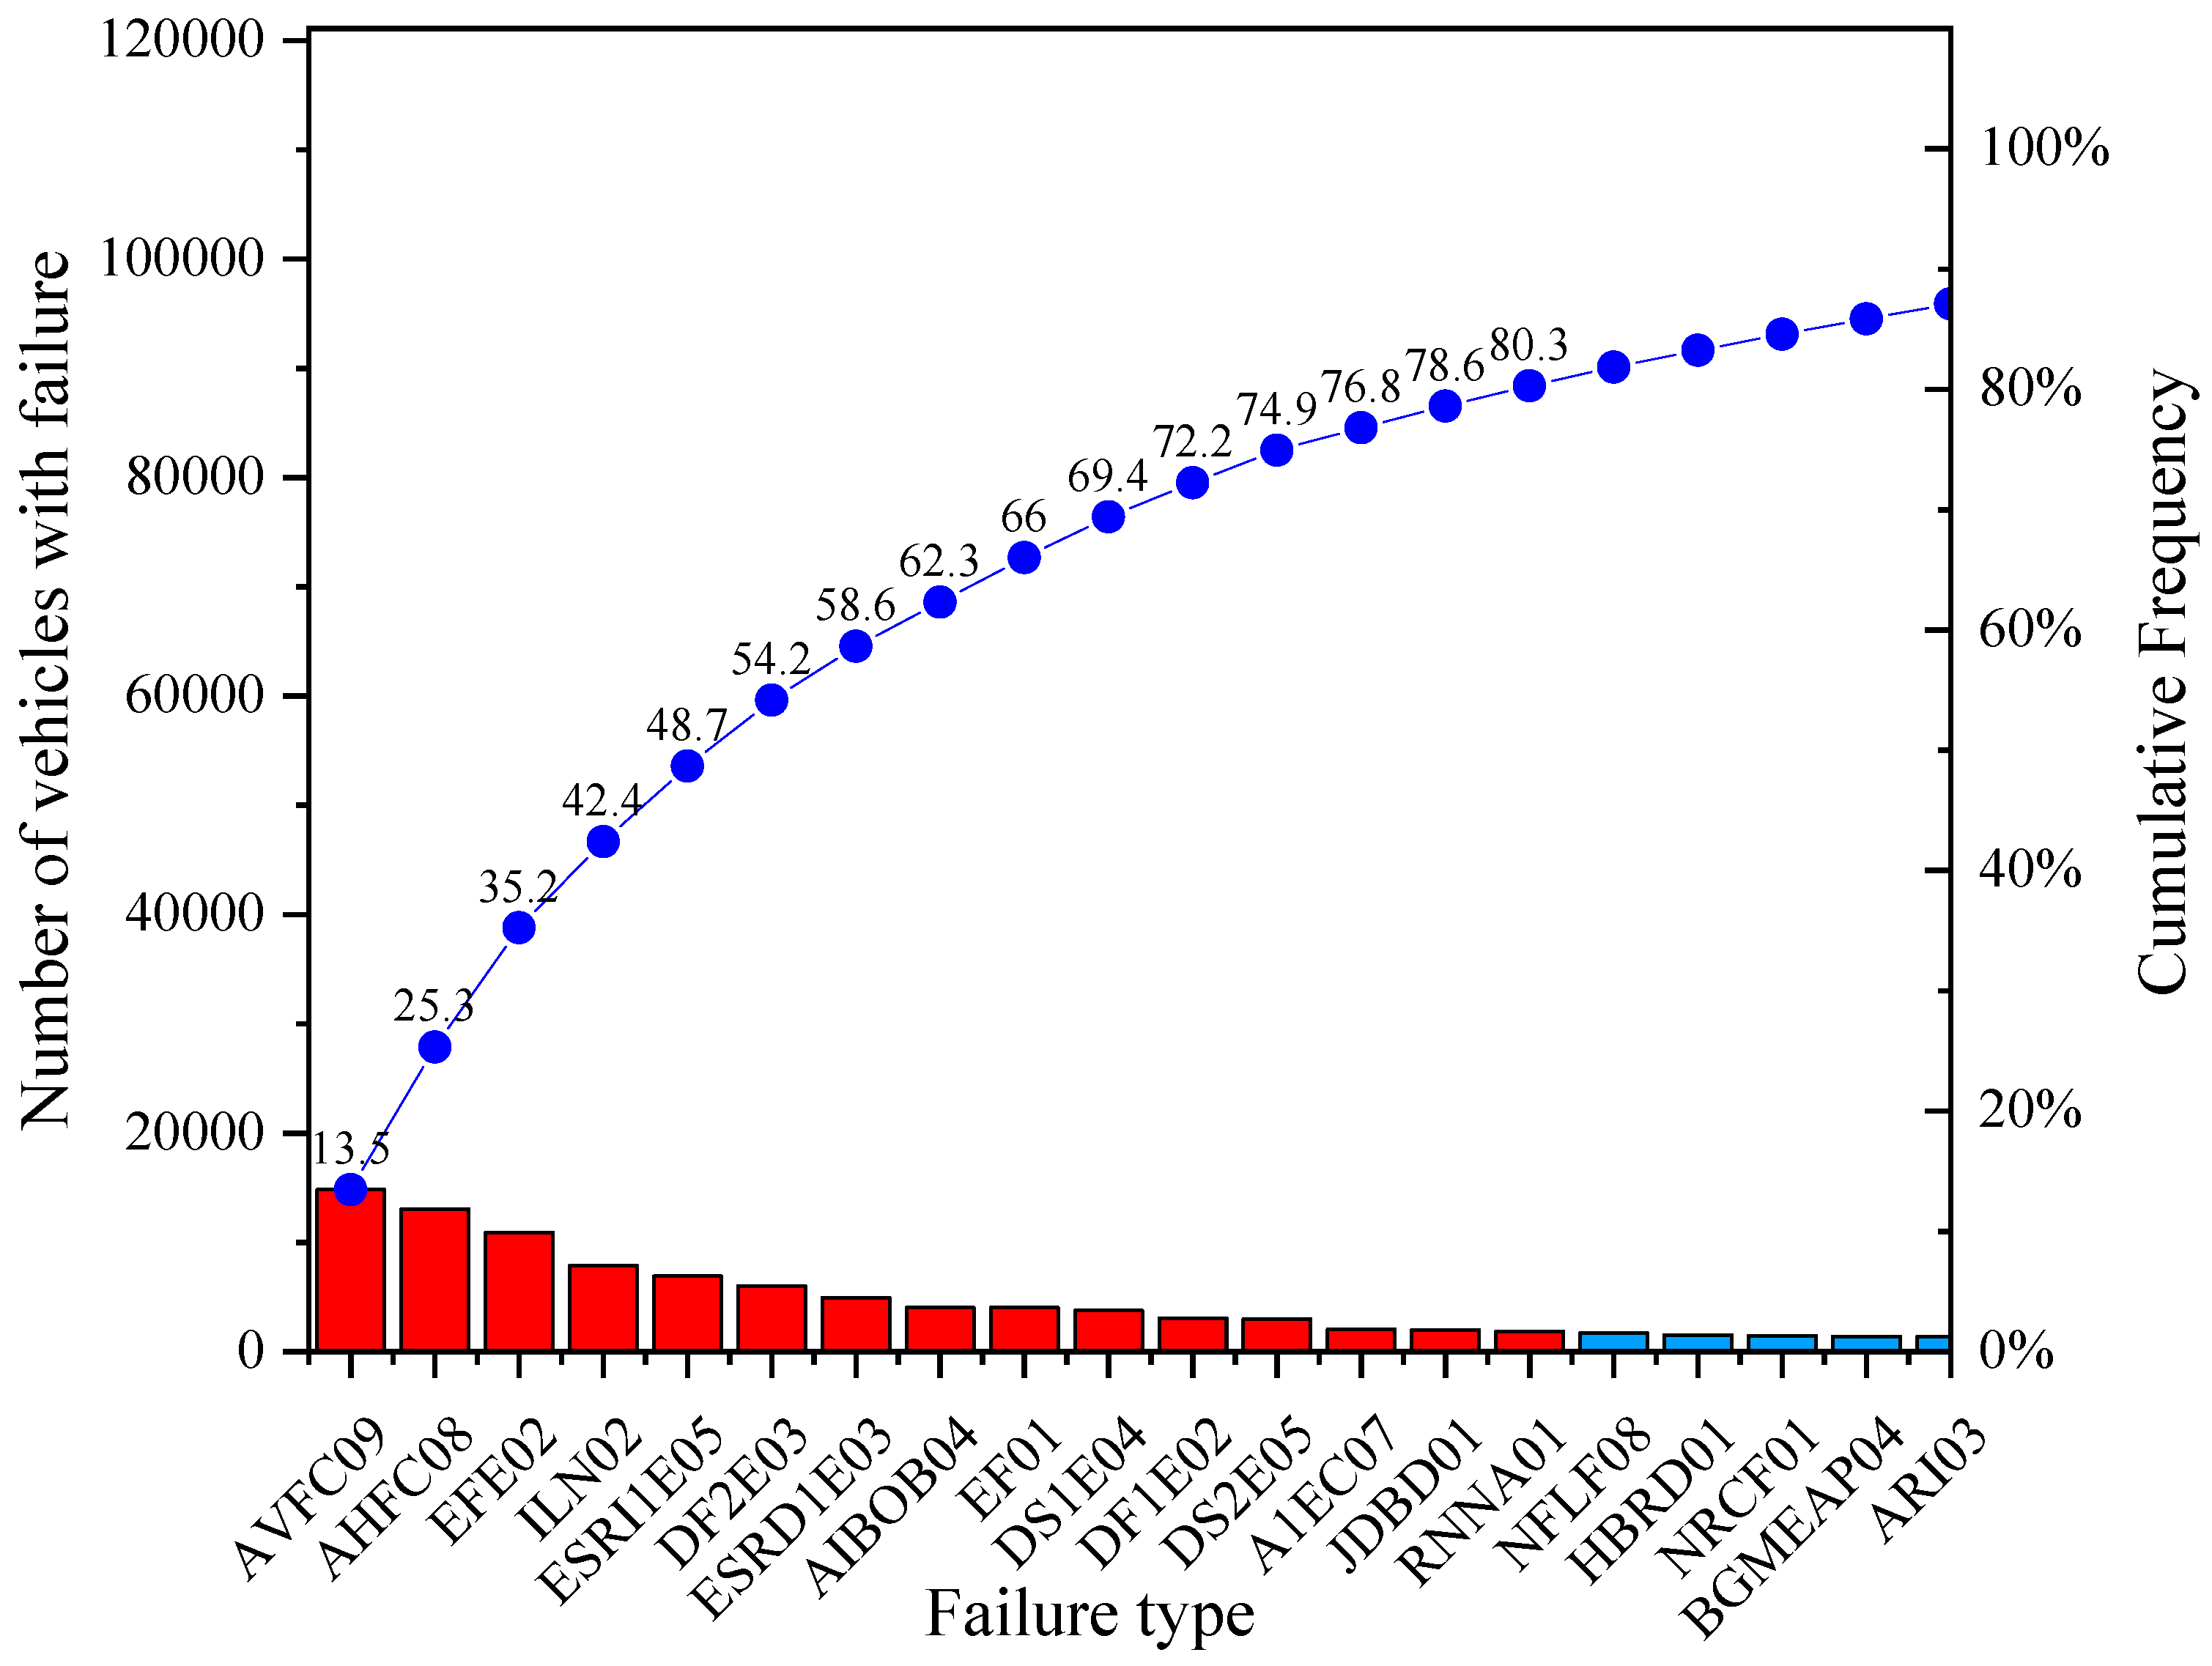
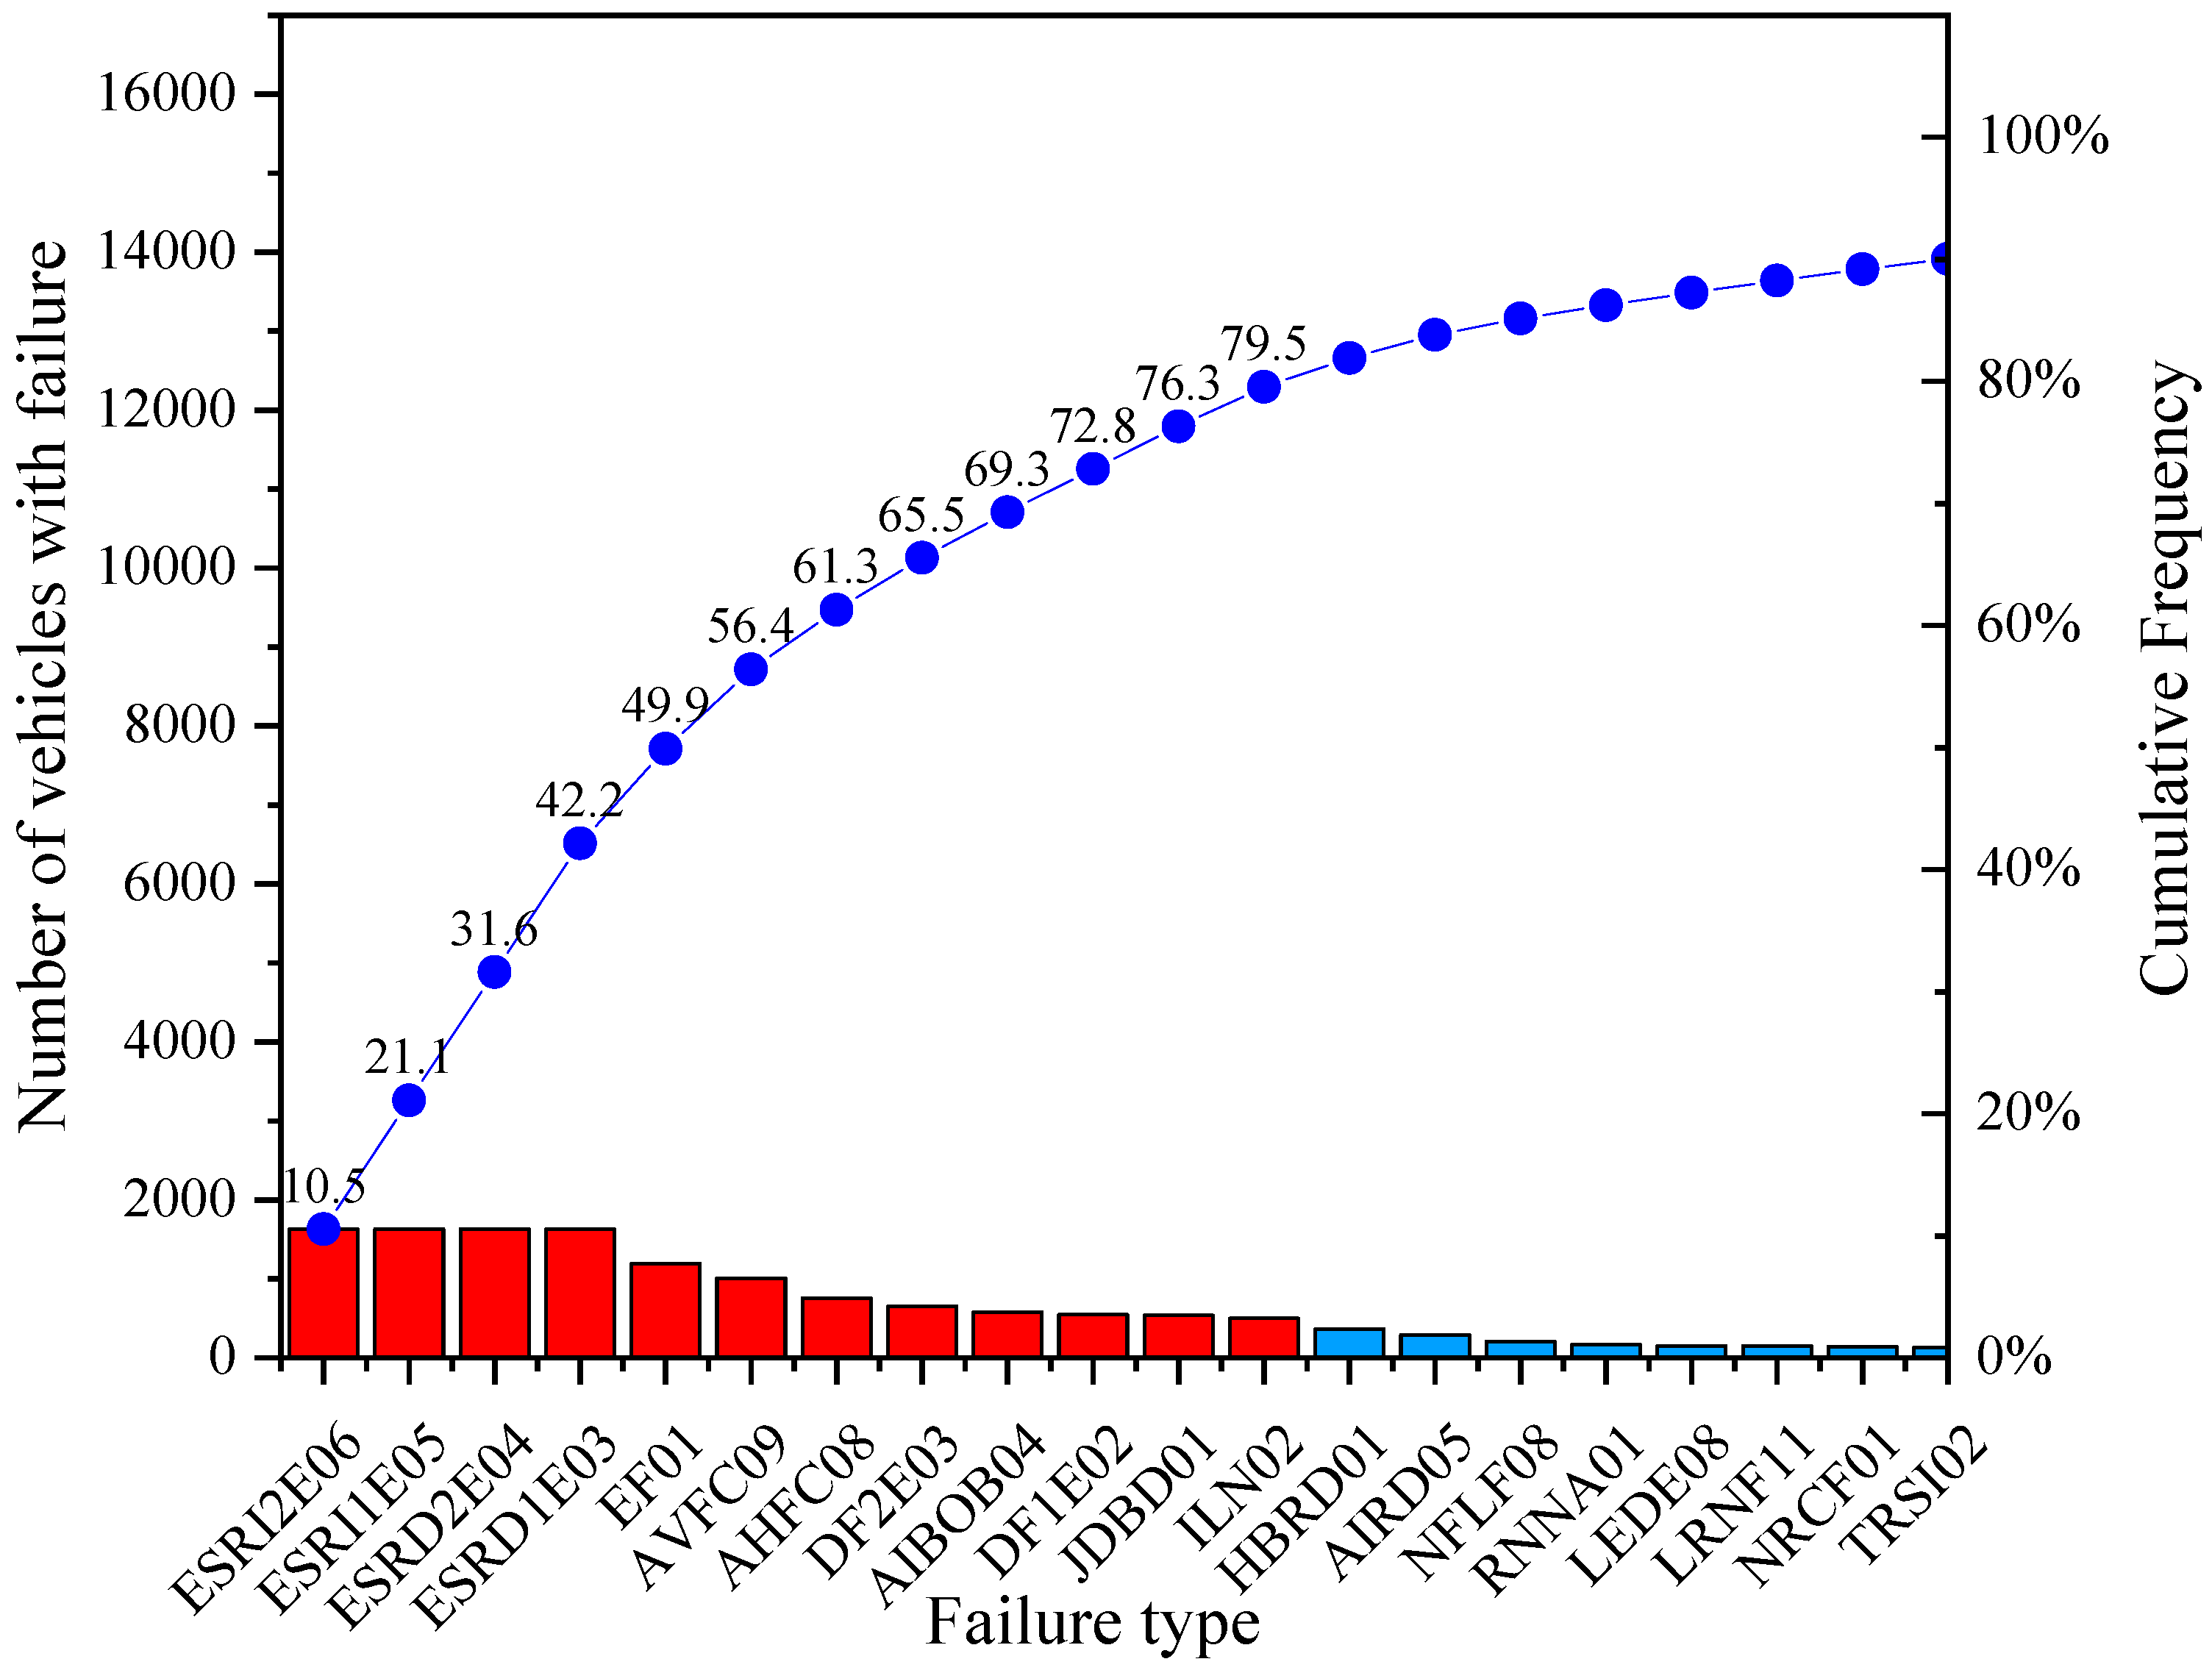
3.3.2. Pareto Chart
3.3.3. Time Series
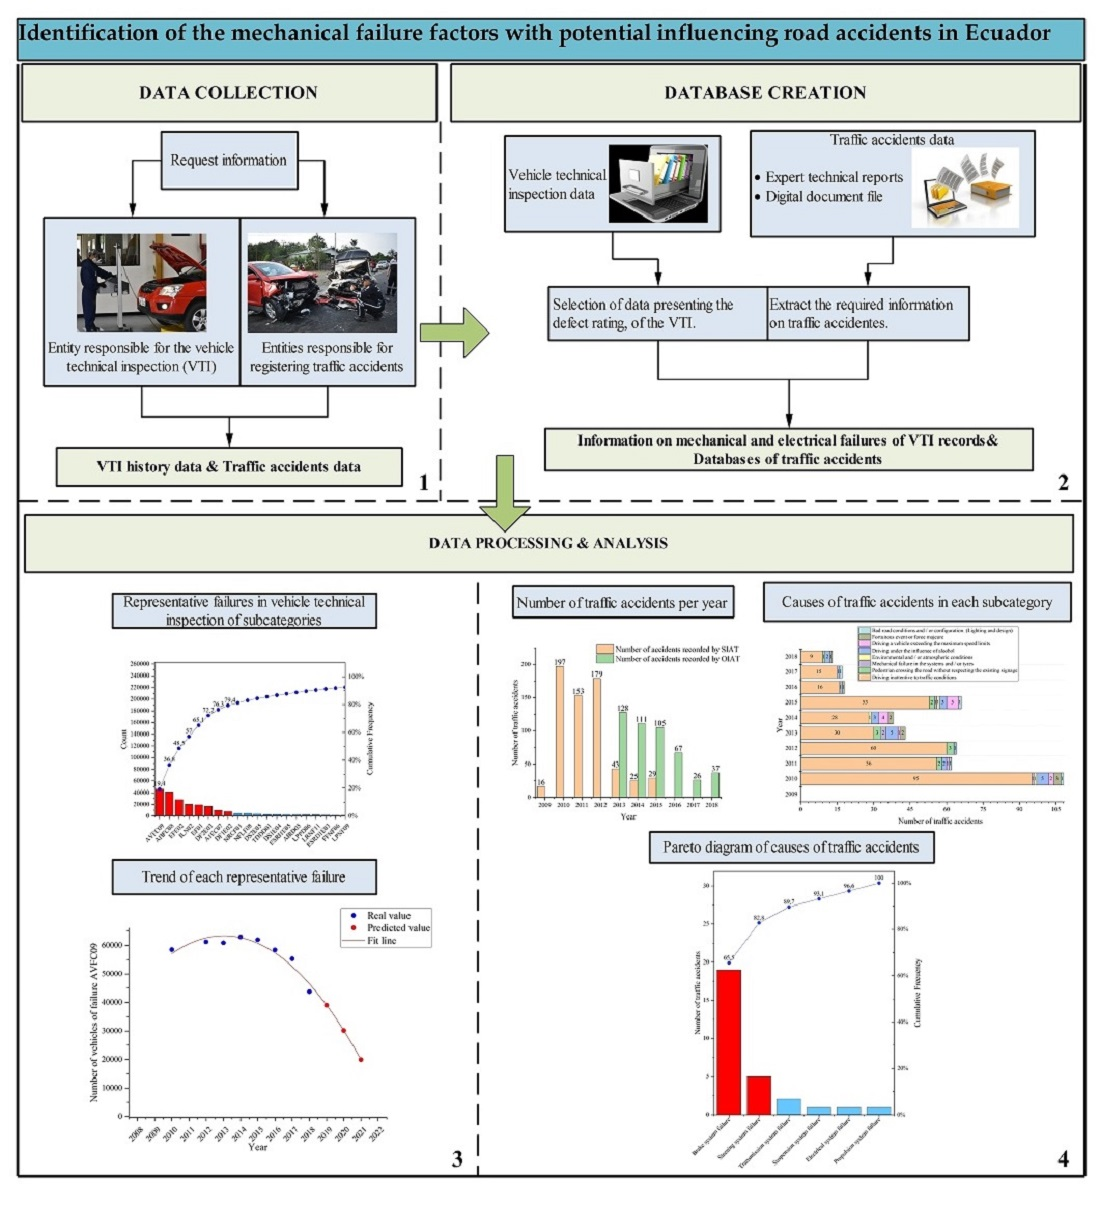
4. Results
4.1. Mechanical and Electrical Conditions of Vehicles for Subcategories M1, M3 and N1, of the City of Cuenca-Ecuador from 2008 to 2018
4.2. The Most Representative Mechanical and Electrical Failure Trend for Subcategories M1, M3 and N1 Vehicles in the City of Cuenca, Ecuador from 2008 to 2018
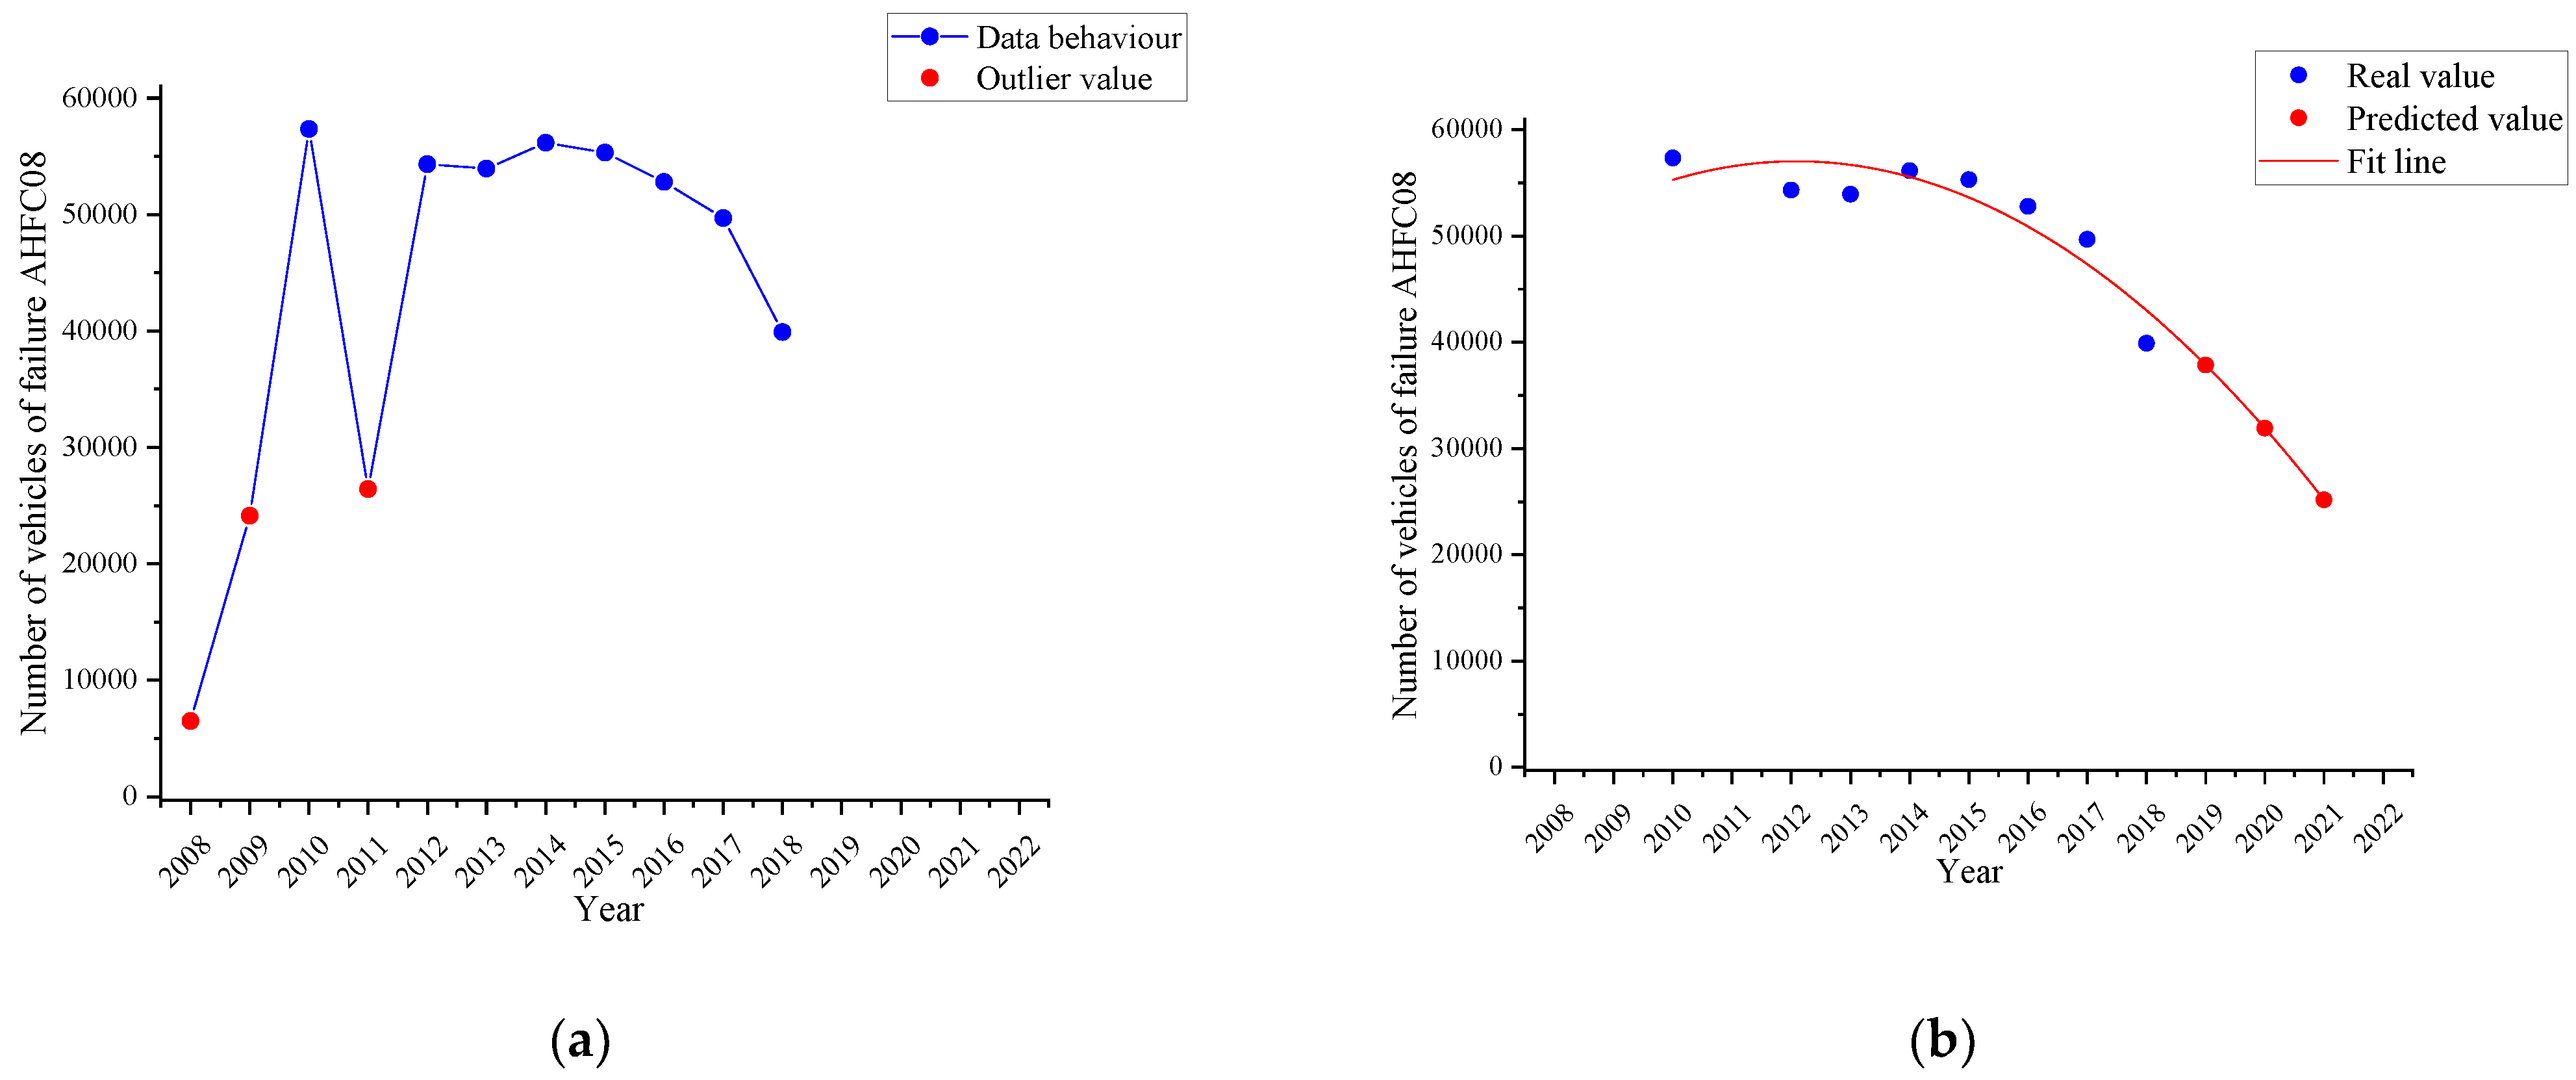
4.2.1. Horizontal Alignment of the Driver Headlight Failure Trend
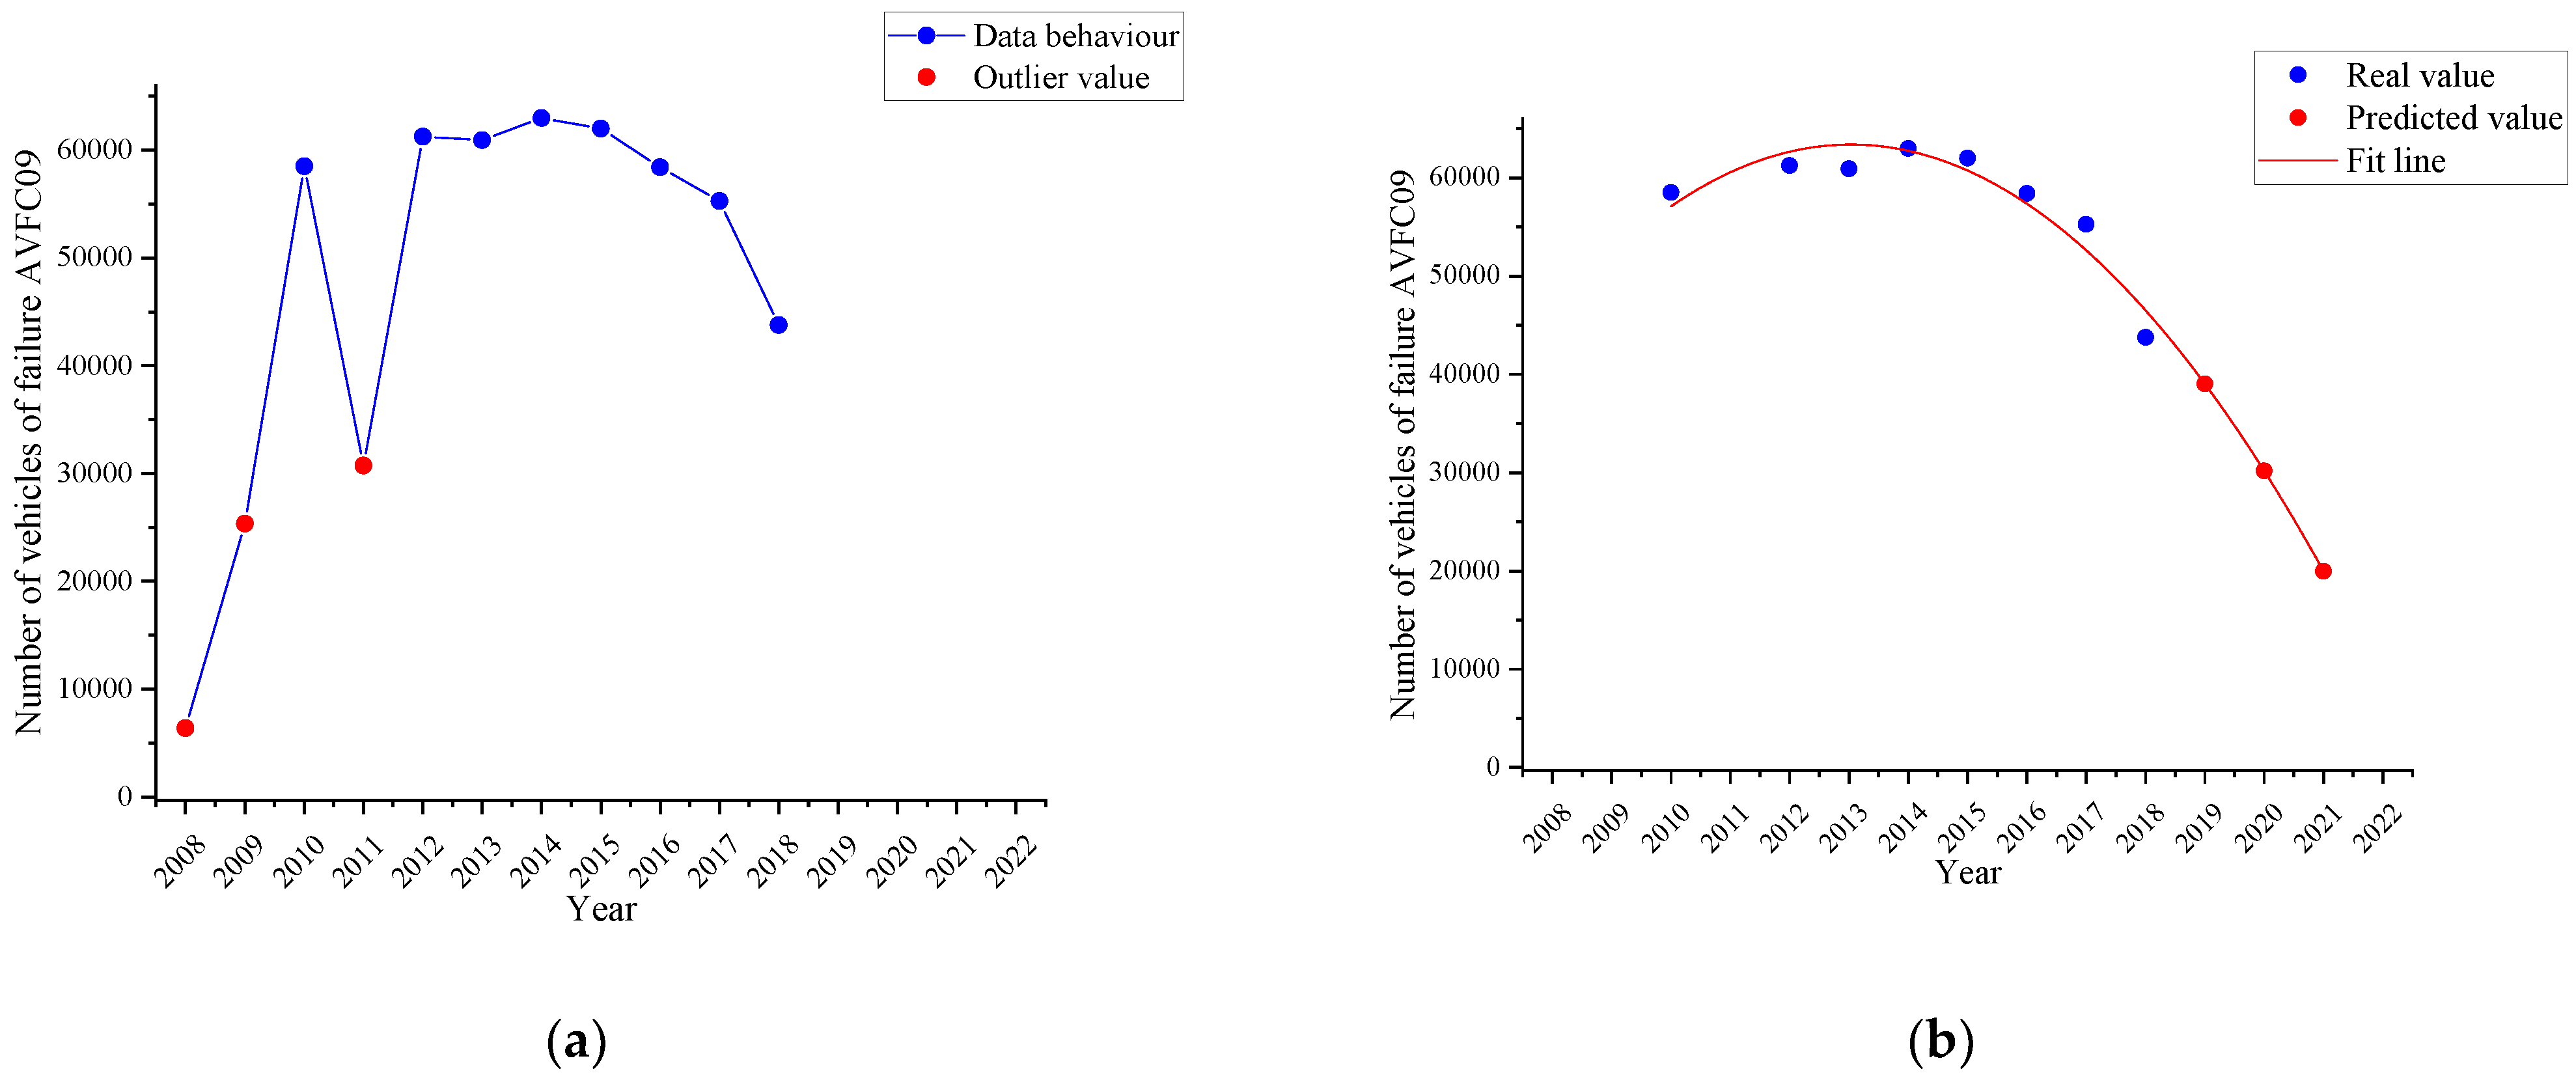
4.2.2. Vertical Alignment of the Driver Headlight Failure Trend
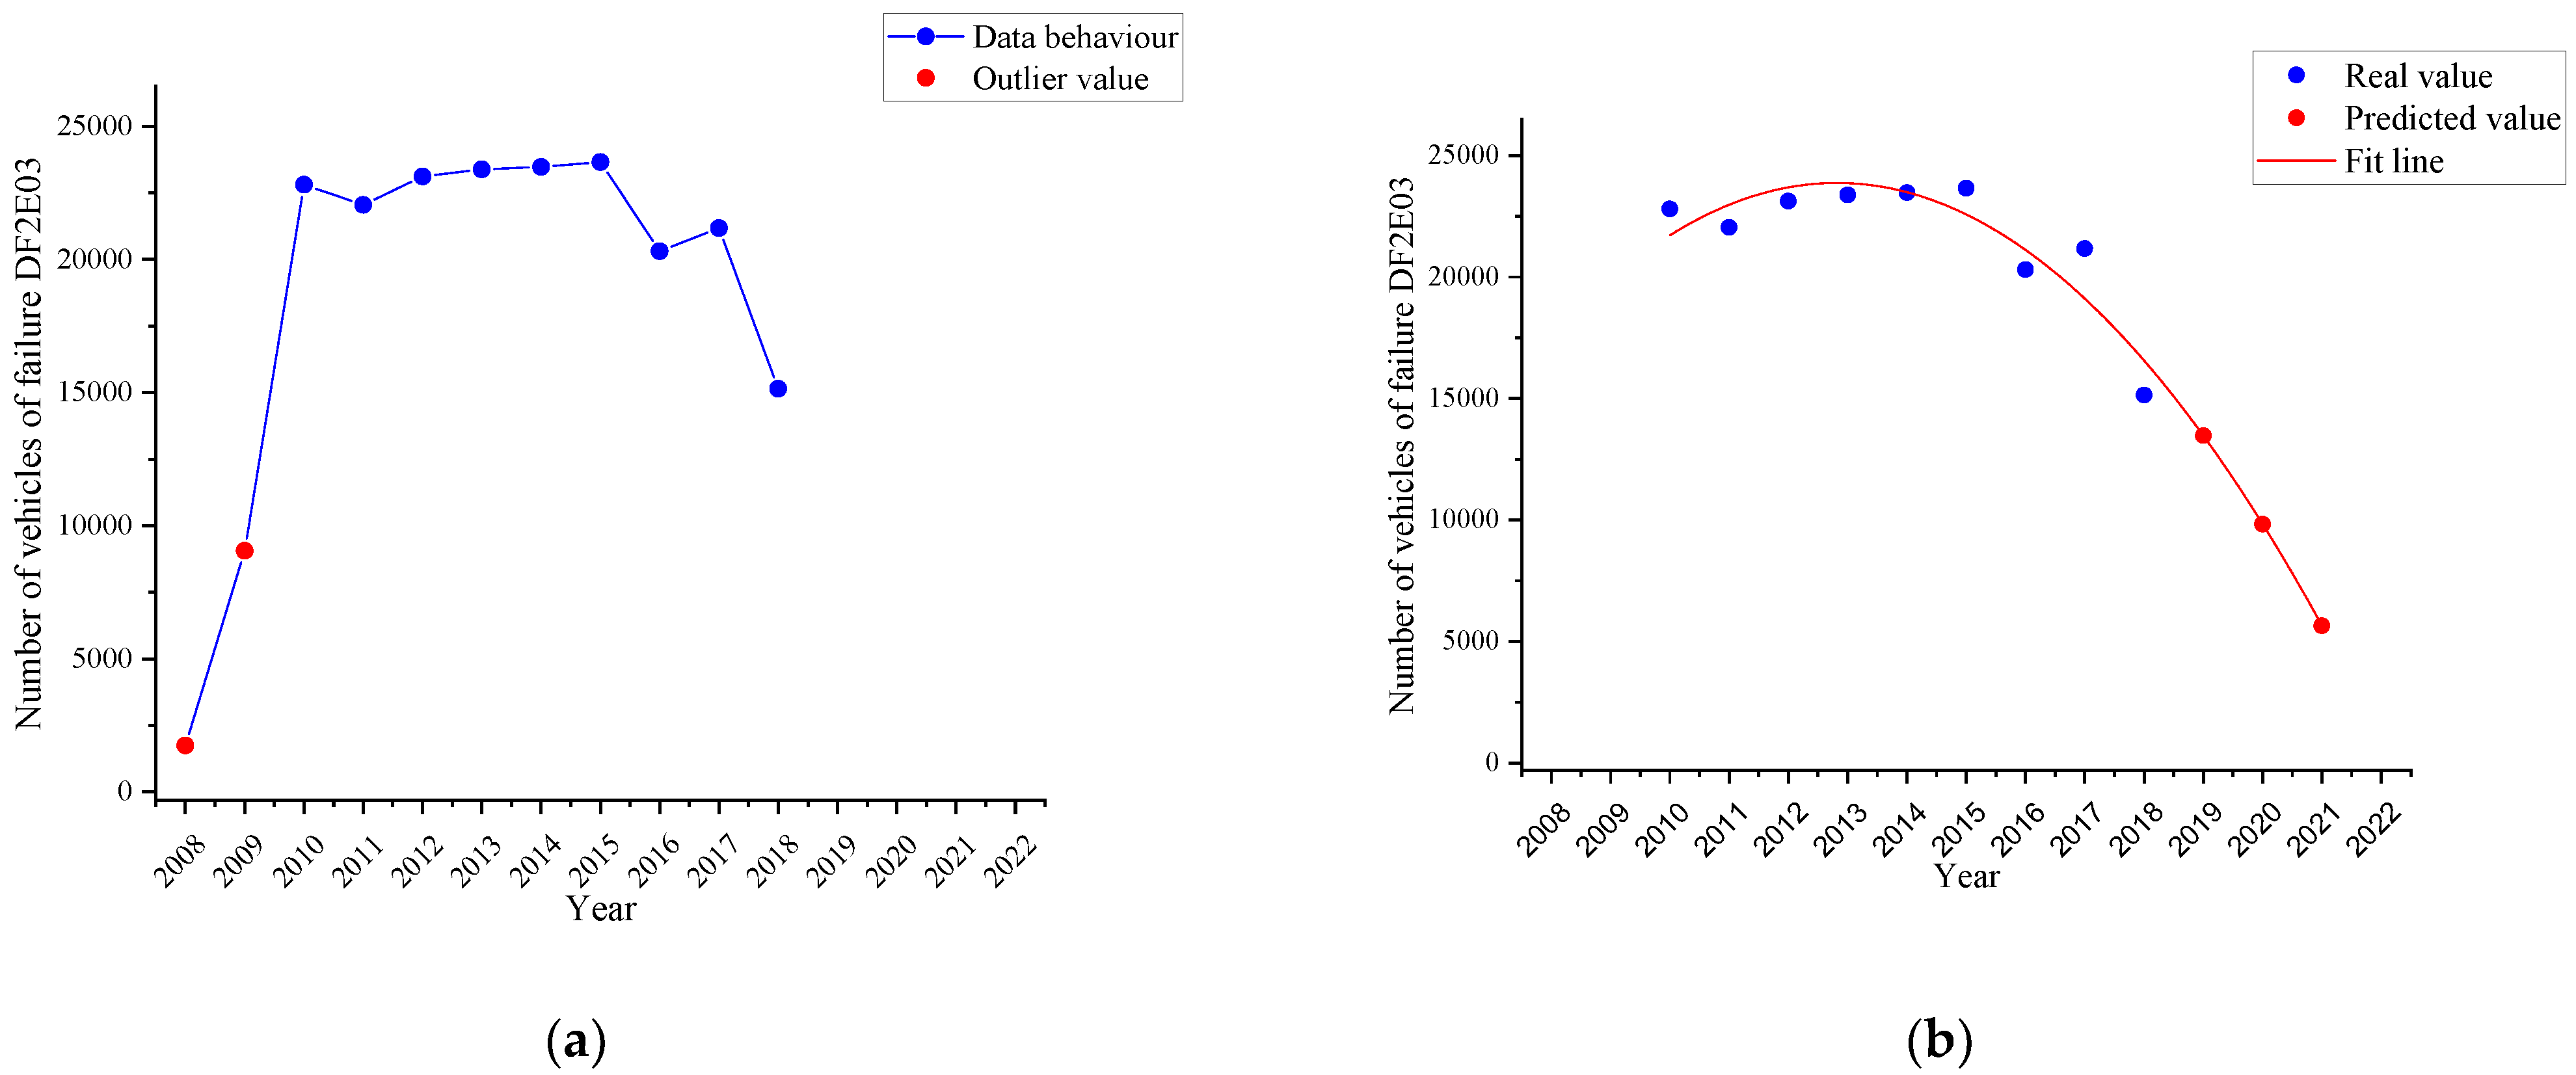
4.2.3. Braking Imbalance on the 2nd Axle Failure Trend
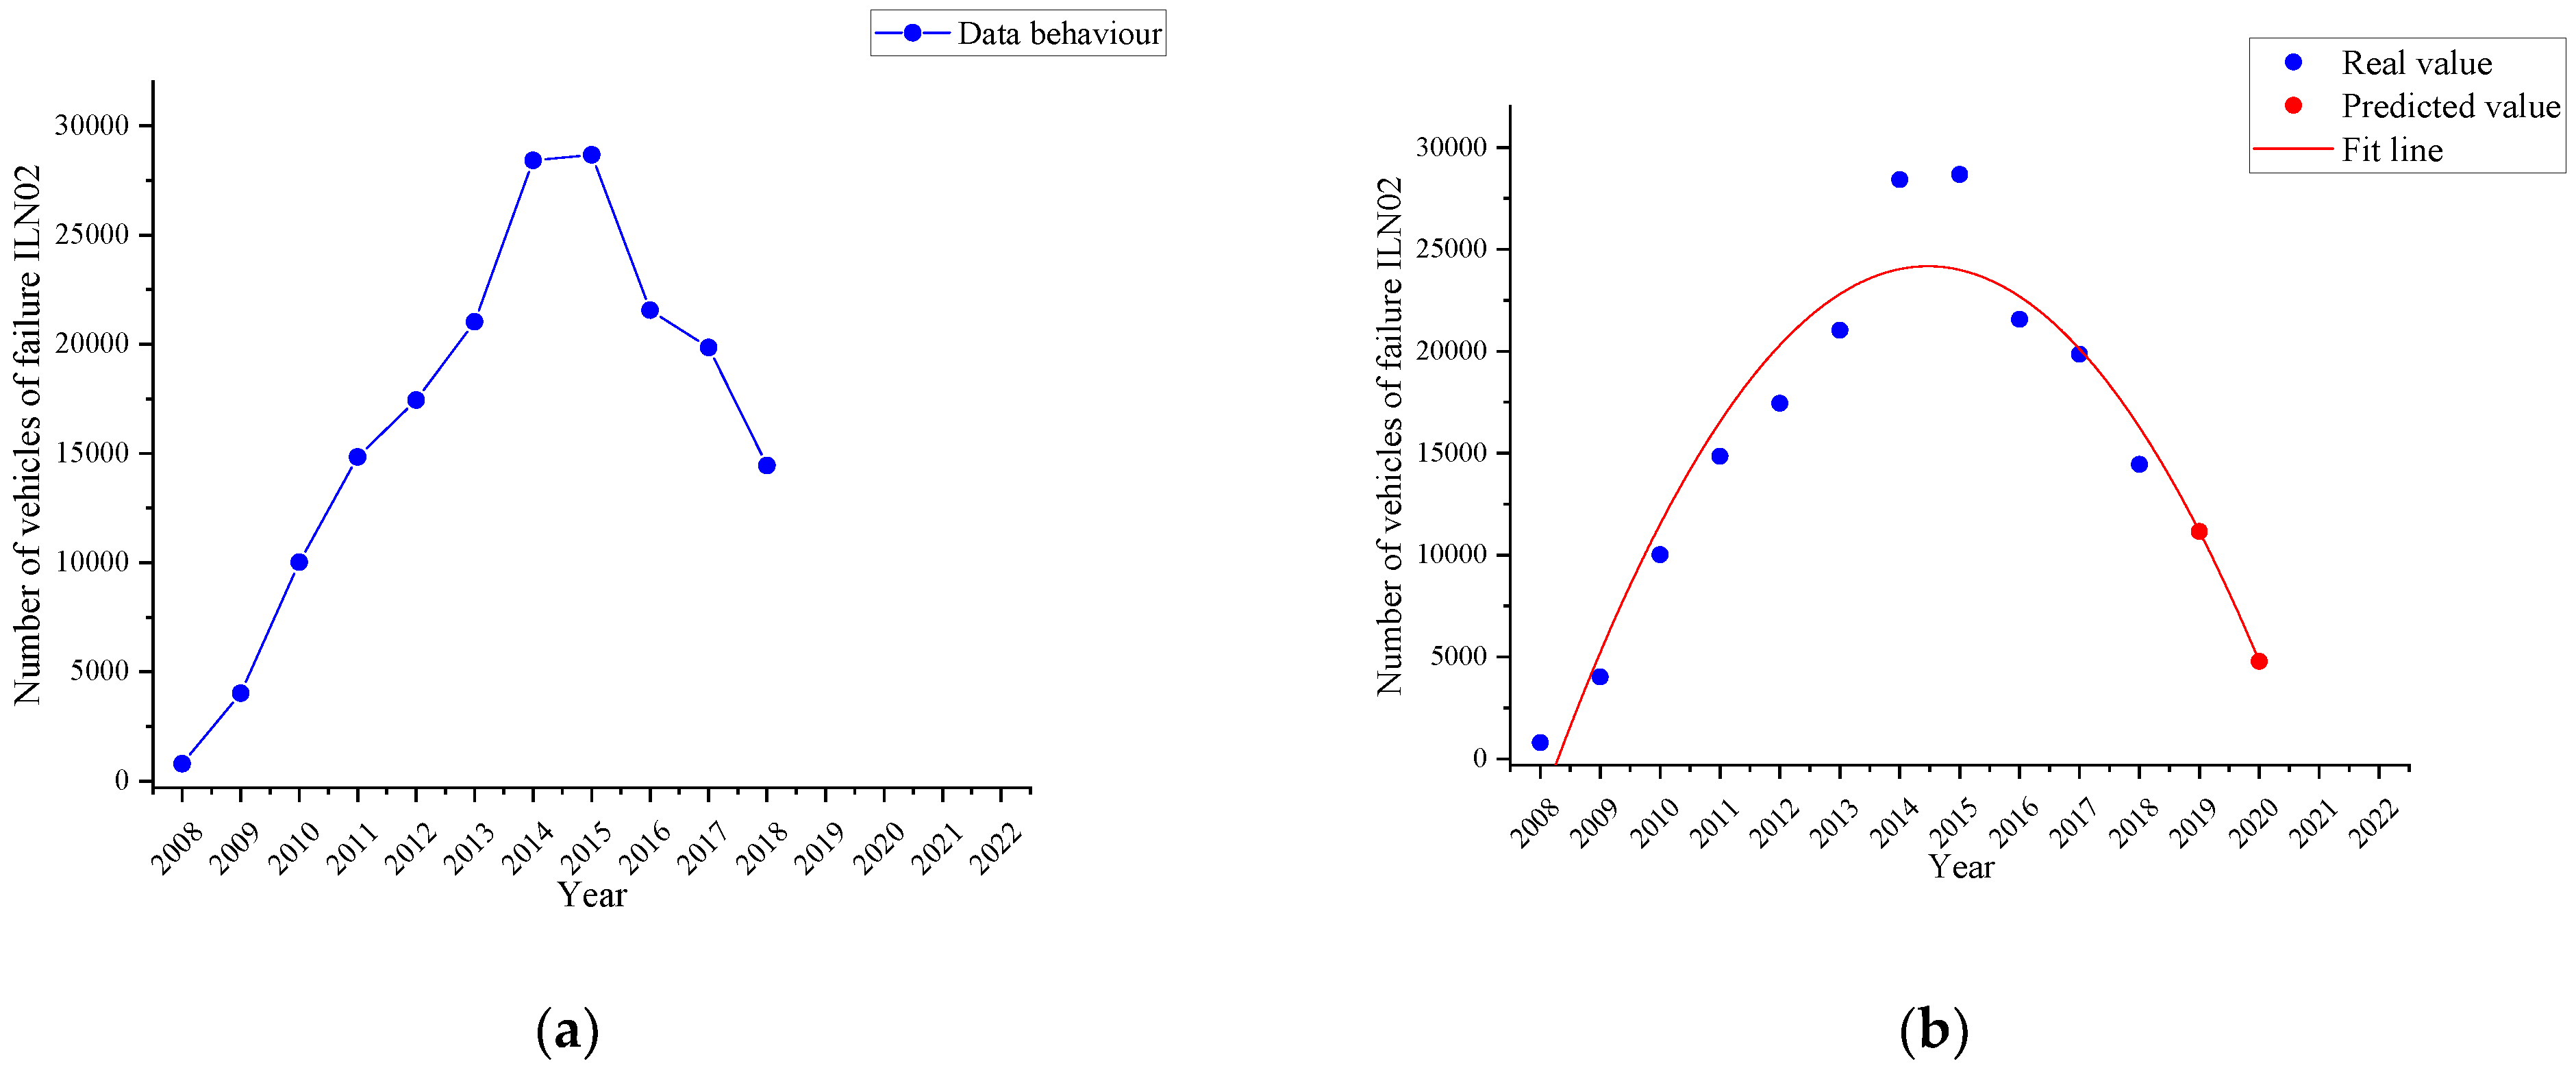
4.2.4. Insufficient Tyre Tread Failure Trend
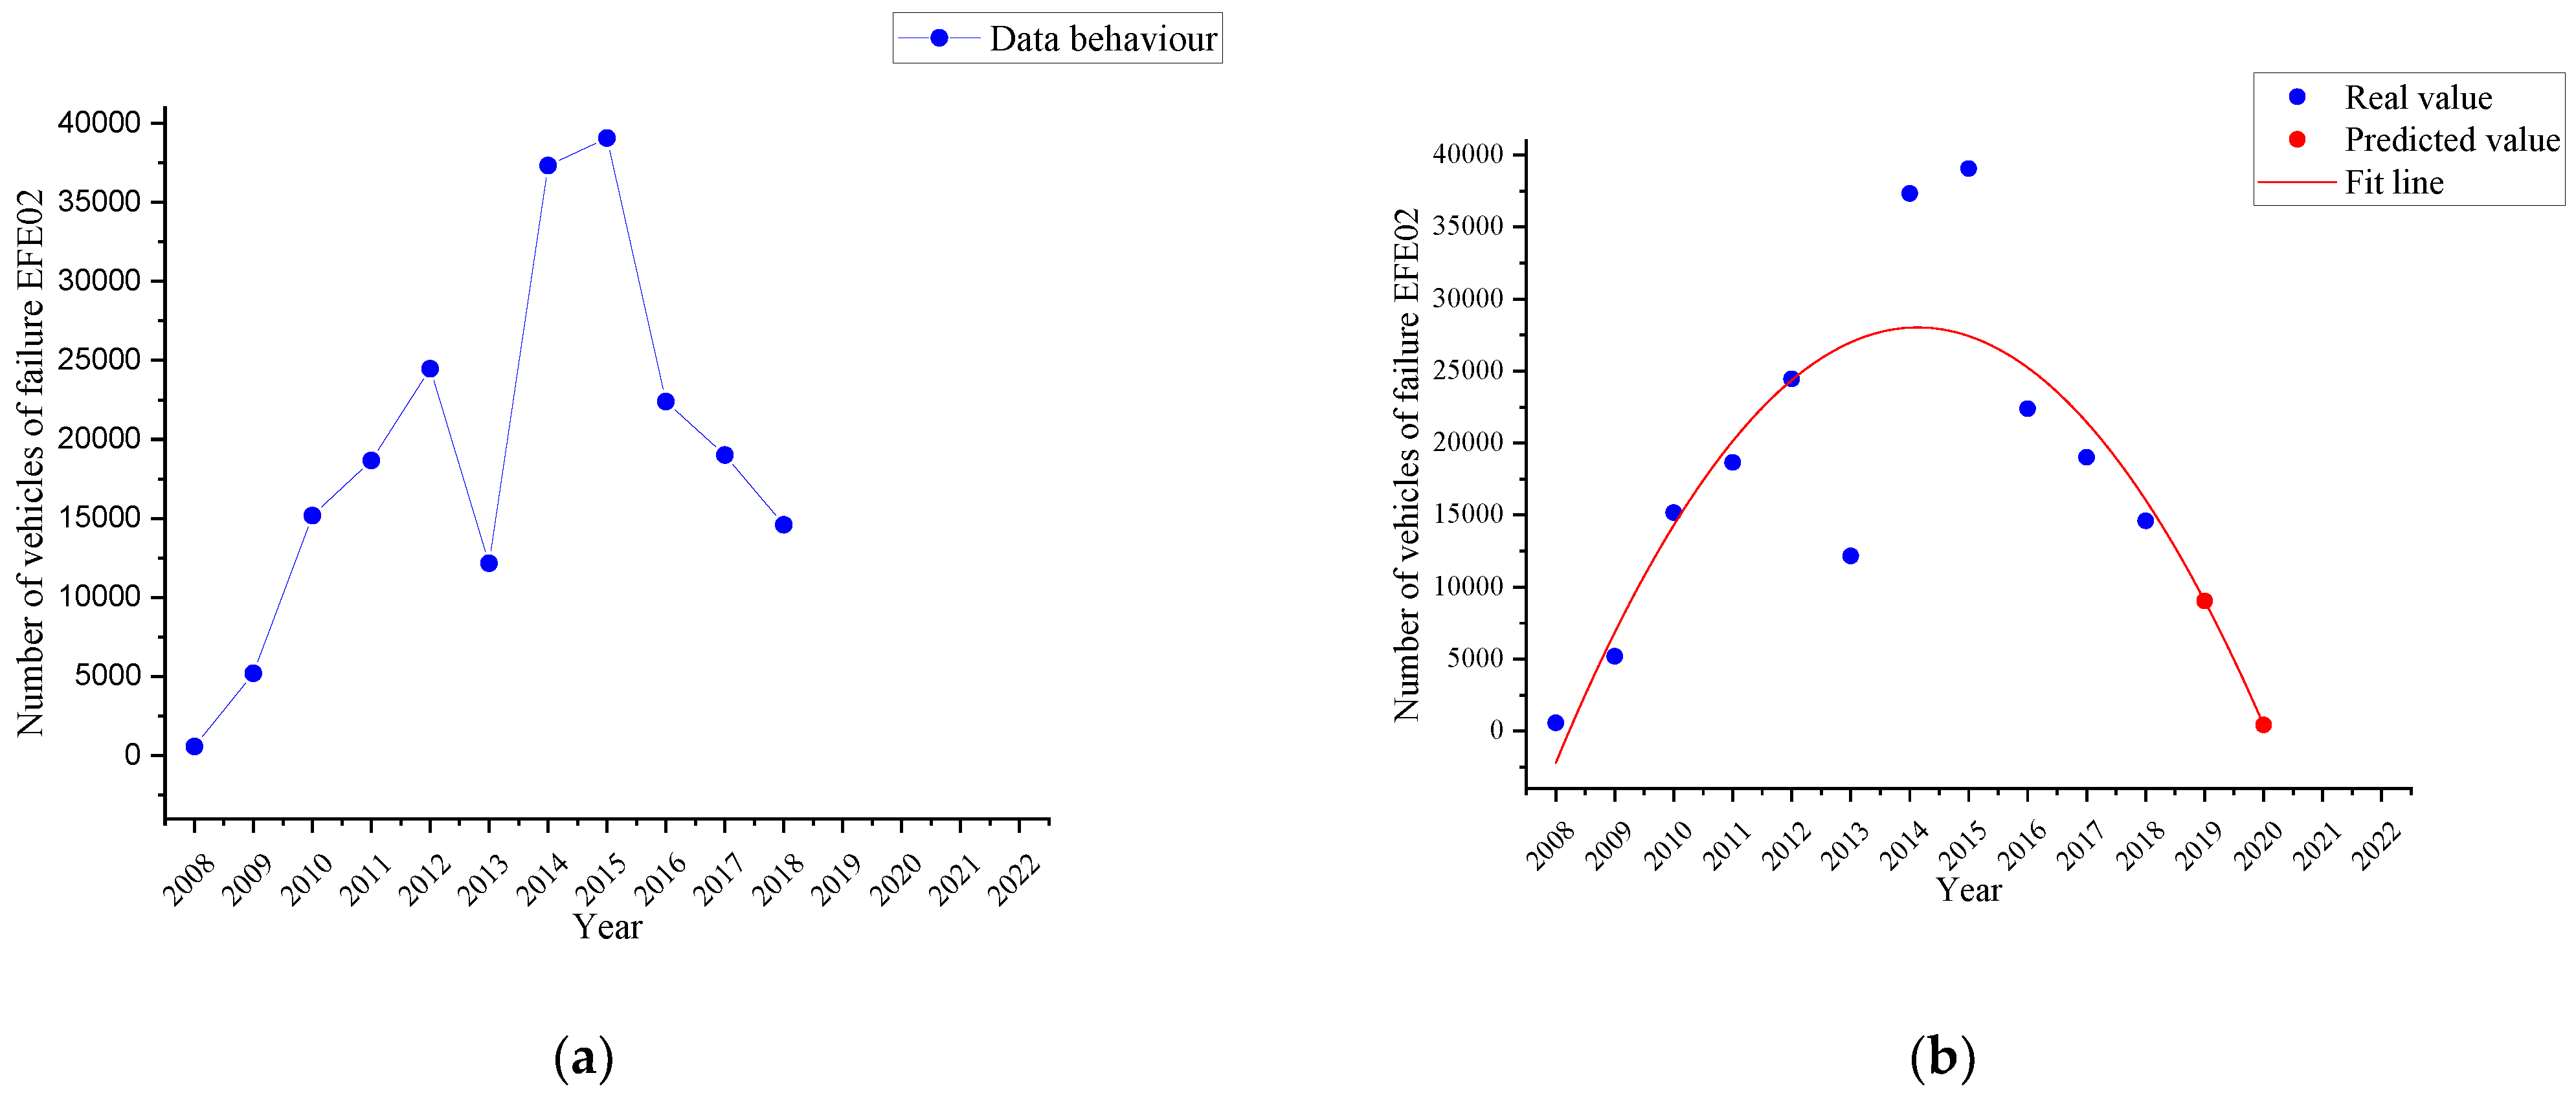
4.2.5. Parking Brake Effectiveness Failure Trend
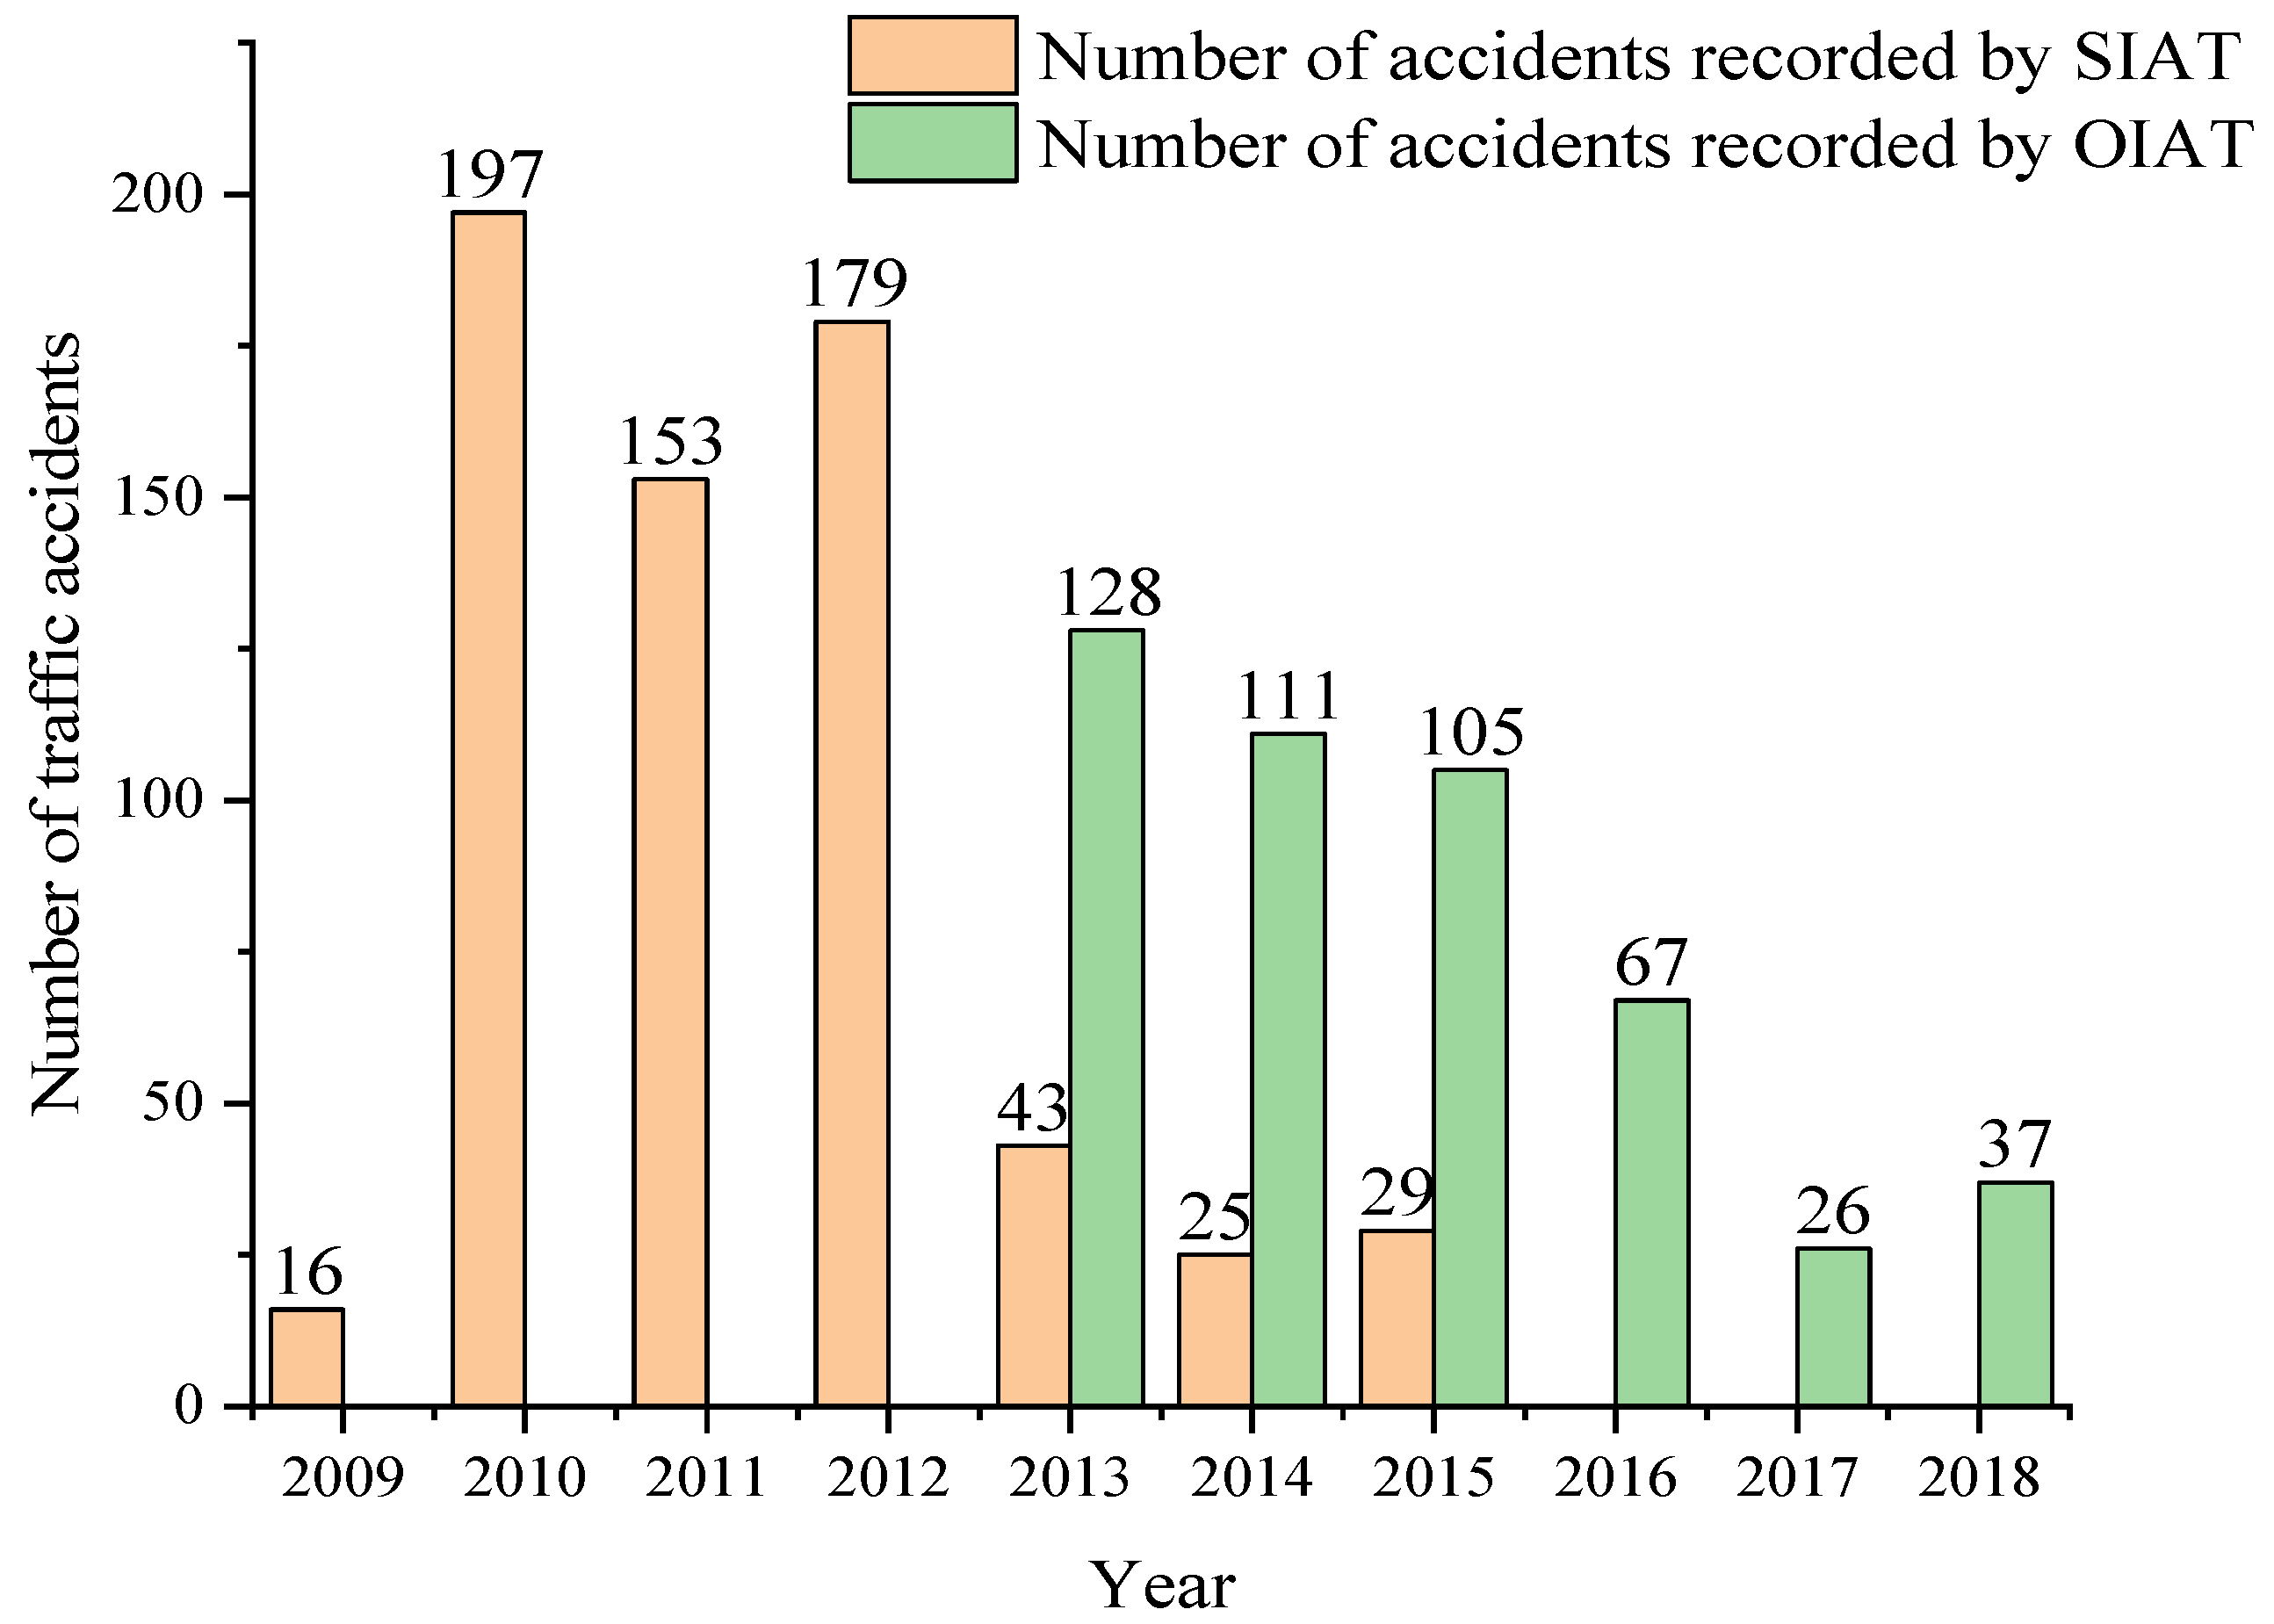
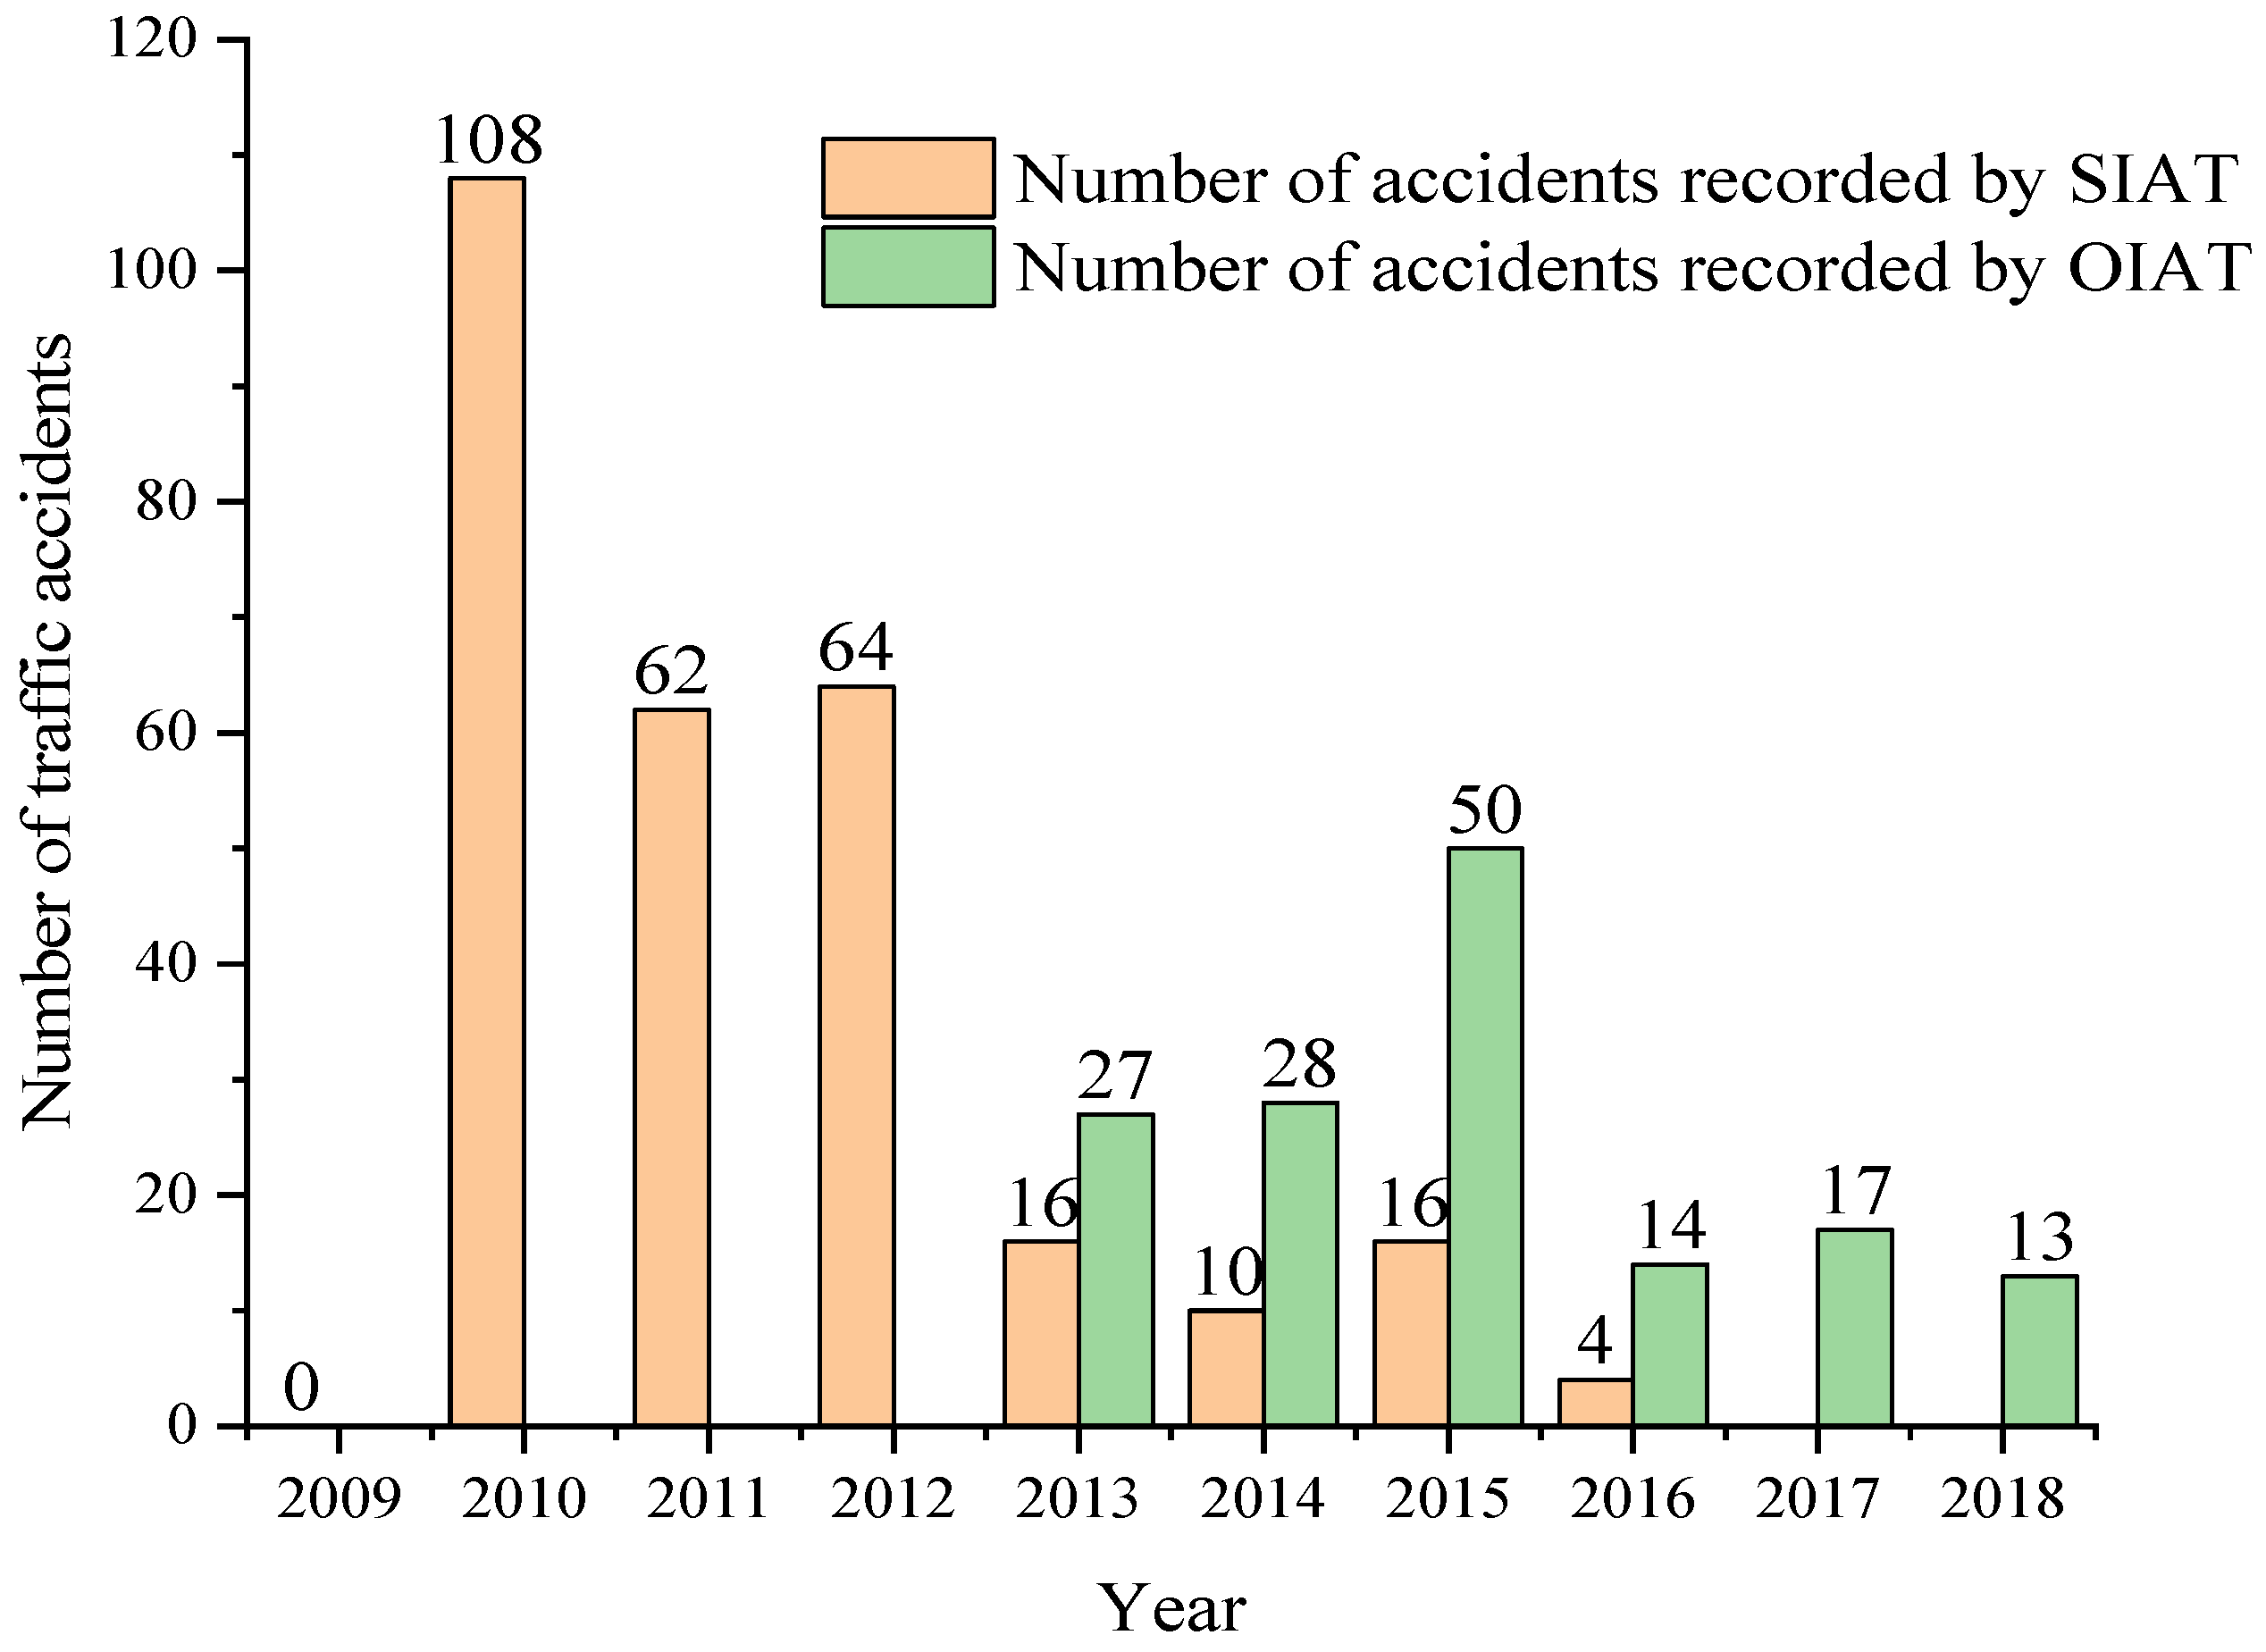
4.3. Vehicle Traffic Accidents for Subcategories M1, M3 and N1, of the City of Cuenca, Ecuador from 2009 to 2018
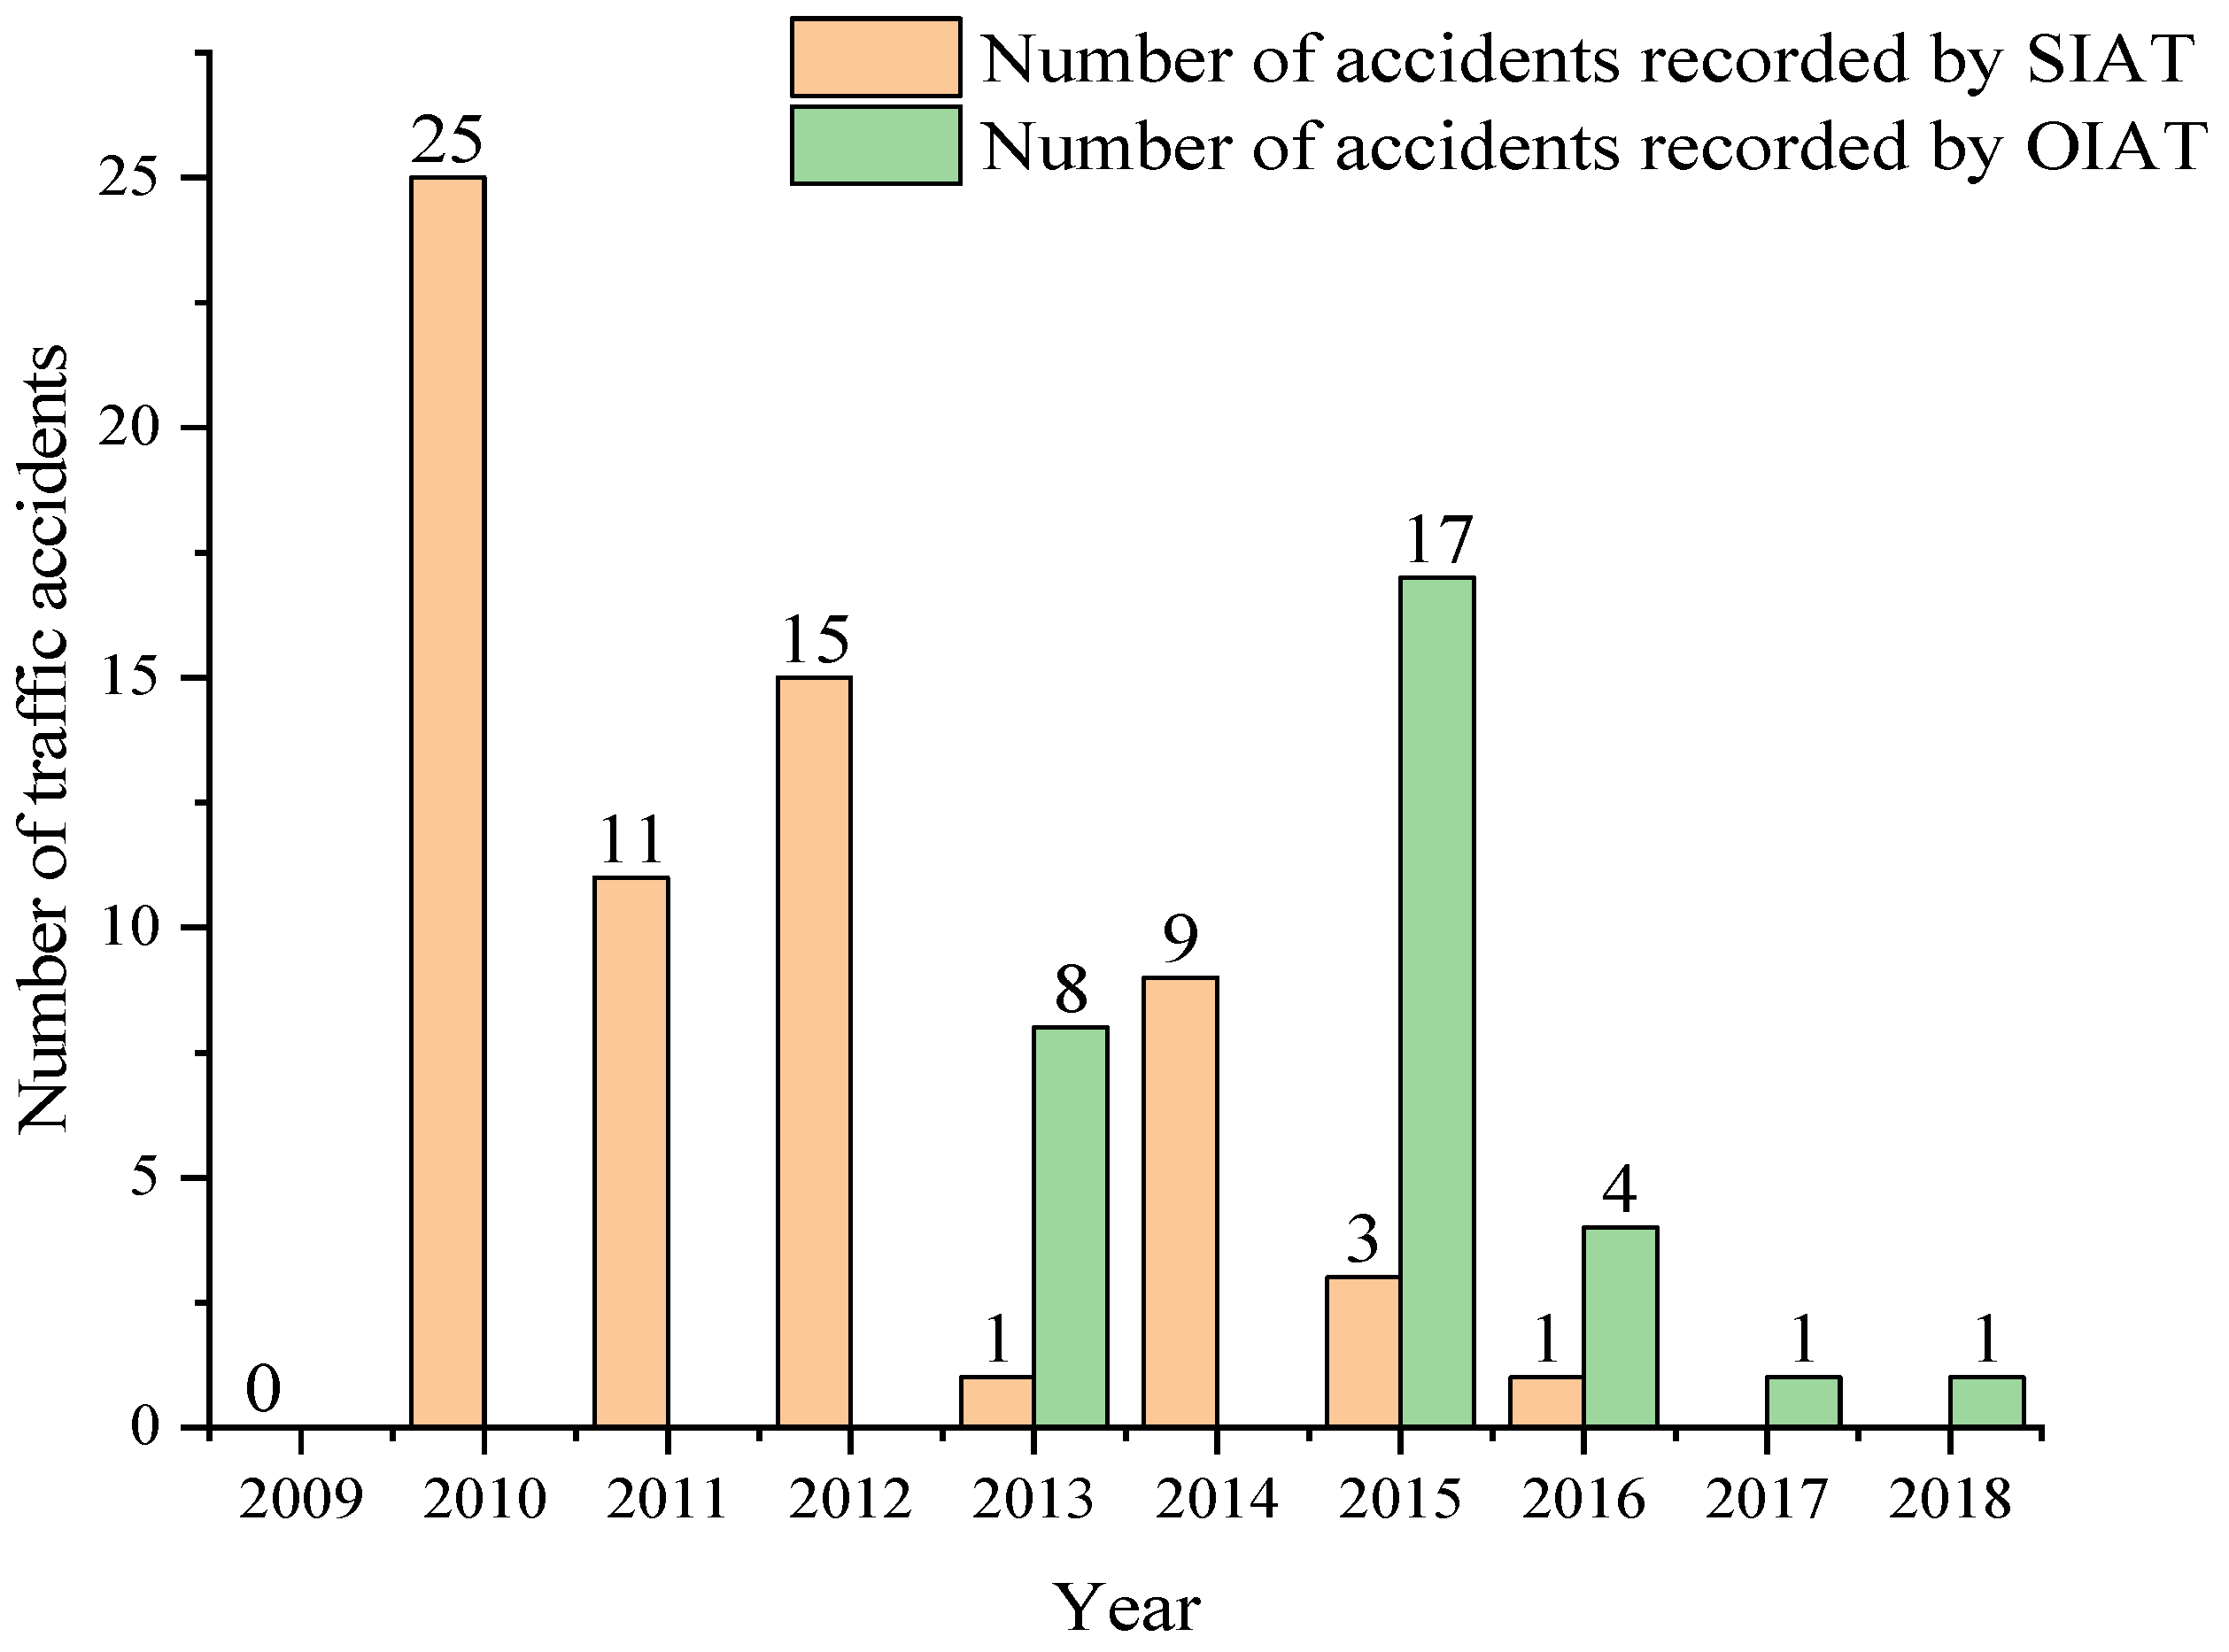
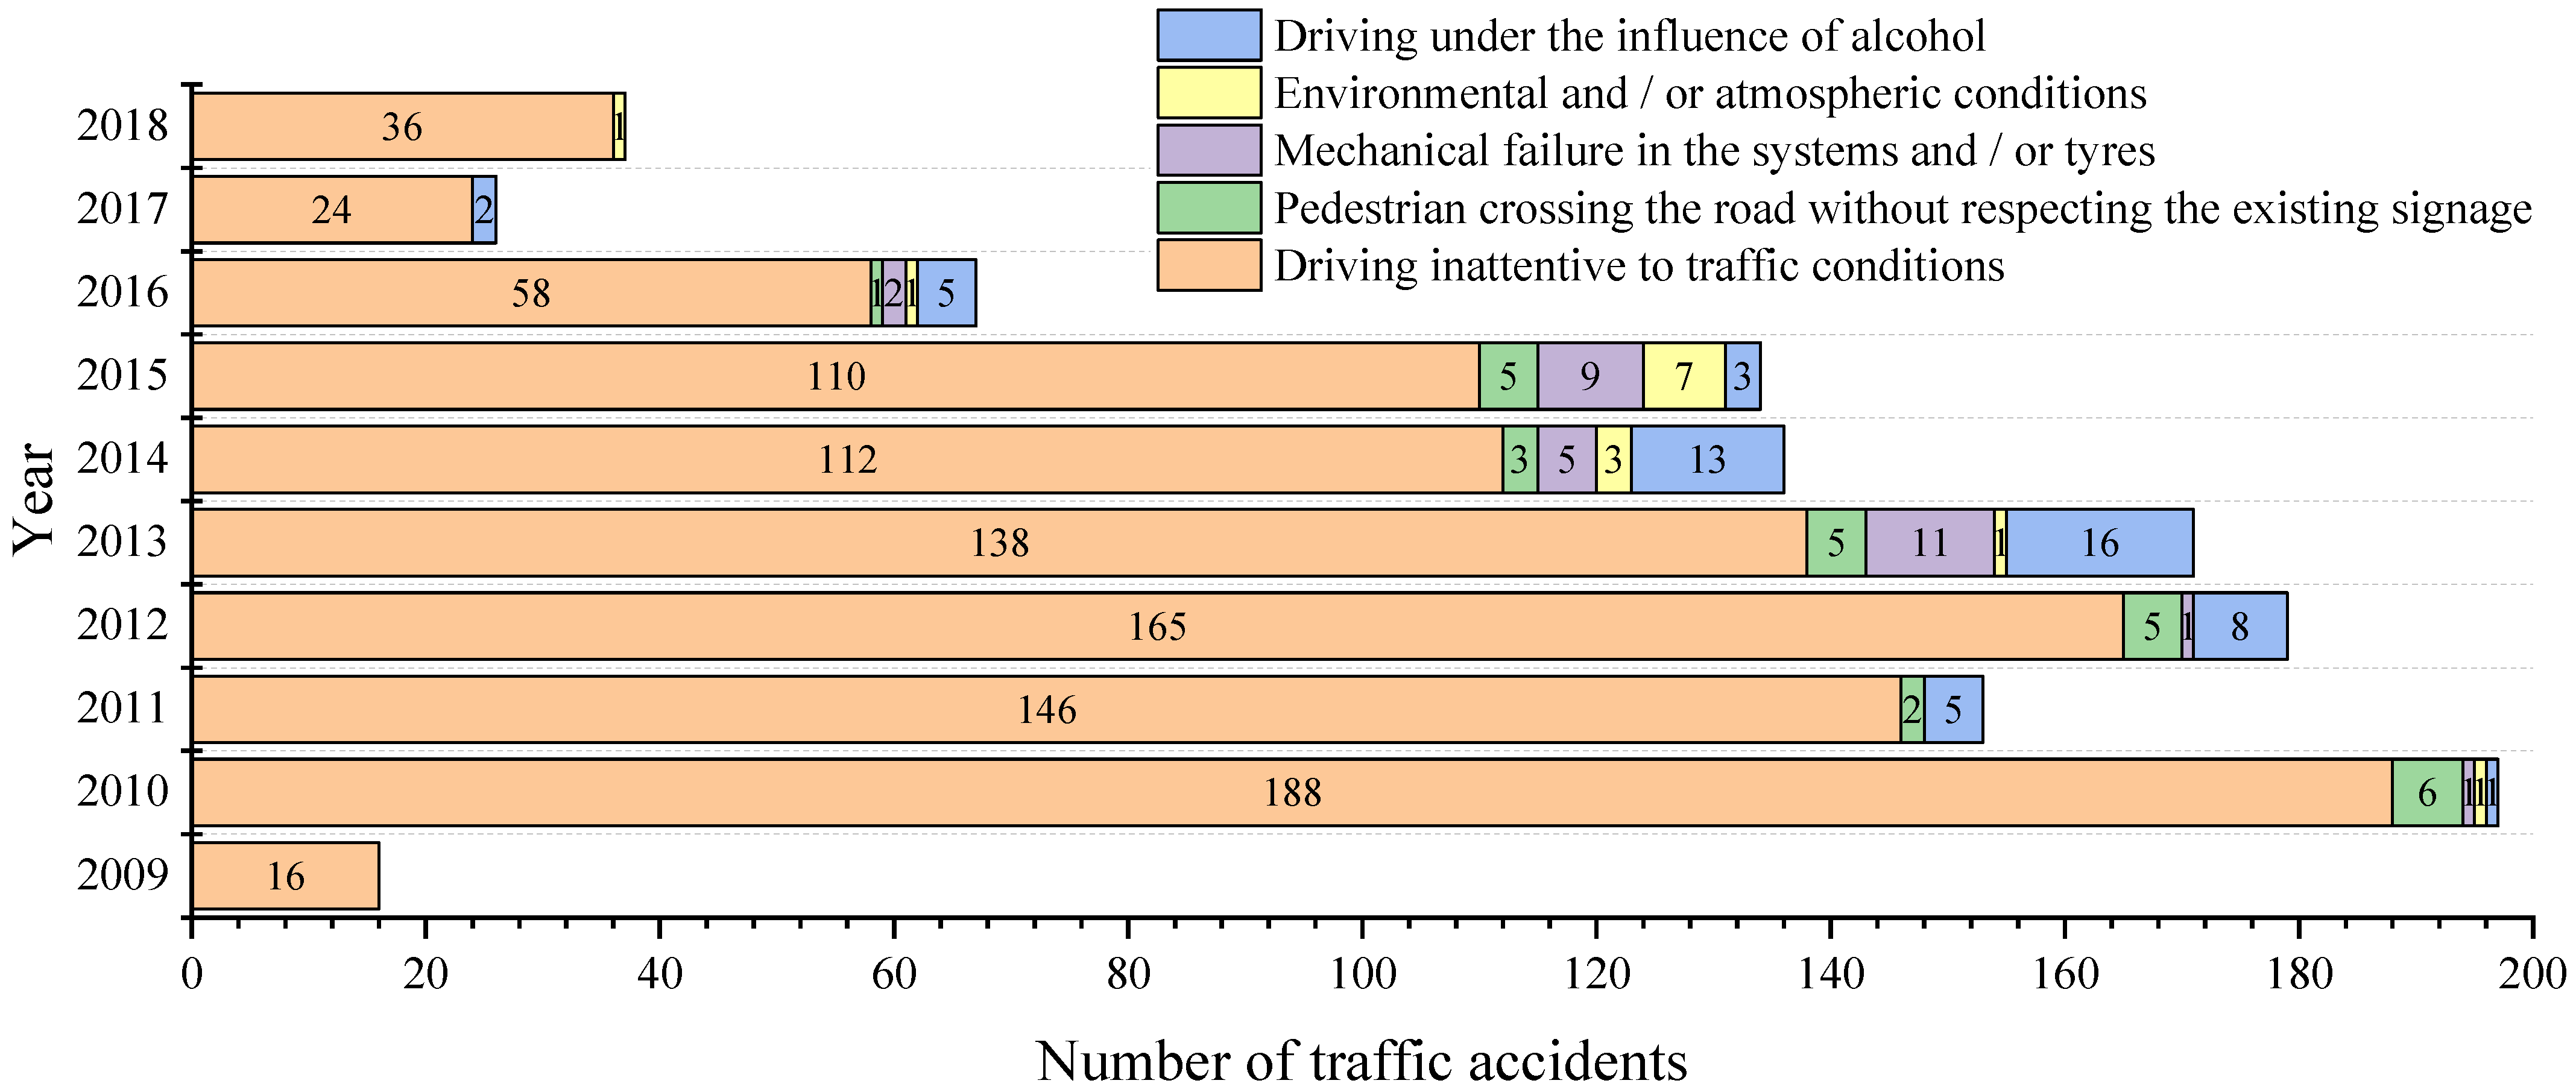
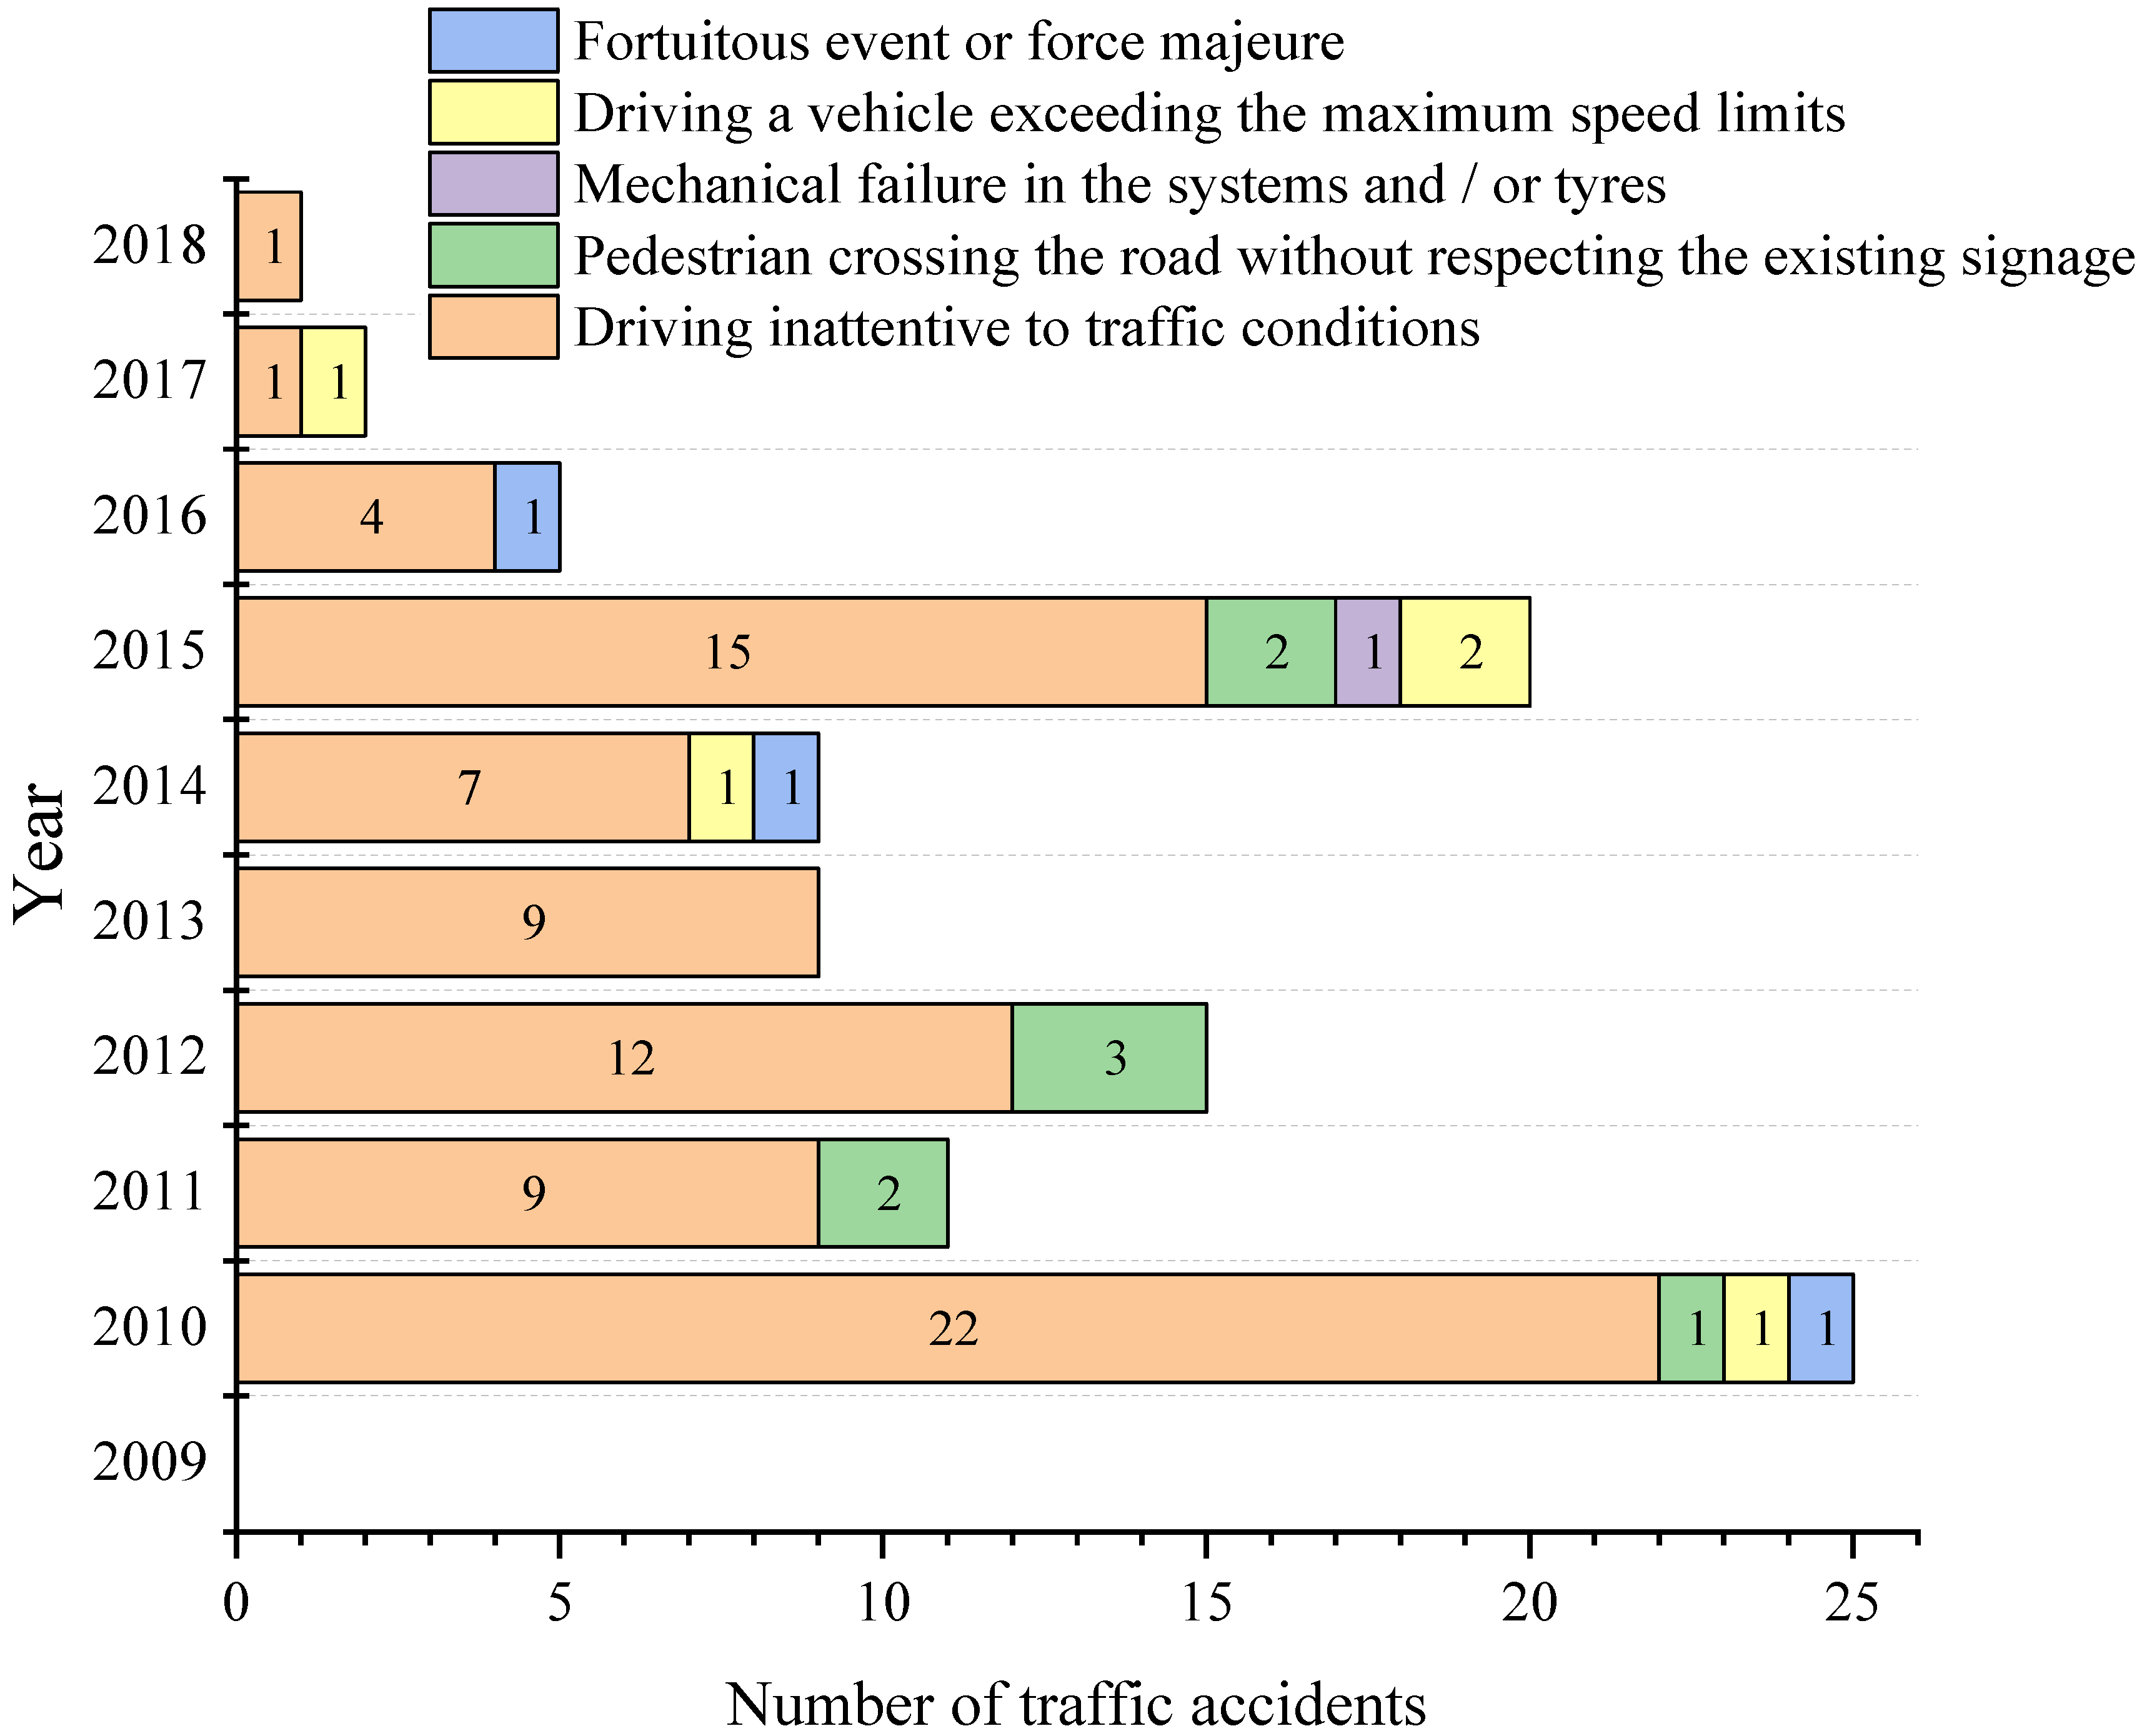
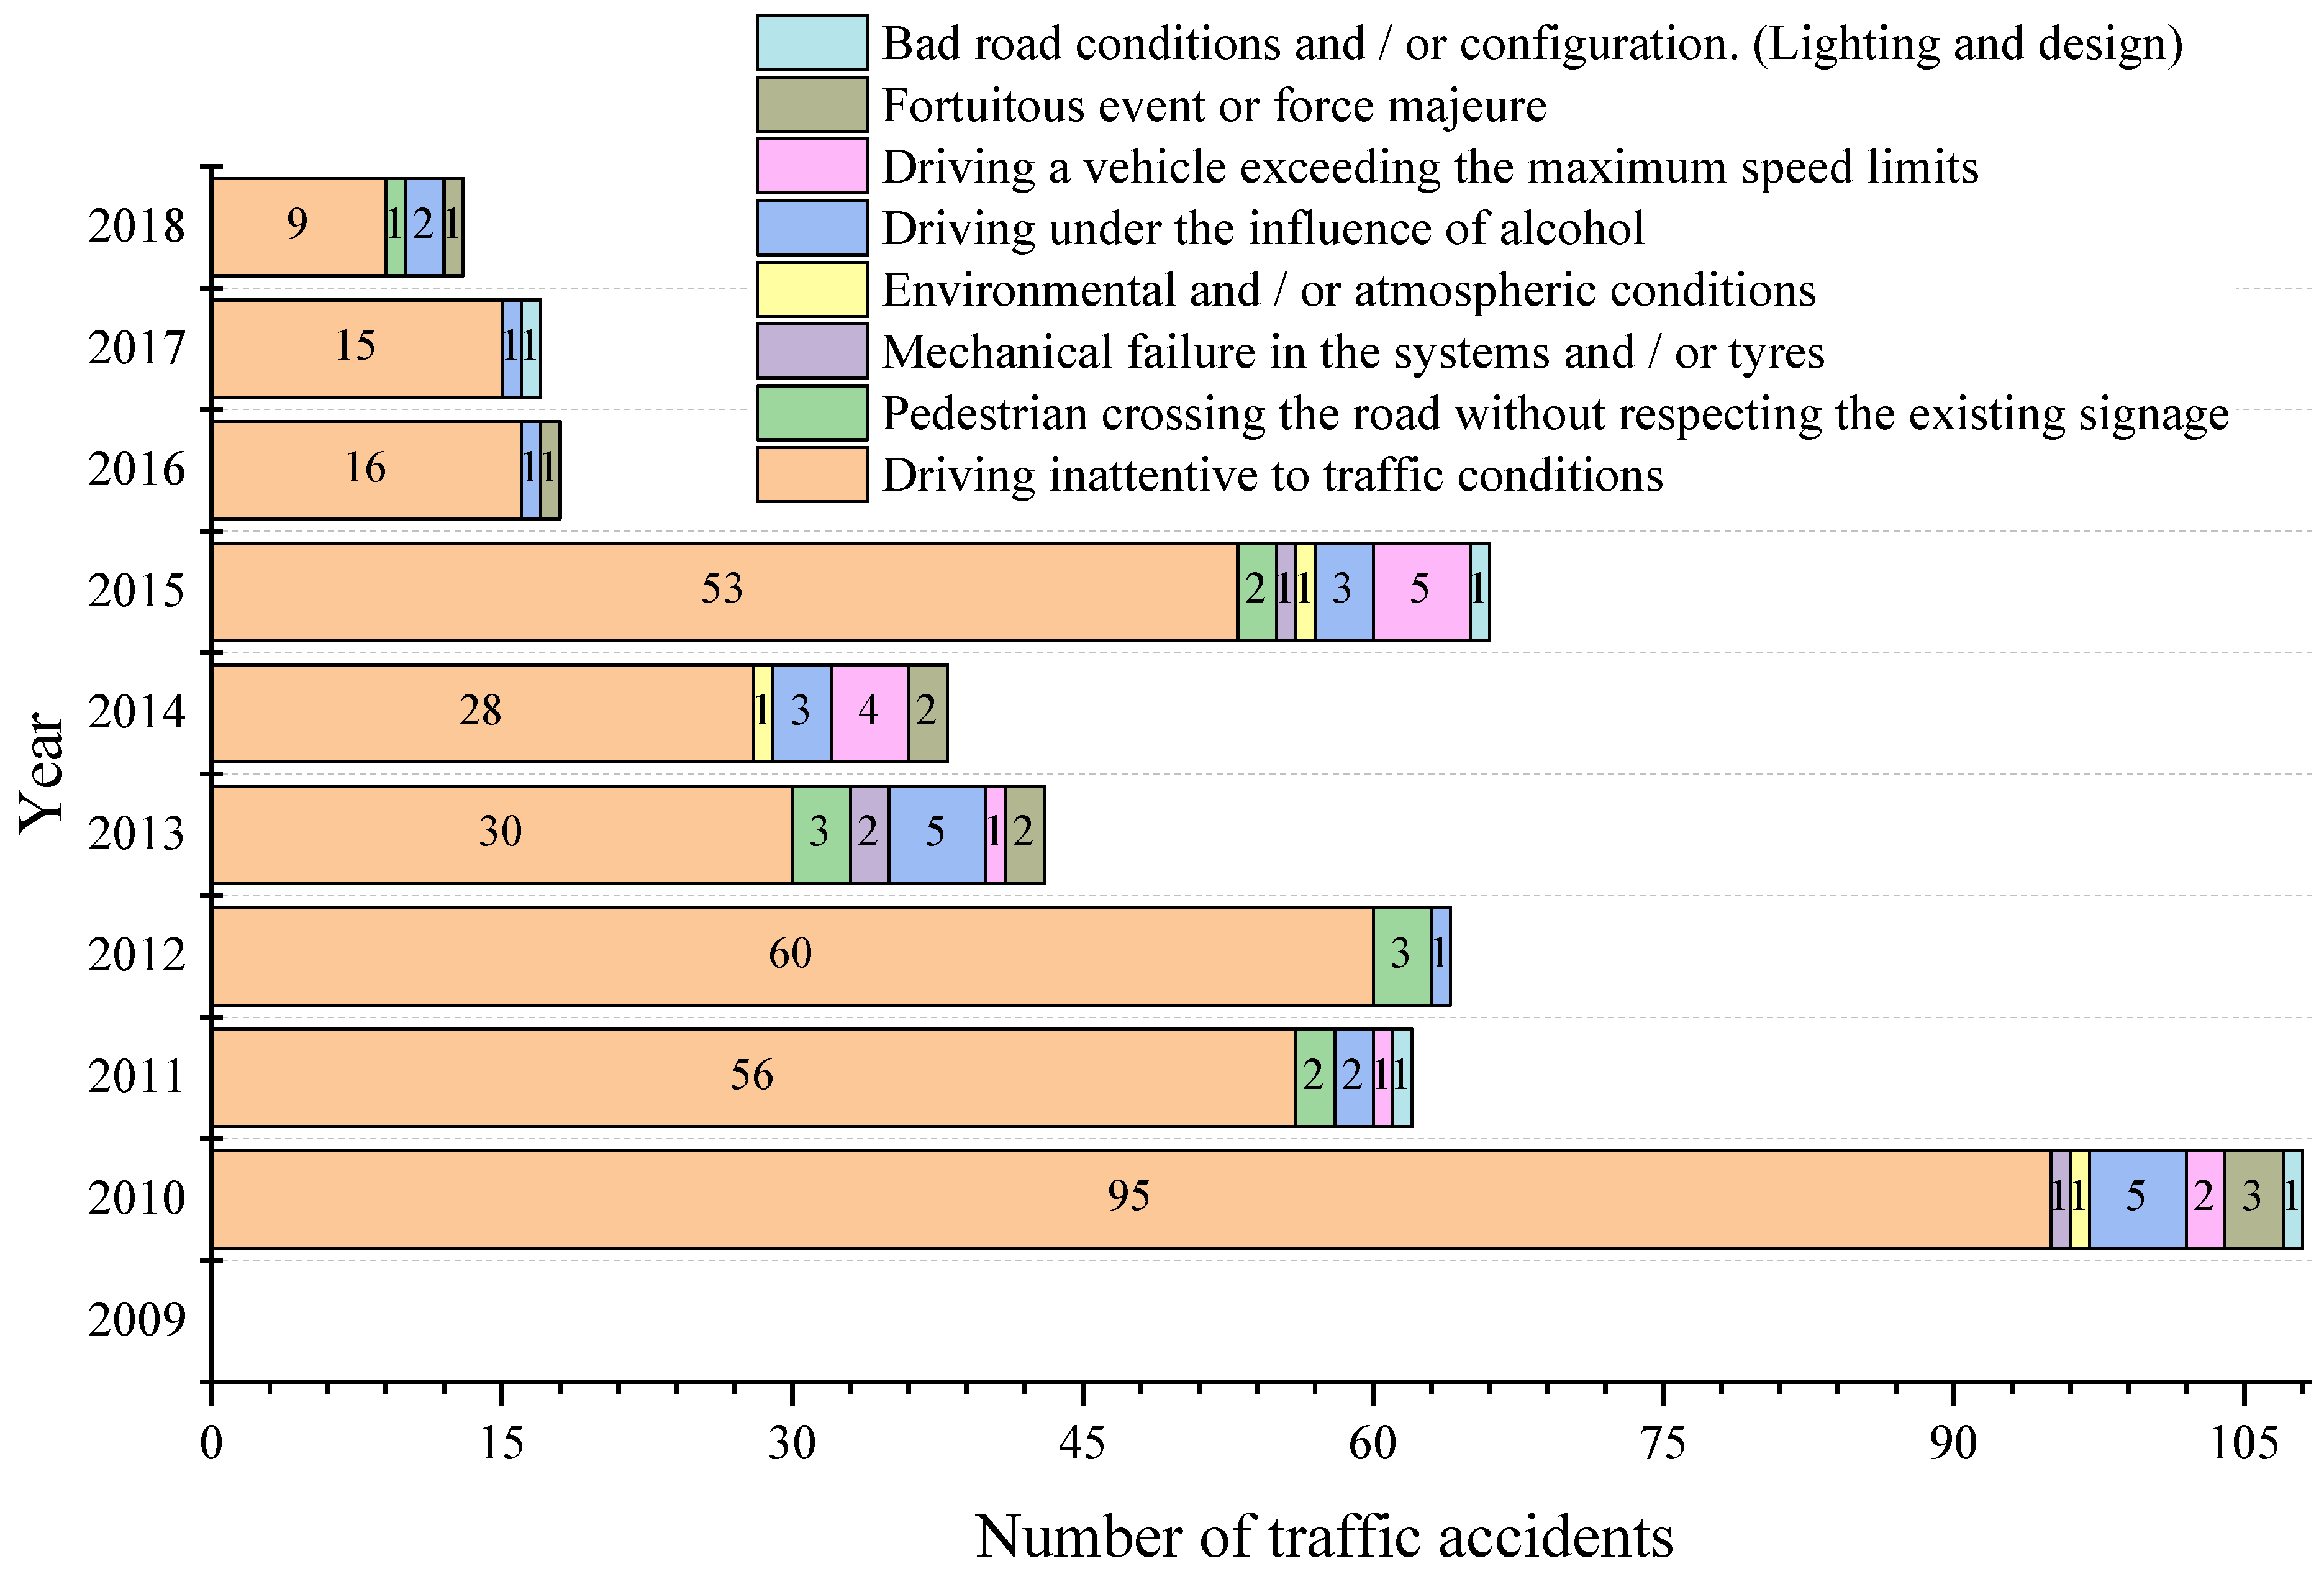
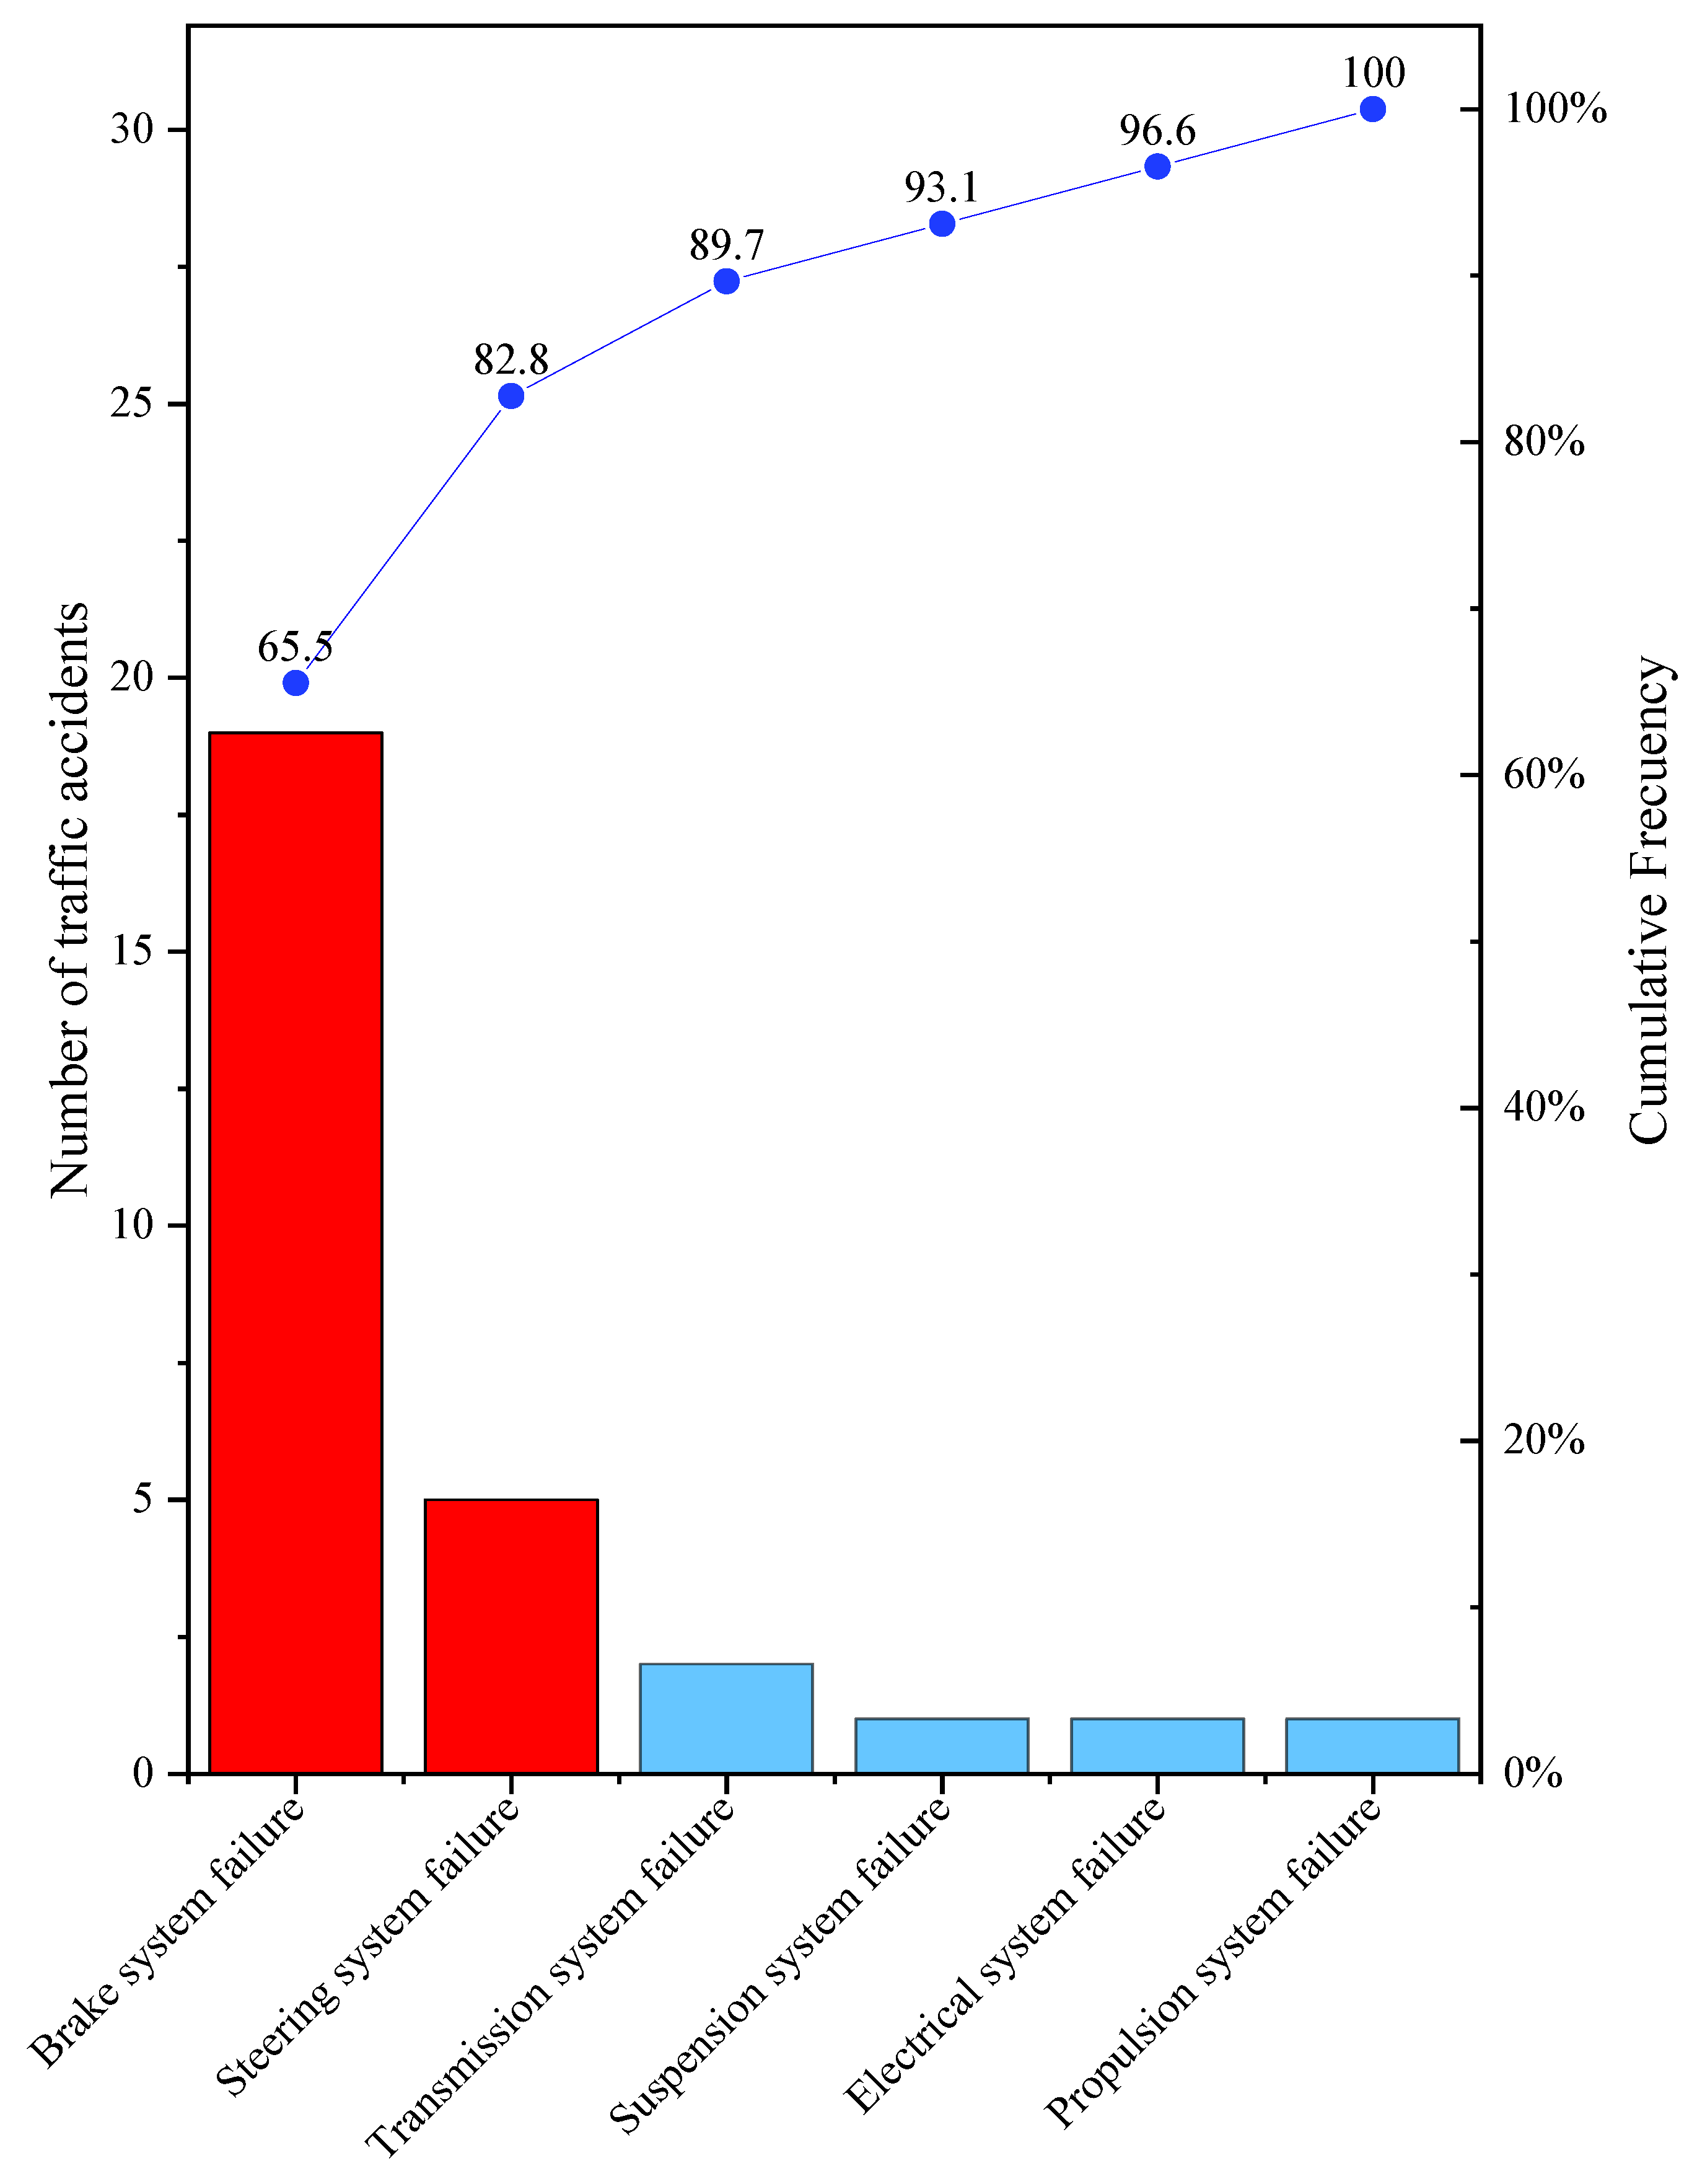
4.4. Traffic Accident Causes of Vehicles for Subcategories M1, M3 and N1, of the City of Cuenca-Ecuador from 2009 to 2018
5. Discussion
6. Conclusions
Author Contributions
Funding
Institutional Review Board Statement
Informed Consent Statement
Data Availability Statement
Acknowledgments
Conflicts of Interest
Appendix A

| MAHA_DESCRIPTION | CODE |
| BROKEN, INCOMPLETE SPRING CLAMPS | ABIR01 |
| ACCESSES WITH GROUND IN POOR CONDITION | APME02 |
| JOINT INADEQUATE FITTING | ARI03 |
| SPRING EYE BUSHINGS INADEQUATE FITTING | AIBOB04 |
| STEERING JOINT INCORRECT FITTING | AIRD05 |
| STEERING ARM INCORRECT FITTING | AIBD06 |
| 1ST AXLE CONVERGENCE ALIGNMENT | A1EC07 |
| HORIZONTAL ALIGNMENT DRIVER HEADLIGHT | AHFC08 |
| VERTICAL ALIGNMENT DRIVER HEADLIGHT | AVFC09 |
| HIGH-INTENSITY BRAKE LIGHT/LIGHTS | AILF10 |
| DETERIORATED STABILISER BAR BOLTS | ABED11 |
| DETERIORATED FRONT TURN SIGNAL DEVICES | ADDD12 |
| DETERIORATED REAR TURN SIGNAL DEVICES | ADPD13 |
| LOW-INTENSITY BRAKE LIGHTS | BILF01 |
| DETERIORATED POWER STEERING BELTS | BDHD02 |
| POOR CONDITION RUBBER BUSHINGS FRONT SHOCK ABSORBERS | BGMEAD03 |
| POOR CONDITION RUBBER BUSHINGS REAR SHOCK ABSORBERS | BGMEAP04 |
| POOR CONDITION ELECTRICAL CABLE INSTALLATION | CIEME01 |
| DETERIORATED RUBBER IN STEERING | CDD02 |
| BREAK CIRCUIT NOT CORRESPONDING TO ASSEMBLY | CFNCM03 |
| DEFICIENT ELECTRICAL INSTALLATION CONNECTIONS | CIED04 |
| AUXILIARY BRAKE FITTING DEFECTS | DFFA01 |
| BRAKING IMBALANCE ON 1AXLE | DF1E02 |
| BRAKING IMBALANCE ON 2AXLE | DF2E03 |
| SUSPENSION IMBALANCE ON 1AXLE | DS1E04 |
| SUSPENSION IMBALANCE ON 2AXLE | DS2E05 |
| VISIBLE DETERIORATIONS IN FRONT SHOCK ABSORBERS | DVAD06 |
| VISIBLE DETERIORATIONS IN REAR SHOCK ABSORBERS | DVAP07 |
| BRAKING EFFECTIVENESS | EF01 |
| PARKING BRAKE EFFECTIVENESS | EFE02 |
| RIGHT WHEEL SUSPENSION EFFECTIVENESS OF 1AXLE | ESRD1E03 |
| RIGHT WHEEL SUSPENSION EFFECTIVENESS OF 2AXLE | ESRD2E04 |
| LEFT WHEEL SUSPENSION EFFECTIVENESS OF 1AXLE | ESRI1E05 |
| RIGHT WHEEL SUSPENSION EFFECTIVENESS OF 2AXLE | ESRI2E06 |
| CABLE BOARD CONDITION | ECT07 |
| FRONT SHOCK ABSORBERS MISSING | FAD01 |
| REAR SHOCK ABSORBERS MISSING | FAP02 |
| STEERING STOP CAPS MISSING | FTD03 |
| FRONT HEADLIGHTS WITH CRACKED OR BROKEN GLASS | FFCR04 |
| DETERIORATED FRONT HEADLIGHTS | FFD05 |
| FRONT HEADLIGHTS NOT WORKING | FFNF06 |
| STEERING–CHASSIS COLUMN DEFECTIVE FITTING | FCDCD07 |
| FRONT HEADLIGHTS DEFICIENT FITTING | FDFF08 |
| DRUM/DISC INADEQUATE FITTING | FITD09 |
| FRONT SHOCK ABSORBER INCORRECT FITTING | FIAD10 |
| REAR SHOCK ABSORBER INCORRECT FITTING | FIAP11 |
| STEERING JOINT INCORRECT FITTING | FIRD12 |
| STEERING WHEEL–COLUMN INCORRECT FITTING | FVCDD13 |
| FLUID LEAK IN BRAKE SYSTEM | FLSF14 |
| WINDSCREEN WASHER DEFECTIVE OPERATION | FDL15 |
| WINDSCREEN WIPER DEFECTIVE OPERATION | FDLP16 |
| AUXILIARY BRAKE INADEQUATE OPERATION | FIFA17 |
| LIGHT SWITCHING INADEQUATE OPERATION | FICL18 |
| TURN SIGNAL INADEQUATE OPERATION | FID19 |
| LIGHT GUIDANCE INADEQUATE OPERATION | FIGL20 |
| PARKING LIGHTS INADEQUATE OPERATION | FILP21 |
| REVERSE LIGHT INADEQUATE OPERATION | FILR22 |
| DASHBOARD LIGHT INADEQUATE OPERATION | FILT23 |
| BROKEN OR DISPLACED LEAF SPRINGS | HBRD01 |
| DETERIORATED AUXILIARY BRAKE ELECTRICAL INSTALLATION | IEFAD01 |
| INSUFFICIENT TYRE TREAD | ILN02 |
| DRIVER HEADLIGHT INTENSITY | IFC03 |
| DEFECTIVE INTERMITTENCY | ID04 |
| SETS OR WEARS IN STEERING BARS | JDBD01 |
| RADIAL OR AXIAL SETS NOT ACCEPTABLE IN STEERING WHEEL | JRANAV02 |
| SETS OR WEARS IN GEARBOX | JDCD03 |
| NON-EXISTENT WINDSCREEN WASHER | LI01 |
| DETERIORATED WINDSCREEN WIPER | LPD02 |
| DETERIORATED BRAKE LIGHTS | LFD03 |
| BRAKE LIGHTS DO NOT TURN ON WHEN OPERATING THE PEDAL | LFNEAP04 |
| DETERIORATED FRONT POSITION LIGHTS | LPDD05 |
| DETERIORATED REAR POSITION LIGHTS | LPPD06 |
| DETERIORATED ROOF LIGHTS | LTD07 |
| EXISTING FRONT SPECIAL LIGHTS | LEDE08 |
| PLATE LIGHT NOT WORKING | LPNF09 |
| REVERSE LIGHT INADEQUATE COLOUR | LRCI10 |
| REVERSE LIGHT NOT WORKING | LRNF11 |
| PLATE LIGHT NOT REGULATORY | LPNR12 |
| LEAKING POWER STEERING HOSE | MDHP01 |
| SUSPENSION TABLES WITH CRACKS OR DEFORMED | MSFD02 |
| MODIFICATIONS AND WELDINGS IN STEERING BARS | MSBD03 |
| MODIFICATIONS AND WELDINGS IN STEERING ARM | MSBRD04 |
| TYRES WITH CRACKS, CUTS OR FAILURES | NRCF01 |
| LOW BRAKE FLUID LEVEL | NLFB02 |
| HIGH INDICATOR DOES NOT TURN ON OR NOT WORKING | NEIA03 |
| LOW INDICATOR DOES NOT TURN ON OR NOT WORKING | NEIB04 |
| TELL-TALE LIGHTS NOT WORKING OR DOES NOT HAVE | NFNDTL05 |
| FRONT TURN SIGNALS NOT WORKING | NFDD06 |
| REAR TURN SIGNALS NOT WORKING | NFDP07 |
| BRAKE LIGHTS NOT WORKING | NFLF08 |
| PARKING LIGHTS NOT WORKING | NFLP09 |
| BRAKE PEDAL SINKS WHEN HOLDING PRESSURE | PFCMP01 |
| FLUID LEAK IN FRONT SHOCK ABSORBERS | PFAD02 |
| FLUID LEAK IN REAR SHOCK ABSORBERS | PFAP03 |
| POWER STEERING FLUID LEAK | PFHD04 |
| DETERIORATED CLAMP/CALLIPER | PMD05 |
| TYRE TREAD PATTERN NOT SUITABLE | RNNA01 |
| BRAKED WHEEL (BRAKE TEST IS NOT PERFORMED AT S.) | RF02 |
| POWER STEERING GENERAL NOISE | RGDH03 |
| BLOWHOLES IN TYRES | SEN01 |
| FASTENING PUMP OR STEERING CYLINDER | SBCD02 |
| DETERIORATED OR WEARED DRUM/DISC | TDDD01 |
| NON-EXISTENT SUSPENSION REBOUND STOP CAPS | TRSI02 |
| BRAKE SYSTEM VALVES/CONNECTIONS | VCSF01 |
References
- Organización Mundial de la Salud Plan Mundial para el Decenio de Acción para la Seguridad Vial 2011–2020. 2010, p. 28. Available online: https://www.hofmannla.com/wp-content/uploads/2020/06/plan-Mundial-para-el-decenio-de-accion-para-la-seguridad-vial-2011-2020_spanish.pdf (accessed on 10 February 2020).
- Reglamento Ley Organica de Transporte Terrestre Transito y Seguridad Vial Reglamento Ley Organica de Transporte Terrestre Transito y Seguridad Vial. Available online: https://www.ant.gob.ec/index.php/ley-de-transparencia/ley-de-transparencia-2020/file/2255-reglamento-ley-organica-de-transporte-terrestre-transito-y-seguridad-vial (accessed on 11 February 2020).
- GAD Municipal del Cantón Cuenca Codificación a la Ordenanza que Norma el Establecimiento del Sistema de Revisión Técnica Vehicular de Cuenca y la Delegación de Competencias a Cuencaire, Corporación para el Mejoramiento del Aire de Cuenca. Available online: http://www.cuenca.gov.ec/?q=node/8941 (accessed on 11 February 2020).
- Ilustre Municipalidad de Cuenca Comisión de Gestión Ambiental Premio a Las Mejores Prácticas Seccionales III Edición 2007. Available online: http://www.congope.gob.ec/wp-content/uploads/2017/04/03AM02-0101.pdf (accessed on 11 February 2020).
- EMOV EP Rendición de Cuentas 2017. Available online: https://www.emov.gob.ec/sites/default/files/Rendici%C3%B3n%20de%20Cuentas_%20EMOV_2017.pdf (accessed on 14 February 2020).
- World Health Organization. World Health Organization Global Status Report on Road Safety 2018; World Health Organization: Geneva, Switzerland, 2018; ISBN 978-92-4-156568-4. [Google Scholar]
- Organización Panamericana de la Salud. Estado de la seguridad vial en la Región de las Américas; OPS: Washington, DC, USA, 2019; ISBN 978-92-75-32086-0. [Google Scholar]
- Transport Safety Performance in the EU—A Statistical Overview|ETSC. Available online: https://etsc.eu/transport-safety-performance-in-the-eu-a-statistical-overview/ (accessed on 30 March 2022).
- Instituto Nacional de Estadística y Censos Transporte. Available online: https://www.ecuadorencifras.gob.ec/transporte/ (accessed on 30 March 2022).
- Agencia Nacional de Tránsito del Ecuador Estadísticas Sobre Siniestros de Tránsito. Available online: https://www.ant.gob.ec/index.php/estadisticas (accessed on 10 February 2020).
- Espinoza-Molina, F.E.; Ojeda-Romero, C.F.; Zumba-Paucar, H.D.; Pillajo-Quijia, G.; Arenas-Ramírez, B.; Aparicio-Izquierdo, F. Road Safety as a Public Health Problem: Case of Ecuador in the Period 2000–2019. Sustainability 2021, 13, 8033. [Google Scholar] [CrossRef]
- Peck, D.; Scott Matthews, H.; Fischbeck, P.; Hendrickson, C.T. Failure Rates and Data Driven Policies for Vehicle Safety Inspections in Pennsylvania. Transp. Res. Part Policy Pract. 2015, 78, 252–265. [Google Scholar] [CrossRef] [Green Version]
- Cordero, C.A.; Sanz, J.L.M.; Wiña, P.L. Measurement of Machinery Safety Level in the European Market: A Real Case Based on Market Surveillance Data. Saf. Sci. 2009, 47, 1351–1358. [Google Scholar] [CrossRef]
- Poitras, M.; Sutter, D. Policy Ineffectiveness or Offsetting Behavior? An Analysis of Vehicle Safety Inspections. South Econ. J. 2002, 68, 922–934. [Google Scholar] [CrossRef]
- Hoagland, A.; Woolley, T. It’s No Accident: Evaluating the Effectiveness of Vehicle Safety Inspections: Evaluating Vehicle Inspections. Contemp. Econ. Policy 2018, 36, 607–628. [Google Scholar] [CrossRef] [Green Version]
- Dobromirov, V.; Verkhorubov, V.; Chernyaev, I. Systematizing the Factors That Determine Ways of Developing the Vehicle Maintenance System and Providing Vehicle Safety. Transp. Res. Procedia 2018, 36, 114–121. [Google Scholar] [CrossRef]
- Agbo, A.A.; Li, W.; Zheng, L.; Atombo, C. An Empirical Inquiry into Maintenance Work of Auto-Mechanics and Its Relative Bearing on Road Traffic Accidents—A Developing Country Case, Ghana. Int. J. Eng. Res. Afr. 2018, 34, 139–160. [Google Scholar] [CrossRef]
- Assemi, B.; Hickman, M. Relationship between Heavy Vehicle Periodic Inspections, Crash Contributing Factors and Crash Severity. Transp. Res. Part Policy Pract. 2018, 113, 441–459. [Google Scholar] [CrossRef]
- Quijano, J.L.M.; Quiroga, J.A.G. Puntos críticos de accidentes de tránsito en Ibagué, Colombia. Estud. Demogr. Urbanos 2021, 36, 673–715. [Google Scholar] [CrossRef]
- Giummarra, M.J.; Beck, B.; Gabbe, B.J. Classification of Road Traffic Injury Collision Characteristics Using Text Mining Analysis: Implications for Road Injury Prevention. PLoS ONE 2021, 16, e0245636. [Google Scholar] [CrossRef]
- Taneerananon, P.; Suanpaga, V.; Kronprasert, N.; Tanaboriboon, Y. An Evaluation of the Effectiveness of Private Vehicle Inspection Process in Thailand. J. East. Asia Soc. Transp. Stud. 2005, 6, 3482–3496. [Google Scholar]
- Sobngwi-Tambekou, J.; Bhatti, J.; Kounga, G.; Salmi, L.-R.; Lagarde, E. Road Traffic Crashes on the Yaoundé–Douala Road Section, Cameroon. Accid. Anal. Prev. 2010, 42, 422–426. [Google Scholar] [CrossRef]
- Das, S.; Geedipally, S.R.; Dixon, K.; Sun, X.; Ma, C. Measuring the Effectiveness of Vehicle Inspection Regulations in Different States of the U.S. Transp. Res. Rec. J. Transp. Res. Board 2019, 2673, 208–219. [Google Scholar] [CrossRef]
- Martín-Delosreyes, L.M.; Lardelli-Claret, P.; García-Cuerva, L.; Rivera-Izquierdo, M.; Jiménez-Mejías, E.; Martínez-Ruiz, V. Effect of Periodic Vehicle Inspection on Road Crashes and Injuries: A Systematic Review. Int. J. Environ. Res. Public Health 2021, 18, 6476. [Google Scholar] [CrossRef]
- Elvik, R.; Bjørnskau, T. Safety-in-Numbers: A Systematic Review and Meta-Analysis of Evidence. Saf. Sci. 2017, 92, 274–282. [Google Scholar] [CrossRef] [Green Version]
- Eliopoulou, E.; Papanikolaou, A.; Voulgarellis, M. Statistical Analysis of Ship Accidents and Review of Safety Level. Saf. Sci. 2016, 85, 282–292. [Google Scholar] [CrossRef]
- Narváez-Villa, P.; Arenas-Ramírez, B.; Mira, J.; Aparicio-Izquierdo, F. Analysis and Prediction of Vehicle Kilometers Traveled: A Case Study in Spain. Int. J. Environ. Res. Public Health 2021, 18, 8327. [Google Scholar] [CrossRef]
- Alonso, F.; Useche, S.A.; Gene-Morales, J.; Esteban, C. Compliance, Practices, and Attitudes towards VTIs (Vehicle Technical Inspections) in Spain: What Prevents Spanish Drivers from Checking up Their Cars? PLoS ONE 2021, 16, e0254823. [Google Scholar] [CrossRef]
- Sanjurjo-De-No, A.; Arenas-Ramirez, B.; Mira, J.; Aparicio-Izquierdo, F. Driver Pattern Identification in Road Crashes in Spain. IEEE Access 2020, 8, 182014–182025. [Google Scholar] [CrossRef]
- Martín-delosReyes, L.M.; Martínez-Ruiz, V.; Rivera-Izquierdo, M.; Pulido-Manzanero, J.; Jiménez-Mejías, E.; Lardelli-Claret, P. Prevalence of and Factors Associated with Driving a Vehicle with Timed-Out Inspection Certificate in Spain. Int. J. Environ. Res. Public Health 2022, 19, 98. [Google Scholar] [CrossRef]
- AEADE. Asociación de Empresas Automotrices del Ecuador; Anuarios—AEADE: Quito, Ecuador, 2021. [Google Scholar]
- Quillupangui, S. 32% del Parque Automotor del Ecuador Tiene más de 12 años. Available online: https://www.elcomercio.com/actualidad/negocios/impuesto-verde-vehiculos-matriculacion-protestas.html (accessed on 13 April 2022).
- Kaur, P.; Stoltzfus, J.; Yellapu, V. Descriptive Statistics. Int. J. Acad. Med. 2018, 4, 60. [Google Scholar] [CrossRef]
- Spyropoulou, I. Impact of Public Transport Strikes on the Road Network: The Case of Athens. Transp. Res. Part Policy Pract. 2020, 132, 651–665. [Google Scholar] [CrossRef]
- Glenn, J.; Bluth, M.; Christianson, M.; Pressley, J.; Taylor, A.; Macfarlane, G.S.; Chaney, R.A. Considering the Potential Health Impacts of Electric Scooters: An Analysis of User Reported Behaviors in Provo, Utah. Int. J. Environ. Res. Public Health 2020, 17, 6344. [Google Scholar] [CrossRef]
- Xu, C.; Ding, Z.; Wang, C.; Li, Z. Statistical Analysis of the Patterns and Characteristics of Connected and Autonomous Vehicle Involved Crashes. J. Saf. Res. 2019, 71, 41–47. [Google Scholar] [CrossRef]
- Yen, D.C.; Davis, W.S. (Eds.) The Information System Consultant’s Handbook: Systems Analysis and Design; CRC Press: Boca Raton, FL, USA, 1999; ISBN 978-0-8493-7001-4. [Google Scholar]
- Sarkabiri, B.; Jahan, A.; Rezvani, M.J. Crashworthiness Multi-Objective Optimization of the Thin-Walled Grooved Conical Tubes Filled with Polyurethane Foam. J. Braz. Soc. Mech. Sci. Eng. 2017, 39, 2721–2734. [Google Scholar] [CrossRef]
- Cascan, E.T.; Ivanchev, J.; Eckhoff, D.; Sangiovanni-Vincentelli, A.; Knoll, A. Multi-Objective Calibration of Microscopic Traffic Simulation for Highway Traffic Safety. In Proceedings of the 2019 IEEE Intelligent Transportation Systems Conference (ITSC), Auckland, New Zealand, 27–30 October 2019; pp. 4548–4555. [Google Scholar]
- Duarte, T.S.; Maia, S.B.P.; Martins, L.D.C.; Mihailoff, B.; Batista, L.C.; Salvador, E.B.; De Campos, B.P. Application of Quality Tools to Reduce Pneumatic Leaks in the Commercial Vehicle Brake System; SAE Technical Paper; SAE: Bovespa, Brazil, 2021. [Google Scholar]
- Madsen, H. Time Series Analysis; Chapman and Hall/CRC: New York, NY, USA, 2007. [Google Scholar]
- Sumit, K.; Ross, V.; Ruiter, R.A.C.; Polders, E.; Wets, G.; Brijs, K. An Exploration of Characteristics and Time Series Forecast of Fatal Road Crashes in Manipal, India. Sustainability 2022, 14, 2851. [Google Scholar] [CrossRef]
- Fu, X.; Liu, J.; Jones, S.; Barnett, T.; Khattak, A.J. From the Past to the Future: Modeling the Temporal Instability of Safety Performance Functions. Accid. Anal. Prev. 2022, 167, 106592. [Google Scholar] [CrossRef]
- Wang, Y.; Yu, C.; Hou, J.; Chu, S.; Zhang, Y.; Zhu, Y. ARIMA Model and Few-Shot Learning for Vehicle Speed Time Series Analysis and Prediction. Comput. Intell. Neurosci. 2022, 2022, 2526821. [Google Scholar] [CrossRef]
- Cordero, C.A.; Sanz, J.L.M.; Otero, J.E.; Guijosa, J.M.M. Measurement of Machinery Safety Level in the European Market: Characterisation of the Compliance within the Scope of MD98/37/EC. Saf. Sci. 2013, 51, 273–283. [Google Scholar] [CrossRef]
- Keall, M.D.; Newstead, S. An Evaluation of Costs and Benefits of a Vehicle Periodic Inspection Scheme with Six-Monthly Inspections Compared to Annual Inspections. Accid. Anal. Prev. 2013, 58, 81–87. [Google Scholar] [CrossRef]
- Rechnitzer, G.; Haworth, N.; Kowadlo, N. The Effect of Vehicle Roadworthiness on Crash Incidence and Severity; Report No. 164 2000; Monash University, Accident Research Centre: Clayton, Australia, 2000. [Google Scholar]
- Christensen, P.; Elvik, R. Effects on Accidents of Periodic Motor Vehicle Inspection in Norway. Accid. Anal. Prev. 2007, 39, 47–52. [Google Scholar] [CrossRef] [PubMed]
- Das, S. Automobile Safety Inspection. In International Encyclopedia of Transportation; Vickerman, R., Ed.; Elsevier: Oxford, UK, 2021; pp. 85–89. ISBN 978-0-08-102672-4. [Google Scholar]
- Hudec, J.; Šarkan, B.; Cződörová, R. Examination of the Results of the Vehicles Technical Inspections in Relation to the Average Age of Vehicles in Selected EU States. Transp. Res. Procedia 2021, 55, 2–9. [Google Scholar] [CrossRef]
- Wang, J.; Kong, Y.; Fu, T. Expressway Crash Risk Prediction Using Back Propagation Neural Network: A Brief Investigation on Safety Resilience. Accid. Anal. Prev. 2019, 124, 180–192. [Google Scholar] [CrossRef] [PubMed]
- Sharafati, A.; Pezeshki, E. A Strategy to Assess the Uncertainty of a Climate Change Impact on Extreme Hydrological Events in the Semi-Arid Dehbar Catchment in Iran. Theor. Appl. Climatol. 2020, 139, 389–402. [Google Scholar] [CrossRef]
- Shamshirband, S.; Jafari Nodoushan, E.; Adolf, J.E.; Abdul Manaf, A.; Mosavi, A.; Chau, K. Ensemble Models with Uncertainty Analysis for Multi-Day Ahead Forecasting of Chlorophyll a Concentration in Coastal Waters. Eng. Appl. Comput. Fluid Mech. 2019, 13, 91–101. [Google Scholar] [CrossRef] [Green Version]
- CONGOPE. Plan Vial Integral Provincia del Azuay; CONGOPE: Quito, Ecuador, 2019.


| FAILURE | NUMBER OF VEHICLES |
|---|---|
| Horizontal alignment of the driver headlight | 55,305 |
| Vertical alignment of the driver headlight | 62,001 |
| Braking imbalance on the 2nd axle | 23,653 |
| Insufficient tyre tread | 28,674 |
| Parking brake effectiveness | 39,065 |
Publisher’s Note: MDPI stays neutral with regard to jurisdictional claims in published maps and institutional affiliations. |
© 2022 by the authors. Licensee MDPI, Basel, Switzerland. This article is an open access article distributed under the terms and conditions of the Creative Commons Attribution (CC BY) license (https://creativecommons.org/licenses/by/4.0/).
Share and Cite
Montero-Salgado, J.P.; Muñoz-Sanz, J.; Arenas-Ramírez, B.; Alén-Cordero, C. Identification of the Mechanical Failure Factors with Potential Influencing Road Accidents in Ecuador. Int. J. Environ. Res. Public Health 2022, 19, 7787. https://doi.org/10.3390/ijerph19137787
Montero-Salgado JP, Muñoz-Sanz J, Arenas-Ramírez B, Alén-Cordero C. Identification of the Mechanical Failure Factors with Potential Influencing Road Accidents in Ecuador. International Journal of Environmental Research and Public Health. 2022; 19(13):7787. https://doi.org/10.3390/ijerph19137787
Chicago/Turabian StyleMontero-Salgado, Juan Pablo, Jose Muñoz-Sanz, Blanca Arenas-Ramírez, and Cristina Alén-Cordero. 2022. "Identification of the Mechanical Failure Factors with Potential Influencing Road Accidents in Ecuador" International Journal of Environmental Research and Public Health 19, no. 13: 7787. https://doi.org/10.3390/ijerph19137787