
Predictors of Life Satisfaction in New Zealand: Analysis of a National Dataset

 , ,
, , 
Abstract
:1. Introduction
1.1. Wellbeing Is Important to New Zealand
1.2. Changes in New Zealand 2006 to 2017
1.3. What Is Life Satisfaction?
1.4. Life Satisfaction in New Zealand
1.5. Study Objectives
2. Materials and Methods
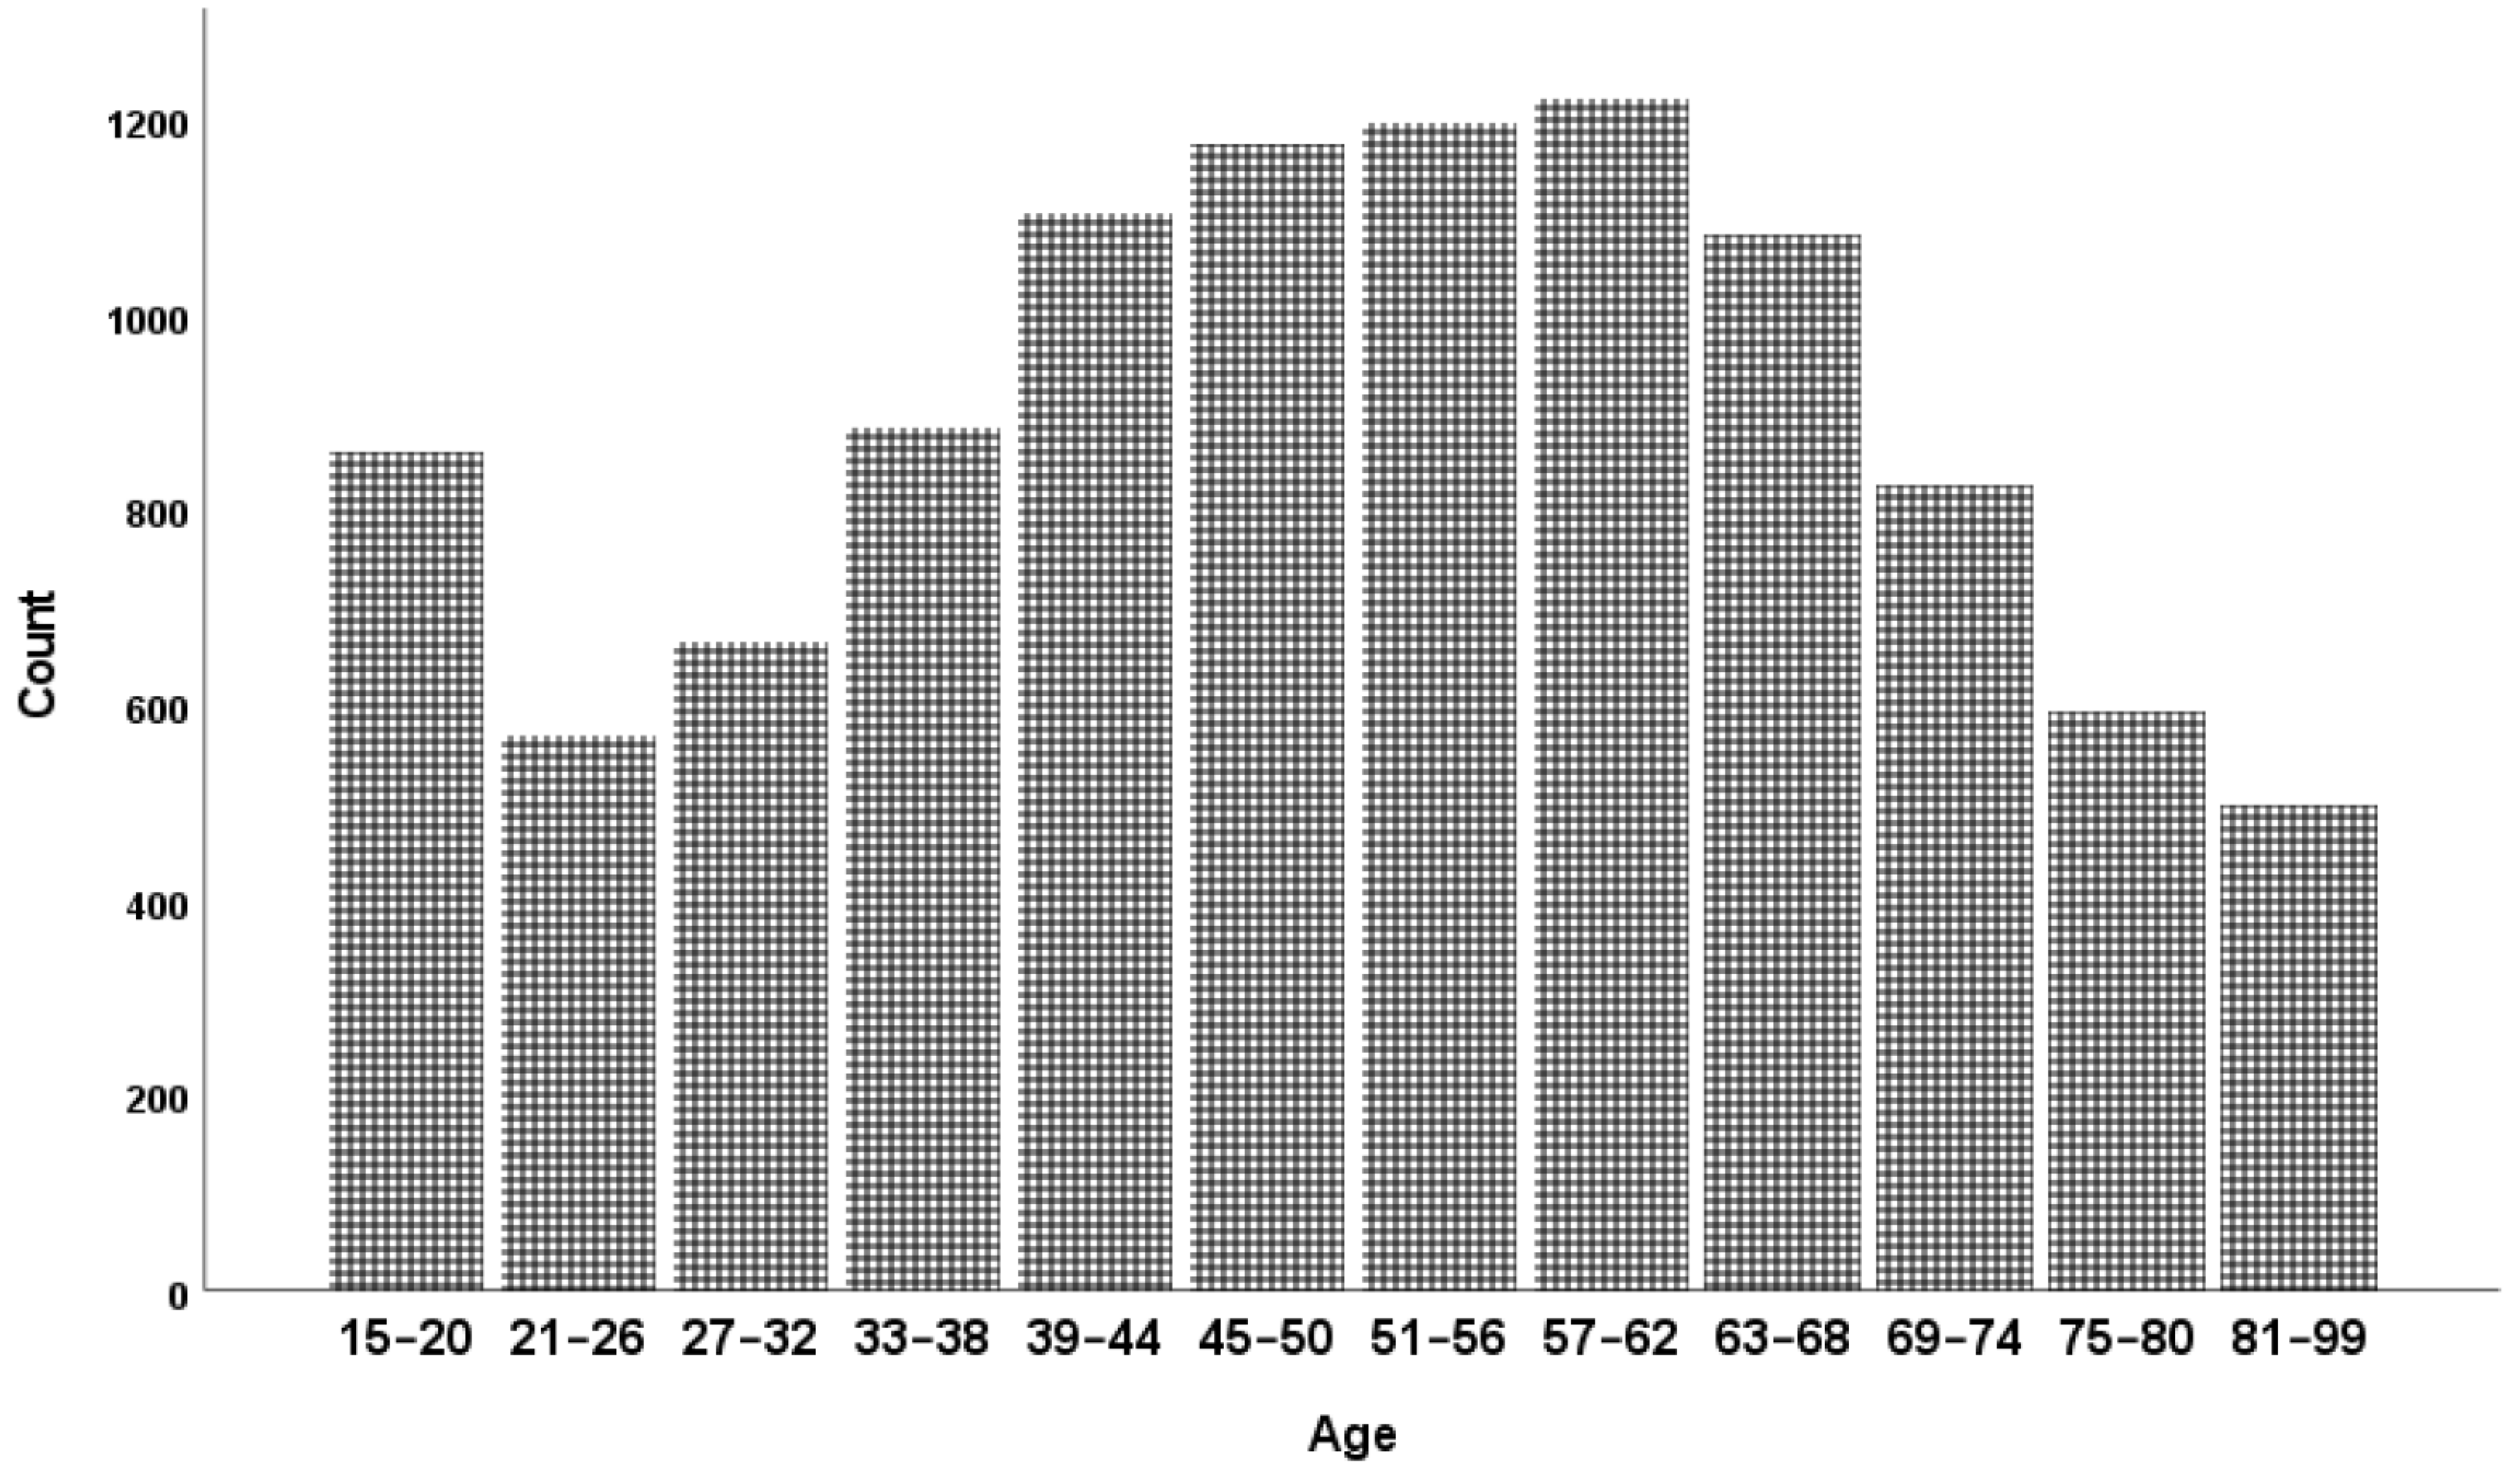
2.1. Study Sample
2.2. Measures
Life Satisfaction
“Please imagine a ladder with steps numbered from zero at the bottom to ten at the top. The top of the ladder represents the best possible life for you and the bottom of the ladder represents the worst possible life for you. On which step of the ladder would you say you personally feel you stand at this time?”
2.3. Analysis
2.4. Ethical Considerations
3. Results
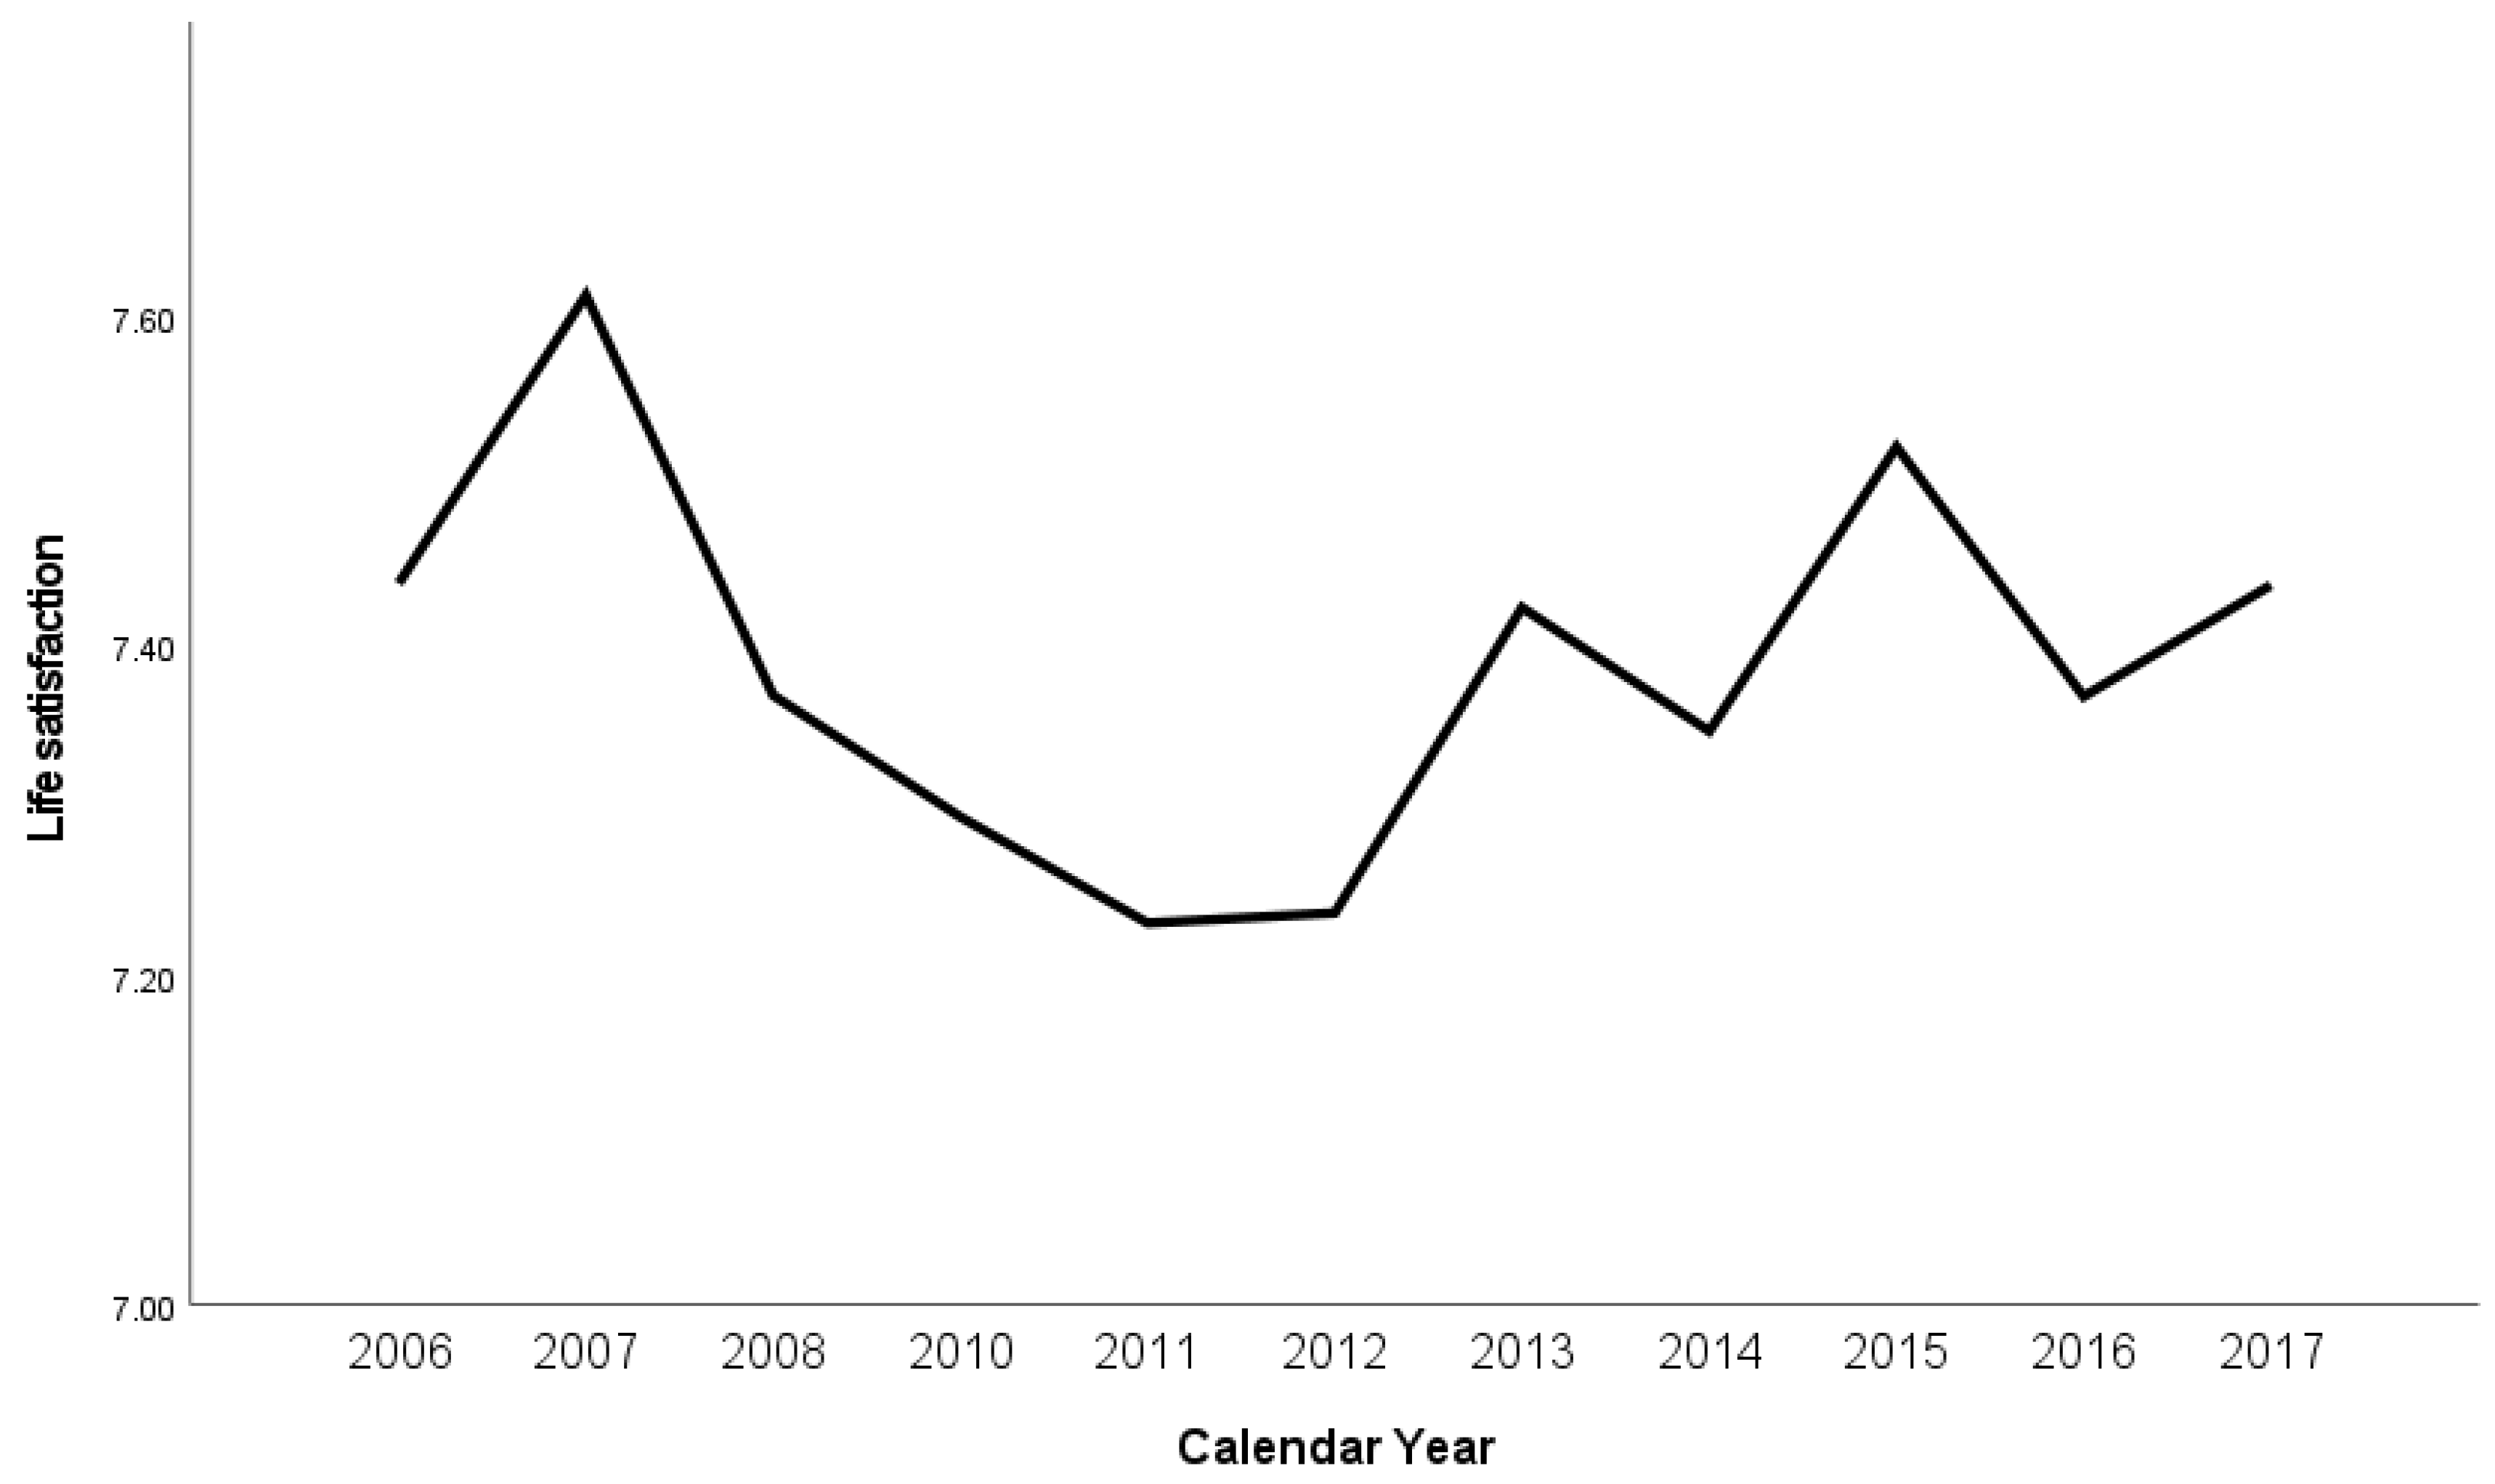
3.1. Prevalence of Life Satisfaction over Time
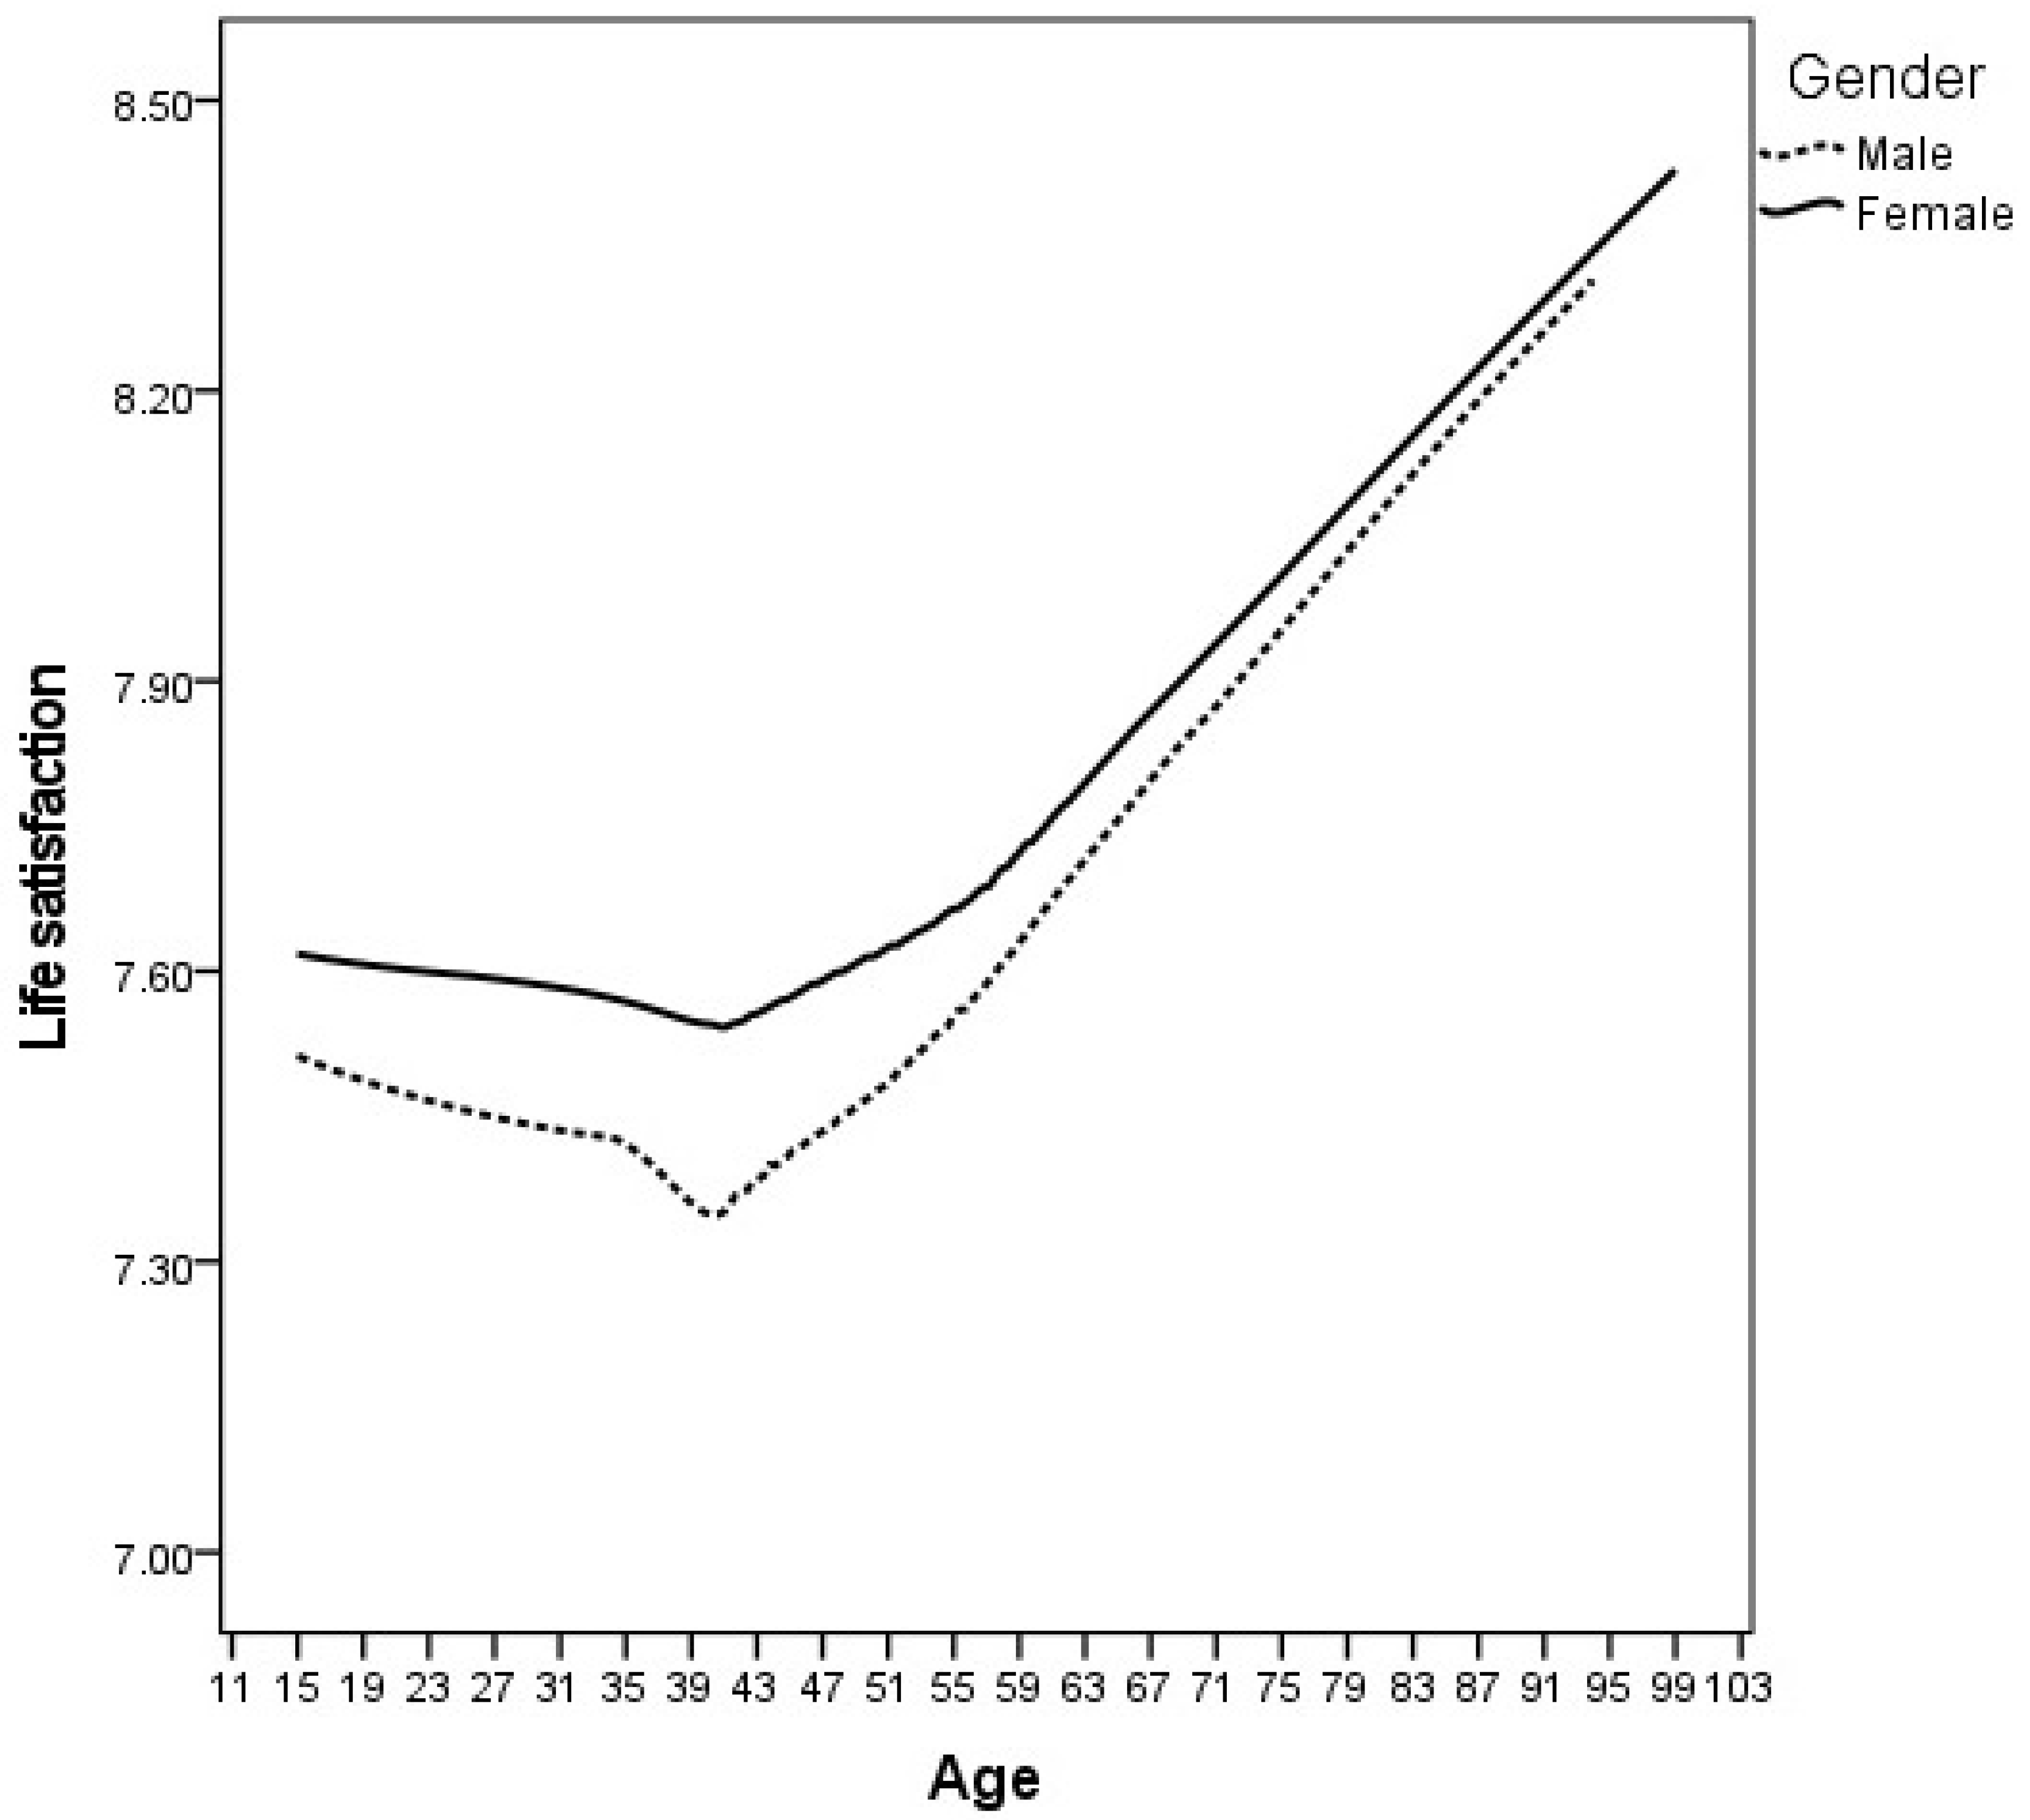
3.2. Life Satisfaction by Age and Gender
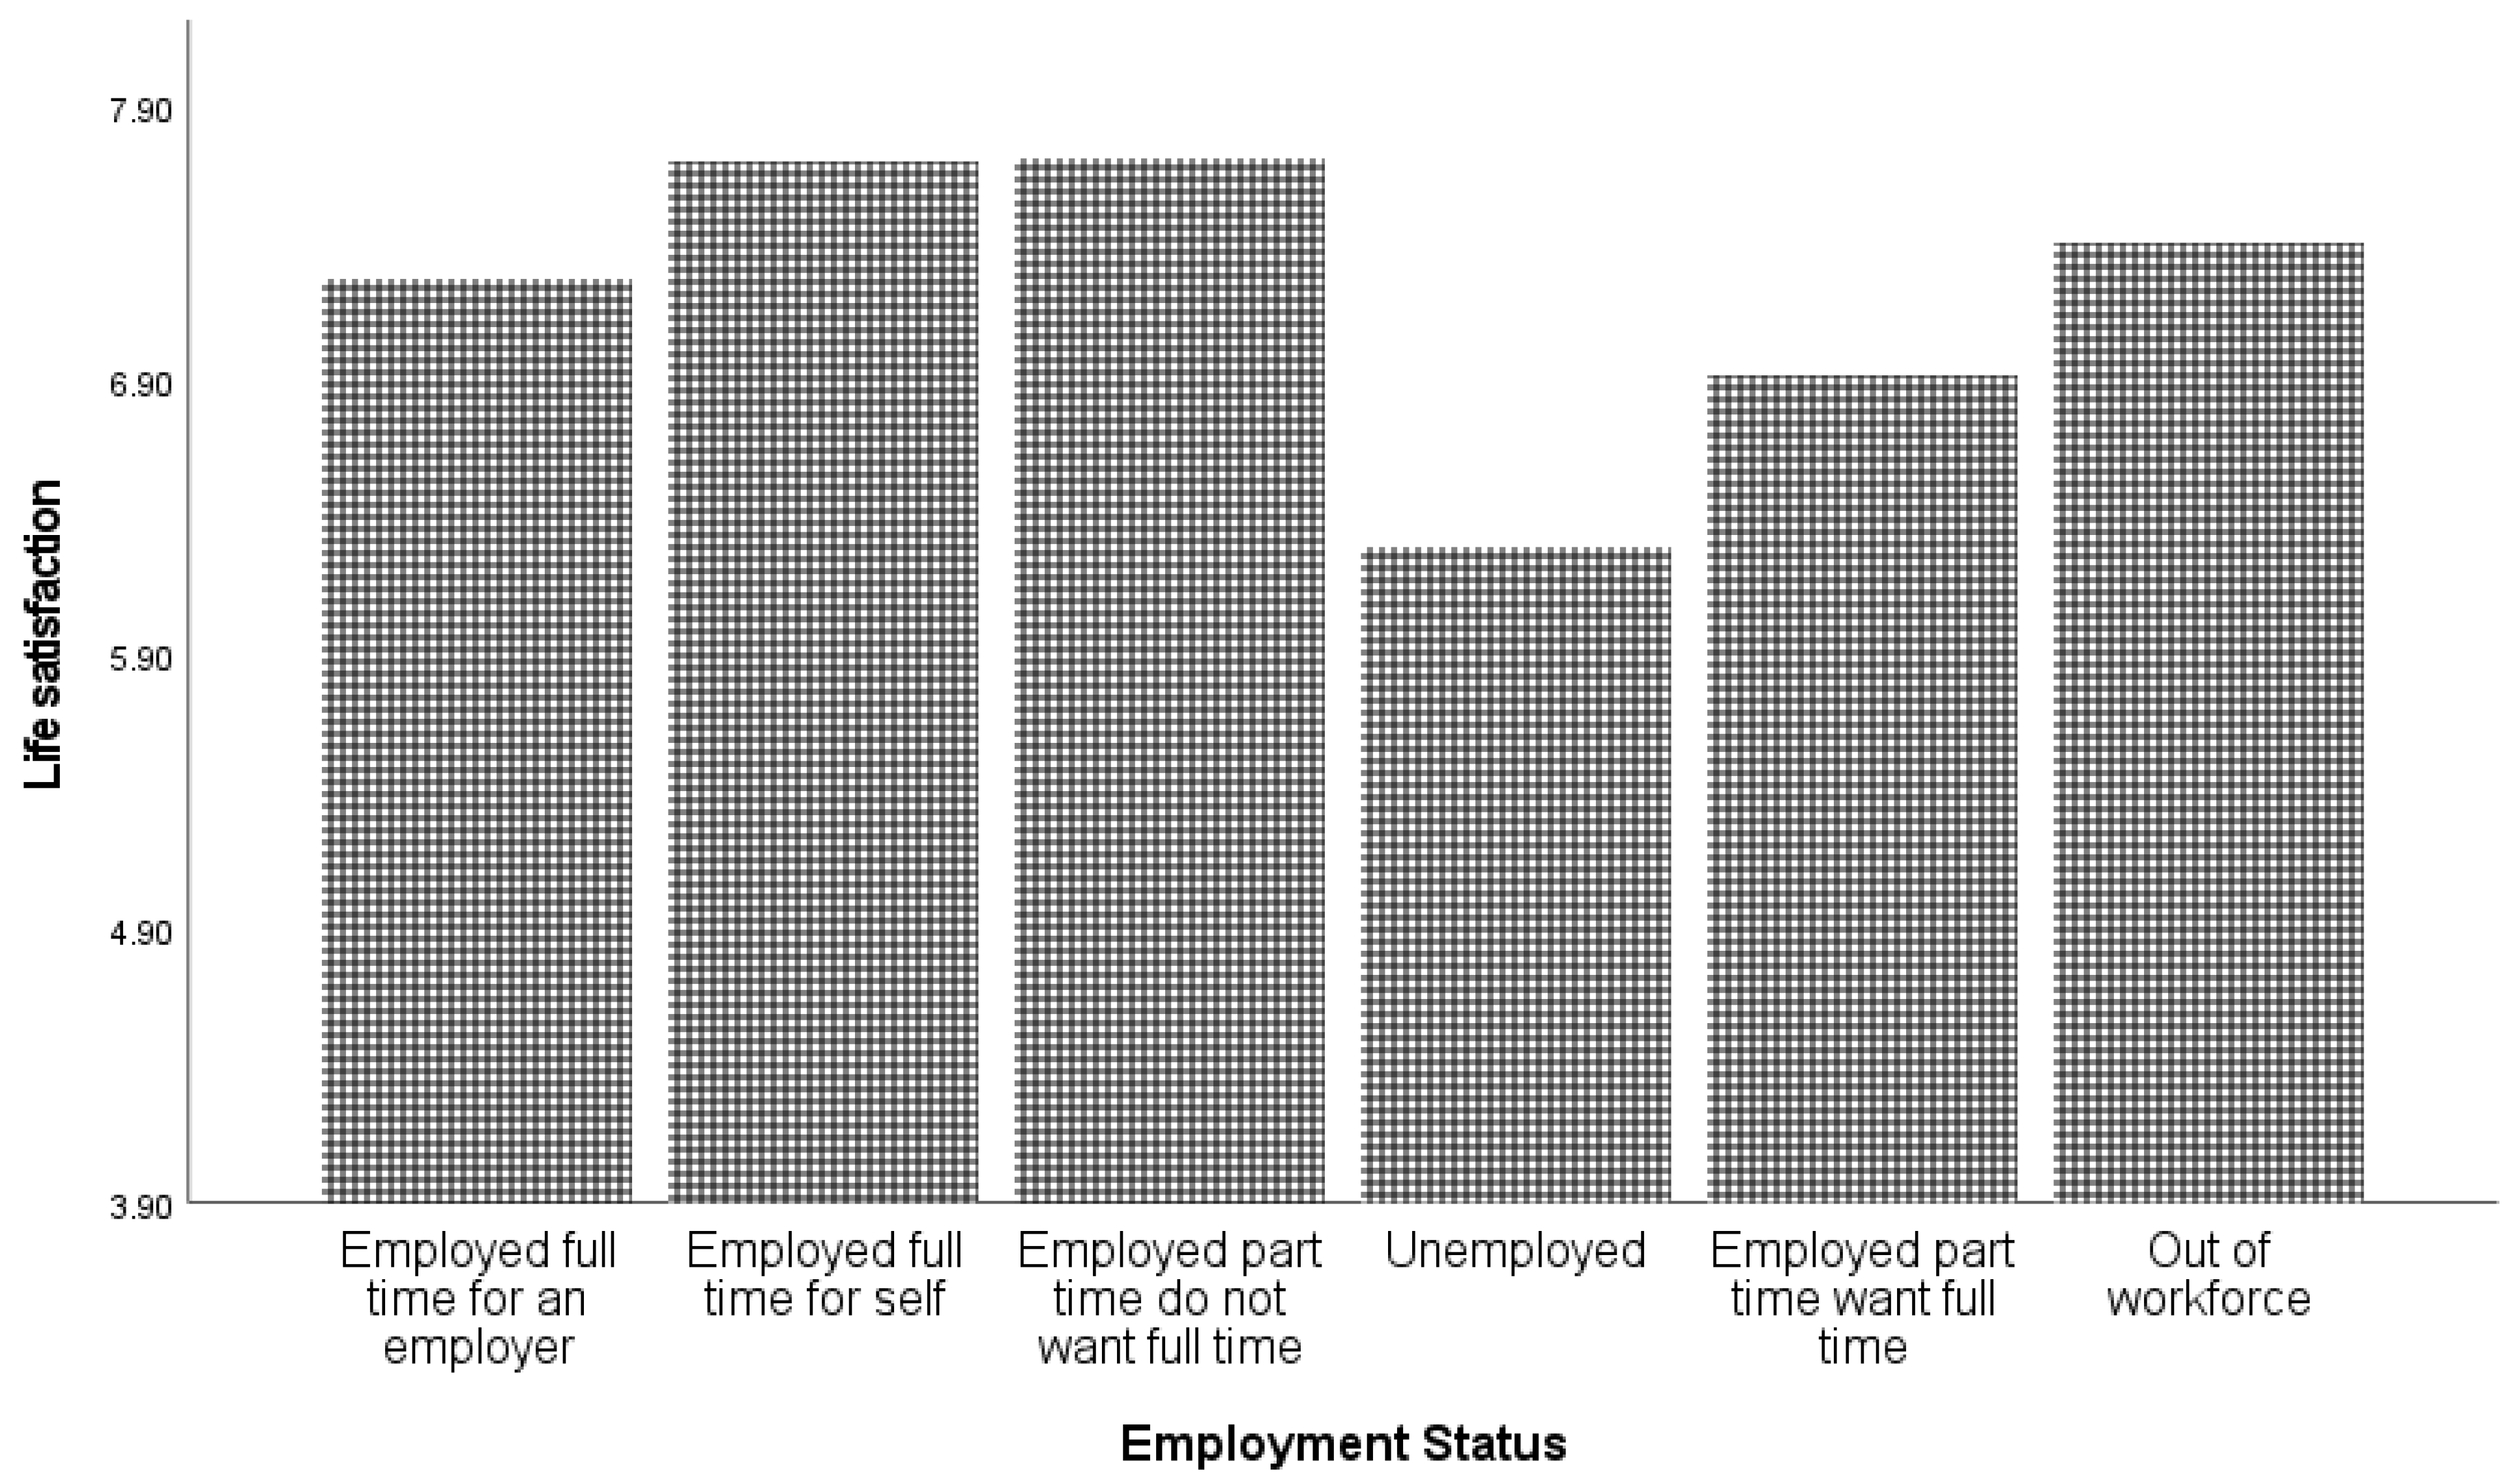
3.3. Other Demographic Predictors of Life Satisfaction
3.4. Regression Analysis
3.5. Relationship between Household Income and Life Satisfaction: A Close Examination
4. Discussion
4.1. Prevalence of Life Satisfaction
4.2. Predictors of Life Satisfaction
4.3. Strengths and Limitations
5. Conclusions
Supplementary Materials
Author Contributions
Funding
Institutional Review Board Statement
Informed Consent Statement
Data Availability Statement
Conflicts of Interest
References
- New Zealand Treasury. Budget 2018; NZ Government: Wellington, New Zealand, 2018.
- United Nations. Sustainable Development Goals; United Nations: San Francisco, CA, USA, 2018. [Google Scholar]
- New Zealand Treasury. The Treasury Approach to the Living Standards Framework; New Zealand Treasury: Wellington, New Zealand, 2018.
- Organisation for Economic Co-operation and Development. Measuring Well-Being and Progress: Well-Being Research; Organisation for Economic Co-operation and Development: Paris, France, 2013; Available online: www.oecd.org/statistics/measuring-well-being-and-progress.htm (accessed on 5 March 2022).
- BBC News. New Zealand’s Slump Longest Ever; BBC News: London, UK, 2009. [Google Scholar]
- New York Times. New Zealand Takes a Pause in Cutting Rates; New York Times: New York, NY, USA, 2009. [Google Scholar]
- Ministry of Social Development. The Social Report 2016—Te Pūrongo Oranga Tangata; Ministry of Social Development: Wellington, New Zealand, 2016.
- New Zealand Treasury. New Zealand Economic and Financial Overview: 2010; New Zealand Treasury: Wellington, New Zealand, 2010.
- New Zealand Foreign Affairs & Trade. New Zealand-China FTA overview; New Zealand Foreign Affairs & Trade: Wellington, New Zealand, 2008.
- Diener, E.; Emmons, R.A.; Larson, R.J.; Griffin, S. The Satisfaction with Life Scale. J. Pers. Assess. 1985, 49, 71–75. [Google Scholar] [CrossRef] [PubMed]
- Dolan, P.; Metcalfe, R. Measuring subjective wellbeing: Recommendations on measures for use by national governments. J. Soc. Policy 2012, 41, 409–427. [Google Scholar] [CrossRef] [Green Version]
- Brown, D.; Woolf, J.; Smith, C. An empirical investigation into the determinants of life satisfaction in New Zealand. N. Z. Econ. Pap. 2012, 46, 239–251. [Google Scholar] [CrossRef]
- Donovan, N.; Halpern, D. Life Satisfaction: The State of Knowledge and Implications for Government; Prime Minister’s Strategy Unit: London, UK, 2002.
- VanderWeele, T.J.; Trudel-Fitzgerald, C.; Allin, P.; Farrelly, C.; Fletcher, G.; Frederick, D.E.; Hall, J.; Helliwell, J.F.; Kim, E.S.; Lauinger, W.A.; et al. Current Recommendations on the Selection of Measures for Well-Being. In Measuring Well-Being; Oxford University Press: Oxford, UK, 2021; pp. 501–520. [Google Scholar]
- Cheung, F.; Lucas, R. Assessing the validity of single-item life satisfaction measures: Results from three large samples. Qual. Life Res. 2014, 23, 2809–2818. [Google Scholar] [CrossRef] [PubMed] [Green Version]
- Helliwell, J.; Layard, R.; Sachs, J. World Happiness Report [2012]; Sustainable Development Solutions Network: New York, NY, USA, 2013. [Google Scholar]
- Layard, R. Measuring subjective well-being. Science 2010, 327, 534–535. [Google Scholar] [CrossRef] [PubMed]
- Layard, R. Happiness: Lessons from a New Science; Penguin Books: London, UK, 2005. [Google Scholar]
- Fergusson, D.M.; McLeod, G.F.; Horwood, L.J.; Swain, N.R.; Chapple, S.; Poulton, R. Life satisfaction and mental health problems (18 to 35 years). Psychol. Med. 2015, 45, 2427–2436. [Google Scholar] [CrossRef]
- Samaranayake, C.; Fernando, A. Satisfaction with life and depression among medical students in Auckland, New Zealand. N. Z. Med. J. 2011, 124, 12–17. [Google Scholar]
- Haar, J.; Russo, M.; Suñe, A.; Ollier-Malaterre, A. Outcomes of work–life balance on job satisfaction, life satisfaction and mental health: A study across seven cultures. J. Vocat. Behav. 2014, 85, 361–373. [Google Scholar] [CrossRef]
- Spector, P.; Allen, T.; Poelmans, S.; Lapierre, L.; Cooper, C.; O’Driscoll, M.; Sanchez, J.; Abarca, N.; Alexandrova, M.; Beham, B.; et al. Cross-national differences in relationships of work demands, job satisfaction, and turnover intentions with work–family conflict. Pers. Psychol. 2007, 60, 805–835. [Google Scholar] [CrossRef]
- Statistics New Zealand. Ngā Tohu o te ora: The Determinants of Life Satisfaction for Māori 2013; Statistics New Zealand: Wellington, New Zealand, 2015. [Google Scholar]
- Jia, K.; Smith, C. Subjective Wellbeing in New Zealand: Some Recent Evidence; New Zealand Productivity Commission/Te Kōmihana Whai Hua o Aotearoa: Wellington, New Zealand, 2016.
- Sacks, D.; Stevenson, B.; Wolfers, J. NBER Working Paper Series: Subjective Well-Being, Income, Economic Development and Growth; National Bureau of Economic Research: Cambridge, MA, USA, 2010. [Google Scholar]
- Mackay, L.; Schofield, G.; Jarden, A.; Prendergast, K. The Sovereign New Zealand Wellbeing Index 2014. Executive Report; AUT University: Auckland, New Zealand, 2015. [Google Scholar]
- Becchetti, L.; Conzo, G. The gender life satisfaction/depression paradox. Soc. Indic. Res. 2022, 160, 35–113. [Google Scholar] [CrossRef]
- Boarini, R.; Comola, M.; Smith, C.; Manchin, R.; De Keulenaer, F. What Makes for a Better Life? The Determinants of Subjective Well-Being in OECD Countries–Evidence from the Gallup World Poll. 2012. Available online: https://www.oecd-ilibrary.org/economics/what-makes-for-a-better-life_5k9b9ltjm937-en (accessed on 5 March 2022).
- Helliwell, J. NBER Working Paper Series: Life Satisfaction and Quality of Development; (No. w14507); National Bureau of Economic Research: Cambridge, MA, USA, 2008. [Google Scholar]
- Di Tella, R.; MacCulloch, R.; Oswald, A. The macroeconomics of happiness. Rev. Econ. Stat. 2003, 85, 809–827. [Google Scholar] [CrossRef] [Green Version]
- Winkelmann, L.; Winkelmann, R. Why are the unemployed so unhappy? Evidence from panel data. Economica 1998, 65, 1–15. [Google Scholar] [CrossRef] [Green Version]
- Lucas, R.; Clark, A.; Georgellis, Y.; Diener, E. Unemployment alters the set point for life satisfaction. Psychol. Sci. 2004, 15, 8–13. [Google Scholar] [CrossRef] [PubMed] [Green Version]
- Berggren, N.; Bergh, A.; Bjørnskov, C.; Tanaka, S. Migrants and life satisfaction: The role of the country of origin and the country of residence. Kyklos 2020, 73, 436–463. [Google Scholar] [CrossRef]
- Sam, D. Predicting life satisfaction among adolescents from immigrant families in Norway. Ethn. Health 1998, 3, 5–18. [Google Scholar] [CrossRef]
- Bergan, A.; McConatha, J. Religiosity and life satisfaction. Activities. Adapt. Aging 2001, 24, 23–34. [Google Scholar]
- Elliott, M.; Hayward, R. Religion and life satisfaction worldwide: The role of government regulation. Sociol. Relig. 2009, 70, 285–310. [Google Scholar] [CrossRef]
- Sibley, C.; Harré, N.; Hoverd, W.; Houkamau, C. The gap in the subjective wellbeing of Māori and New Zealand Europeans widened between 2005 and 2009. Soc. Indic. Res. 2011, 103–115. [Google Scholar] [CrossRef]
- Statistics New Zealand. 2013 Census QuickStats About Culture and Identity; Statistics New Zealand: Wellington, New Zealand, 2014. [Google Scholar]
- Fleche, S.; Smith, C.; Sorsa, P. Exploring Determinants of Subjective Wellbeing in OECD Countries; OECD Publishing: Paris, France, 2012. [Google Scholar]
- Cantril, H. Pattern of Human Concerns; Rutgers University Press: New Brunswick, NJ, USA, 1965. [Google Scholar]
- Jovanović, V.; Lazić, M. Is longer always better? A comparison of the validity of single-item versus multiple-item measures of life satisfaction. Appl. Res. Qual. Life 2020, 15, 675–692. [Google Scholar] [CrossRef]
- Tabachnick, B.; Fidell, L. Using Multivariate Statistics, 6th ed.; Pearson: Boston, MA, USA, 2013. [Google Scholar]
- George, D.; Mallery, P. IBM SPSS Statistics 26 Step by Step: A Simple Guide and Reference; Routledge: New York, NY, USA, 2019. [Google Scholar]
- The World Bank. Currencies; The World Bank: Washington, DC, USA, 2022. [Google Scholar]
- Helliwell, J.; Layard, R.; Sachs, J.; De Neve, J. World Happiness Report; Sustainable Development Solutions Network: New York, NY, USA, 2021. [Google Scholar]
- Helliwell, J.; Layard, R.; Sachs, J. World Happiness Report; Sustainable Development Solutions Network: New York, NY, USA, 2015. [Google Scholar]
- Beaglehole, B.; Mulder, R.; Boden, J.; Bell, C. A systematic review of the psychological impacts of the Canterbury earthquakes on mental health. Aust. N. Z. J. Public Health 2019, 43, 274–280. [Google Scholar] [CrossRef]
- Batz, C.; Tay, L. Gender differences in subjective well-being. In Handbook of Well-Being; Diener, E., Oishi, S., Tay, L., Eds.; DEF Publishers: Salt Lake City, UT, USA, 2018. [Google Scholar]
- Dolan, P.; Peasgood, T.; White, M. Do we really know what makes us happy? A review of the economic literature on the factors associated with subjective well-being. J. Econ. Psychol. 2008, 29, 94–122. [Google Scholar] [CrossRef]
- Van Hoorn, A. A Short Introduction to Subjective Wellbeing: Its Measurement, Correlates and Policy Uses. Prepared for the International Conference, ‘Is Happiness Measurable and What Do Those Measures Mean for Policy?’; University of Rome: Rome, Italy, 2007. [Google Scholar]
- Capone, V.; Joshanloo, M.; Scheifinger, H. Predictors of life satisfaction in a large representative sample from Italy. Curr. Psychol. 2021, 40, 3609–3627. [Google Scholar] [CrossRef]
- Lambert, L.; Karabchuk, T.; Joshanloo, M. Predictors of life satisfaction in the United Arab Emirates: Results based on Gallup data. Curr. Psychol. 2020. [Google Scholar] [CrossRef]
- Boes, S.; Winkelmann, R. The effect of income on general life satisfaction and dissatisfaction. J. Soc. Indic. Res. 2010, 95, 111. [Google Scholar] [CrossRef] [Green Version]
- Clark, A.; Frijters, P.; Shields, M. Paris-Jourdan Sciences Economiques Working Paper Series: Income and Happiness: Evidence, Explanations and Economic Implications (2006–24); Paris-Jourdan Sciences Economiques: Paris, France, 2006. [Google Scholar]
- Easterlin, R.A.; O’Connor, K. The Easterlin Paradox. In Handbook of Labor, Human Resources and Population Resources; Zimmermann, K., Ed.; Springer: Berlin/Heidelberg, Germany, 2021. [Google Scholar]
- Boyce, C.J.; Brown, G.D.; Moore, S.C. Money and happiness: Rank of income, not income, affects life satisfaction. Psychol. Sci. 2010, 21, 471–475. [Google Scholar] [CrossRef] [Green Version]
- Helliwell, J.; Barrington-Leigh, C.; Harris, A.; Huang, H. International Evidence on the Social Context of Well-Being; National Bureau of Economic Research: Cambridge, MA, USA, 2009. [Google Scholar]
- Diener, E.; Suh, E.; Lucas, R.; Smith, H. Subjective well-being: Three decades of progress. Psychol. Bull. 1999, 125, 276–302. [Google Scholar] [CrossRef]
- Fredrickson, B. The broaden-and-build theory of positive emotions. Philosophical transactions of the Royal Society of London. Series B. Biol. Sci. 2004, 359, 1367–1377. [Google Scholar] [CrossRef]
- Jovanović, V.; Joshanloo, M. The contribution of positive and negative affect to life satisfaction across age. Appl. Res. Qual. Life 2022, 17, 511–524. [Google Scholar] [CrossRef]
- Fleming, C.; Manning, M.; Ambrey, C. Crime, greenspace and life satisfaction: An evaluation of the New Zealand experience. Landsc. Urban Plan. 2016, 149, 1–10. [Google Scholar] [CrossRef]
- Ma, J.; Dong, G.; Chen, Y.; Zhang, W. Does satisfactory neighbourhood environment lead to a satisfying life? An investigation of the association between neighbourhood environment and life satisfaction in Beijing. Cities 2018, 74, 229–239. [Google Scholar] [CrossRef]
- Varela, J.; Alfaro, J.; Melipillán, R.; Gómez, D.; González-Carrasco, M. Perceptions of safety, satisfaction with neighborhood and life satisfaction among Chilean adolescents. J. Child Indic. Res. 2020, 13, 1489–1502. [Google Scholar] [CrossRef]
- Camacho, D.; Lee, Y.; Bhattacharya, A.; Vargas, L.X.; Kimberly, L.; Lukens, E. High life satisfaction: Exploring the role of health, social integration and perceived safety among Mexican midlife and older adults. J. Gerontol. Soc. Work. 2019, 62, 521–542. [Google Scholar] [CrossRef] [PubMed]
- Ono, H.; Lee, K. Welfare states and the redistribution of happiness. Soc. Forces 2013, 92, 789–814. [Google Scholar] [CrossRef]
- Hajdu, T.; Hajdu, G. Reduction of income inequality and subjective well-being in Europe. Economics 2014, 8, 1–29. [Google Scholar] [CrossRef] [Green Version]
- Duncanson, M.; van Asten, H.; Adams, J.; McAnally, H.; Zhang, X.; Wicken, A.; Oben, G. Child Poverty Monitor: Technical Report 2021; New Zealand Child and Youth Epidemiology Service: Dunedin, New Zealand, 2021. [Google Scholar]
- Boston, J.; Chapple, S. Child Poverty in New Zealand; Bridget Williams Books: Wellington, New Zealand, 2014. [Google Scholar]
- Jebb, A.; Morrison, M.; Tay, L.; Diener, E. Subjective well-being around the world: Trends and predictors across the life span. Psychol. Sci. 2020, 31, 293–305. [Google Scholar] [CrossRef]
- Bartels, M.; Boomsma, D. Born to be happy? The etiology of subjective well-being. Behav. Genet. 2009, 39, 605–615. [Google Scholar] [CrossRef] [Green Version]
- Røysamb, E.; Nes, R.; Czajkowski, N.; Vassend, O. Genetics, personality and wellbeing. A twin study of traits, facets and life satisfaction. Sci. Rep. 2018, 8, 12298. [Google Scholar] [CrossRef] [Green Version]
- O’Connor, K. Happiness and welfare state policy around the world. Rev. Behav. Econ. 2017, 4, 397–420. [Google Scholar] [CrossRef]


| Independent Variable | Category | Raw Mean | SD | N |
|---|---|---|---|---|
| Employment | Employed full-time for an employer | 7.273 | 1.516 | 3109 |
| df = 5, 8251 F = 48.884 p < 0.001 η2 = 0.029 | Employed full-time for self | 7.696 | 1.564 | 706 |
| Employed part-time do not want full-time | 7.710 | 1.434 | 1172 | |
| Unemployed | 6.294 | 2.004 | 285 | |
| Employed part-time want full-time | 6.917 | 1.806 | 484 | |
| Out of workforce | 7.397 | 1.853 | 2501 | |
| Total | 7.354 | 1.678 | 8257 | |
| Education | Elementary | 7.276 | 1.986 | 1030 |
| df = 2, 10,575 F = 12.231 p < 0.001 η2 = 0.002 | Secondary | 7.342 | 1.676 | 6563 |
| Tertiary (four years beyond high school) | 7.506 | 1.525 | 2985 | |
| Total | 7.382 | 1.670 | 10,578 | |
| Location | Rural or farm | 7.661 | 1.694 | 1827 |
| df = 3, 10,718 F = 25.094 p < 0.001 η2 = 0.007 | Small town or village | 7.424 | 1.707 | 2469 |
| Large city | 7.326 | 1.659 | 1308 | |
| Suburb of a large city | 7.275 | 1.638 | 5118 | |
| Total | 7.381 | 1.672 | 10,722 | |
| Religious affiliation | Christian | 7.427 | 1.649 | 5198 |
| df = 2, 8998 F = 17.820 p < 0.001 η2 = 0.004 | Secular/Non-religious | 7.301 | 1.690 | 3153 |
| Other | 7.043 | 1.790 | 650 | |
| Total | 7.355 | 1.677 | 9001 | |
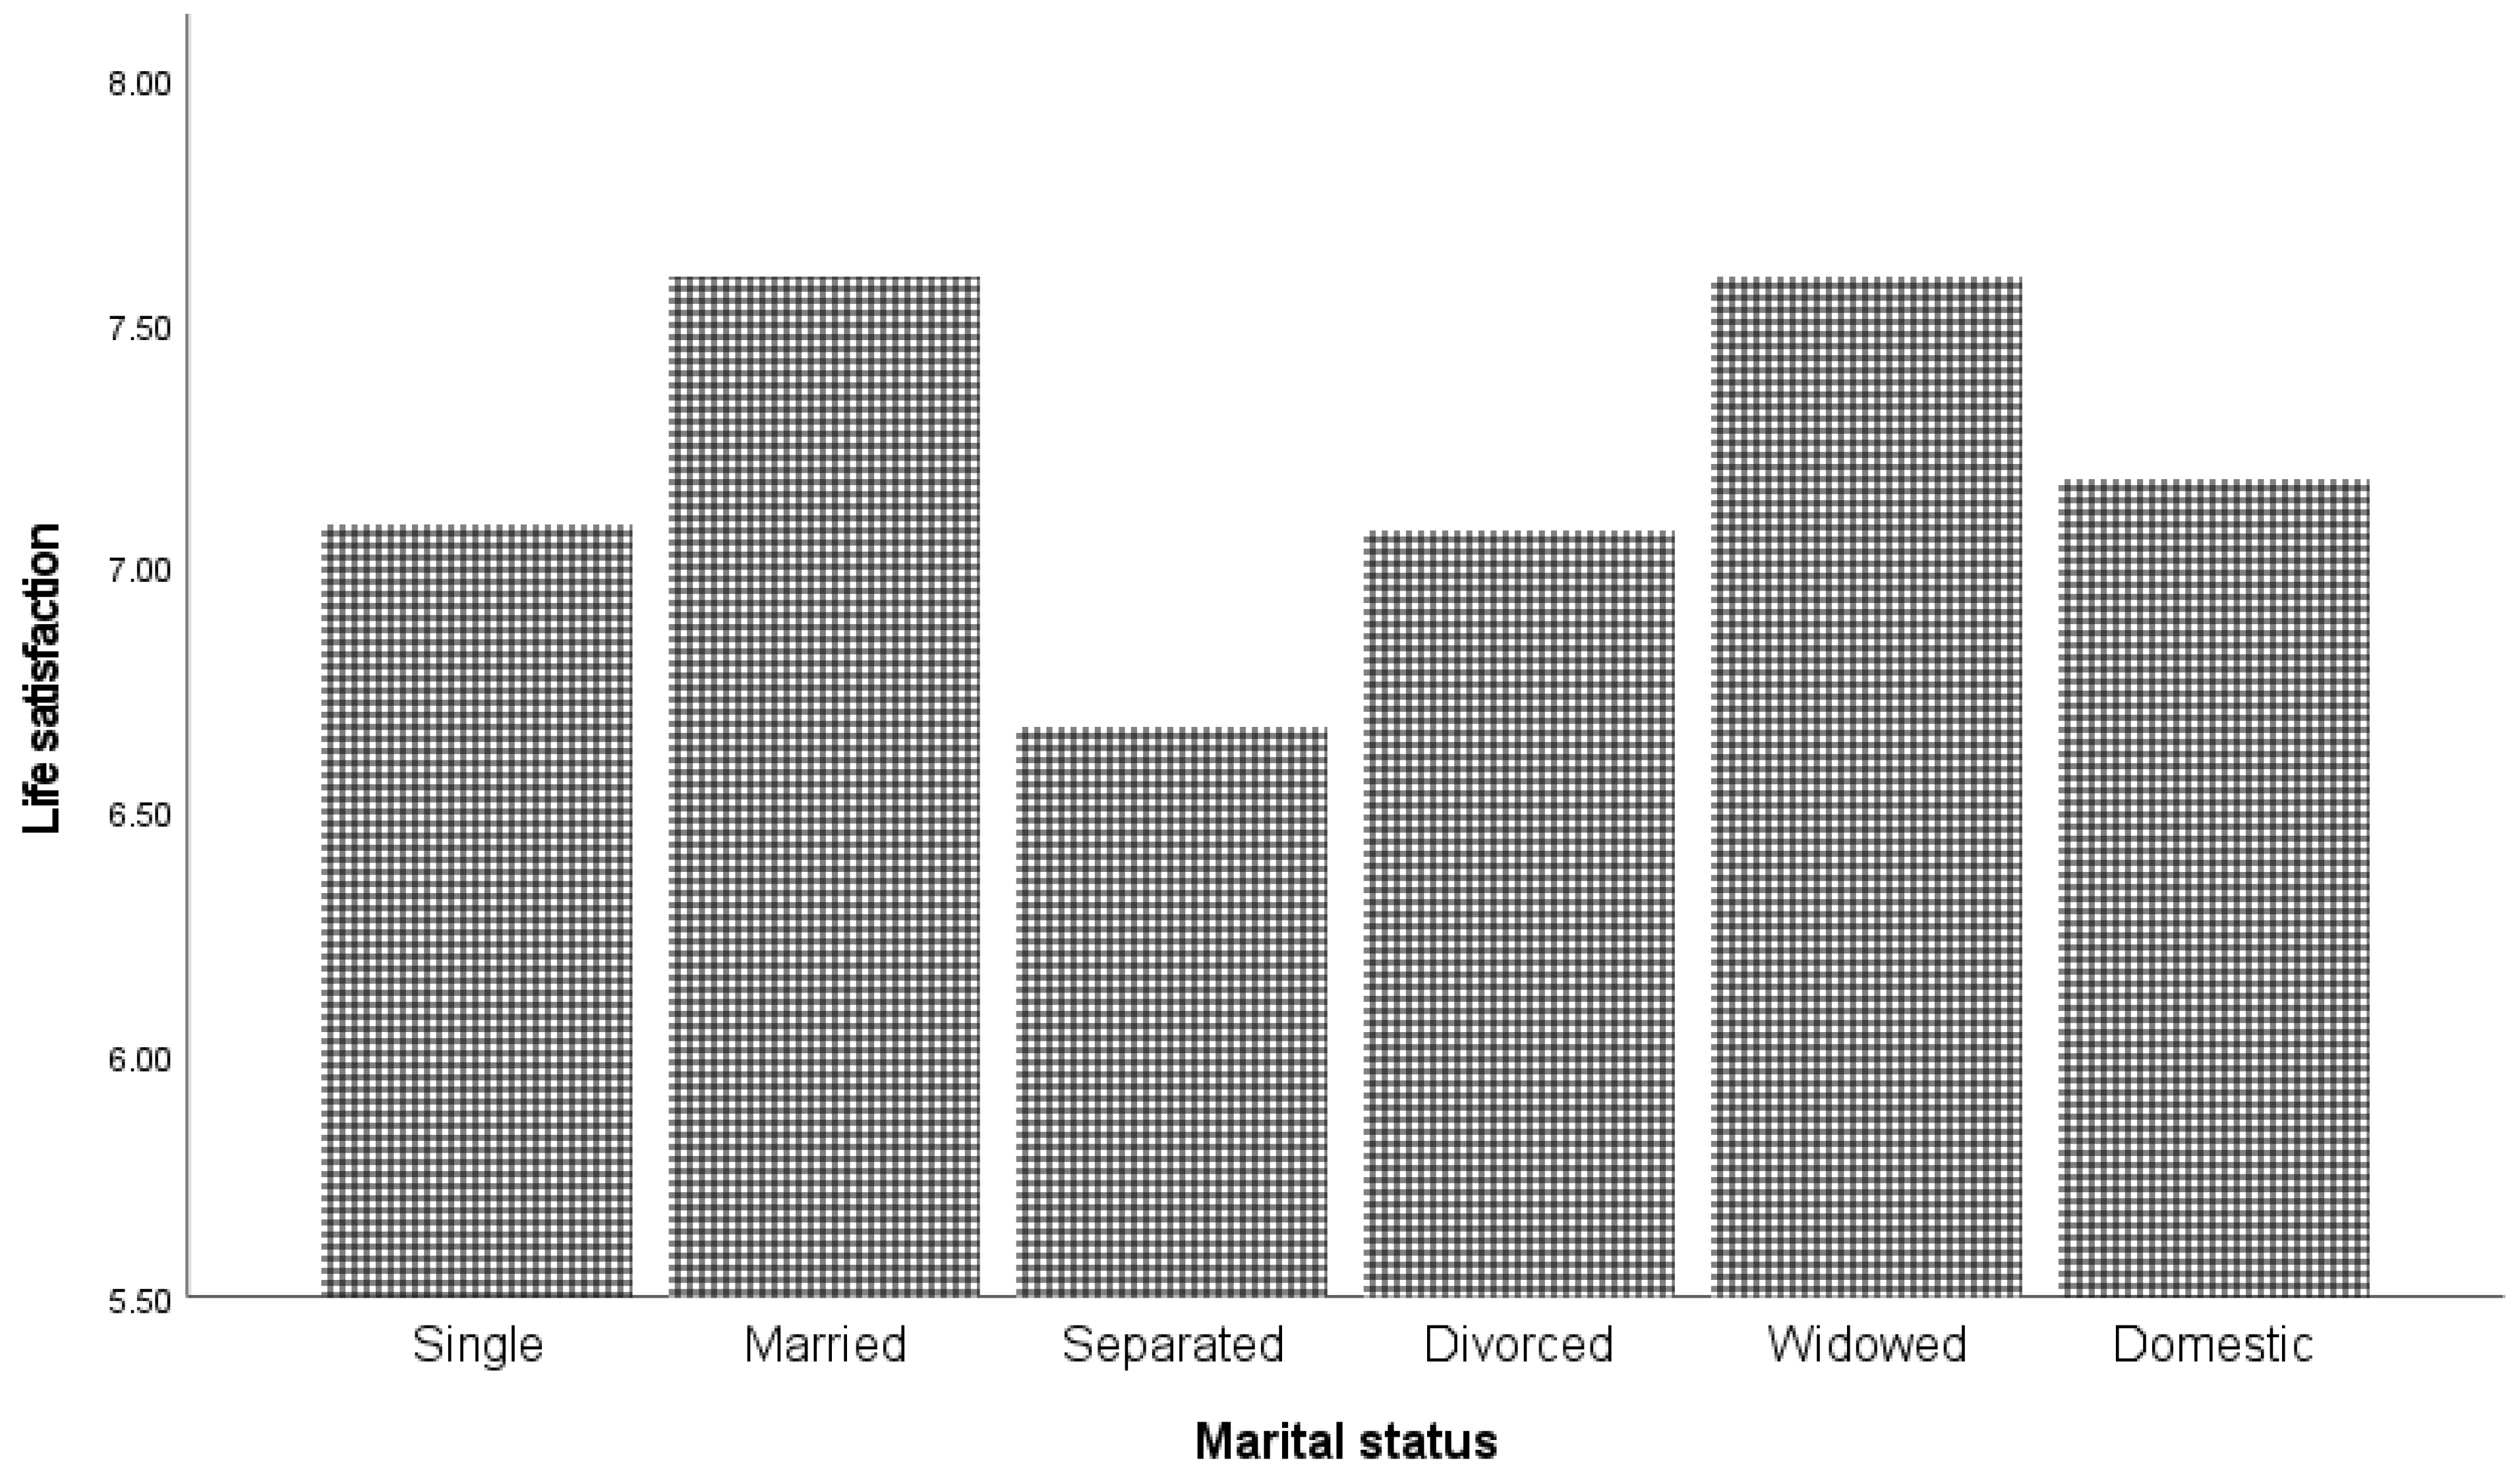
| Relationship status | Single | 7.084 | 1.768 | 2557 |
| df = 5, 10,717 F = 54.524 p < 0.001 η2 = 0.025 | Married | 7.589 | 1.542 | 5451 |
| Separated | 6.670 | 1.867 | 282 | |
| Divorced | 7.074 | 1.804 | 674 | |
| Widow | 7.594 | 1.799 | 961 | |
| Domestic partnership | 7.177 | 1.589 | 798 | |
| Total | 7.382 | 1.672 | 10,723 | |
| Country of birth | Born in NZ | 7.378 | 1.678 | 6618 |
| df = 1, 8745 F = 0.244 p = 0.622 η2 = 0.000 | Born in another country | 7.357 | 1.662 | 2129 |
| Total | 7.373 | 1.674 | 8747 | |
| Income quintile | Poorest 20% | 6.818 | 1.963 | 1206 |
| df = 4, 8252 F = 78.291 p < 0.001 η2 = 0.037 | Second 20% | 7.097 | 1.871 | 1542 |
| Middle 20% | 7.313 | 1.611 | 1644 | |
| Fourth 20% | 7.483 | 1.508 | 1736 | |
| Richest 20% | 7.772 | 1.400 | 2129 | |
| Total | 7.354 | 1.679 | 8257 |
| Predictor | B | 95.0% CI for B | t | p | Beta | |
|---|---|---|---|---|---|---|
| Low | Up | |||||
| (Constant) | 2.963 | 2.631 | 3.296 | 17.468 | 0.000 | - |
| Female | 0.262 | 0.186 | 0.338 | 6.754 | 0.000 | 0.077 |
| Age | 0.005 | 0.002 | 0.007 | 4.064 | 0.000 | 0.052 |
| Squared age | 0.000 | 0.000 | 0.000 | 4.911 | 0.000 | 0.059 |
| Negative experience | −0.703 | −0.839 | −0.566 | −10.084 | 0.000 | −0.122 |
| Positive experience | 0.500 | 0.380 | 0.620 | 8.153 | 0.000 | 0.097 |
| Health problems | −0.302 | −0.394 | −0.210 | −6.424 | 0.000 | −0.072 |
| HH income satisfaction | 0.405 | 0.351 | 0.458 | 14.755 | 0.000 | 0.191 |
| Satisfaction with standards of living | 0.762 | 0.645 | 0.880 | 12.720 | 0.000 | 0.162 |
| Satisfied with healthcare | 0.130 | 0.033 | 0.226 | 2.633 | 0.008 | 0.030 |
| Satisfied with housing | 0.115 | 0.043 | 0.187 | 3.139 | 0.002 | 0.034 |
| Confidence in government | 0.119 | 0.041 | 0.198 | 2.976 | 0.003 | 0.035 |
| Corruption | −0.022 | −0.130 | 0.087 | −0.394 | 0.694 | −0.005 |
| City satisfaction | 0.644 | 0.521 | 0.768 | 10.225 | 0.000 | 0.115 |
| Helped | 0.112 | 0.036 | 0.187 | 2.896 | 0.004 | 0.032 |
| Volunteered | 0.185 | 0.112 | 0.259 | 4.968 | 0.000 | 0.055 |
| Donated | 0.075 | −0.008 | 0.157 | 1.778 | 0.076 | 0.020 |
| Religiosity | −0.027 | −0.104 | 0.050 | −0.693 | 0.489 | −0.008 |
| Social support | 0.435 | 0.271 | 0.599 | 5.199 | 0.000 | 0.057 |
| Learned | 0.175 | 0.095 | 0.256 | 4.292 | 0.000 | 0.049 |
| Freedom | 0.180 | 0.028 | 0.332 | 2.324 | 0.020 | 0.027 |
| Safe at night | 0.092 | 0.012 | 0.171 | 2.269 | 0.023 | 0.026 |
| Respect | 0.122 | −0.023 | 0.268 | 1.648 | 0.099 | 0.019 |
| Education | −0.026 | −0.086 | 0.034 | −0.848 | 0.396 | −0.010 |
| Separated | −0.139 | −0.369 | 0.090 | −1.194 | 0.233 | −0.013 |
| Married | 0.255 | 0.176 | 0.335 | 6.313 | 0.000 | 0.076 |
| Unemployed | −0.178 | −0.372 | 0.015 | −1.808 | 0.071 | −0.020 |
| No. of children | 0.014 | −0.026 | 0.054 | 0.689 | 0.491 | 0.008 |
| Male | Female | |||
|---|---|---|---|---|
| 15–39 | 40–99 | 15–39 | 40–99 | |
| (Constant) | 3.667 *** | 3.332 *** | 3.506 *** | 3.163 *** |
| Negative experience | −0.610 | −0.816 *** | −0.428 | −0.888 *** |
| Positive experience | 0.643 *** | 0.723 *** | 0.462 | 0.348 *** |
| Health problems | 0.021 | −0.366 *** | −0.246 | −0.200 |
| HH income satisfaction | 0.295 *** | 0.465 *** | 0.421 *** | 0.432 *** |
| Satisfaction with standards of living | 0.558 | 0.969 *** | 0.538 *** | 0.776 *** |
| Satisfied with housing | 0.206 | 0.093 | 0.034 | 0.177 |
| Confidence in government | 0.175 | 0.085 | 0.018 | 0.105 |
| Corruption | −0.040 | −0.256 | 0.111 | −0.010 |
| City satisfaction | 0.401 | 0.507 *** | 0.538 *** | 0.877 *** |
| Helped | 0.126 | 0.097 | 0.085 | 0.007 |
| Volunteered | 0.064 | 0.123 | 0.282 | 0.255 *** |
| Donated | 0.197 | 0.106 | 0.036 | 0.158 |
| Religiosity | −0.087 | 0.024 | −0.050 | 0.051 |
| Social support | 0.613 | 0.372 | 0.453 | 0.464 *** |
| Learned | 0.102 | 0.184 | 0.207 | 0.212 |
| Freedom | 0.170 | −0.229 | 0.348 | 0.408 *** |
| Safe at night | −0.049 | 0.010 | 0.129 | 0.057 |
| Respect | 0.233 | 0.105 | 0.502 | −0.044 |
| Education | −0.058 | −0.021 | −0.181 | −0.027 |
| Married | 0.073 | 0.312 *** | 0.190 | 0.180 |
| Number of children | 0.075 | −0.042 | −0.019 | −0.023 |
| R2 | F | df | Most Important Predictors | ||
|---|---|---|---|---|---|
| Male | 15–39 | 0.256 | 12.602 *** | 21, 770 | SWSL, Positive, HH income, Negative, City satisfaction |
| 40–99 | 0.350 | 51.077 *** | 21, 1993 | SWSL, Positive, HH income, Negative, Married | |
| Female | 15–39 | 0.274 | 19.333 *** | 21, 1074 | SWSL, Positive, HH income, City satisfaction, Respect |
| 40–99 | 0.341 | 69.680 *** | 21, 2828 | SWSL, HH income, Negative, City satisfaction, Volunteered |
Publisher’s Note: MDPI stays neutral with regard to jurisdictional claims in published maps and institutional affiliations. |
© 2022 by the authors. Licensee MDPI, Basel, Switzerland. This article is an open access article distributed under the terms and conditions of the Creative Commons Attribution (CC BY) license (https://creativecommons.org/licenses/by/4.0/).
Share and Cite
Jarden, R.J.; Joshanloo, M.; Weijers, D.; Sandham, M.H.; Jarden, A.J. Predictors of Life Satisfaction in New Zealand: Analysis of a National Dataset. Int. J. Environ. Res. Public Health 2022, 19, 5612. https://doi.org/10.3390/ijerph19095612
Jarden RJ, Joshanloo M, Weijers D, Sandham MH, Jarden AJ. Predictors of Life Satisfaction in New Zealand: Analysis of a National Dataset. International Journal of Environmental Research and Public Health. 2022; 19(9):5612. https://doi.org/10.3390/ijerph19095612
Chicago/Turabian StyleJarden, Rebecca J., Mohsen Joshanloo, Dan Weijers, Margaret H. Sandham, and Aaron J. Jarden. 2022. "Predictors of Life Satisfaction in New Zealand: Analysis of a National Dataset" International Journal of Environmental Research and Public Health 19, no. 9: 5612. https://doi.org/10.3390/ijerph19095612