
Machine Learning and Lean Six Sigma to Assess How COVID-19 Has Changed the Patient Management of the Complex Operative Unit of Neurology and Stroke Unit: A Single Center Study


Abstract
:1. Introduction
2. Materials and Methods
- Gender,
- Age,
- Department and COU,
- Main and secondary diagnoses,
- Diagnosis related group (DRG),
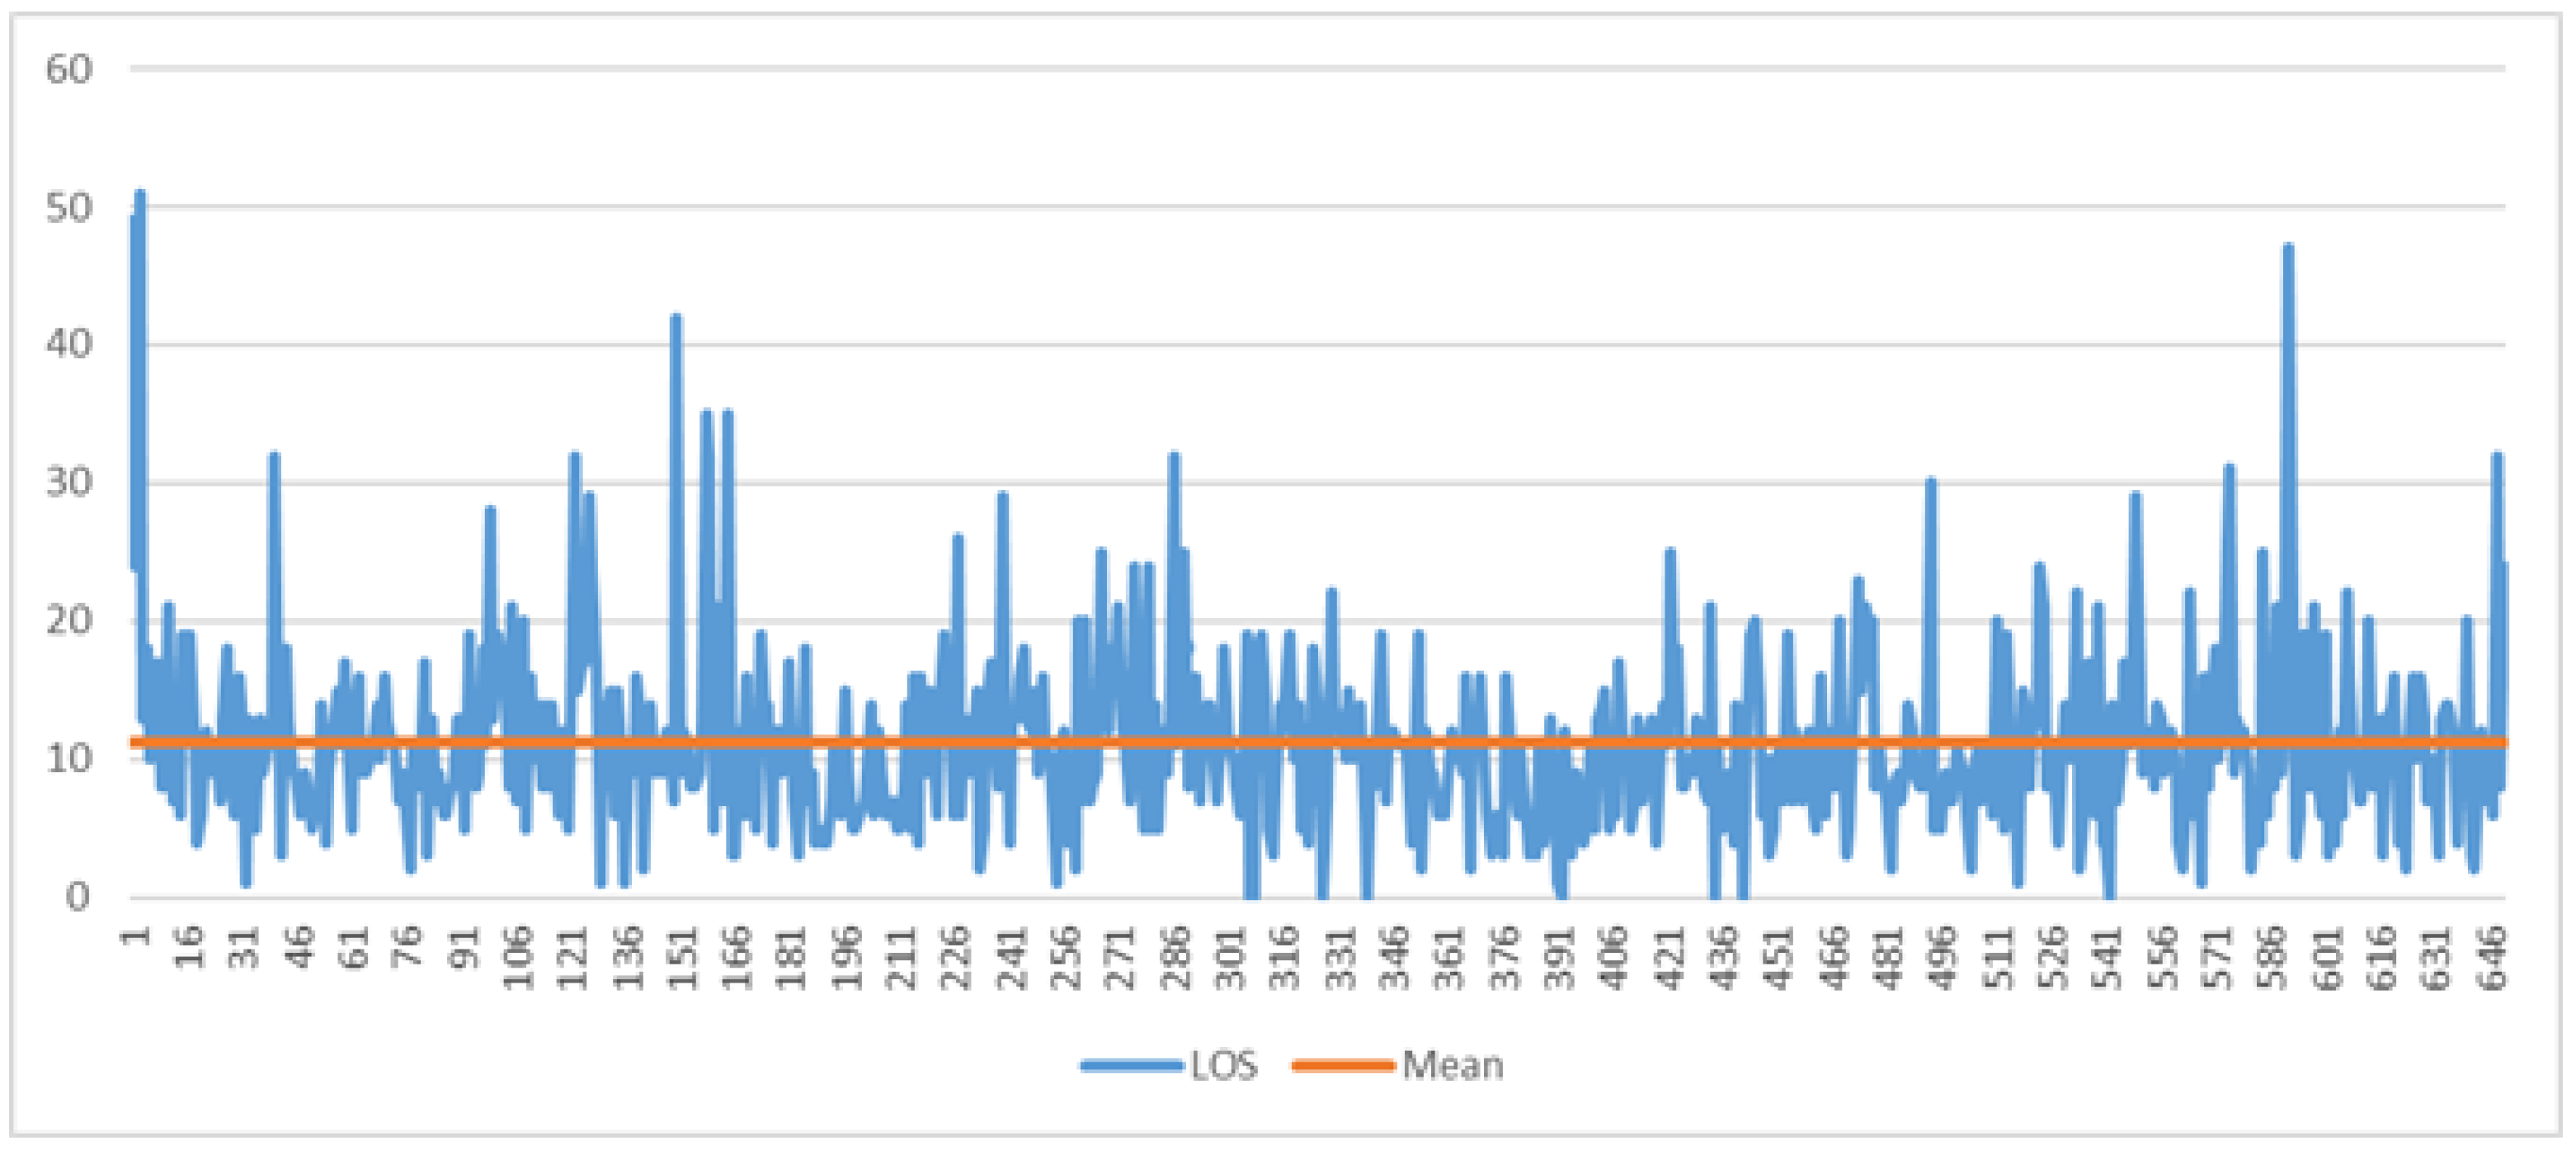
- Length of hospital stay (LOS), i.e. date of admission—date of discharge,
- Diagnosis related group (DRG) relative weight,
- Number of days of hospital (DH) admission, i.e. the number of visits to the hospital for appointments and medical checks,
- Mode of discharge.
2.1. Data Analysis
Machine Learning Algorithms
2.2. DMAIC Cycle
- Define by identifying, prioritizing and selecting the correct project;
- Measure key process characteristic, the scope of parameters and their performances;
- Analyze by identifying key causes and process determinants;
- Improve by changing the process and optimizing performance; and
- Control by sustaining the gain.
2.2.1. Define
2.2.2. Measure
2.2.3. Analyze
2.2.4. Improve
2.2.5. Control
3. Results
3.1. Statistical Analysis
3.2. Classification Results
4. Discussion
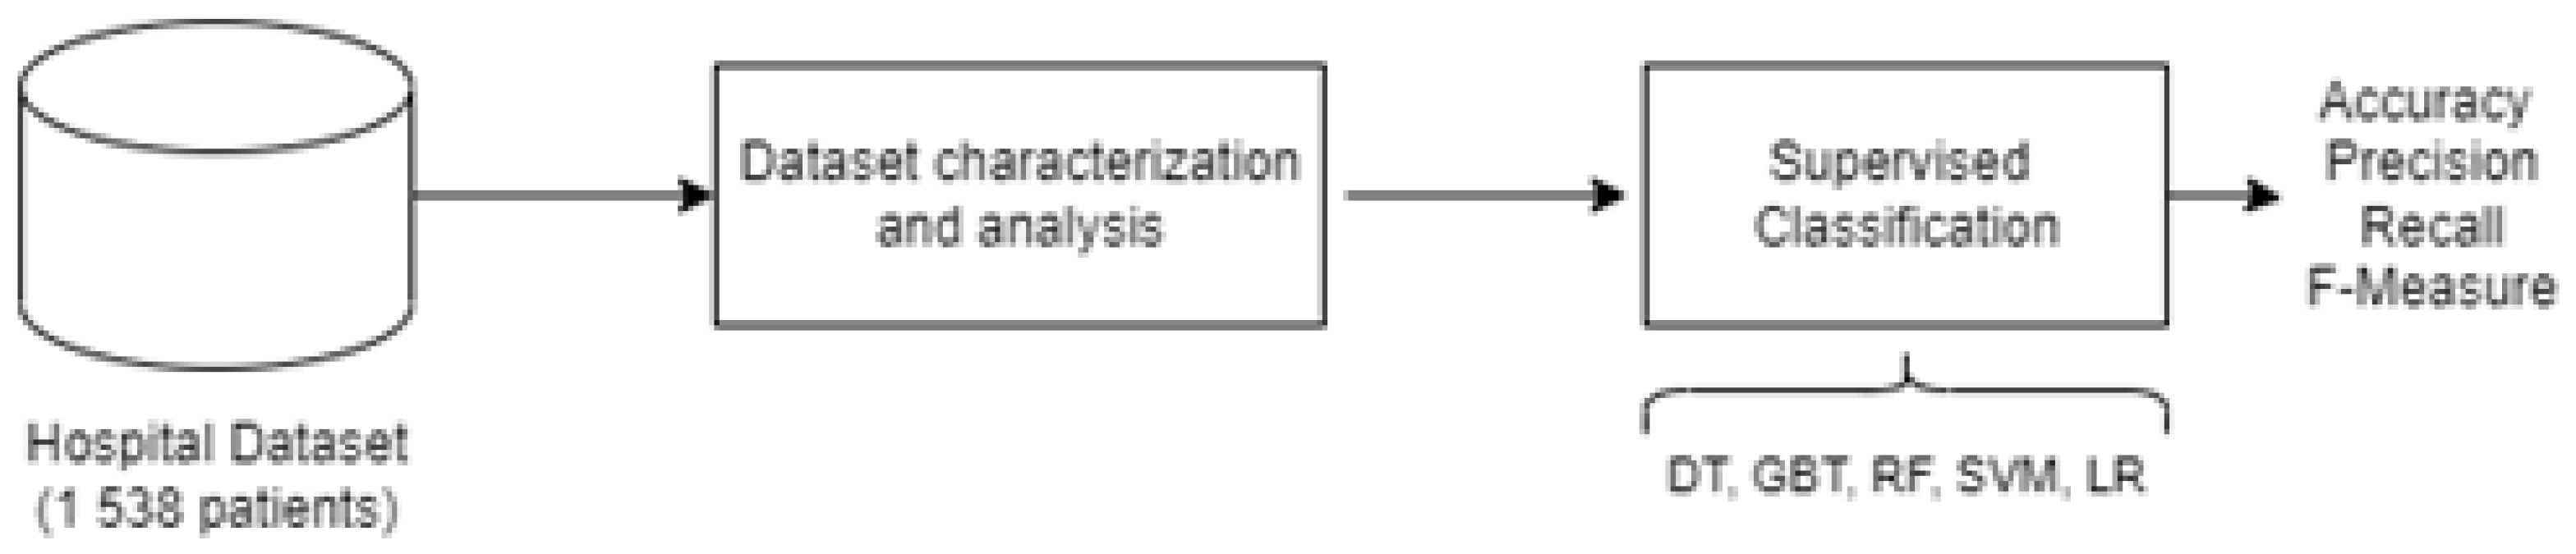
- Although several analyses have been made in the last two years to analyze COVID-19 pandemic, the majority of these have focused on how the virus spreads and what factors most impact this spread. This analysis focuses on the patients in order to evaluate and improve the understanding of the impact of the COVID-19 pandemic on a cohort of 1538 subjects,
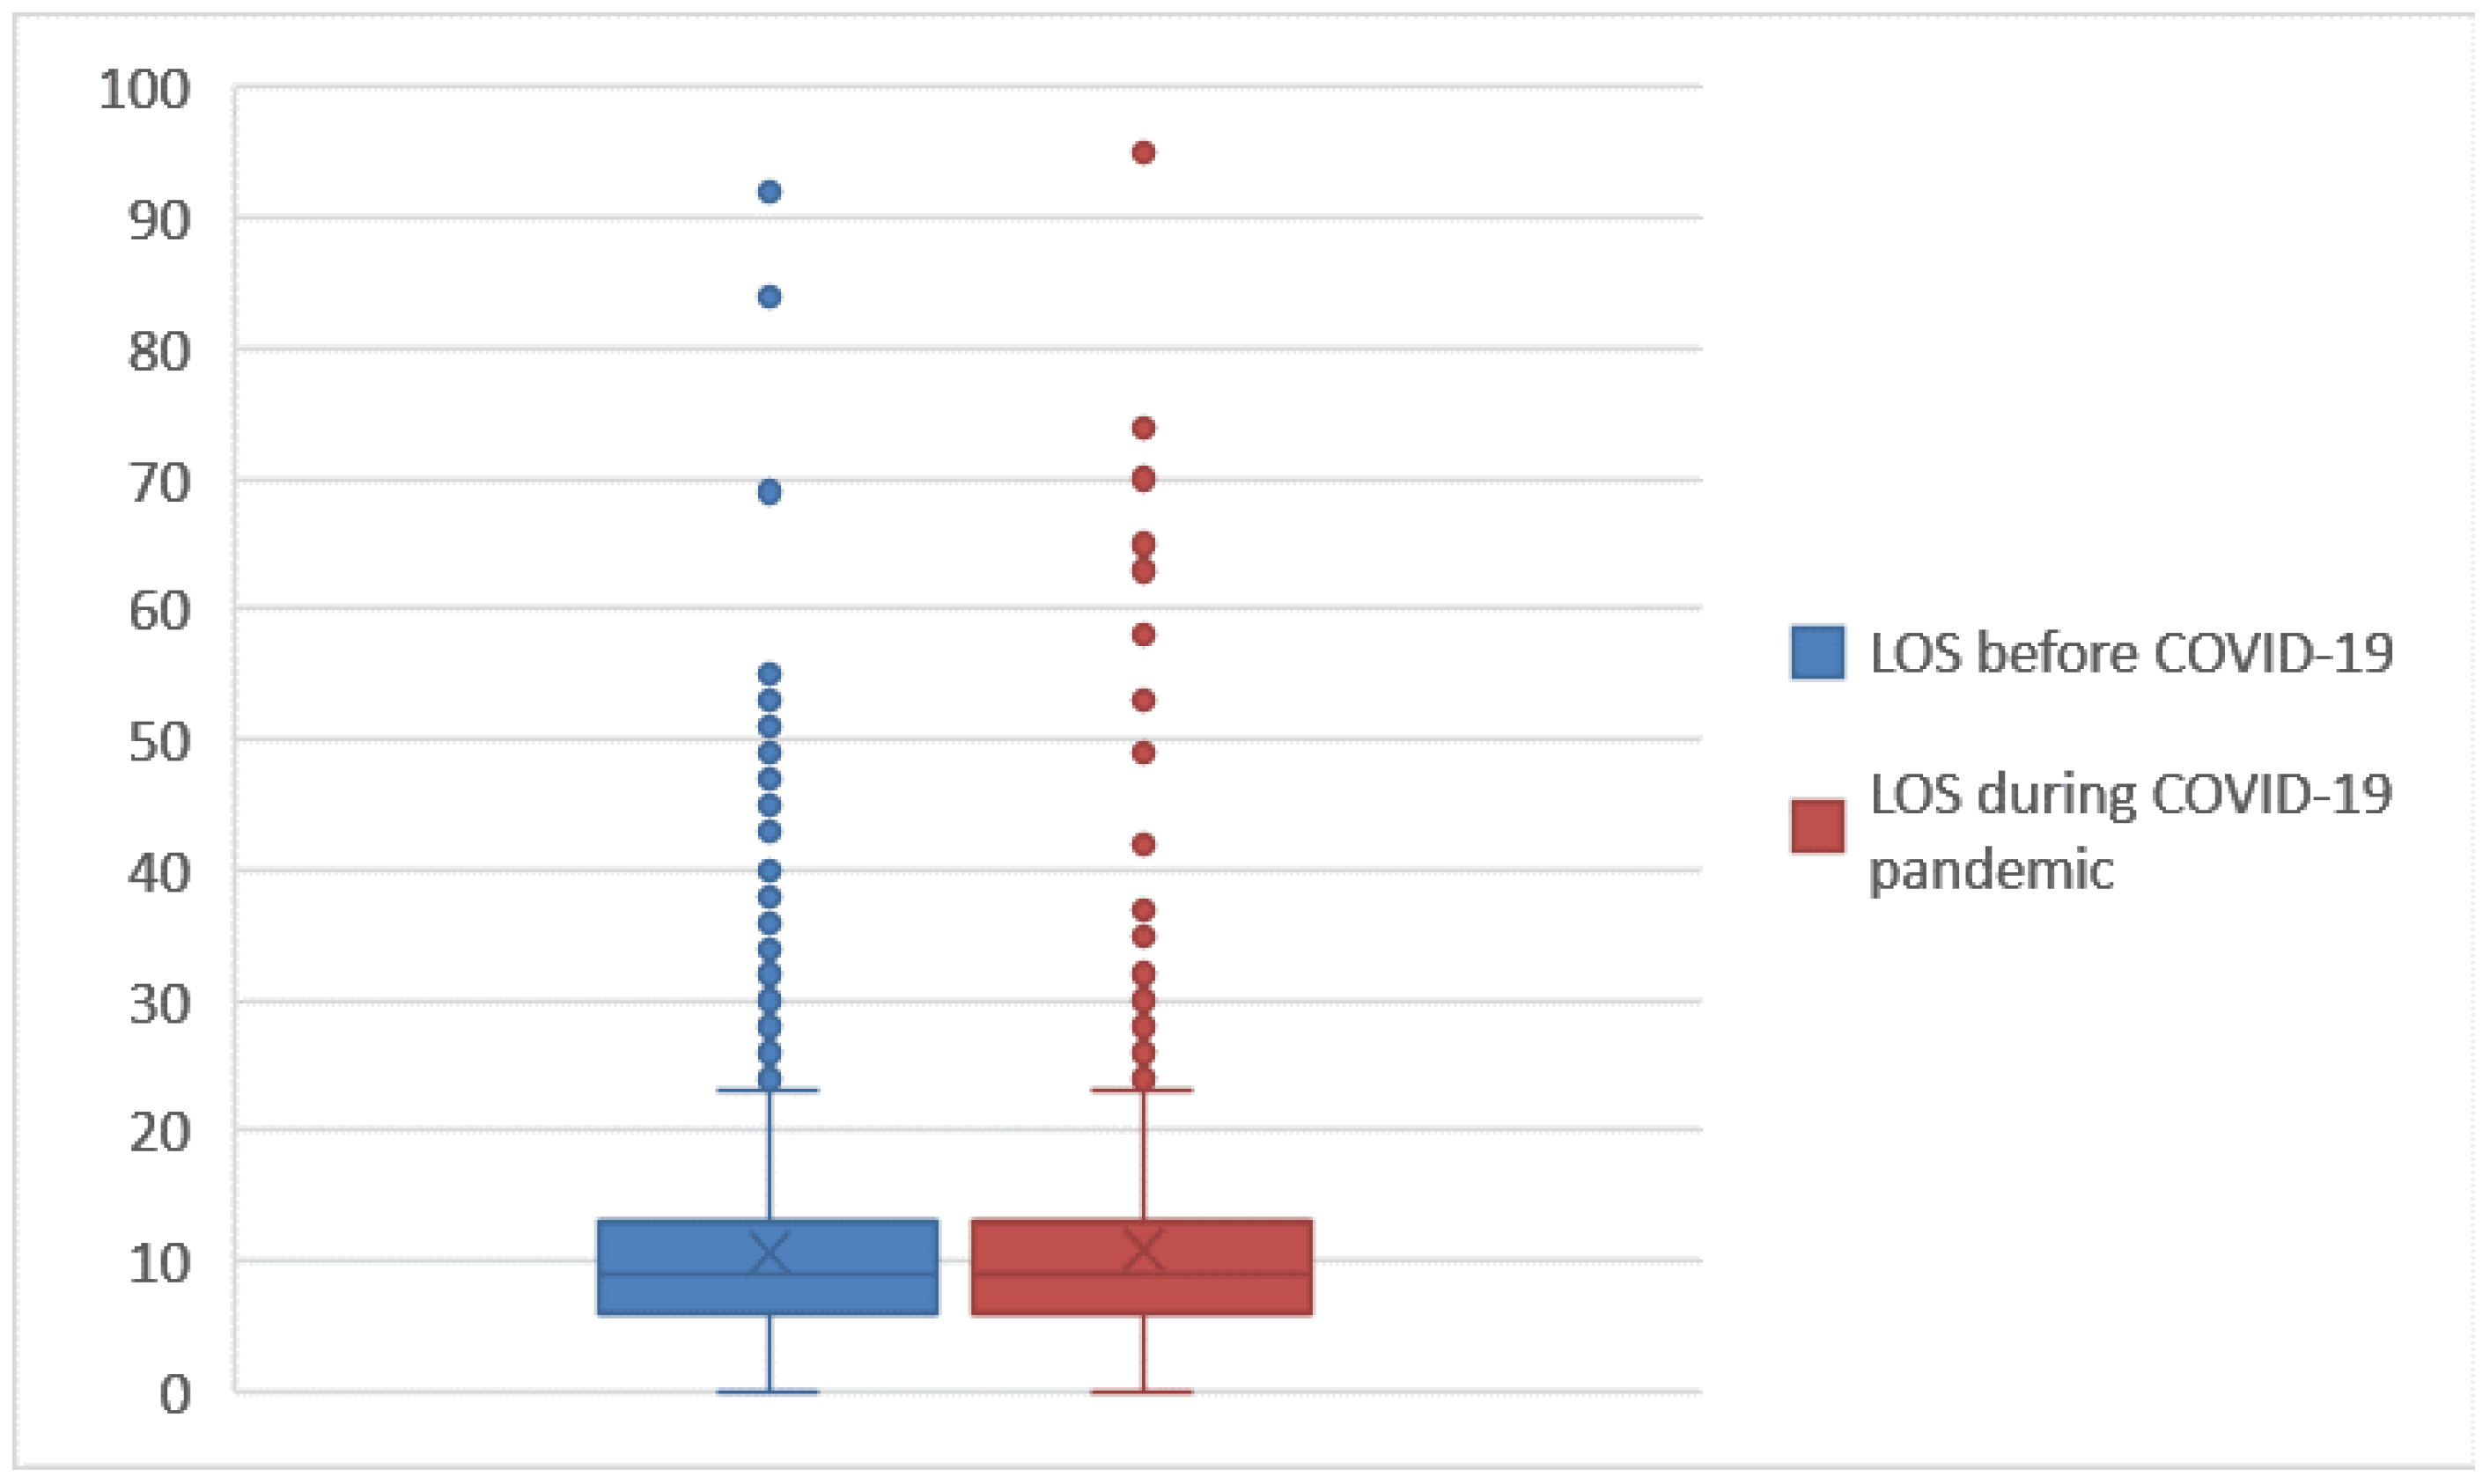
- It analyzes changes due to COVID-19 in terms of LOS (length of stay), mode of discharge and DRG (diagnosis related group) relative weight.
- It combines the use of both Lean Sigma Approach and predictive machine learning tools in order to deepened and strengthen the analysis of the proposed case study.
5. Conclusions
Author Contributions
Funding
Institutional Review Board Statement
Informed Consent Statement
Data Availability Statement
Conflicts of Interest
References
- Wilson, M.P.; Jack, A.S. Coronavirus disease 2019 (COVID-19) in neurology and neurosurgery: A scoping review of the early literature. Clin. Neurol. Neurosurg. 2020, 193, 105866. [Google Scholar] [CrossRef] [PubMed]
- Mao, L.; Jin, H.; Wang, M.; Hu, Y.; Chen, S.; He, Q.; Chang, J.; Hong, C.; Zhou, Y.; Wang, D.; et al. Neurologic manifestations of hospitalized patients with coronavirus disease 2019 in Wuhan, China. JAMA Neurol. 2020, 77, 683–690. [Google Scholar] [CrossRef] [Green Version]
- Asadi-Pooya, A.A.; Simani, L. Central nervous system manifestations of COVID-19: A systematic review. J. Neurol. Sci. 2020, 413, 116832. [Google Scholar] [CrossRef] [PubMed]
- Moriguchi, T.; Harii, N.; Goto, J.; Harada, D.; Sugawara, H.; Takamino, J.; Ueno, M.; Sakata, H.; Kondo, K.; Myose, N.; et al. A first case of meningitis/encephalitis associated with SARS-coronavirus-2. Int. J. Infect. Dis. 2020, 3, 55–58. [Google Scholar] [CrossRef] [PubMed]
- Duong, L.; Xu, P.; Liu, A. Meningoencephalitis without respiratory failure in a young female patient with COVID-19 infection in Downtown Los Angeles, early April 2020. Brain Behav. Immun. 2020, 87, 33. [Google Scholar] [CrossRef] [PubMed]
- Manji, H.; Carr, A.S.; Brownlee, W.J.; Lunn, M.P. Neurology in the time of COVID-19. J. Neurol. Neurosurg. Psychiatry 2020, 91, 568–570. [Google Scholar] [CrossRef]
- Wee, L.E.; Conceicao, E.P.; Sim, X.Y.J.; Aung, M.K.; Wong, H.M.; Wijaya, L.; Tan, B.H.; Ling, M.L.; Venkatachalam, I. Minimising intra-hospital transmission of COVID-19: The role of social distancing. J. Hosp. Infect. 2020, 105, 113–115. [Google Scholar] [CrossRef] [PubMed]
- Komashie, A.; Mousavi, A.; Gore, J. Quality management in healthcare and industry: A comparative review and emerging themes. J. Manag. Hist. 2007. [Google Scholar] [CrossRef]
- Dias, A.C.; Reis, A.C.; Oliveira, R.P.; Maruyama, Ú.; Martinez, P. Lean manufacturing in healthcare: A systematic review of literature. Rev. Produção E Desenvolv. 2018, 4, 111–122. [Google Scholar] [CrossRef]
- Jarrett, P.G. Logistics in the health care industry. Int. J. Phys. Distrib. Logist. Manag. 1998. [Google Scholar] [CrossRef]
- Aceto, G.; Persico, V.; Pescapé, A. Industry 4.0 and health: Internet of things, big data, and cloud computing for healthcare 4.0. J. Ind. Inf. Integr. 2020, 18, 100129. [Google Scholar] [CrossRef]
- Kane, M.; Chui, K.; Rimicci, J.; Callagy, P.; Hereford, J.; Shen, S.; Norris, R.; Pickham, D. Lean manufacturing improves emergency department throughput and patient satisfaction. JONA J. Nurs. Adm. 2015, 45, 429–434. [Google Scholar] [CrossRef] [PubMed]
- Kim, D. An integrated supply chain management system: A case study in healthcare sector. In Proceedings of the International Conference on Electronic Commerce and Web Technologies, Copenhagen, Denmark, 23–26 August 2005; Springer: Berlin/Heidelberg, Germany, 2005; pp. 218–227. [Google Scholar]
- Cesarelli, G.; Scala, A.; Vecchione, D.; Ponsiglione, A.M.; Guizzi, G. An Innovative Business Model for a Multi-echelon Supply Chain Inventory Management Pattern. In Journal of Physics: Conference Series; IOP Publishing: Bristol, UK, 2021; Volume 1828, p. 012082. [Google Scholar]
- Improta, G.; Scala, A.; Trunfio, T.A.; Guizzi, G. Application of Supply Chain Management at Drugs Flow in an Italian Hospital District. In Journal of Physics: Conference Series; IOP Publishing: Bristol, UK, 2021; Volume 1828, No. 1. [Google Scholar]
- Ponsiglione, A.M.; Romano, M.; Amato, F. A finite-state machine approach to study patients dropout from medical examinations. In Proceedings of the 2021 IEEE 6th International Forum on Research and Technology for Society and Industry (RTSI), Online, 6–9 September 2021; IEEE: Piscataway, NJ, USA, 2021; pp. 289–294. [Google Scholar]
- Trunfio, T.A.; Scala, A.; Borrelli, A.; Sparano, M.; Triassi, M.; Improta, G. Application of the Lean Six Sigma approach to the study of the LOS of patients who undergo laparoscopic cholecystectomy at the San Giovanni di Dio and Ruggi d’Aragona University Hospital. In Proceedings of the 2021 5th International Conference on Medical and Health Informatics, Kyoto, Japan, 14–16 May 2021. [Google Scholar]
- Ponsiglione, A.M.; Ricciardi, C.; Scala, A.; Fiorillo, A.; Sorrentino, A.; Triassi, M.; Improta, G. Application of DMAIC cycle and modeling as tools for health technology assessment in a university hospital. J. Healthc. Eng. 2021, 2021, 1–11. [Google Scholar] [CrossRef]
- Scala, A.; Ponsiglione, A.M.; Loperto, I.; Della Vecchia, A.; Borrelli, A.; Russo, G.; Improta, G. Lean six sigma approach for reducing length of hospital stay for patients with femur fracture in a university hospital. Int. J. Environ. Res. Public Health 2021, 18, 2843. [Google Scholar] [CrossRef] [PubMed]
- Ferraro, A.; Centobelli, P.; Cerchione, R.; Cicco, M.V.D.; Montella, E.; Raiola, E.; Triassi, M.; Improta, G. Implementation of lean practices to reduce healthcare associated infections. Int. J. Healthc. Technol. Manag. 2020, 18, 51–72. [Google Scholar] [CrossRef]
- Cesarelli, G.; Montella, E.; Scala, A.; Raiola, E.; Triassi, M.; Improta, G. DMAIC approach for the reduction of healthcare-associated infections in the neonatal intensive care unit of the university hospital of Naples ‘federico II’. In Proceedings of the European Medical and Biological Engineering Conference, Portorož, Slovenia, 29 November–3 December 2020; Springer: Cham, Switzerland, 2020. [Google Scholar]
- Converso, G.; Improta, G.; Mignano, M.; Santillo, L.C. A simulation approach for agile production logic implementation in a hospital emergency unit. In Proceedings of the International Conference on Intelligent Software Methodologies, Tools, and Techniques, Naples, Italy, 15–17 September 2015; Springer: Cham, Switzerland, 2015. [Google Scholar]
- Improta, G.; Triassi, M.; Guizzi, G.; Santillo, L.C.; Revetria, R.; Catania, A.; Cassettari, L. An innovative contribution to health technology assessment. In Modern Advances in Intelligent Systems and Tools; Springer: Berlin/Heidelberg, Germany, 2012; pp. 127–131. [Google Scholar]
- Improta, G.; Converso, G.; Murino, T.; Gallo, M.; Perrone, A.; Romano, M. Analytic Hierarchy Process (AHP) in dynamic configuration as a tool for Health Technology Assessment (HTA): The case of biosensing optoelectronics in Oncology. Int. J. Inf. Technol. Decis. Mak. (IJITDM) 2019, 18, 1533–1550. [Google Scholar] [CrossRef] [Green Version]
- Improta, G.; Simone, T.; Bracale, M. HTA (Health Technology Assessment): A means to reach governance goals and to guide health politics on the topic of clinical Risk management. In Proceedings of the 11th World Congress on Medical Physics and Biomedical Engineering (IUPESM 2009), Munich, Germany, 7–12 September 2009. [Google Scholar]
- Oliver, A.; Mossialos, E.; Robinson, R. Health technology assessment and its influence on health-care priority setting. Int. J. Technol. Assess. Health Care 2004, 20, 1–10. [Google Scholar] [CrossRef]
- Revetria, R.; Catania, A.; Cassettari, L.; Guizzi, G.; Romano, E.; Murino, T.; Improta, G.; Fujita, H. Improving healthcare using cognitive computing based software: An application in emergency situation. In Advanced Research in Applied Artificial Intelligence; Springer: Berlin/Heidelberg, Germany, 2012; Volume 7345, pp. 477–490. [Google Scholar]
- Zhou, X.; Liang, W.; Kevin, I.; Wang, K.; Wang, H.; Yang, L.T.; Jin, Q. Deep-learning-enhanced human activity recognition for Internet of healthcare things. IEEE Internet Things J. 2020, 7, 6429–6438. [Google Scholar] [CrossRef]
- Mir, A.; Dhage, S.N. Diabetes disease prediction using machine learning on big data of healthcare. In Proceedings of the 2018 Fourth International Conference on Computing Communication Control and Automation (ICCUBEA), Pune, India, 16–18 August 2018; IEEE: Piscataway, NJ, USA, 2018; pp. 1–6. [Google Scholar]
- Waring, J.; Lindvall, C.; Umeton, R. Automated machine learning: Review of the state-of-the-art and opportunities for healthcare. Artif. Intell. Med. 2020, 104, 101822. [Google Scholar] [CrossRef]
- Russo, T.; Peluso, V.; Gloria, A.; Oliviero, O.; Rinaldi, L.; Improta, G.; De Santis, R.; D’Antò, V. Combination design of time-dependent magnetic field and magnetic nanocomposites to guide cell behavior. Nanomaterials 2020, 10, 577. [Google Scholar] [CrossRef] [Green Version]
- Cesarelli, M.; Romano, M.; Bifulco, P.; Improta, G.; D’Addio, G. Prognostic decision support using symbolic dynamics in CTG monitoring. EFMI-STC 2013, 186, 140–144. [Google Scholar]
- Ponsiglione, A.M.; Cosentino, C.; Cesarelli, G.; Amato, F.; Romano, M. A comprehensive review of techniques for processing and analyzing fetal heart rate signals. Sensors 2021, 21, 6136. [Google Scholar] [CrossRef] [PubMed]
- Giovanni, I.; Pasquale, N.; Carmela, S.L.; Triassi, M. Health worker monitoring: Kalman-based software design for fault isolation in human breathing. In Proceedings of the European Modeling and Simulation Symposium (EMSS), Bordeaux, France, 22–24 September 2014. [Google Scholar]
- Scala, A.; Loperto, I.; Carrano, R.; Federico, S.; Triassi, M.; Improta, G. Assessment of proteinuria level in nephrology patients using a machine learning approach. In Proceedings of the 2021 5th International Conference on Medical and Health Informatics, Kyoto, Japan, 14–16 May 2021. [Google Scholar]
- Santini, S.; Pescape, A.; Valente, A.S.; Abate, V.; Improta, G.; Triassi, M.; Ricchi, P.; Filosa, A. Using fuzzy logic for improving clinical daily-care of β-thalassemia patients. In Proceedings of the 2017 IEEE International Conference on Fuzzy Systems (FUZZ-IEEE), Naples, Italy, 9–12 July 2017; IEEE: Piscataway, NJ, USA, 2017. [Google Scholar]
- Cortesi, P.A.; Castaman, G.; Trifirò, G.; Creazzola, S.S.; Improta, G.; Mazzaglia, G.; Molinari, A.C.; Mantovani, L.G. Cost-effectiveness and budget impact of emicizumab prophylaxis in haemophilia A patients with inhibitors. Thromb. Haemost. 2020, 120, 216–228. [Google Scholar] [CrossRef] [PubMed]
- Fucile, P.; Papallo, I.; Improta, G.; De Santis, R.; Gloria, A.; Onofrio, I.; D’Anto, V.; Maietta, S.; Russo, T. Reverse Engineering and Additive Manufacturing towards the design of 3D advanced scaffolds for hard tissue regeneration. In Proceedings of the 2019 II Workshop on Metrology for Industry 4.0 and IoT (MetroInd4. 0&IoT), Naples, Italy, 4–6 June 2019; IEEE: Piscataway, NJ, USA, 2019. [Google Scholar]
- Maniscalco, G.; Cerillo, I.; Servillo, G.; Napolitano, M.; Guarcello, G.; Abate, V.; Improta, G.; Florio, C. Early neutropenia with thrombocytopenia following alemtuzumab treatment for multiple sclerosis: Case report and review of literature. Clin. Neurol. Neurosurg. 2018, 175, 134–136. [Google Scholar] [CrossRef]
- Ross, L.; Bena, J.; Bermel, R.; McCarter, L.; Ahmed, Z.; Goforth, H.; Cherian, N.; Kriegler, J.; Estemalik, E.; Stanton, M.; et al. Implementation and patient experience with outpatient subspecialty teleneurology visits at a single academic institution over four years. J. Telemed. e-Health, 2019; in press. [Google Scholar]
- Moro, E.; Fernandez, H.H. Adaptive neurology in COVID-19 times. Parkinsonism Relat. Disord. 2020, 75, 124–125. [Google Scholar] [CrossRef]
- Houghton, A.; Bowling, A.; Jones, I.; Clarke, K. Appropriateness of admission and the last 24 h of hospital care in medical wards in an east London teaching group hospital. Int. J. Qual. Health Care 1996, 8, 543–553. [Google Scholar] [CrossRef] [Green Version]
- Coast, J.; Peters, T.J.; Ingles, A. Factors associated with inappropriate emergency hospital admission in the UK. Int. J. Qual. Healthc. 1996, 8, 31–39. [Google Scholar] [CrossRef] [Green Version]
- Taylor, R.A.; Moore, C.L.; Cheung, K.H.; Brandt, C. Predicting urinary tract infections in the emergency department with machine learning. PLoS ONE 2018, 13, e0194085. [Google Scholar] [CrossRef]
- da Silva, D.A.; Ten Caten, C.S.; Dos Santos, R.P.; Fogliatto, F.S.; Hsuan, J. Predicting the occurrence of surgical site infections using text mining and machine learning. PLoS ONE 2019, 14, e0226272. [Google Scholar] [CrossRef] [Green Version]
- Montella, E.; Alfano, R.; Sacco, A.; Bernardo, C.; Ribera, I.; Triassi, M.; Maria Ponsiglione, A. Healthcare associated infections in the neonatal intensive care unit of the “Federico II” university hospital: Statistical analysis and study of risk factors. In Proceedings of the 2021 International Symposium on Biomedical Engineering and Computational Biology, Nanchang, China, 13–15 August 2021; pp. 1–4. [Google Scholar]
- Wang, X.; Che, Q.; Ji, X.; Meng, X.; Zhang, L.; Jia, R.; Gao, Y. Correlation between lung infection severity and clinical laboratory indicators in patients with COVID-19: A cross-sectional study based on machine learning. BMC Infect. Dis. 2021, 21, 192. [Google Scholar] [CrossRef]
- Rahman, M.; Paul, K.C.; Hossain, A.; Ali, G.G.M.N.; Rahman, S.; Thill, J.-C. Machine learning on the COVID-19 pandemic, human mobility and air quality: A review. IEEE Access 2021, 9, 72420–72450. [Google Scholar] [CrossRef] [PubMed]
- Aviles-Rivero, A.I.; Sellars, P.; Schönlieb, C.B.; Papadakis, N. GraphXCOVID: Explainable deep graph diffusion pseudo-labelling for identifying COVID-19 on chest X-rays. Pattern Recognit. 2022, 122, 108274. [Google Scholar] [CrossRef]
- La Gatta, V.; Moscato, V.; Postiglione, M.; Sperli, G. An epidemiological neural network exploiting dynamic graph structured data applied to the covid-19 outbreak. IEEE Trans. Big Data 2020, 7, 45–55. [Google Scholar] [CrossRef]
- Loperto, I.; Scala, A.; Alfano, R.; Trunfio, T.A.; Giglio, C.; Rossi, G.; Borrelli, A.; Triassi, M.; Improta, G. Appropriate admission in COVID-19 era: The case study of the COU Neurology and Stroke Unit. In Proceedings of the 2021 International Symposium on Biomedical Engineering and Computational Biology, Nanchang, China, 13–15 August 2021. [Google Scholar]
- Taner, M.T.; Sezen, B.; Antony, J. An overview of Six Sigma applications in healthcare industry. Int. J. Health Care Qual. Assur. 2007, 20, 329–340. [Google Scholar] [CrossRef]
- De Mast, J.; Does, R.J.M.M.; de Koning, H. Lean Six Sigma for Service and Healthcare; Beaumont Quality Publications: Alphen aan den Rijn, The Netherlands, 2006. [Google Scholar]
- Nicolay, C.R.; Purkayastha, S.; Greenhalgh, A.; Benn, J.; Chaturvedi, S.; Phillips, N.; Darzi, A. Systematic review of the application of quality improvement methodologies from the manufacturing industry to surgical healthcare. Br. J. Surg. 2012, 99, 324–335. [Google Scholar] [CrossRef]
- Moscato, V.; Picariello, A.; Sperlí, G. A benchmark of machine learning approaches for credit score prediction. Expert Syst. Appl. 2021, 165, 113986. [Google Scholar] [CrossRef]
- Maseer, Z.K.; Yusof, R.; Bahaman, N.; Mostafa, S.A.; Foozy, C.F.M. Benchmarking of machine learning for anomaly based intrusion detection systems in the CICIDS2017 dataset. IEEE Access 2021, 9, 22351–22370. [Google Scholar] [CrossRef]
- La Gatta, V.; Moscato, V.; Pennone, M.; Postiglione, M.; Sperlí, G. Music Recommendation via Hypergraph Embedding. IEEE Trans. Neural Netw. Learn. Syst. 2022, 1–13. [Google Scholar] [CrossRef]
- Qayyum, A.; Qadir, J.; Bilal, M.; Al-Fuqaha, A. Secure and robust machine learning for healthcare: A survey. IEEE Rev. Biomed. Eng. 2020, 14, 156–180. [Google Scholar] [CrossRef]
- Colella, Y.; De Lauri, C.; Maria Ponsiglione, A.; Giglio, C.; Lombardi, A.; Borrelli, A.; Romano, M. A comparison of different Machine Learning algorithms for predicting the length of hospital stay for pediatric patients. In Proceedings of the 2021 International Symposium on Biomedical Engineering and Computational Biology, Nanchang, China, 13–15 August 2021; pp. 1–4. [Google Scholar]
- Picone, I.; Latessa, I.; Fiorillo, A.; Scala, A.; Angela Trunfio, T.; Triassi, M. Predicting length of stay using regression and Machine Learning models in Intensive Care Unit: A pilot study. In Proceedings of the 2021 11th International Conference on Biomedical Engineering and Technology, Tokyo, Japan, 17–20 March 2021; pp. 52–58. [Google Scholar]
- De Felice, F.; Polimeni, A. Coronavirus disease (COVID-19): A machine learning bibliometric analysis. In Vivo 2020, 34 (Suppl. 3), 1613–1617. [Google Scholar] [CrossRef]
- Profeta, M.; Maria Ponsiglione, A.; Ponsiglione, C.; Ferrucci, G.; Giglio, C.; Borrell, A. Comparison of machine learning algorithms to predict length of hospital stay in patients undergoing heart bypass surgery. In Proceedings of the 2021 International Symposium on Biomedical Engineering and Computational Biology, Nanchang, China, 13–15 August 2021; pp. 1–5. [Google Scholar]
- Kwekha-Rashid, A.S.; Abduljabbar, H.N.; Alhayani, B. Coronavirus disease (COVID-19) cases analysis using machine-learning applications. Appl. Nanosci. 2021, 1–13. [Google Scholar] [CrossRef] [PubMed]
- Zedde, M.; Pezzella, F.R.; Paciaroni, M.; Corea, F.; Reale, N.; Toni, D.; Caso, V. Stroke care in Italy: An overview of strategies to manage acute stroke in COVID-19 time. Eur. Stroke J. 2020, 5, 222–229. [Google Scholar] [CrossRef] [PubMed]
- Wang, J.; Chaudhry, S.A.; Tahsili-Fahadan, P.; Altaweel, L.R.; Bashir, S.; Bahiru, Z.; Qureshi, A.I. The impact of COVID-19 on acute ischemic stroke admissions: Analysis from a community-based tertiary care center. J. Stroke Cerebrovasc. Dis. 2020, 29, 105344. [Google Scholar] [CrossRef] [PubMed]
- Butt, A.A.; Kartha, A.B.; Masoodi, N.A.; Azad, A.M.; Asaad, N.A.; Alhomsi, M.U.; Abou-Samra, A.B. Hospital admission rates, length of stay, and in-hospital mortality for common acute care conditions in COVID-19 vs. pre-COVID-19 era. Public Health 2020, 189, 6–11. [Google Scholar] [CrossRef]
- Studer, B.; Roukens, R.; Happe, S.; Schmidt, S.B.; Knecht, S. COVID-19 Reveals Opportunities for Better Care of Stroke Patients: Direct Transfer to Postacute Rehabilitation, Reduction in Length of Stay, and Treatment Outcomes. Dtsch. Ärzteblatt Int. 2021, 118, 346. [Google Scholar]


| Project Title: Lean Six Sigma to Assess How COVID-19 Has Changed the Complex Operative Unit of the Neurology and Stroke Unit Patients’ Management: A Single Center Study. |
|---|
| Question: The inappropriate prolongation of hospital stays. |
| CTQ: LOS (Length of stay), mode of discharge and DRG relative weight. |
| Target: To realize corrective measures in order to reduce the CTQ. |
| Timeline: Define—January 2018–February 2018 Measure—March 2018–February 2020 Analyze—February 2020–8 March 2020 Improve—8 March 2020–December 2020 Control—31 December 2021 |
| Supplier: Neurological Clinic and Stroke Unit of San Giovanni di Dio e Ruggi d’Aragona University Hospital | Input: Hospital Services | Process: Care Process (Administration Services) | Output: Diagnostic and Therapeutic Information | Customers: Patients at San Giovanni di Dio e Ruggi d’Aragona University Hospital |
| Features | 2018 (N = 1239) | 2019 (N = 1287) | 2020 (N = 1148) | 2021 (N = 896) |
|---|---|---|---|---|
| Gender | ||||
| M | 627 | 655 | 612 | 462 |
| F | 612 | 632 | 536 | 434 |
| Age | ||||
| Age ≤ 50 | 262 | 252 | 256 | 190 |
| 50 < Age ≤ 70 | 478 | 477 | 463 | 344 |
| Age > 70 | 499 | 558 | 429 | 362 |
| Mode of discharge: | ||||
| Deceased | 39 | 60 | 47 | 48 |
| Ordinary at home | 1097 | 1115 | 1002 | 747 |
| Protected in non-hospital facilities | 1 | - | 1 | 2 |
| Home hospitalization | - | - | - | - |
| Voluntary | 56 | 44 | 33 | 22 |
| Transferred to another hospital | 6 | 7 | 21 | 20 |
| Transferred to another regime in the same institution | 10 | 12 | 14 | 21 |
| Transferred to rehabilitation institute | 24 | 48 | 28 | 32 |
| Protected with Integrated Home Assistance activation | 6 | 1 | 2 | 4 |
| DRG relative weight | ||||
| Mean | 1.10 | 1.20 | 1.27 | 1.44 |
| Number of hospital admissions * | ||||
| Mean | 5.38 | 4.28 | 3.80 | 4.42 |
| Length of stay, LOS ** | ||||
| Mean | 10.53 | 10.83 | 10.67 | 11.18 |
| New Proposals for the Management of the COU of the Neurology and Stroke Unit during the COVID-19 Emergency | |
|---|---|
| Improve education of health professionals and the public during the pandemic |
|
| Set up telestroke networks |
|
| Reorganize stroke pathways with a “protected stroke code” |
|
| Facilitating new stroke treatment options | |
| Exp(B) | 95% C.I. for EXP(B) | p-Value | ||
|---|---|---|---|---|
| Lower | Upper | |||
| Gender, Male | 1.081 | 0.929 | 1.256 | 0.314 |
| Age | 0.999 | 0.995 | 1.004 | 0.773 |
| DRG relative weight | 1.437 | 1.323 | 1.562 | 0.000 |
| Length of stay (LOS) | 0.985 | 0.975 | 0.996 | 0.006 |
| Mode of discharge | ||||
| Deceased | 0.879 | 0.264 | 2.923 | 0.833 |
| Ordinary at home | 0.714 | 0.222 | 2.294 | 0.572 |
| Protected in non-hospital facilities | 4.913 | 0.371 | 64.994 | 0.227 |
| Home hospitalization | 0.588 | 0.174 | 1.986 | 0.393 |
| Voluntary | 3.004 | 0.800 | 11.281 | 0.103 |
| Transferred to another hospital | 9.290 | 1.440 | 59.931 | 0.019 |
| Transferred to another regime in the same institution | 0.740 | 0.219 | 2.498 | 0.628 |
| Exp(B) | 95% C.I. for EXP(B) | p-Value | ||
|---|---|---|---|---|
| Lower | Upper | |||
| Gender, Male | 1.111 | 0.910 | 1.356 | 0.301 |
| Age | 0.992 | 0.986 | 0.998 | 0.011 |
| DRG relative weight | 5.369 | 2.679 | 10.763 | 0.000 |
| Number of DH admissions | 0.978 | 0.961 | 0.997 | 0.020 |
| Group 1 (2018–2019) | Group 2 (2020–2021) | p-Value | |||
|---|---|---|---|---|---|
| Mean ± Dev. Std | Median | Mean ± Dev. Std | Median | ||
| Gender | - | - | - | - | 0.101 |
| Age | 64.03 ± 17.86 | 67.00 | 63.17 ± 17.47 | 66.00 | 0.169 |
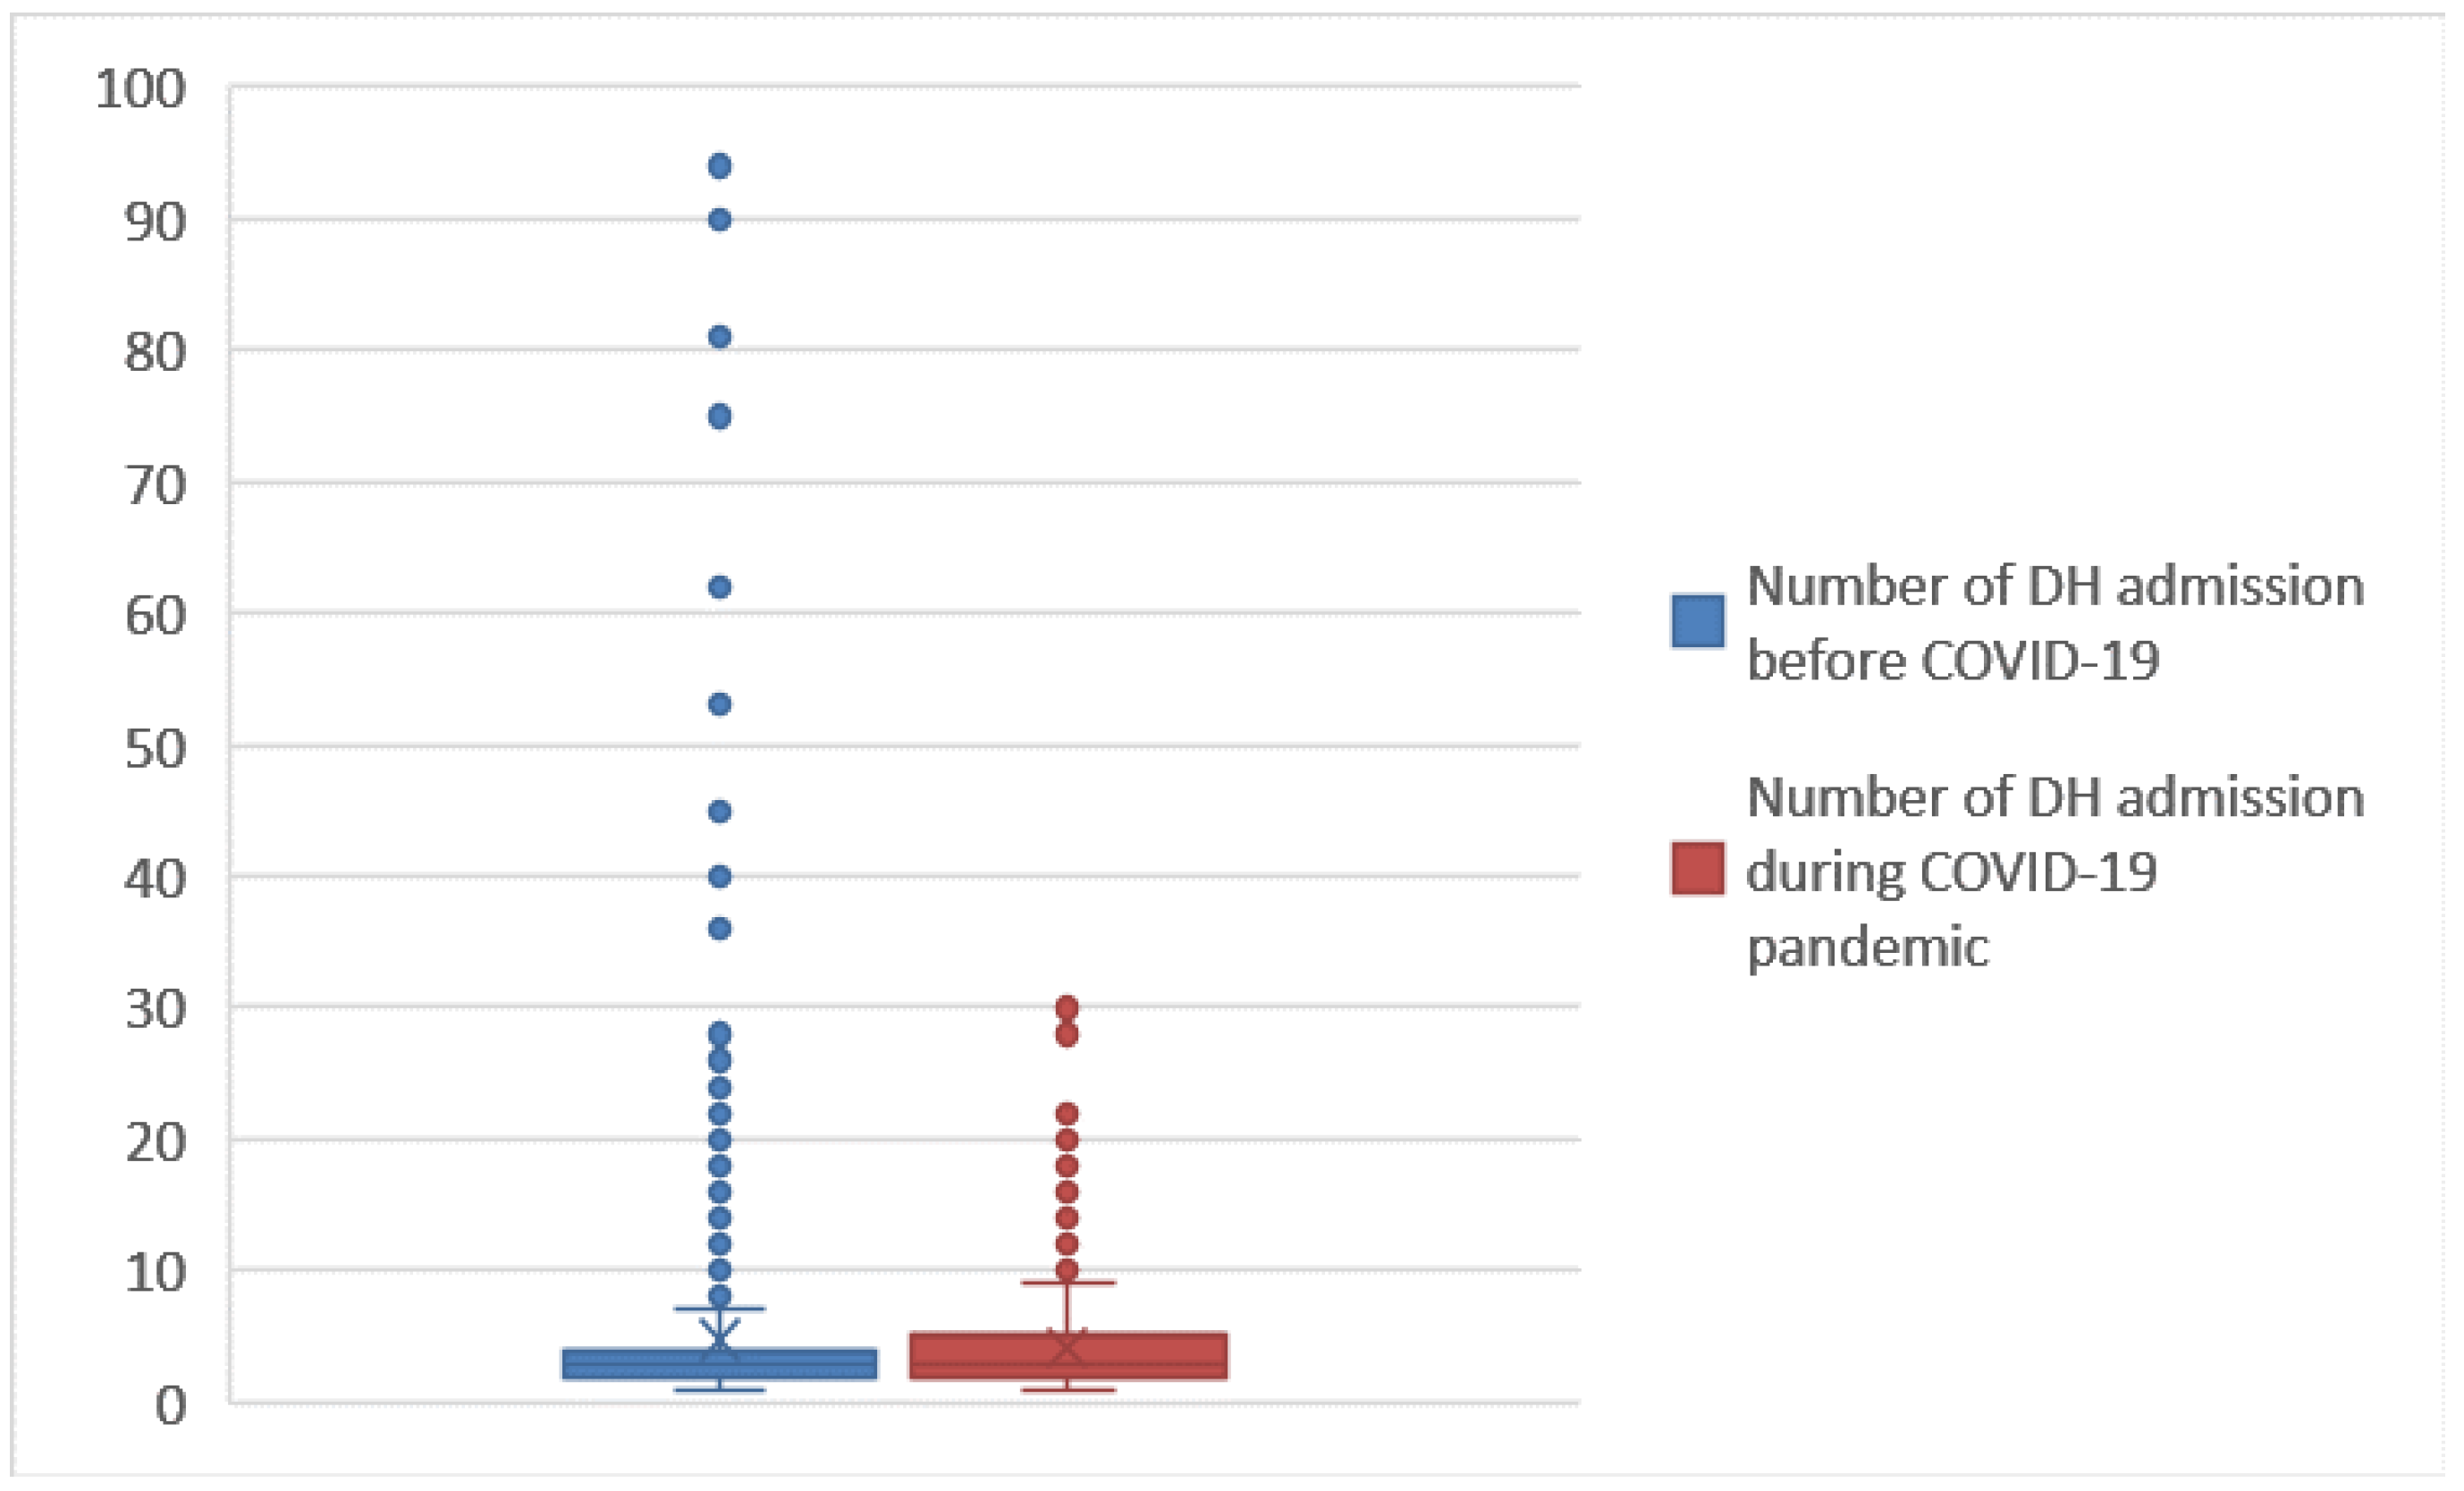
| Number of DH admissions * | 4.72 ± 7.80 | 3.00 | 4.08 ± 3.72 | 3.00 | 0.640 |
| Length of stay (LOS) ** | 10.68 ± 7.98 | 9.00 | 10.89 ± 8.30 | 9.00 | 0.251 |
| DRG relative weight | 1.15 ± 0.72 | 0.913 | 1.35 ± 1.02 | 0.910 | 0.000 |
| Mode of discharge | - | - | - | - | 0.000 |
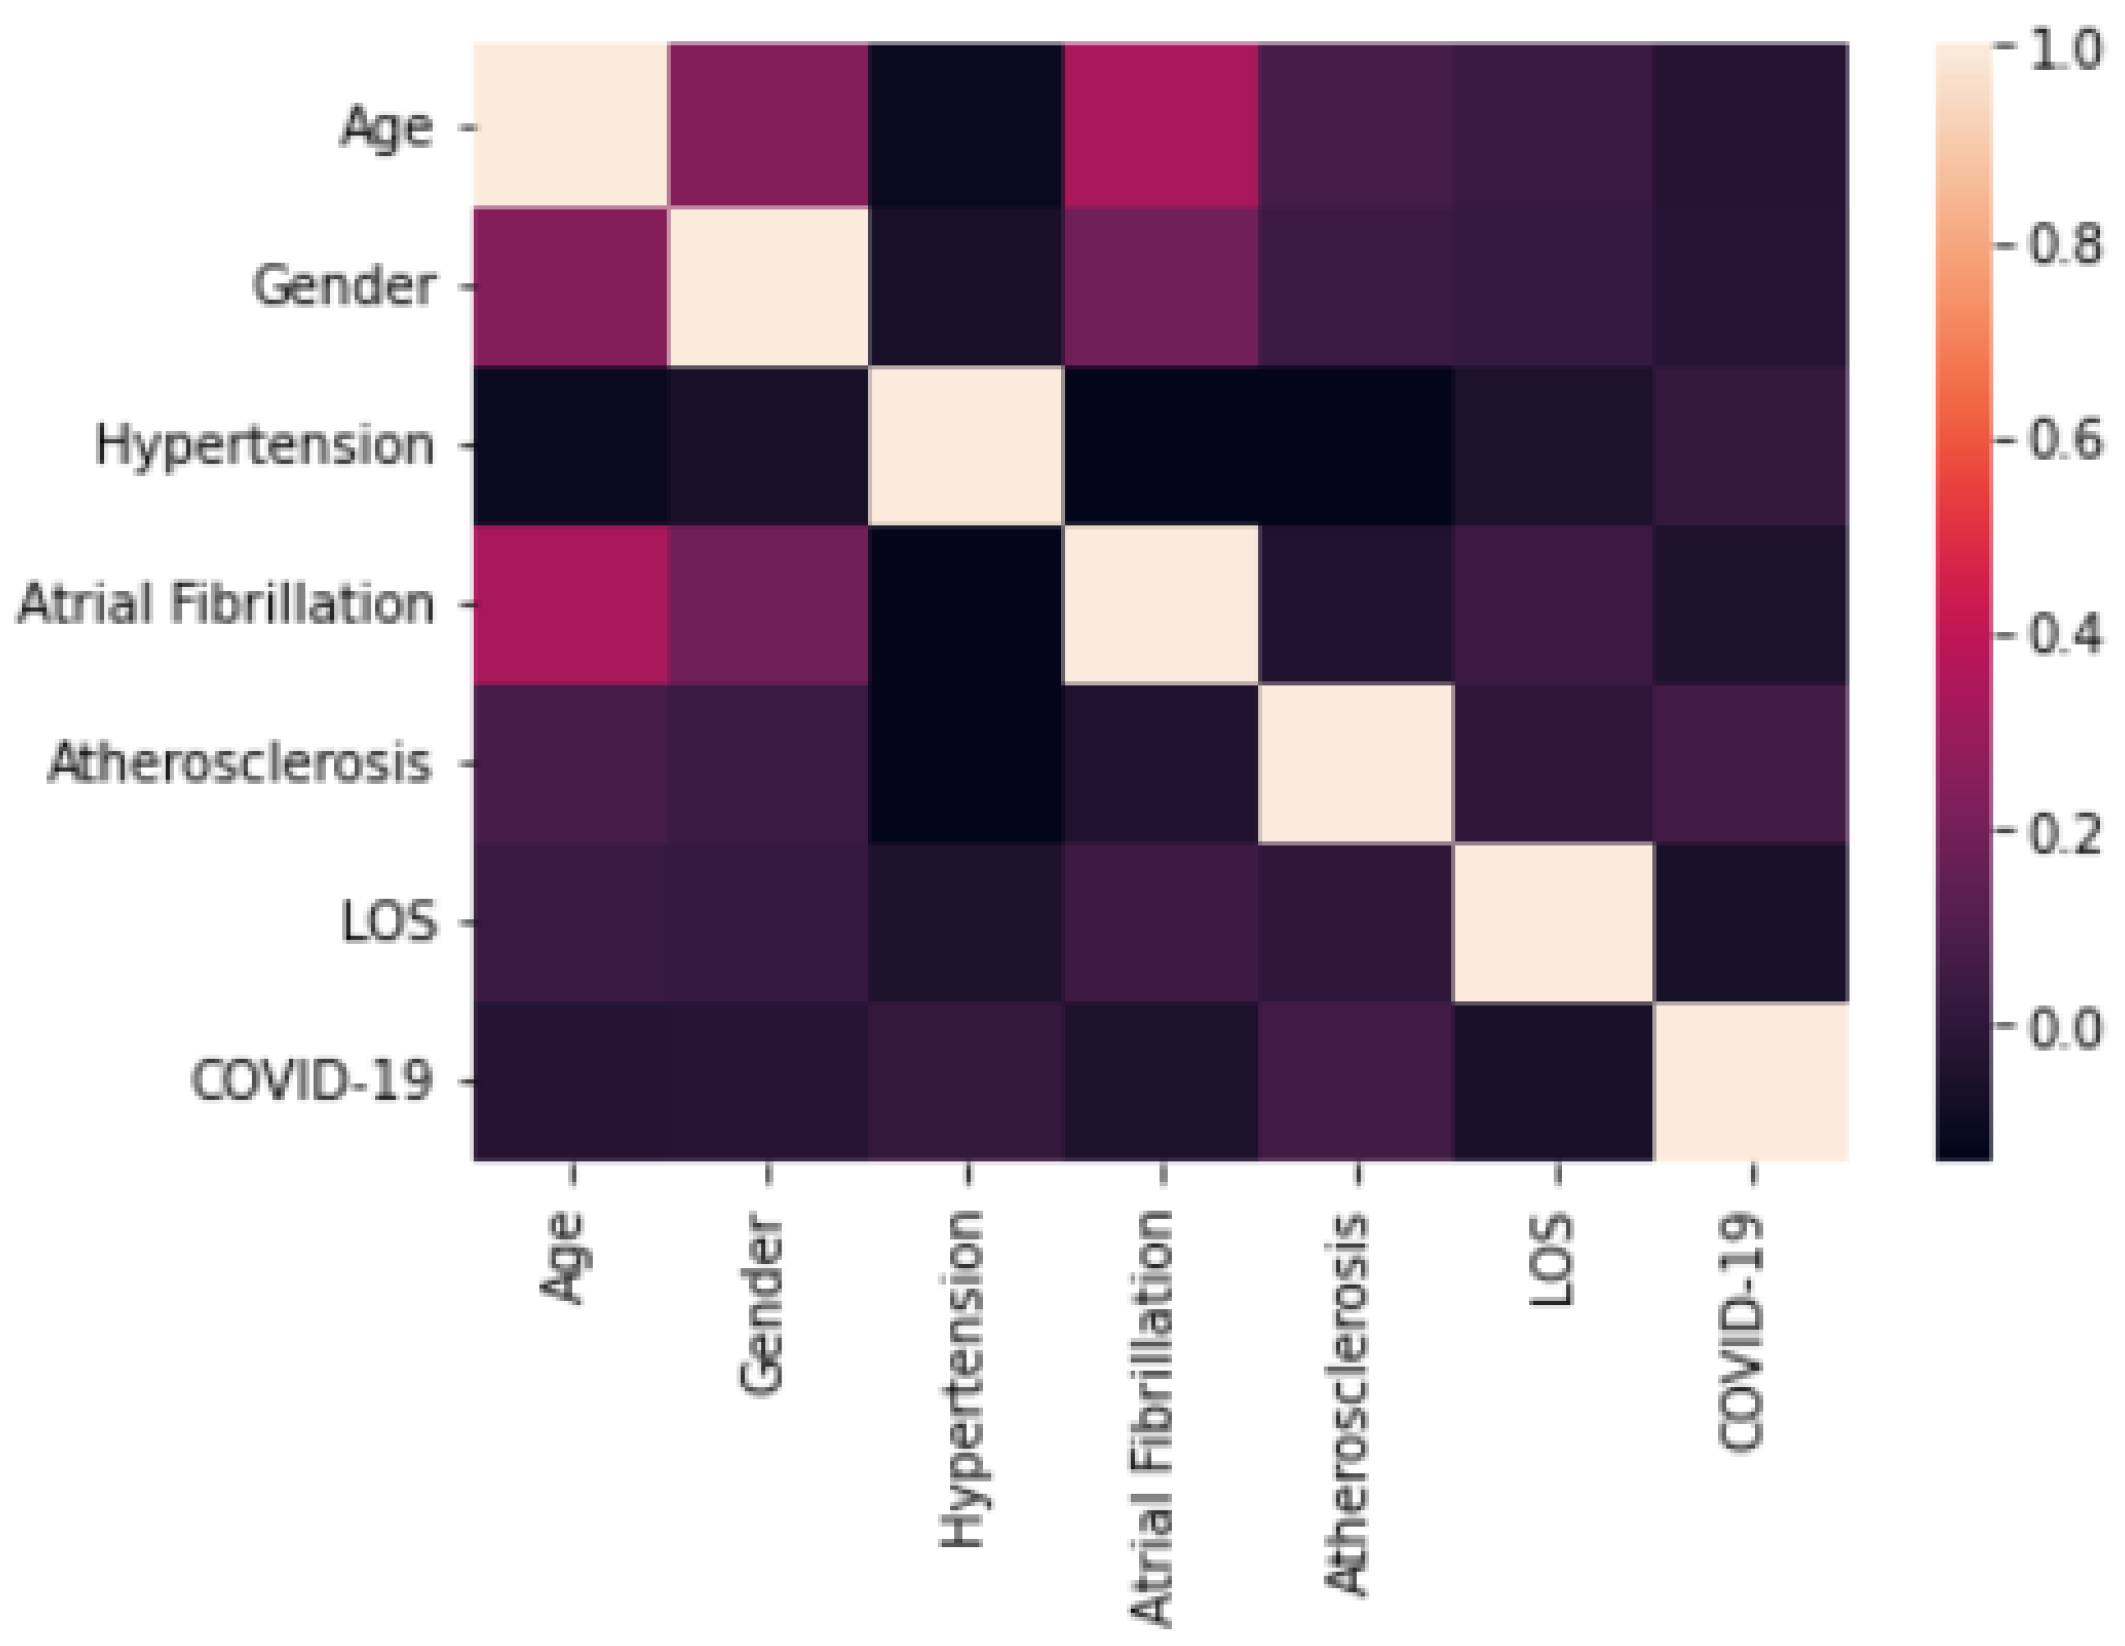
| Class 1 (2019) N = 650 | Class 2 (2020) N = 338 | p-Value | |
|---|---|---|---|
| Age | |||
| Mean | 74.09 | 73.22 | 0.133 |
| Gender | |||
| Male | 0.343 | ||
| Male | 339 | 187 | |
| Female | 311 | 151 | |
| Hypertension | |||
| No | 518 | 264 | 0.560 |
| Yes | 132 | 74 | |
| Atrial Fibrillation | |||
| No | 499 | 276 | 0.076 |
| Yes | 151 | 62 | |
| Atherosclerosis | |||
| No | 566 | 279 | 0.055 |
| Yes | 84 | 59 | |
| LOS | |||
| Mean | 11.19 | 10.27 | 0.037 |
| OR | 95% CI | p-Value | |
|---|---|---|---|
| Gender, Male | 0.998 | 0.987–1.009 | 0.673 |
| Age | 1.085 | 0.824–1.428 | 0.563 |
| Hypertension (No) | 0.925 | 0.665–1.288 | 0.645 |
| Atrial Fibrillation (No) | 1.242 | 0.870–1.774 | 0.232 |
| Atherosclerosis | 0.691 | 0.477–1.000 | 0.050 |
| Length of stay (LOS) | 0.976 | 0.955–0.999 | 0.037 |
| Performance Metrics | Class | DT | GBT | RF | SVM | LR |
|---|---|---|---|---|---|---|
| Accuracy | Overall | 0.72 | 0.64 | 0.72 | 0.80 | 0.52 |
| Precision | 1 | 0.61 | 0.65 | 0.81 | 0.82 | 0.52 |
| 2 | 0.84 | 0.63 | 0.67 | 0.78 | 0.52 | |
| Recall | 1 | 0.79 | 0.59 | 0.57 | 0.76 | 0.50 |
| 2 | 0.68 | 0.68 | 0.87 | 0.84 | 0.55 | |
| F-measure | 1 | 0.69 | 0.62 | 0.67 | 0.79 | 0.51 |
| 2 | 0.75 | 0.65 | 0.76 | 0.81 | 0.53 |
| Class | 1 | 2 |
|---|---|---|
| 1 | 99 | 31 |
| 2 | 21 | 109 |
| Parameter | Value |
|---|---|
| Kernel | RBF |
| C | 1 |
| Gamma | 1 |
Publisher’s Note: MDPI stays neutral with regard to jurisdictional claims in published maps and institutional affiliations. |
© 2022 by the authors. Licensee MDPI, Basel, Switzerland. This article is an open access article distributed under the terms and conditions of the Creative Commons Attribution (CC BY) license (https://creativecommons.org/licenses/by/4.0/).
Share and Cite
Improta, G.; Borrelli, A.; Triassi, M. Machine Learning and Lean Six Sigma to Assess How COVID-19 Has Changed the Patient Management of the Complex Operative Unit of Neurology and Stroke Unit: A Single Center Study. Int. J. Environ. Res. Public Health 2022, 19, 5215. https://doi.org/10.3390/ijerph19095215
Improta G, Borrelli A, Triassi M. Machine Learning and Lean Six Sigma to Assess How COVID-19 Has Changed the Patient Management of the Complex Operative Unit of Neurology and Stroke Unit: A Single Center Study. International Journal of Environmental Research and Public Health. 2022; 19(9):5215. https://doi.org/10.3390/ijerph19095215
Chicago/Turabian StyleImprota, Giovanni, Anna Borrelli, and Maria Triassi. 2022. "Machine Learning and Lean Six Sigma to Assess How COVID-19 Has Changed the Patient Management of the Complex Operative Unit of Neurology and Stroke Unit: A Single Center Study" International Journal of Environmental Research and Public Health 19, no. 9: 5215. https://doi.org/10.3390/ijerph19095215