
Regression Models to Study the Total LOS Related to Valvuloplasty

 , , ,
, , ,
Abstract
:1. Introduction
2. Method
- Gender (male/female);
- Age;
- Comorbidities;
- Diagnostic-related group (DRG);
- Procedures;
- Date of admission, discharge, and procedure.
- Gender (male/female);
- Age;
- Acute myocardial infarction (AMI) (yes/no);
- Congestive heart failure (CHF) (yes/no);
- Cerebrovascular disease (CeVD) (yes/no);
- Peripheral vascular disease (PVD) (yes/no);
- Chronic obstructive pulmonary disease (COPD) (yes/no);
- Diabetes (yes/no);
- Renal disease (RD) (yes/no).
- Two procedures;
- Three procedures;
- Four procedures.
Regression Algorithms
- Linear relationship between the independent and dependent variable;
- Absence of collinearity;
- Independence of the residuals;
- Constant variance of the residuals;
- Normal distribution of residuals;
- Absence of outliers.
3. Results
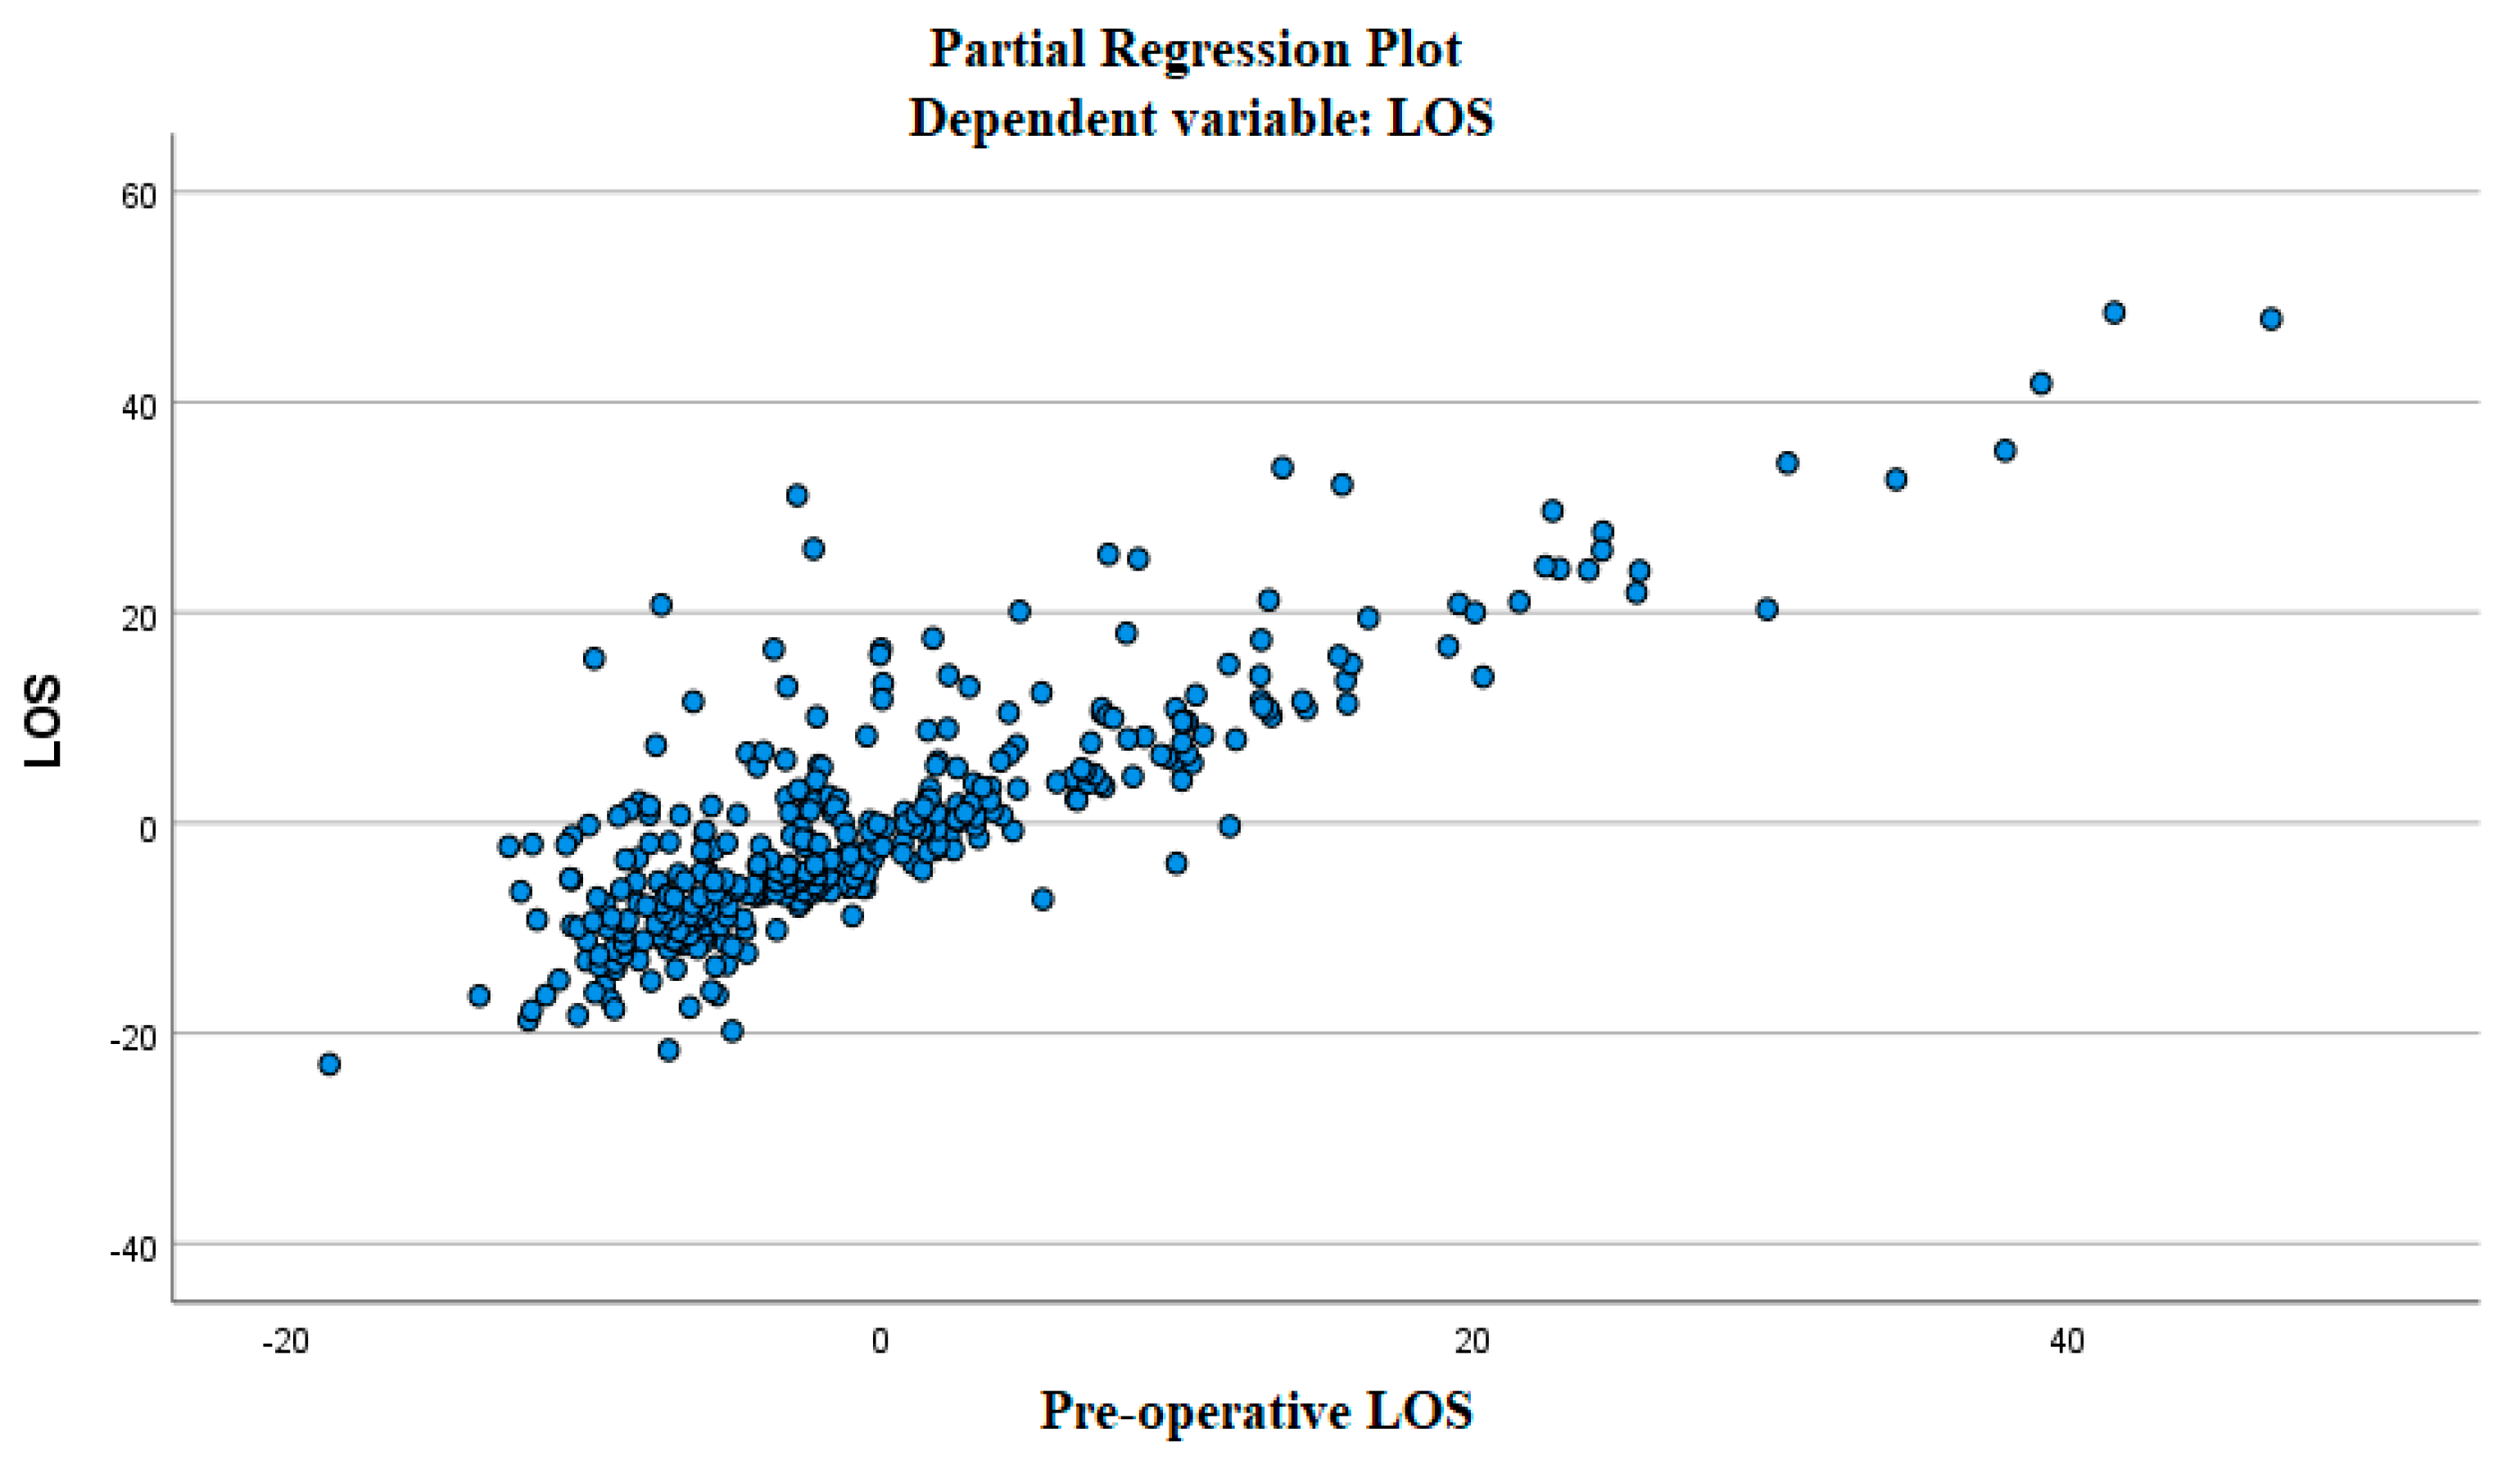
3.1. The Linear Relationship between the Independent and Dependent Variable
3.2. Absence of Multicollinearity
3.3. The Independence of the Residuals
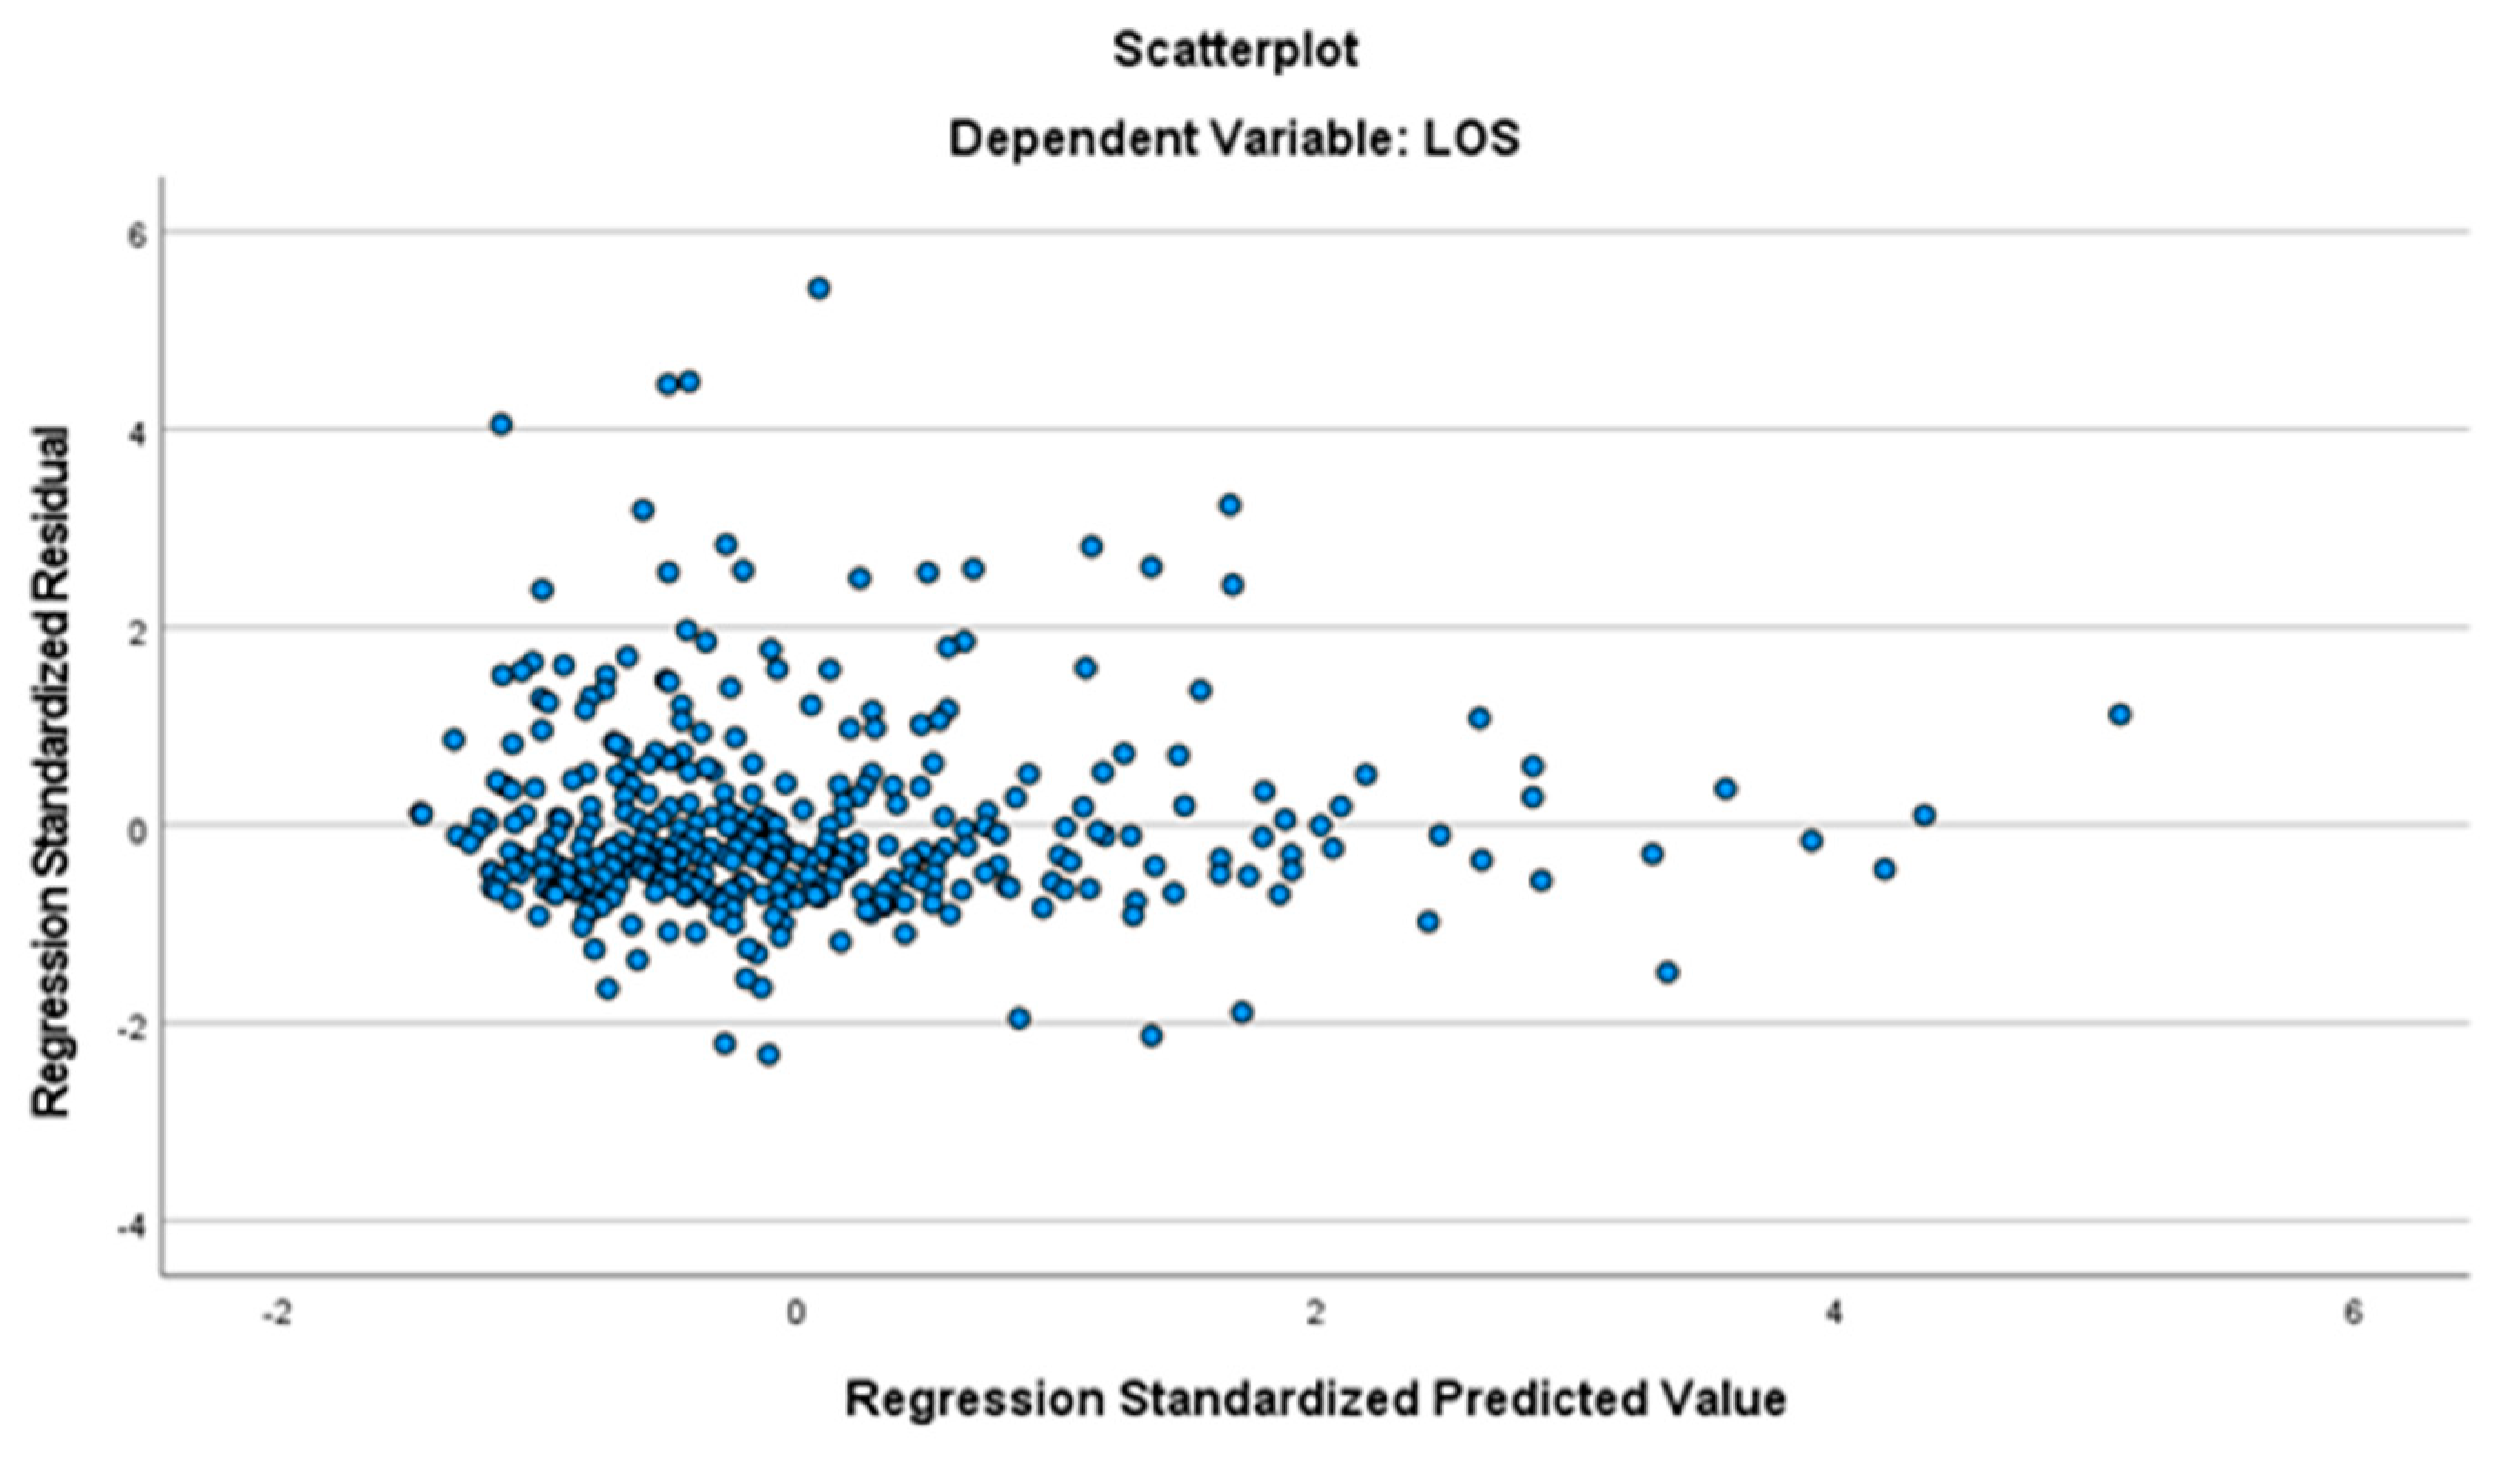
3.4. The Residuals Have Constant Variance
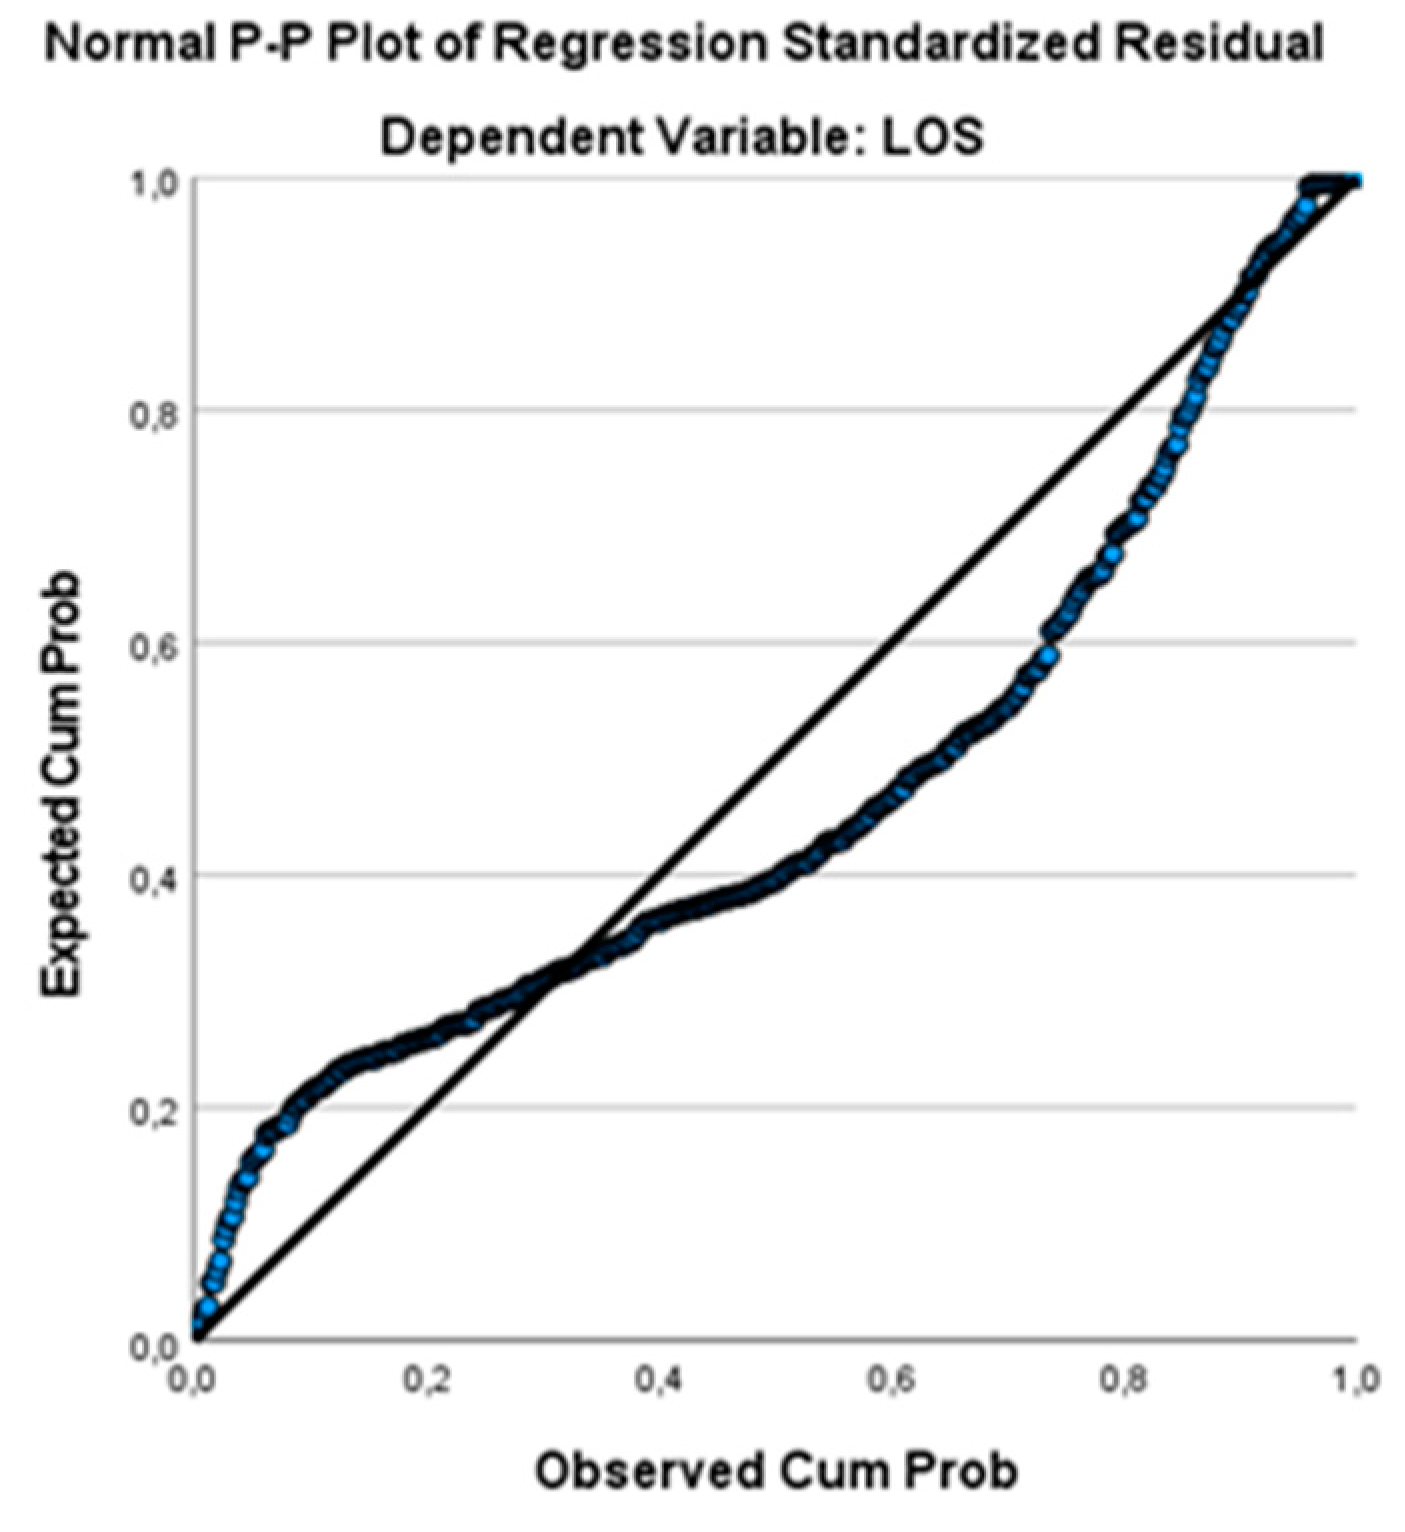
3.5. The Residuals Are Normally Distributed
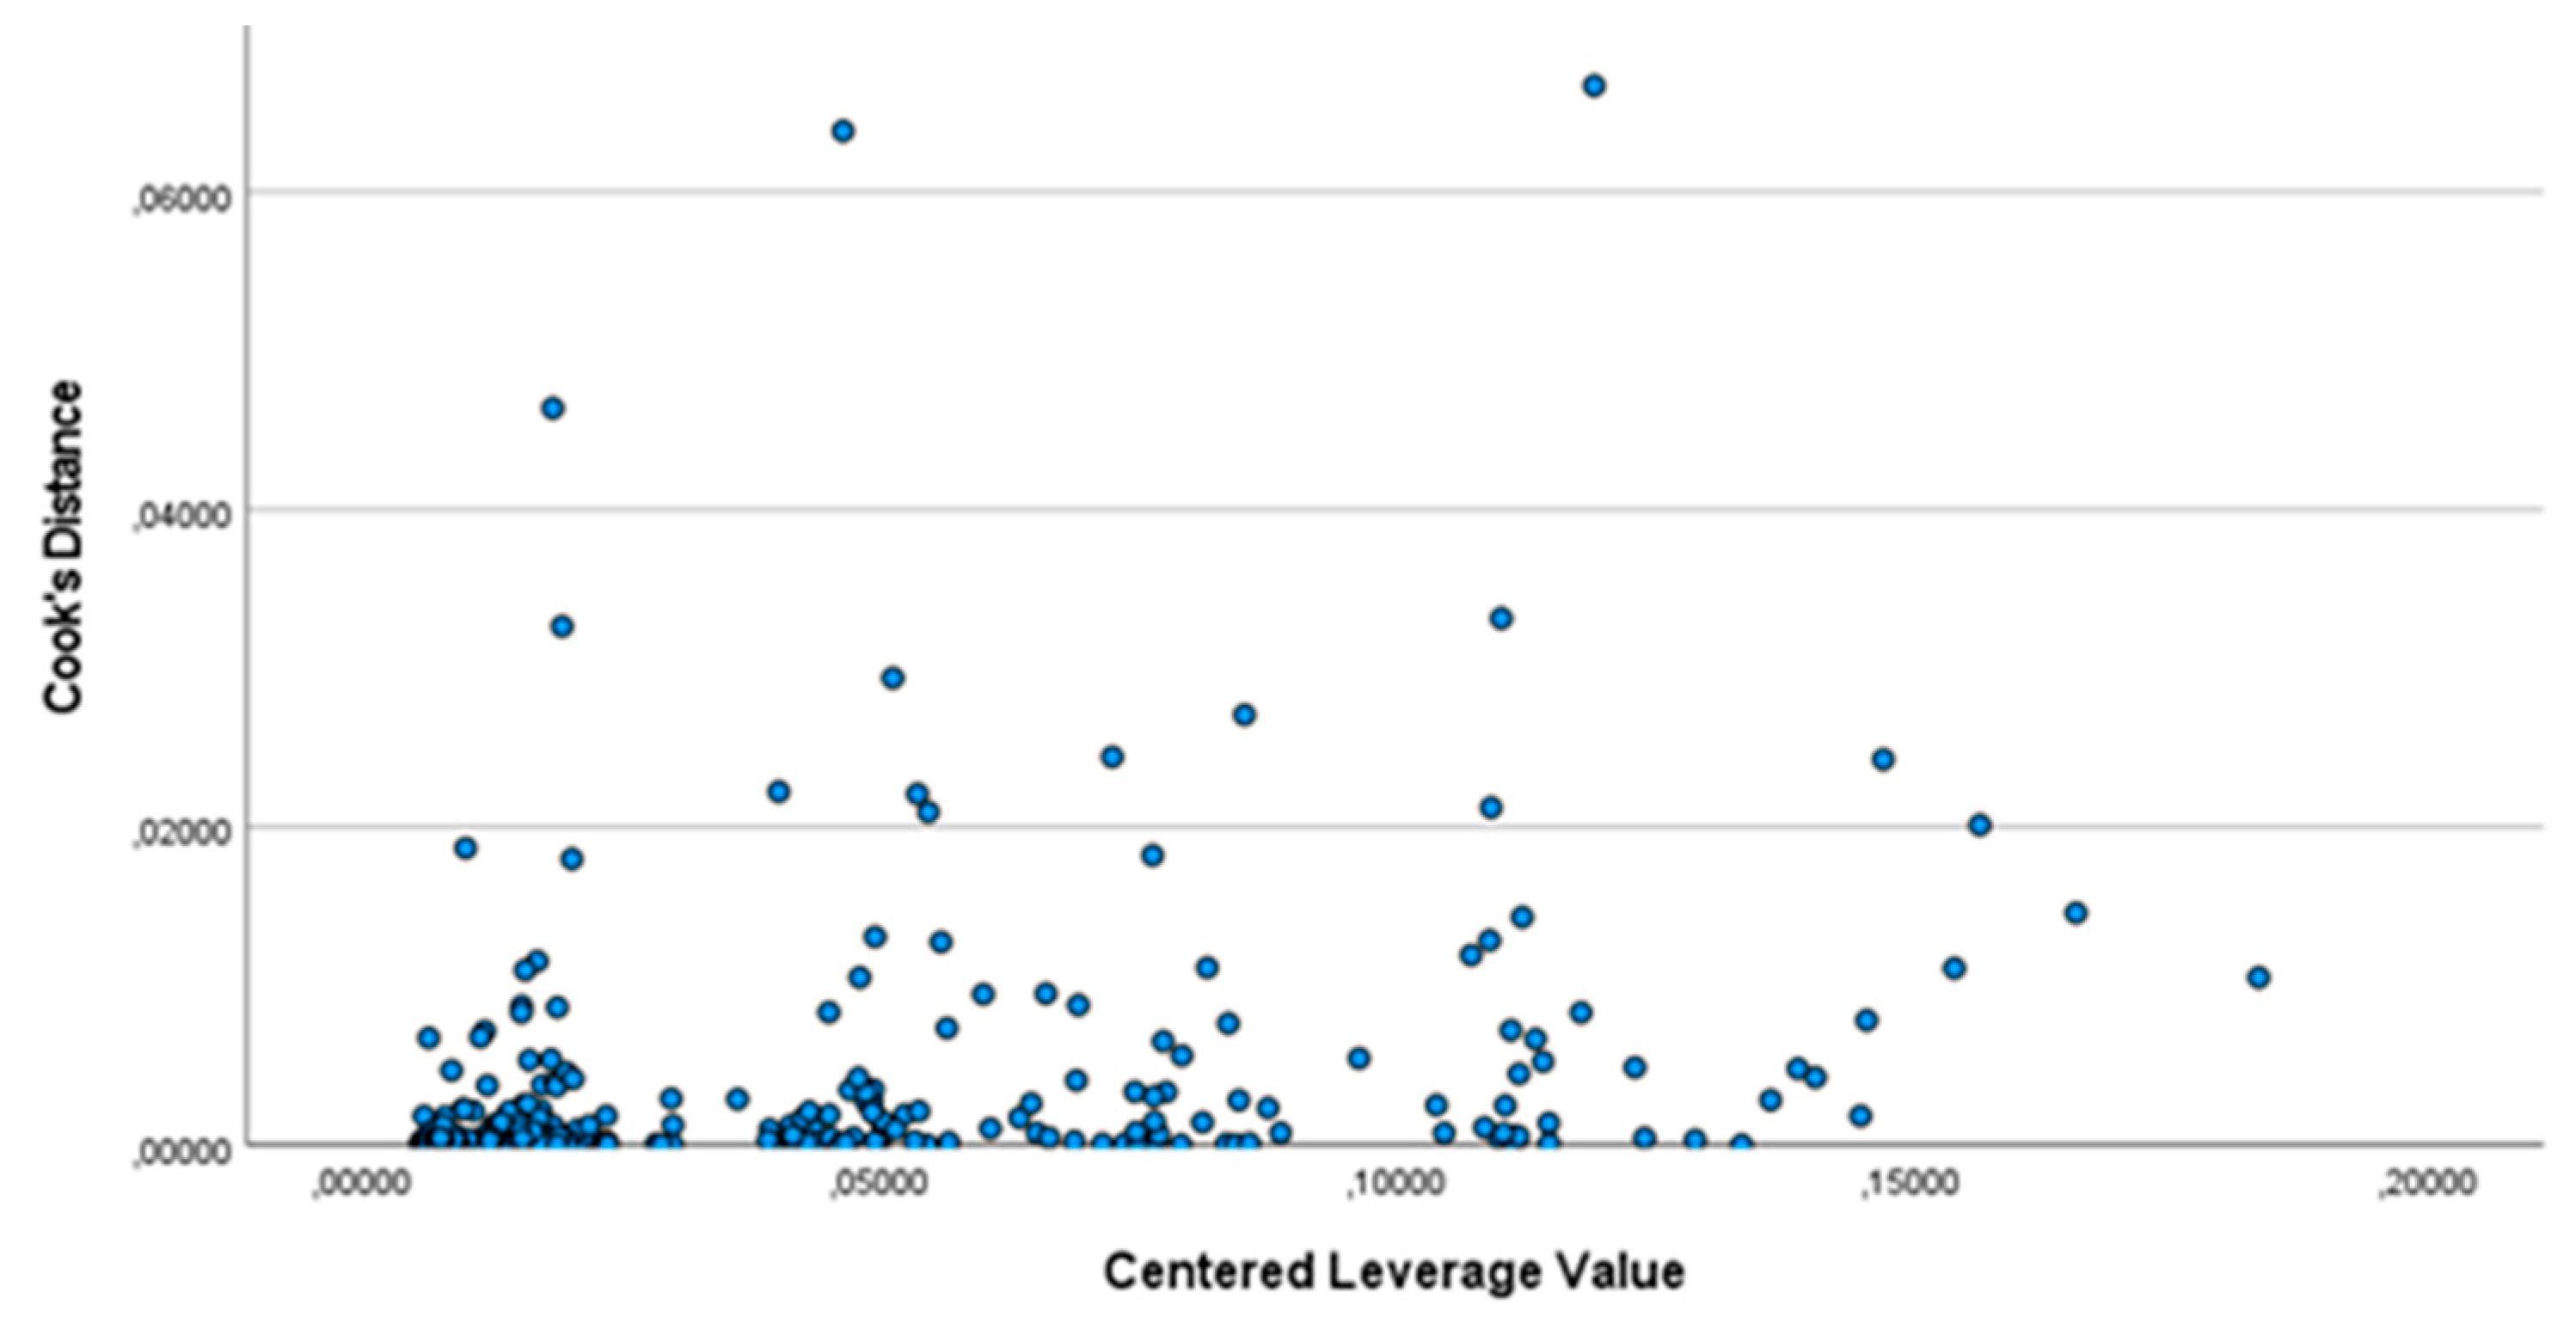
3.6. Presence of Outliers
4. Discussion
5. Conclusions
Author Contributions
Funding
Informed Consent Statement
Data Availability Statement
Conflicts of Interest
List of Abbreviations
| LOS | Length of stay |
| MLR | Multiple linear regression |
| AMI | Acute myocardial infarction (AMI) |
| CHF | Congestive heart failure |
| CeVD | Cerebrovascular disease |
| PVD | Peripheral vascular disease |
| COPD | Chronic obstructive pulmonary disease |
| RD | Renal disease |
| RF | Random forest |
| SVM | Support vector machine |
| NNN | Narrow neural network |
| GPR | Gaussian process regression |
References
- Scala, A.; Loperto, I.; Rossano, L.; Cesarelli, G.; Ferrara, A.; Borrelli, A. Multiple Regression and Machine Learning to investigate factors influencing the length of hospital stay after valvuloplasty. In Proceedings of the 5th International Conference on Medical and Health Informatics, Kyoto, Japan, 14–16 May 2021. [Google Scholar] [CrossRef]
- Hara, J.H. Valvular Heart Disease. Prim. Care Clin. Off. Pract. 2000, 27, 725–740. [Google Scholar] [CrossRef]
- Iung, B.; Vahanian, A. Epidemiology of valvular heart disease in the adult. Nat. Rev. Cardiol. 2011, 8, 162–172. [Google Scholar] [CrossRef] [PubMed]
- Markovic, D.; Jankovic, R.; Kovacevic-Kostic, N.; Velinovic, M.; Vranes, M.; Ivanovic, B. The preoperative assessment of patients with valvular heart disease as a comorbidity. Acta Chir. Iugosl. 2011, 58, 31–37. [Google Scholar] [CrossRef] [PubMed]
- Iung, B.; Baron, G.; Butchart, E.G.; Delahaye, F.; Gohlke-Bärwolf, C.; Levang, O.W.; Tornos, P.; Vanoverschelde, J.-L.; Vermeer, F.; Boersma, E.; et al. A prospective survey of patients with valvular heart disease in Europe: The Euro Heart Survey on Valvular Heart Disease. Eur. Heart J. 2003, 24, 1231–1243. [Google Scholar] [CrossRef] [Green Version]
- Kodali, S.K.; Velagapudi, P.; Hahn, R.T.; Abbott, D.; Leon, M.B. Valvular Heart Disease in Patients ≥80 Years of Age. J. Am. Coll. Cardiol. 2018, 71, 2058–2072. [Google Scholar] [CrossRef]
- Steiner, J.M.; Cooper, S.; Kirkpatrick, J.N. Palliative care in end-stage valvular heart disease. Heart 2017, 103, 1233–1237. [Google Scholar] [CrossRef] [Green Version]
- Vahanian, A.; Beyersdorf, F.; Praz, F.; Milojevic, M.; Baldus, S.; Bauersachs, J.; Capodanno, D.; Conradi, L.; De Bonis, M.; De Paulis, R.; et al. 2021 ESC/EACTS Guidelines for the management of valvular heart disease: Developed by the Task Force for the management of valvular heart disease of the European Society of Cardiology (ESC) and the European Association for Cardio-Thoracic Surgery (EACTS). Eur. Heart J. 2022, 43, 561–632. [Google Scholar] [CrossRef]
- Hoevelmann, J.; Mahfoud, F.; Lauder, L.; Scheller, B.; Böhm, M.; Ewen, S. Valvular heart disease in patients with chronic kidney disease. Herz 2021, 46, 228–233. [Google Scholar] [CrossRef]
- 2006 Writing Committee Members; Bonow, R.O.; Carabello, B.A.; Chatterjee, K.; De Leon, A.C.; Faxon, D.P.; Freed, M.D.; Gaasch, W.H.; Lytle, B.W.; Nishimura, R.A.; et al. 2008 Focused Update Incorporated Into the ACC/AHA 2006 Guidelines for the Management of Patients with Valvular Heart Disease. Circulation 2008, 118, e523–e661. [Google Scholar] [CrossRef] [Green Version]
- Bradbury, R.C.; Golec, J.H.; Steen, P.M. Linking Health Outcomes and Resource Efficiency for Hospitalized Patients: Do Physicians with Low Mortality and Morbidity Rates Also Have Low Resource Expenditures? Health Serv. Manag. Res. 2000, 13, 57–68. [Google Scholar] [CrossRef]
- Brownell, M.D.; Roos, N.P. Variation in length of stay as a measure of efficiency in Manitoba hospitals. Can. Med. Assoc. J. 1995, 152, 675–682. [Google Scholar]
- Scala, A.; Ponsiglione, A.; Loperto, I.; Della Vecchia, A.; Borrelli, A.; Russo, G.; Triassi, M.; Improta, G. Lean Six Sigma Approach for Reducing Length of Hospital Stay for Patients with Femur Fracture in a University Hospital. Int. J. Environ. Res. Public Health 2021, 18, 2843. [Google Scholar] [CrossRef] [PubMed]
- Improta, G.; Luciano, M.A.; Vecchione, D.; Cesarelli, G.; Rossano, L.; Santalucia, I.; Triassi, M. Management of the Diabetic Patient in the Diagnostic Care Pathway. IFMBE Proc. 2020, 784–792. [Google Scholar] [CrossRef]
- Sorrentino, A.; Scala, A.; Fiorillo, A.; Latessa, I.; Abbate, V.; Orabona, G.D. Six Sigma Approach for a First Evaluation of a Pharmacological Therapy in Tongue Cancer. IFMBE Proc. 2020, 1028–1037. [Google Scholar] [CrossRef]
- Latessa, I.; Fiorillo, A.; Picone, I.; Balato, G.; Trunfio, T.A.; Scala, A.; Triassi, M. Implementing fast track surgery in hip and knee arthroplasty using the lean Six Sigma methodology. TQM J. 2021, 33, 131–147. [Google Scholar] [CrossRef]
- Trunfio, T.A.; Scala, A.; Borrelli, A.; Sparano, M.; Triassi, M.; Improta, G. Application of the Lean Six Sigma approach to the study of the LOS of patients who undergo laparoscopic cholecystectomy at the San Giovanni di Dio and Ruggi d’Aragona University Hospital. In Proceedings of the 2021 5th International Conference on Medical and Health Informatics, Kyoto, Japan, 14–16 May 2021. [Google Scholar] [CrossRef]
- Cesarelli, G.; Montella, E.; Scala, A.; Raiola, E.; Triassi, M.; Improta, G. DMAIC Approach for the Reduction of Healthcare-Associated Infections in the Neonatal Intensive Care Unit of the University Hospital of Naples ‘Federico II’. In Proceedings of the 8th European Medical and Biological Engineering Conference, EMBEC 2020, Portorož, Slovenia, 29 November–3 December 2020; Volume 80. [Google Scholar] [CrossRef]
- Ponsiglione, A.M.; Ricciardi, C.; Scala, A.; Fiorillo, A.; Sorrentino, A.; Triassi, M.; Orabona, G.D.; Improta, G. Application of DMAIC Cycle and Modeling as Tools for Health Technology Assessment in a University Hospital. J. Health Eng. 2021, 2021, 1–11. [Google Scholar] [CrossRef]
- Improta, G.; Perrone, A.; Russo, M.A.; Triassi, M. Health technology assessment (HTA) of optoelectronic biosensors for oncology by analytic hierarchy process (AHP) and Likert scale. BMC Med. Res. Methodol. 2019, 19, 1–14. [Google Scholar] [CrossRef]
- Improta, G.; Simone, T.; Bracale, M. HTA (Health Technology Assessment): A Means to Reach Governance Goals and to Guide Health Politics on the Topic of Clinical Risk Management. IFMBE Proc. 2009, 166–169. [Google Scholar] [CrossRef]
- Improta, G.; Converso, G.; Murino, T.; Gallob, M.; Perrone, A.; Romano, M. Analytic Hierarchy Process (AHP) in Dynamic Configuration as a Tool for Health Technology Assessment (HTA): The Case of Biosensing Optoelectronics in Oncology. Int. J. Inf. Technol. Decis. Mak. 2019, 18, 1533–1550. [Google Scholar] [CrossRef] [Green Version]
- Improta, G.; Triassi, M.; Guizzi, G.; Santillo, L.C.; Revetria, R.; Catania, A.; Cassettari, L. An Innovative Contribution to Health Technology Assessment. In Modern Advances in Intelligent Systems and Tools; Springer: Berlin/Heidelberg, Germany, 2012; Volume 431, pp. 127–131. [Google Scholar] [CrossRef]
- Scala, A.; Loperto, I.; Carrano, R.; Federico, S.; Triassi, M.; Improta, G. Assessment of proteinuria level in nephrology patients using a machine learning approach. In Proceedings of the 2021 5th International Conference on Medical and Health Informatics, Kyoto, Japan, 14–16 May 2021. [Google Scholar] [CrossRef]
- Profeta, M.; Ponsiglione, A.M.; Ponsiglione, C.; Ferrucci, G.; Giglio, C.; Borrell, A. Comparison of machine learning algorithms to predict length of hospital stay in patients undergoing heart bypass surgery. In Proceedings of the 2021 International Symposium on Biomedical Engineering and Computational Biology (BECB 2021), Beijing, China, 13–15 August 2021; pp. 1–5. [Google Scholar] [CrossRef]
- Scala, A.; Trunfio, T.A.; Lombardi, A.; Giglio, C.; Borrelli, A.; Triassi, M. A comparison of different Machine Learning algorithms for predicting the length of hospital stay for patients undergoing cataract surgery. In Proceedings of the 2021 International Symposium on Biomedical Engineering and Computational Biology (BECB 2021), Beijing, China, 13–15 August 2021. [Google Scholar] [CrossRef]
- Scala, A.; Trunfio, T.A.; Borrelli, A.; Ferrucci, G.; Triassi, M.; Improta, G. Modelling the hospital length of stay for patients undergoing laparoscopic cholecystectomy through a multiple regression model. In Proceedings of the 2021 5th International Conference on Medical and Health Informatics, Kyoto, Japan, 14–16 May 2021. [Google Scholar] [CrossRef]
- Improta, G.; Scala, A.; Trunfio, T.A.; Guizzi, G. Application of Supply Chain Management at Drugs Flow in an Italian Hospital District. J. Physics Conf. Ser. 2021, 1828, 012081. [Google Scholar] [CrossRef]
- Cesarelli, G.; Scala, A.; Vecchione, D.; Ponsiglione, A.; Guizzi, G. An Innovative Business Model for a Multi-echelon Supply Chain Inventory Management Pattern. J. Physics Conf. Ser. 2021, 1828, 012082. [Google Scholar] [CrossRef]
- Tesfahun, E.; Kumie, A.; Beyene, A. Developing models for the prediction of hospital healthcare waste generation rate. Waste Manag. Res. J. A Sustain. Circ. Econ. 2015, 34, 75–80. [Google Scholar] [CrossRef] [PubMed]
- Chatterjee, K.; Chatterjee, K.; Kumar, A.; Shankar, S. Healthcare impact of COVID-19 epidemic in India: A stochastic mathematical model. Med. J. Armed Forces India 2020, 76, 147–155. [Google Scholar] [CrossRef] [PubMed]
- Liu, Y.-H.; Su, H.-H.; Tsai, Y.-W.; Hou, Y.-Y.; Chang, K.-P.; Chi, C.-C.; Lin, M.-Y.; Wu, P.-H. Initial Factors Influencing Duration of Hospital Stay in Adult Patients with Peritonsillar Abscess. Clin. Exp. Otorhinolaryngol. 2017, 10, 115–120. [Google Scholar] [CrossRef] [Green Version]
- Kadam, A.; Wagh, V.M.; Muley, A.A.; Umrikar, B.N.; Sankhua, R.N. Prediction of water quality index using artificial neural network and multiple linear regression modelling approach in Shivganga River basin, India. Model. Earth Syst. Environ. 2019, 5, 951–962. [Google Scholar] [CrossRef]
- IBM Corp. IBM SPSS Statistics for Windows; Version 27.0; IBM Corp: Armonk, NY, USA, 2020. [Google Scholar]


| Features | Dataset (N = 379) |
|---|---|
| Gender | |
| M | 199 |
| F | 180 |
| AMI | |
| Yes | 13 |
| No | 366 |
| CHF | |
| Yes | 118 |
| No | 261 |
| CeVD | |
| Yes | 16 |
| No | 363 |
| PVD | |
| Yes | 11 |
| No | 368 |
| COPD | |
| Yes | 27 |
| No | 352 |
| Diabetes | |
| Yes | 17 |
| No | 362 |
| RD | |
| Yes | 27 |
| No | 352 |
| 2 Procedures | |
| Yes | 135 |
| No | 244 |
| 3 Procedures | |
| Yes | 33 |
| No | 347 |
| 4 Procedures | |
| Yes | 11 |
| No | 370 |
| Pearson Correlation | Variable/Variable | LOS | Age | Gender | Pre-operative LOS | AMI | CHF | PVD | CeVD | COPD | Diabetes | RD | 2 procedures | 3 procedures | 4 procedures |
| LOS | 1.000 | 0.098 | −0.031 | 0.829 | −0.010 | 0.231 | 0.184 | 0.081 | 0.005 | 0.035 | 0.047 | 0.105 | 0.106 | 0.098 | |
| Age | 0.098 | 1.000 | 0.126 | −0.034 | −0.033 | 0.117 | 0.069 | 0.084 | 0.111 | 0.145 | 0.195 | 0.106 | 0.081 | 0.025 | |
| Gender | −0.031 | 0.126 | 1.000 | −0.048 | −0.063 | −0.035 | −0.070 | 0.011 | −0.140 | −0.053 | −0.079 | −0.001 | −0.013 | −0.058 | |
| Pre-operative LOS | 0.829 | −0.034 | −0.048 | 1.000 | 0.026 | 0.143 | 0.117 | 0.064 | −0.002 | 0.043 | 0.005 | 0.081 | 0.048 | 0.084 | |
| AMI | −0.010 | −0.033 | −0.063 | 0.026 | 1.000 | −0.001 | −0.033 | 0.033 | 0.004 | 0.029 | 0.061 | −0.110 | −0.007 | −0.031 | |
| CHF | 0.231 | 0.117 | −0.035 | 0.143 | −0.001 | 1.000 | 0.053 | −0.056 | 0.057 | 0.019 | 0.035 | 0.154 | 0.055 | 0.103 | |
| PVD | 0.184 | 0.069 | −0.070 | 0.117 | −0.033 | 0.053 | 1.000 | 0.042 | −0.048 | −0.037 | 0.074 | 0.101 | 0.170 | −0.028 | |
| CeVD | 0.081 | 0.084 | 0.011 | 0.064 | 0.033 | −0.056 | 0.042 | 1.000 | −0.058 | 0.145 | 0.095 | −0.047 | 0.028 | −0.035 | |
| COPD | 0.005 | 0.111 | −0.140 | −0.002 | 0.004 | 0.057 | −0.048 | −0.058 | 1.000 | −0.010 | 0.003 | −0.013 | 0.096 | 0.018 | |
| Diabetes | 0.035 | 0.145 | −0.053 | 0.043 | 0.029 | 0.019 | −0.037 | 0.145 | −0.010 | 1.000 | 0.039 | 0.052 | 0.069 | 0.203 | |
| RD | 0.047 | 0.195 | −0.079 | 0.005 | 0.061 | 0.035 | 0.074 | 0.095 | 0.003 | 0.039 | 1.000 | −0.013 | 0.024 | −0.046 | |
| 2 procedures | 0.105 | 0.106 | −0.001 | 0.081 | −0.110 | 0.154 | 0.101 | −0.047 | −0.013 | 0.052 | −0.013 | 1.000 | 0.415 | 0.221 | |
| 3 procedures | 0.106 | 0.081 | −0.013 | 0.048 | −0.007 | 0.055 | 0.170 | 0.028 | 0.096 | 0.069 | 0.024 | 0.415 | 1.000 | 0.533 | |
| 4 procedures | 0.098 | 0.025 | −0.058 | 0.084 | −0.031 | 0.0103 | −0.028 | −0.035 | 0.018 | 0.203 | −0.046 | 0.221 | 0.533 | 1.000 | |
| Sign. (1-Tailed) | Variable/Variable | LOS | Age | Gender | Pre-operative LOS | AMI | CHF | PVD | CeVD | COPD | Diabetes | RD | 2 procedures | 3 procedures | 4 procedures |
| LOS | . | 0.028 | 0.275 | 0.000 | 0.425 | 0.000 | 0.000 | 0.058 | 0.463 | 0.250 | 0.183 | 0.020 | 0.020 | 0.028 | |
| Age | 0.028 | . | 0.007 | 0.252 | 0.263 | 0.011 | 0.090 | 0.051 | 0.015 | 0.002 | 0.000 | 0.020 | 0.058 | 0.316 | |
| Gender | 0.275 | 0.007 | . | 0.177 | 0.110 | 0.250 | 0.087 | 0.419 | 0.003 | 0.152 | 0.063 | 0.490 | 0.403 | 0.131 | |
| Pre-operative LOS | 0.000 | 0.252 | 0.177 | . | 0.304 | 0.003 | 0.011 | 0.105 | 0.482 | 0.202 | 0.459 | 0.058 | 0.177 | 0.052 | |
| AMI | 0.425 | 0.263 | 0.110 | 0.304 | . | 0.488 | 0.264 | 0.264 | 0.468 | 0.285 | 0.120 | 0.016 | 0.448 | 0.274 | |
| CHF | 0.000 | 0.011 | 0.250 | 0.003 | 0.488 | . | 0.150 | 0.138 | 0.132 | 0.353 | 0.247 | 0.001 | 0.142 | 0.023 | |
| PVD | 0.000 | 0.090 | 0.087 | 0.011 | 0.264 | 0.150 | . | 0.208 | 0.176 | 0.234 | 0.074 | 0.025 | 0.000 | 0.290 | |
| CeVD | 0.058 | 0.051 | 0.419 | 0.105 | 0.264 | 0.138 | 0.208 | . | 0.129 | 0.002 | 0.032 | 0.183 | 0.292 | 0.251 | |
| COPD | 0.463 | 0.015 | 0.003 | 0.482 | 0.468 | 0.132 | 0.176 | 0.129 | . | 0.420 | 0.476 | 0.399 | 0.030 | 0.360 | |
| Diabetes | 0.250 | 0.002 | 0.152 | 0.202 | 0.285 | 0.353 | 0.234 | 0.002 | 0.420 | . | 0.224 | 0.157 | 0.091 | 0.000 | |
| RD | 0.183 | 0.000 | 0.063 | 0.459 | 0.120 | 0.247 | 0.074 | 0.032 | 0.476 | 0.224 | . | 0.399 | 0.323 | 0.188 | |
| 2 procedures | 0.020 | 0.020 | 0.490 | 0.058 | 0.016 | 0.001 | 0.025 | 0.183 | 0.399 | 0.157 | 0.399 | . | 0.000 | 0.000 | |
| 3 procedures | 0.020 | 0.058 | 0.403 | 0.177 | 0.448 | 0.142 | 0.000 | 0.292 | 0.030 | 0.091 | 0.323 | 0.000 | . | 0.000 | |
| 4 procedures | 0.028 | 0.316 | 0.131 | 0.052 | 0.274 | 0.023 | 0.290 | 0.251 | 0.360 | 0.000 | 0.188 | 0.000 | 0.000 | . |
| Independent Variables | Tolerance | Variance Inflation Factor |
|---|---|---|
| Age | 0.871 | 1.148 |
| Gender | 0.926 | 1.080 |
| Pre-operative LOS | 0.947 | 1.056 |
| AMI | 0.973 | 1.028 |
| CHF | 0.931 | 1.074 |
| PVD | 0.913 | 1.095 |
| CeVD | 0.943 | 1.060 |
| COPD | 0.932 | 1.073 |
| Diabetes | 0.907 | 1.102 |
| RD | 0.933 | 1.072 |
| 2 Procedures | 0.783 | 1.277 |
| 3 Procedures | 0.576 | 1.736 |
| 4 Procedures | 0.652 | 1.534 |
| R | R2 | R2 Adjusted | Std. Error of the Estimate | |
|---|---|---|---|---|
| MLR Model | 0.850 | 0.722 | 0.712 | 6.331 |
| Variable | Unstandardized Coefficients | Standardized Coefficients Beta | t | p-Value | |
|---|---|---|---|---|---|
| Coefficient | Std. Error | ||||
| Intercept | 3.441 | 2.003 | 1.718 | 0.087 | |
| Age | 0.106 | 0.029 | 0.107 | 3.623 | <0.001 |
| Gender | −0.018 | 0.677 | −0.001 | −0.027 | 0.978 |
| Pre-operative LOS | 1.009 | 0.035 | 0.809 | 28.558 | <0.001 |
| AMI | −1.773 | 1.812 | −0.027 | −0.979 | 0.328 |
| CHF | 2.548 | 0.728 | 0.100 | 3.502 | 0.001 |
| PVD | 4.586 | 2.027 | 0.065 | 2.262 | 0.024 |
| CeVD | 1.349 | 1.665 | 0.023 | 0.810 | 0.418 |
| COPD | −0.536 | 1.310 | −0.012 | −0.410 | 0.682 |
| Diabetes | −1.210 | 1.649 | −0.021 | −0.734 | 0.464 |
| RD | 0.552 | 1.309 | 0.012 | 0.422 | 0.673 |
| 2 Procedures | −0.358 | 0.767 | −0.015 | −0.466 | 0.642 |
| 3 Procedures | 2.002 | 1.520 | 0.048 | 1.317 | 0.189 |
| 4 Procedures | 0.166 | 2.513 | 0.002 | 0.066 | 0.947 |
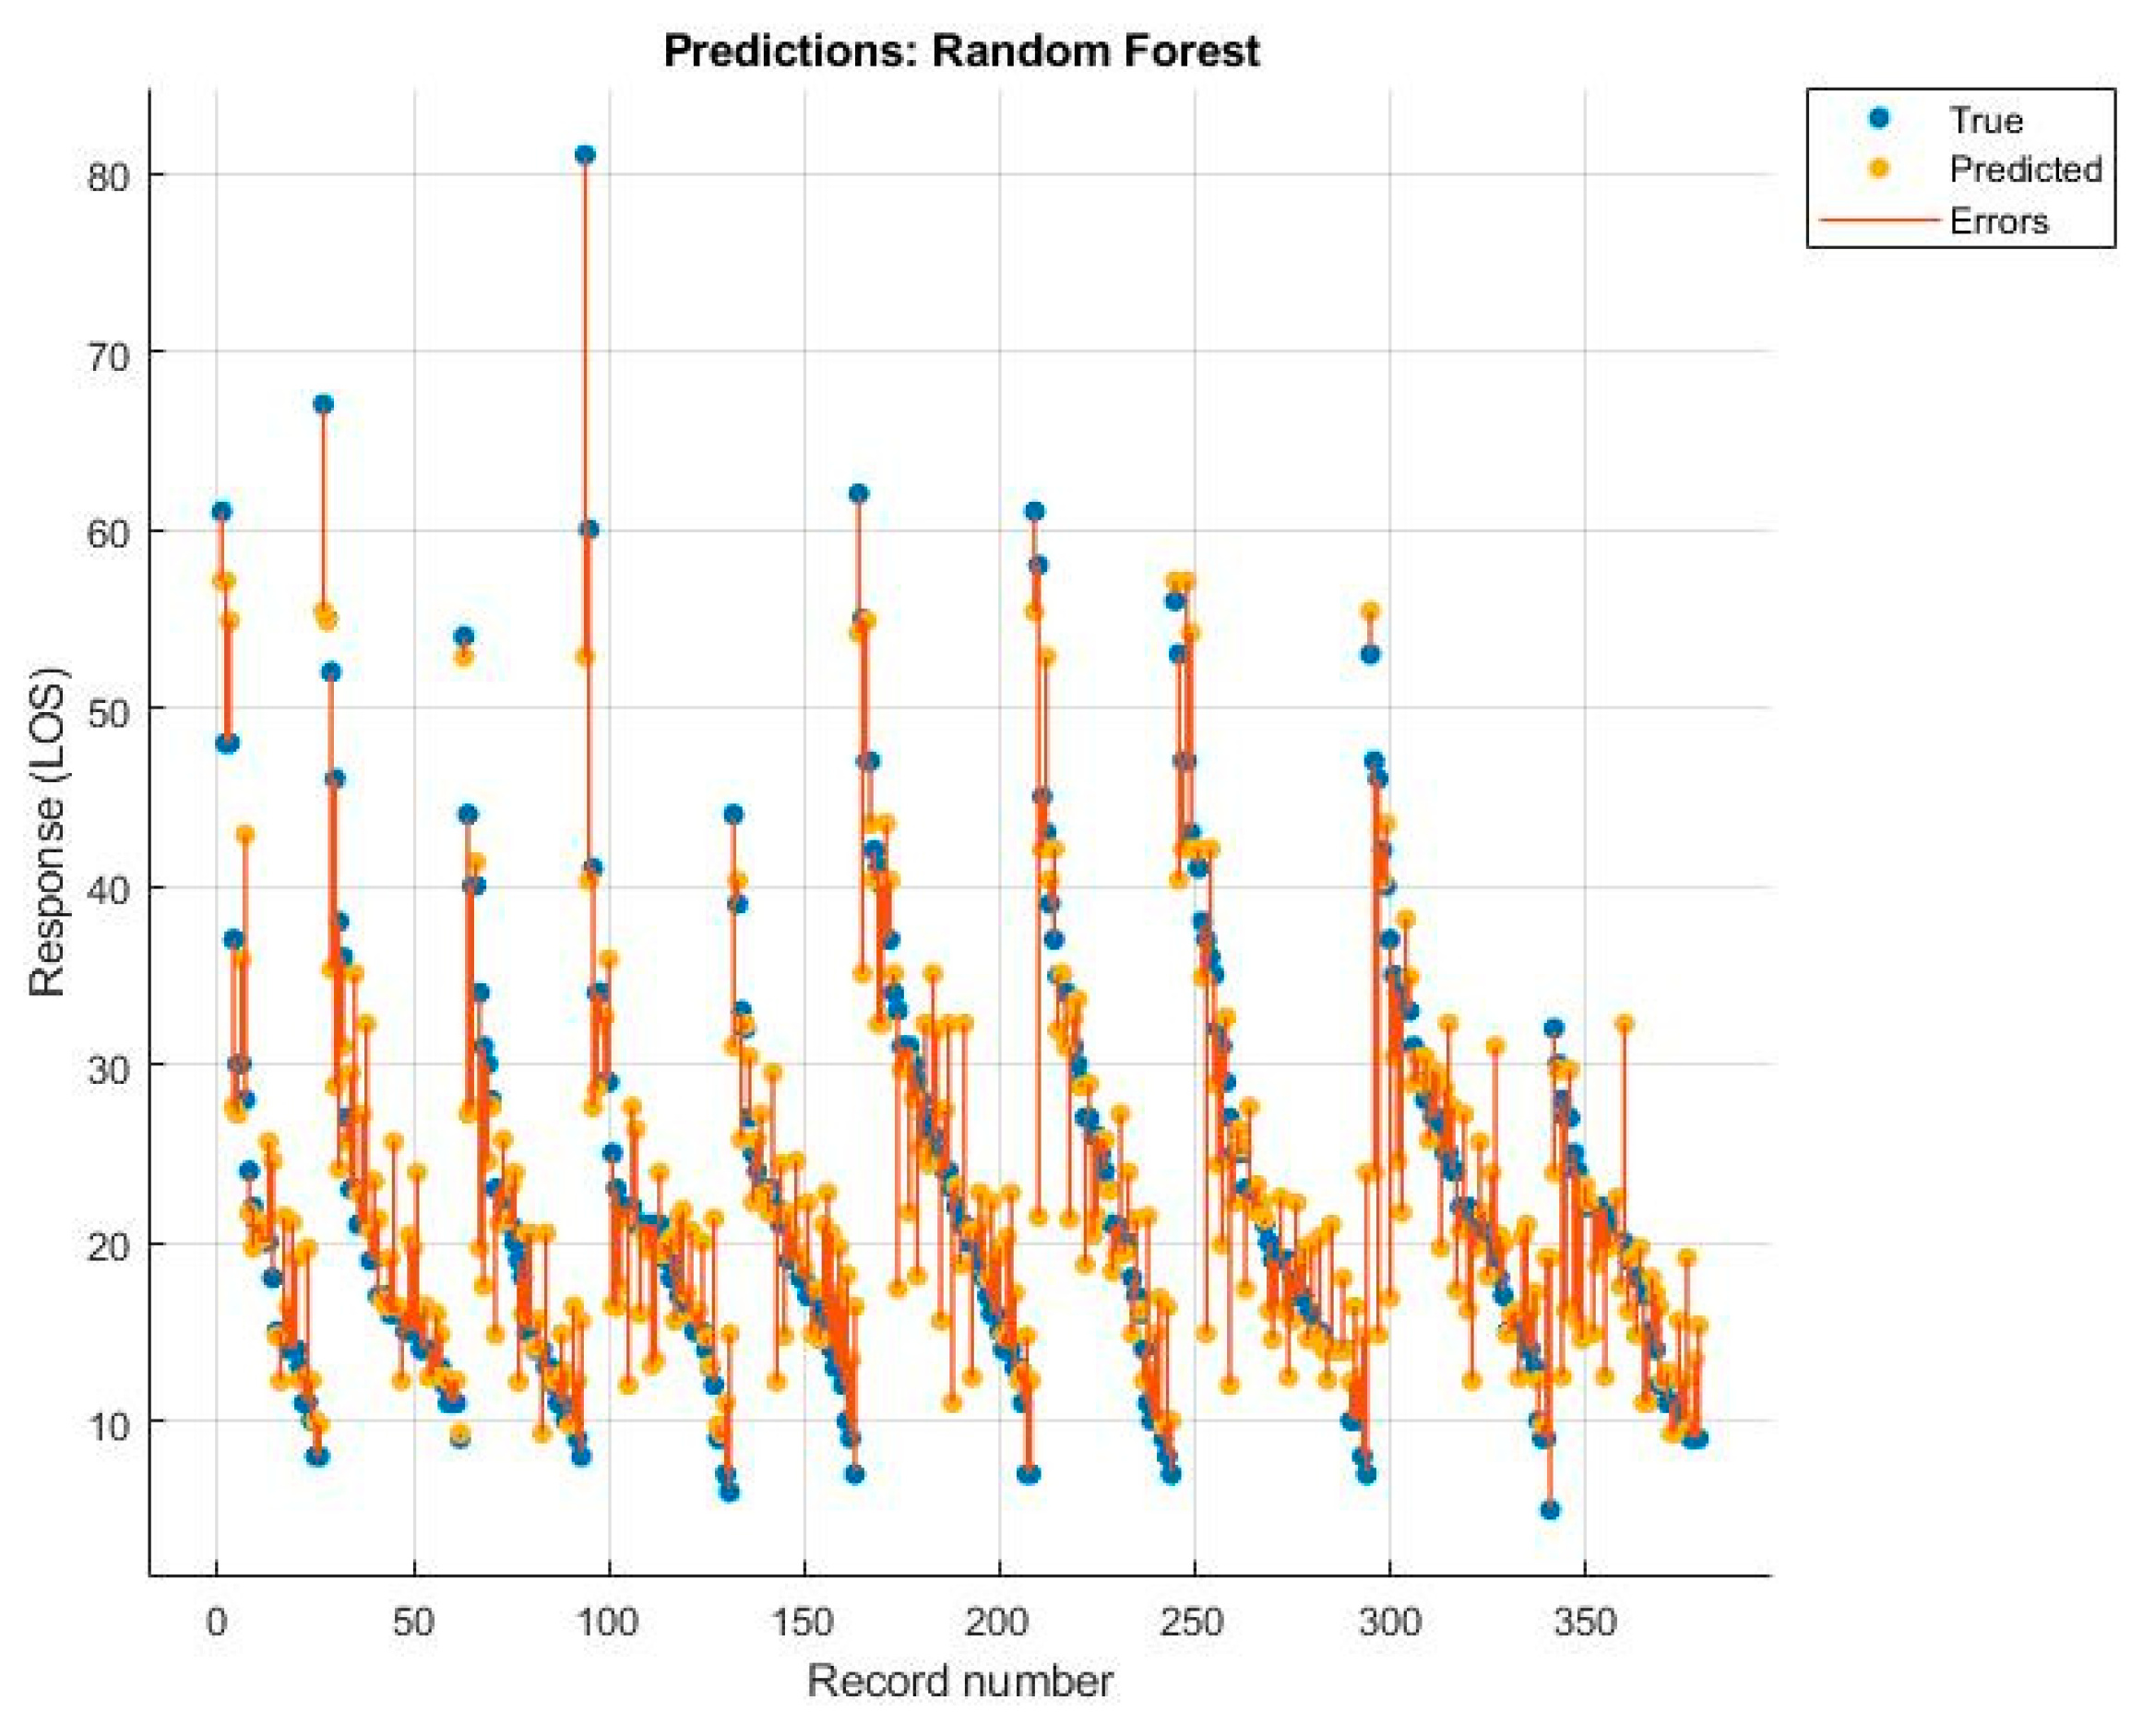
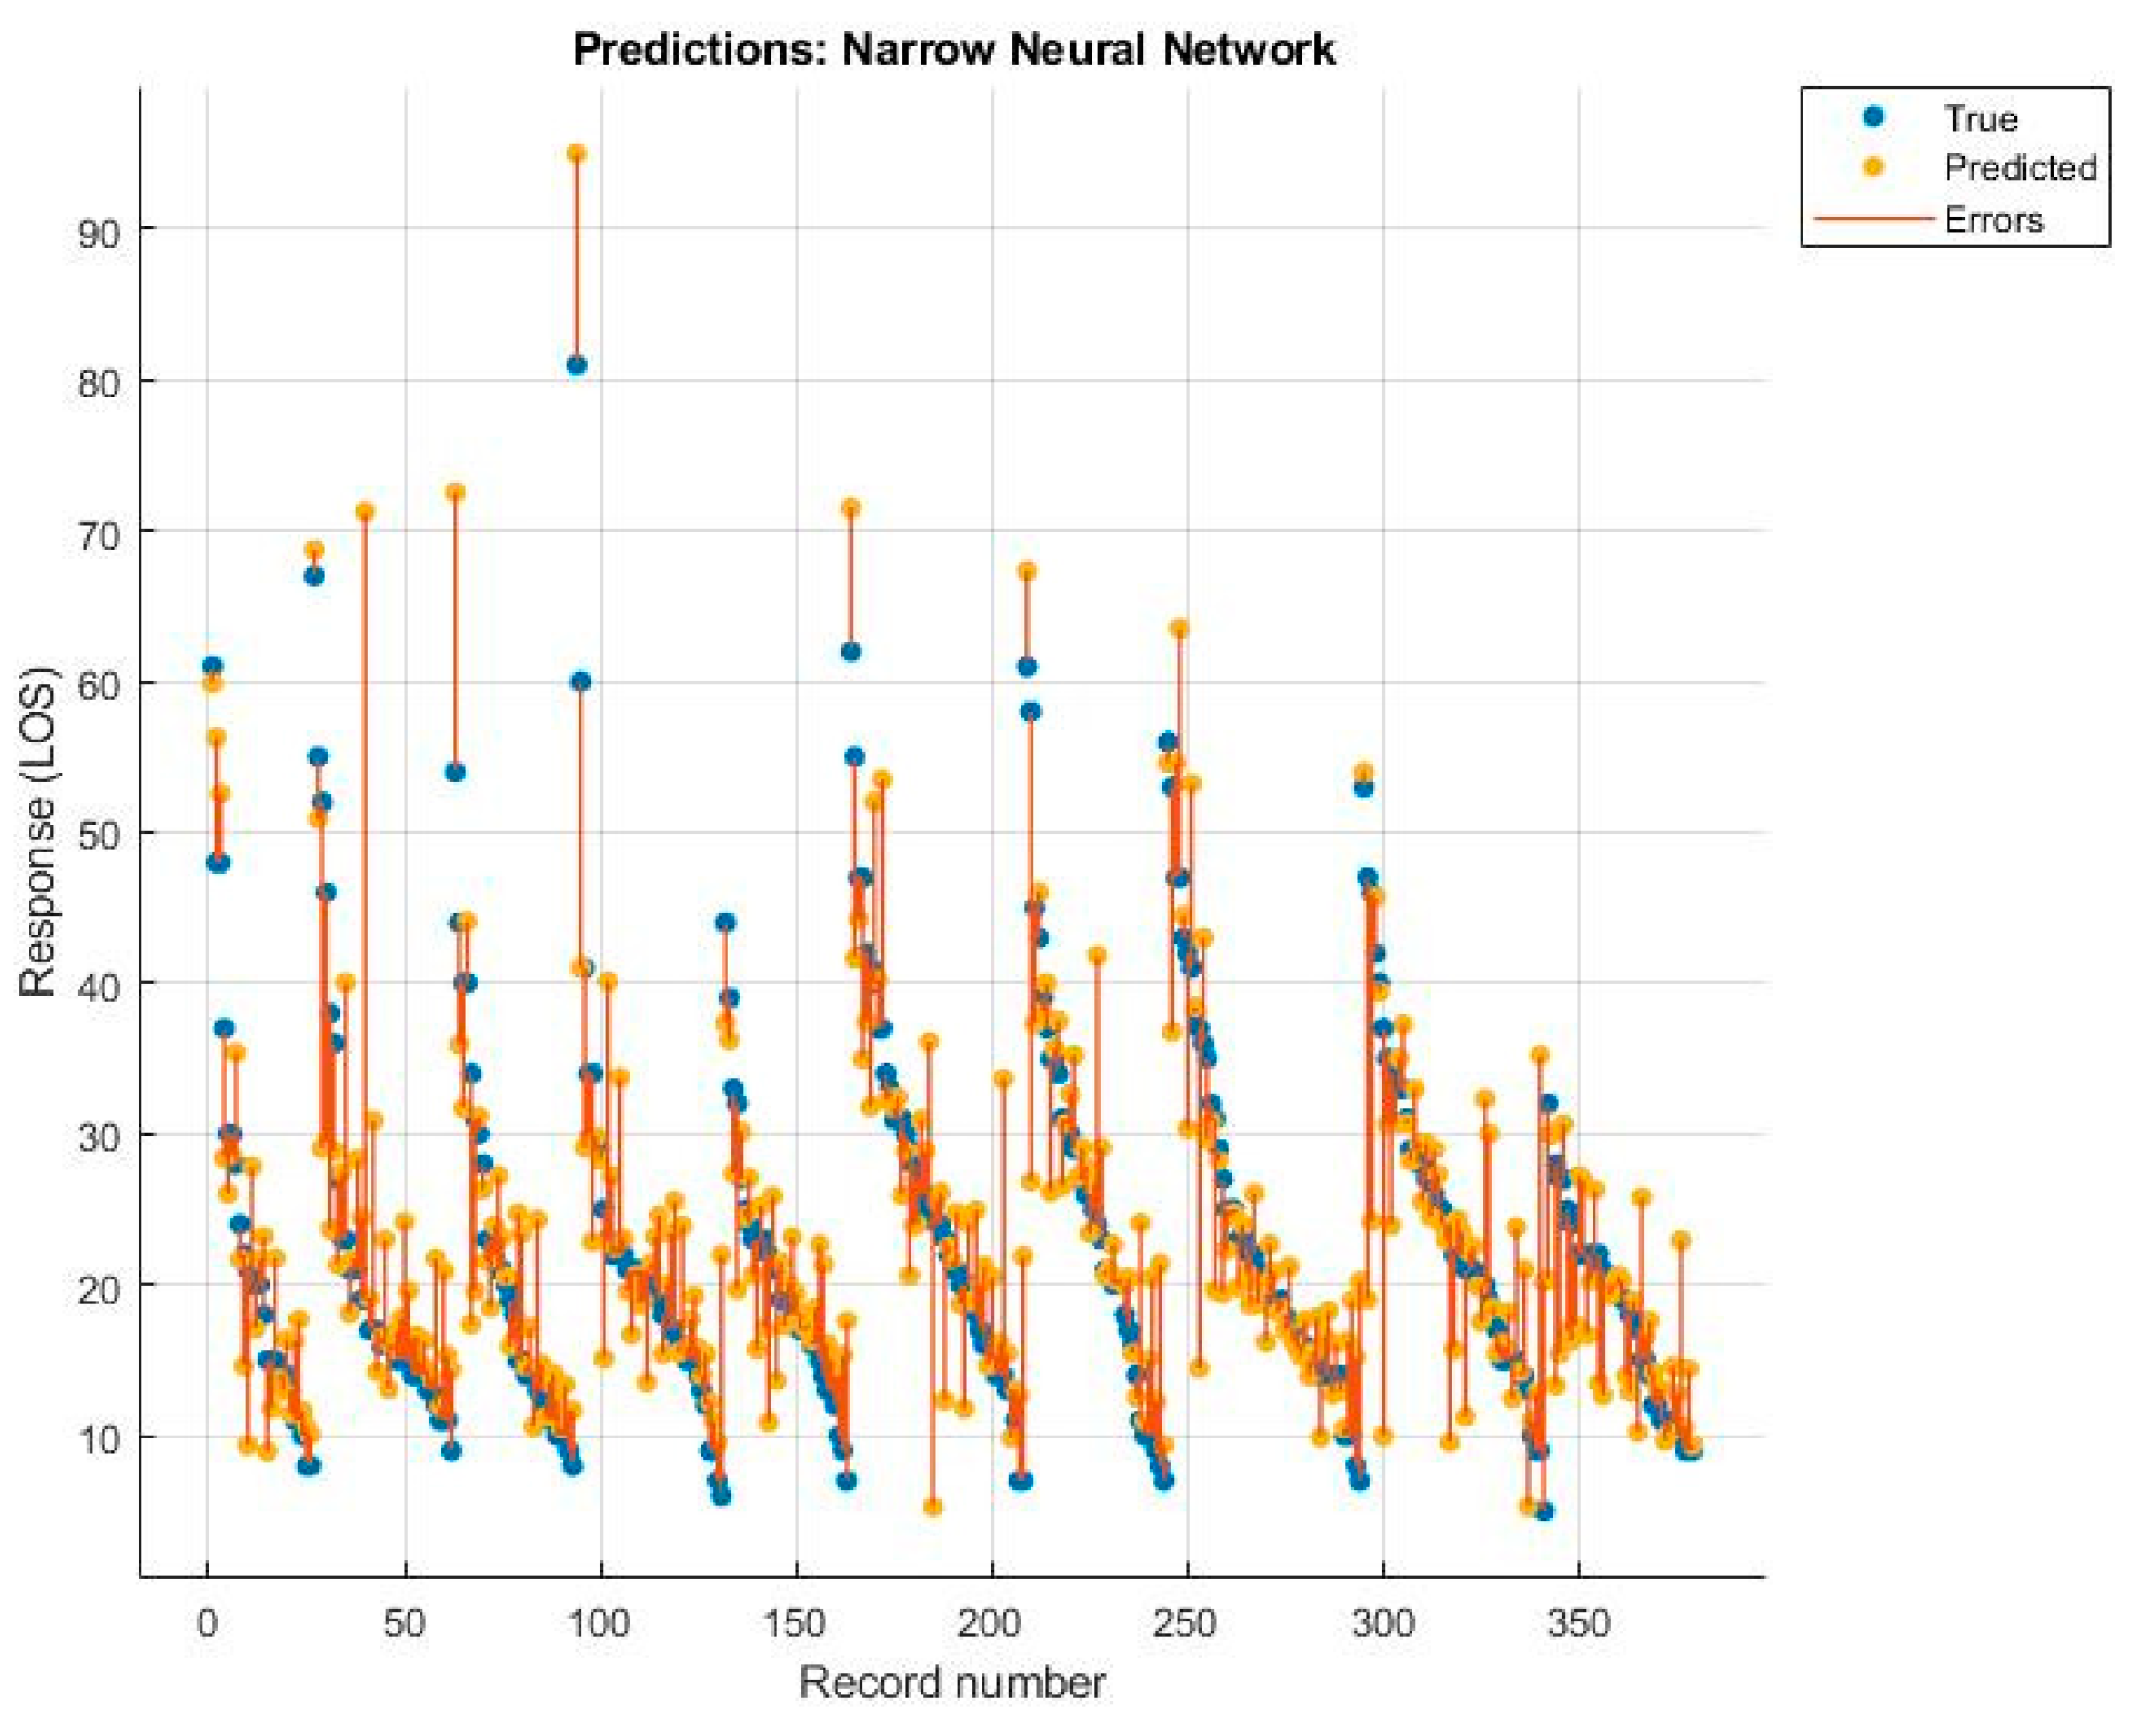
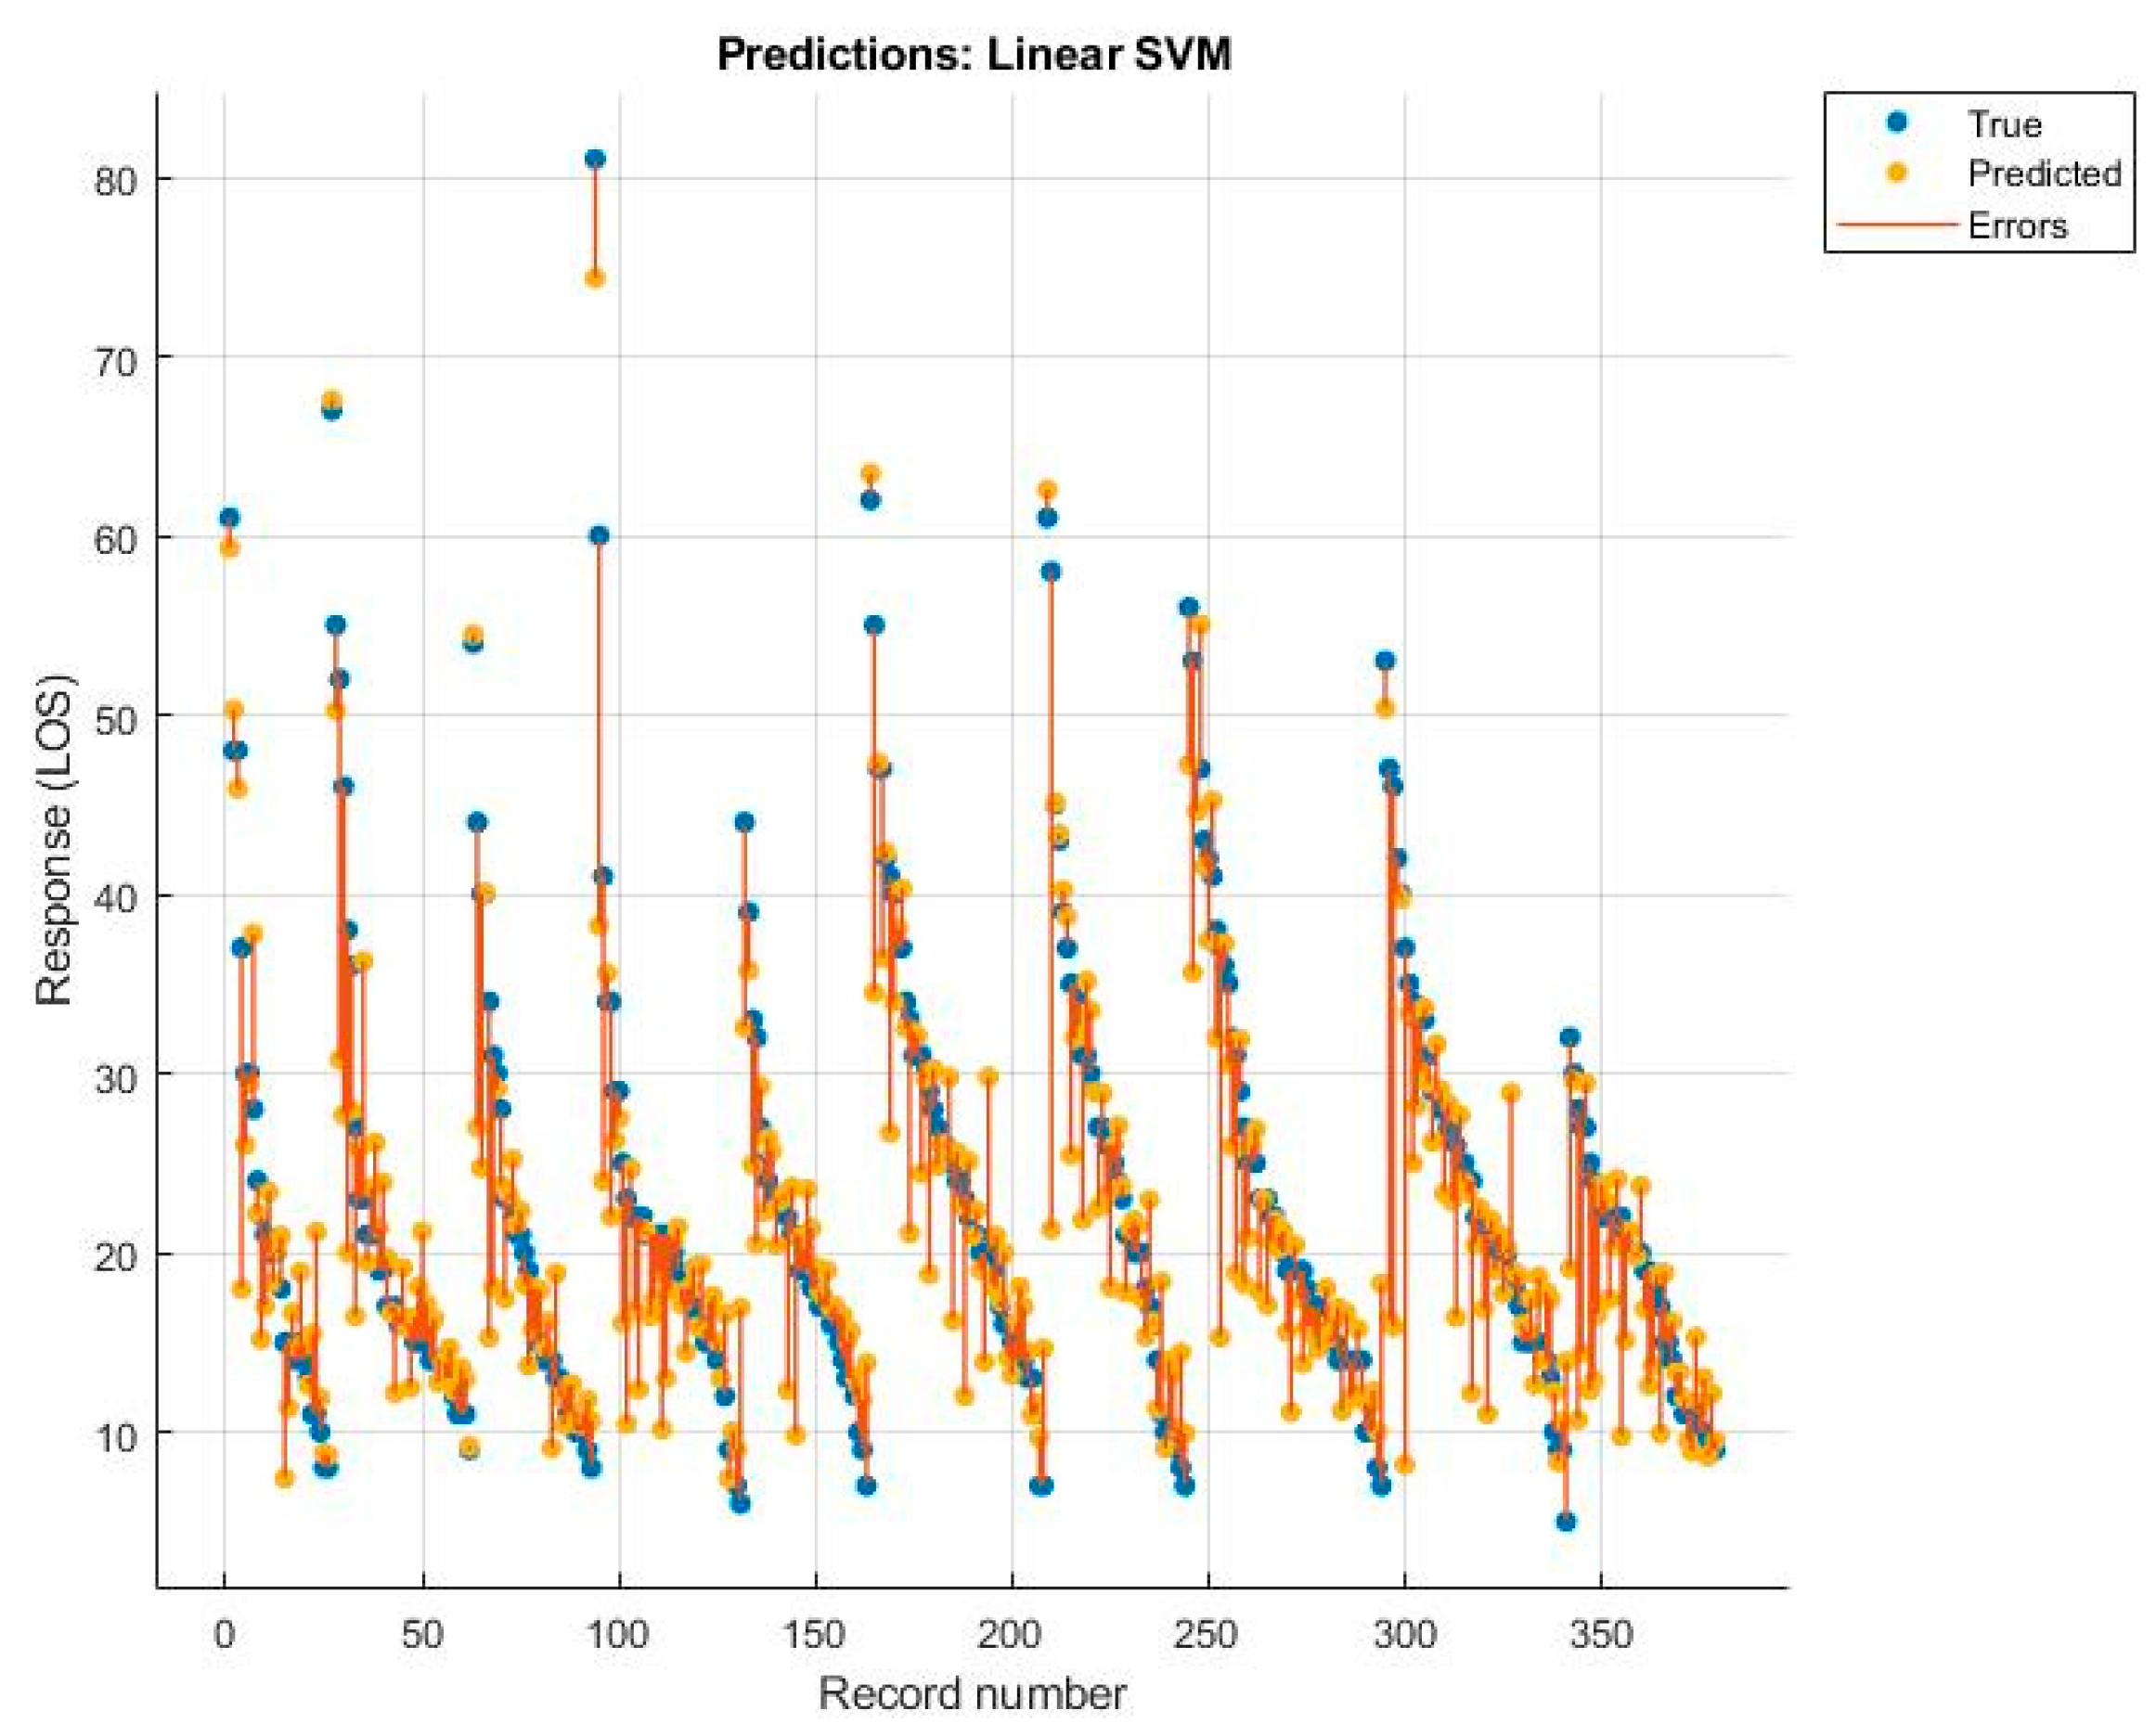
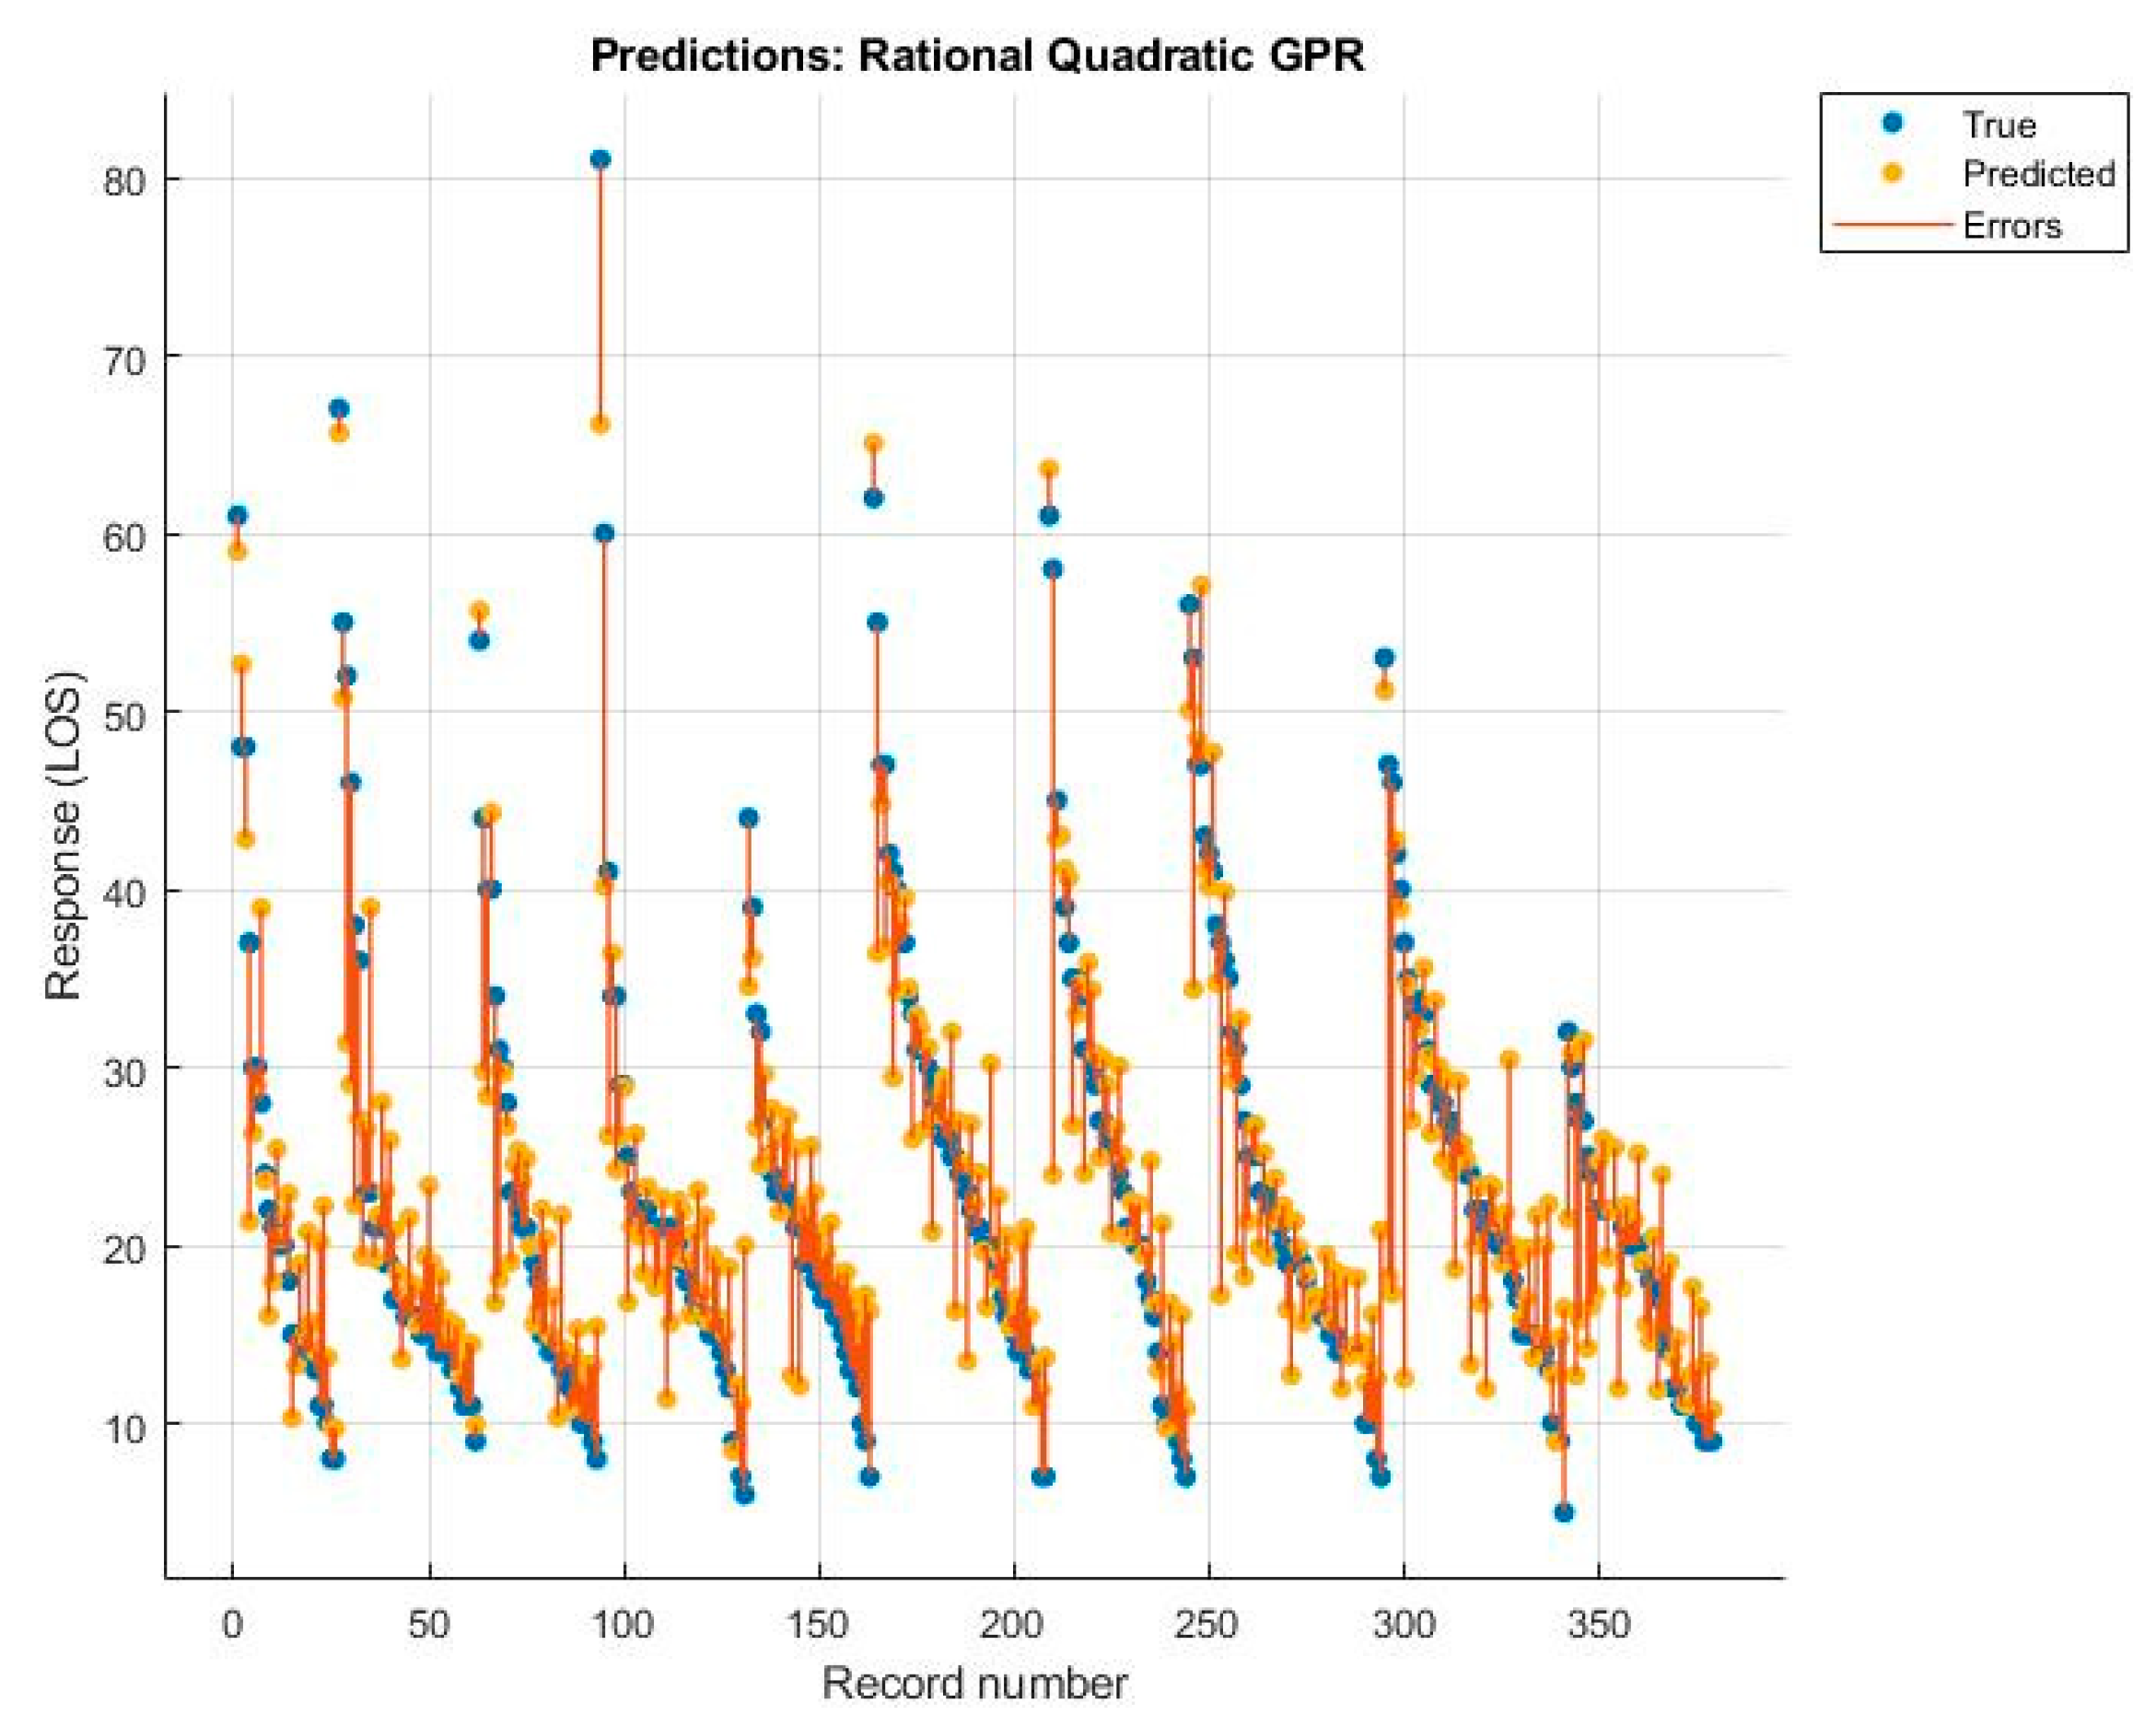
| RF | NNN | Linear SVM | Rational Quadratic GPR | |
|---|---|---|---|---|
| R2 | 0.670 | 0.580 | 0.690 | 0.710 |
| Root Mean Squared Error | 6.819 | 7.648 | 6.545 | 6.390 |
Publisher’s Note: MDPI stays neutral with regard to jurisdictional claims in published maps and institutional affiliations. |
© 2022 by the authors. Licensee MDPI, Basel, Switzerland. This article is an open access article distributed under the terms and conditions of the Creative Commons Attribution (CC BY) license (https://creativecommons.org/licenses/by/4.0/).
Share and Cite
Scala, A.; Trunfio, T.A.; De Coppi, L.; Rossi, G.; Borrelli, A.; Triassi, M.; Improta, G. Regression Models to Study the Total LOS Related to Valvuloplasty. Int. J. Environ. Res. Public Health 2022, 19, 3117. https://doi.org/10.3390/ijerph19053117
Scala A, Trunfio TA, De Coppi L, Rossi G, Borrelli A, Triassi M, Improta G. Regression Models to Study the Total LOS Related to Valvuloplasty. International Journal of Environmental Research and Public Health. 2022; 19(5):3117. https://doi.org/10.3390/ijerph19053117
Chicago/Turabian StyleScala, Arianna, Teresa Angela Trunfio, Lucia De Coppi, Giovanni Rossi, Anna Borrelli, Maria Triassi, and Giovanni Improta. 2022. "Regression Models to Study the Total LOS Related to Valvuloplasty" International Journal of Environmental Research and Public Health 19, no. 5: 3117. https://doi.org/10.3390/ijerph19053117