
An Analysis of the Impact of the Emissions Trading System on the Green Total Factor Productivity Based on the Spatial Difference-in-Differences Approach: The Case of China


Abstract
:1. Introduction
2. Literature
2.1. Green Innovation Effect of ETS
2.2. ETS in China
3. Research Design
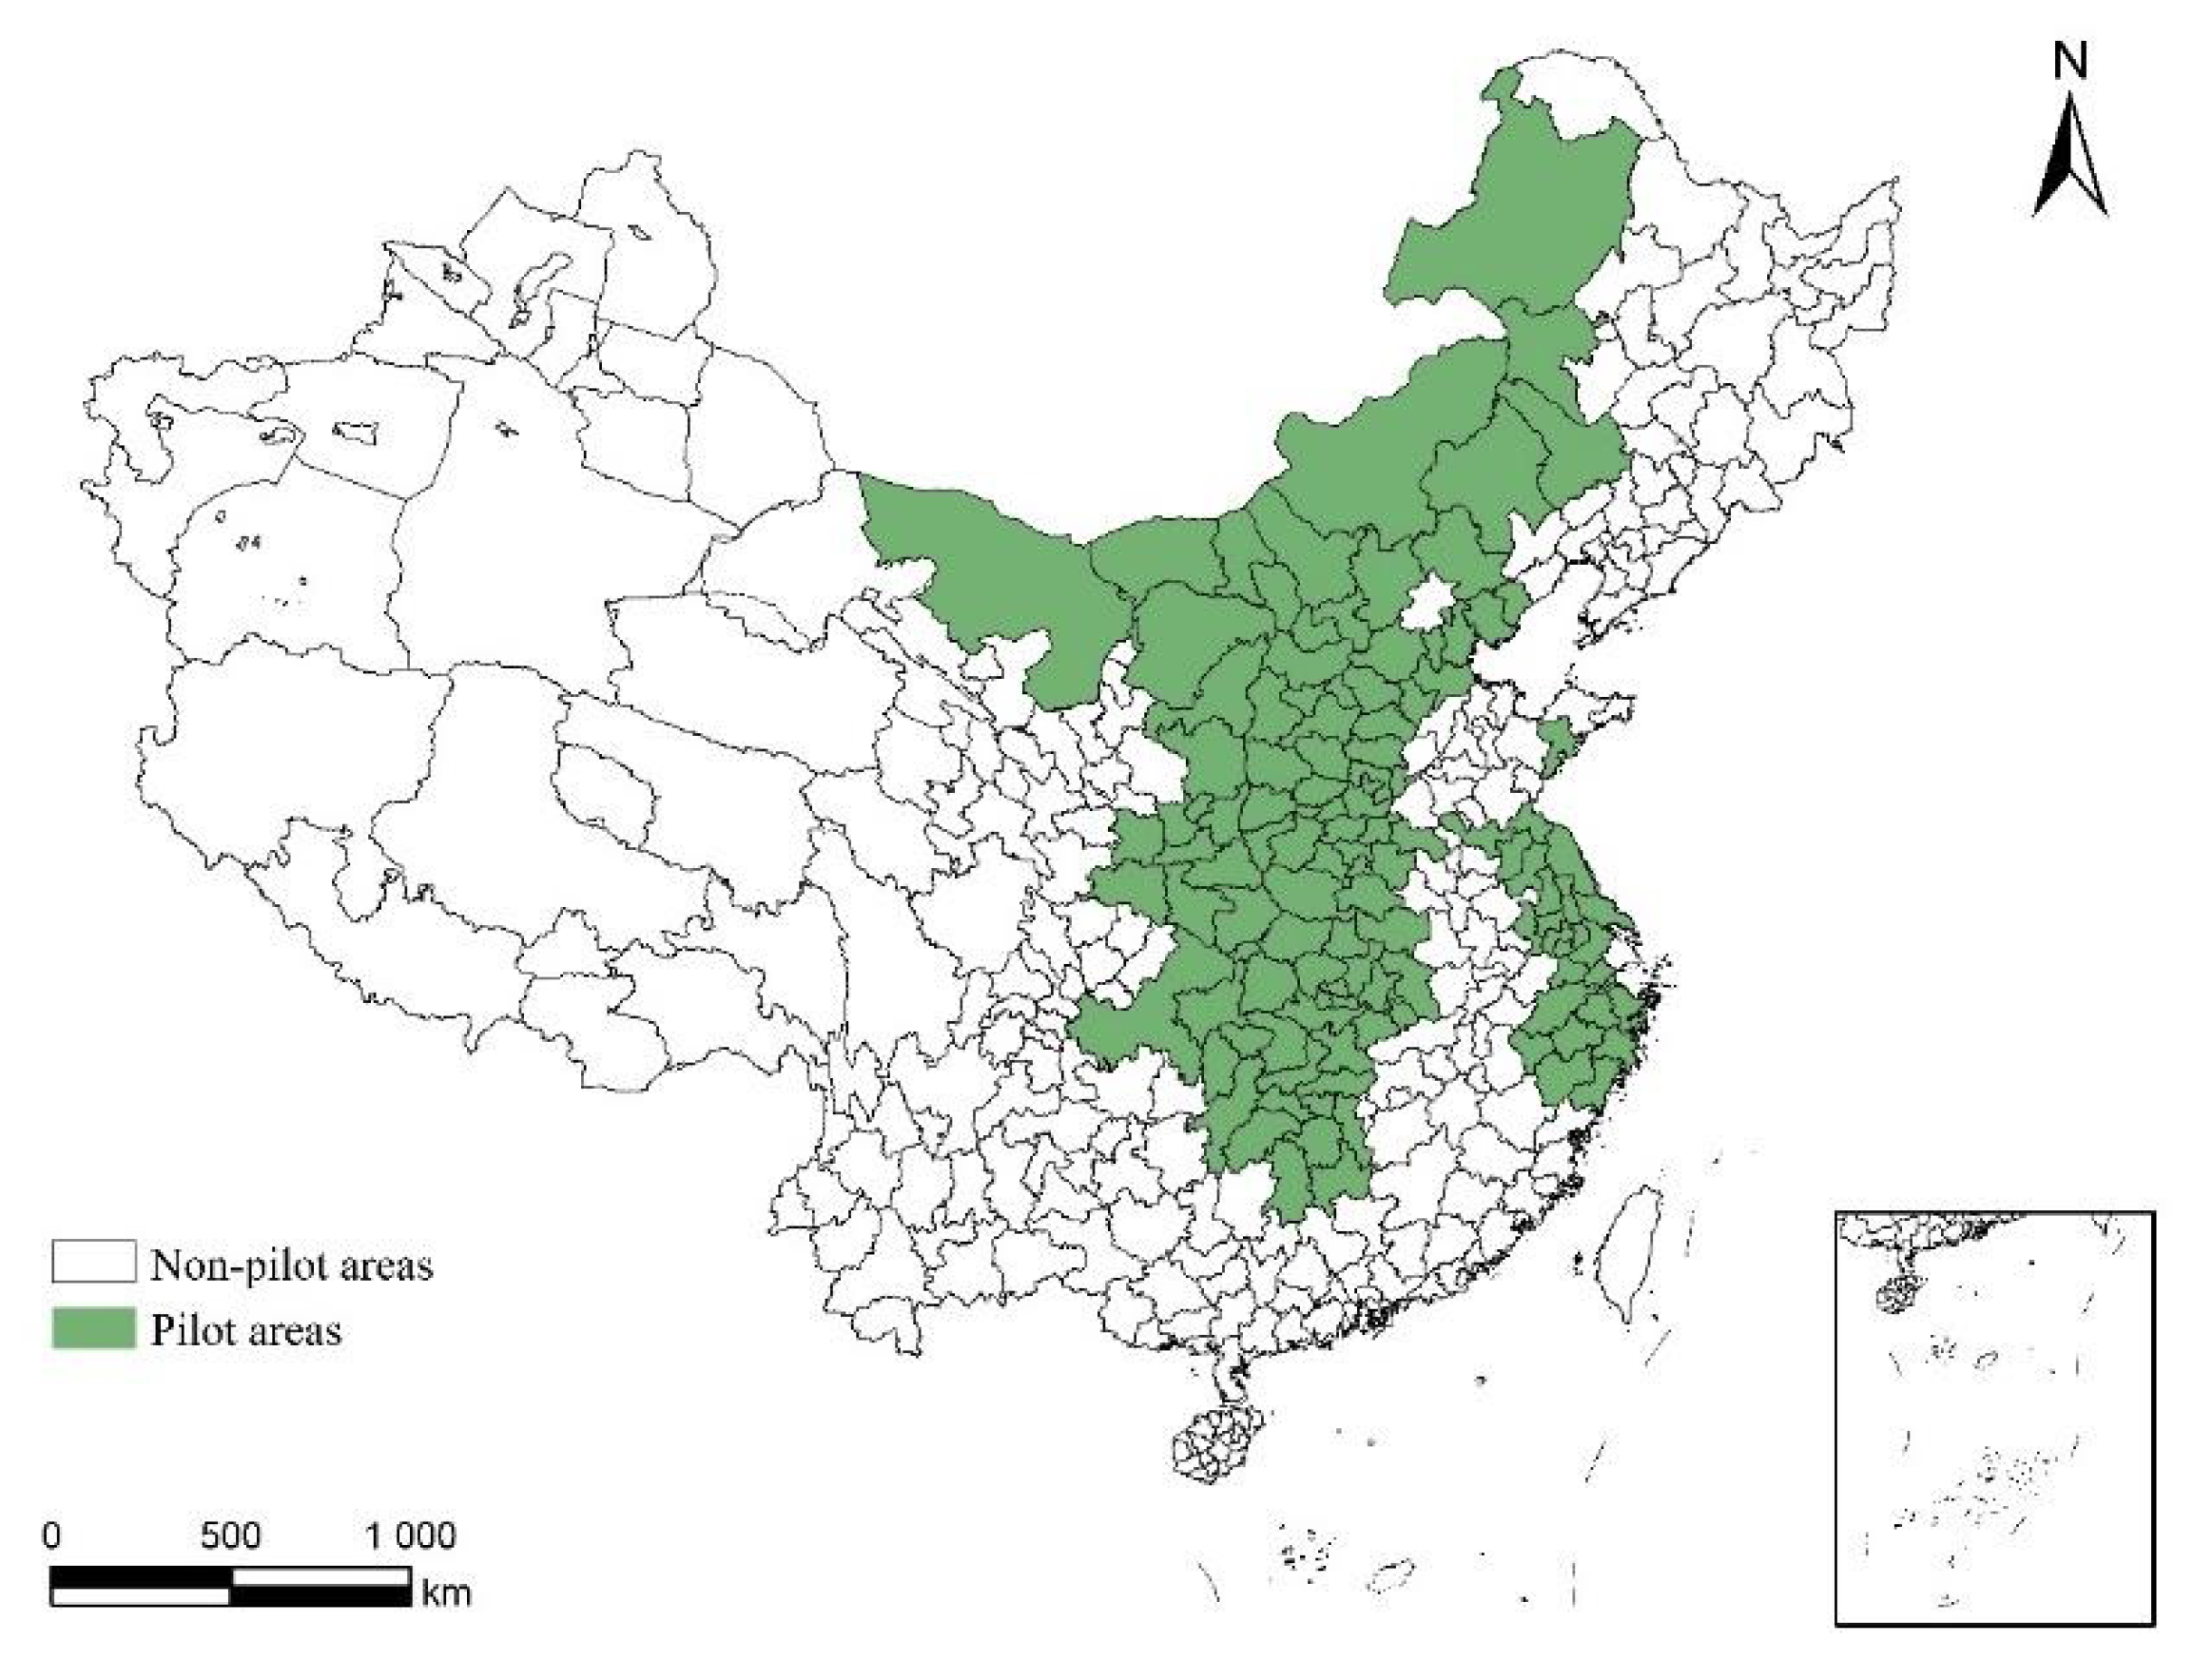
3.1. Samples and Data
3.2. Variables
3.2.1. Dependent Variable—GTFP
3.2.2. Key Explanatory Variable—ETS Dummy
3.2.3. Control Variables
3.3. Empirical Model
4. Empirical Analysis
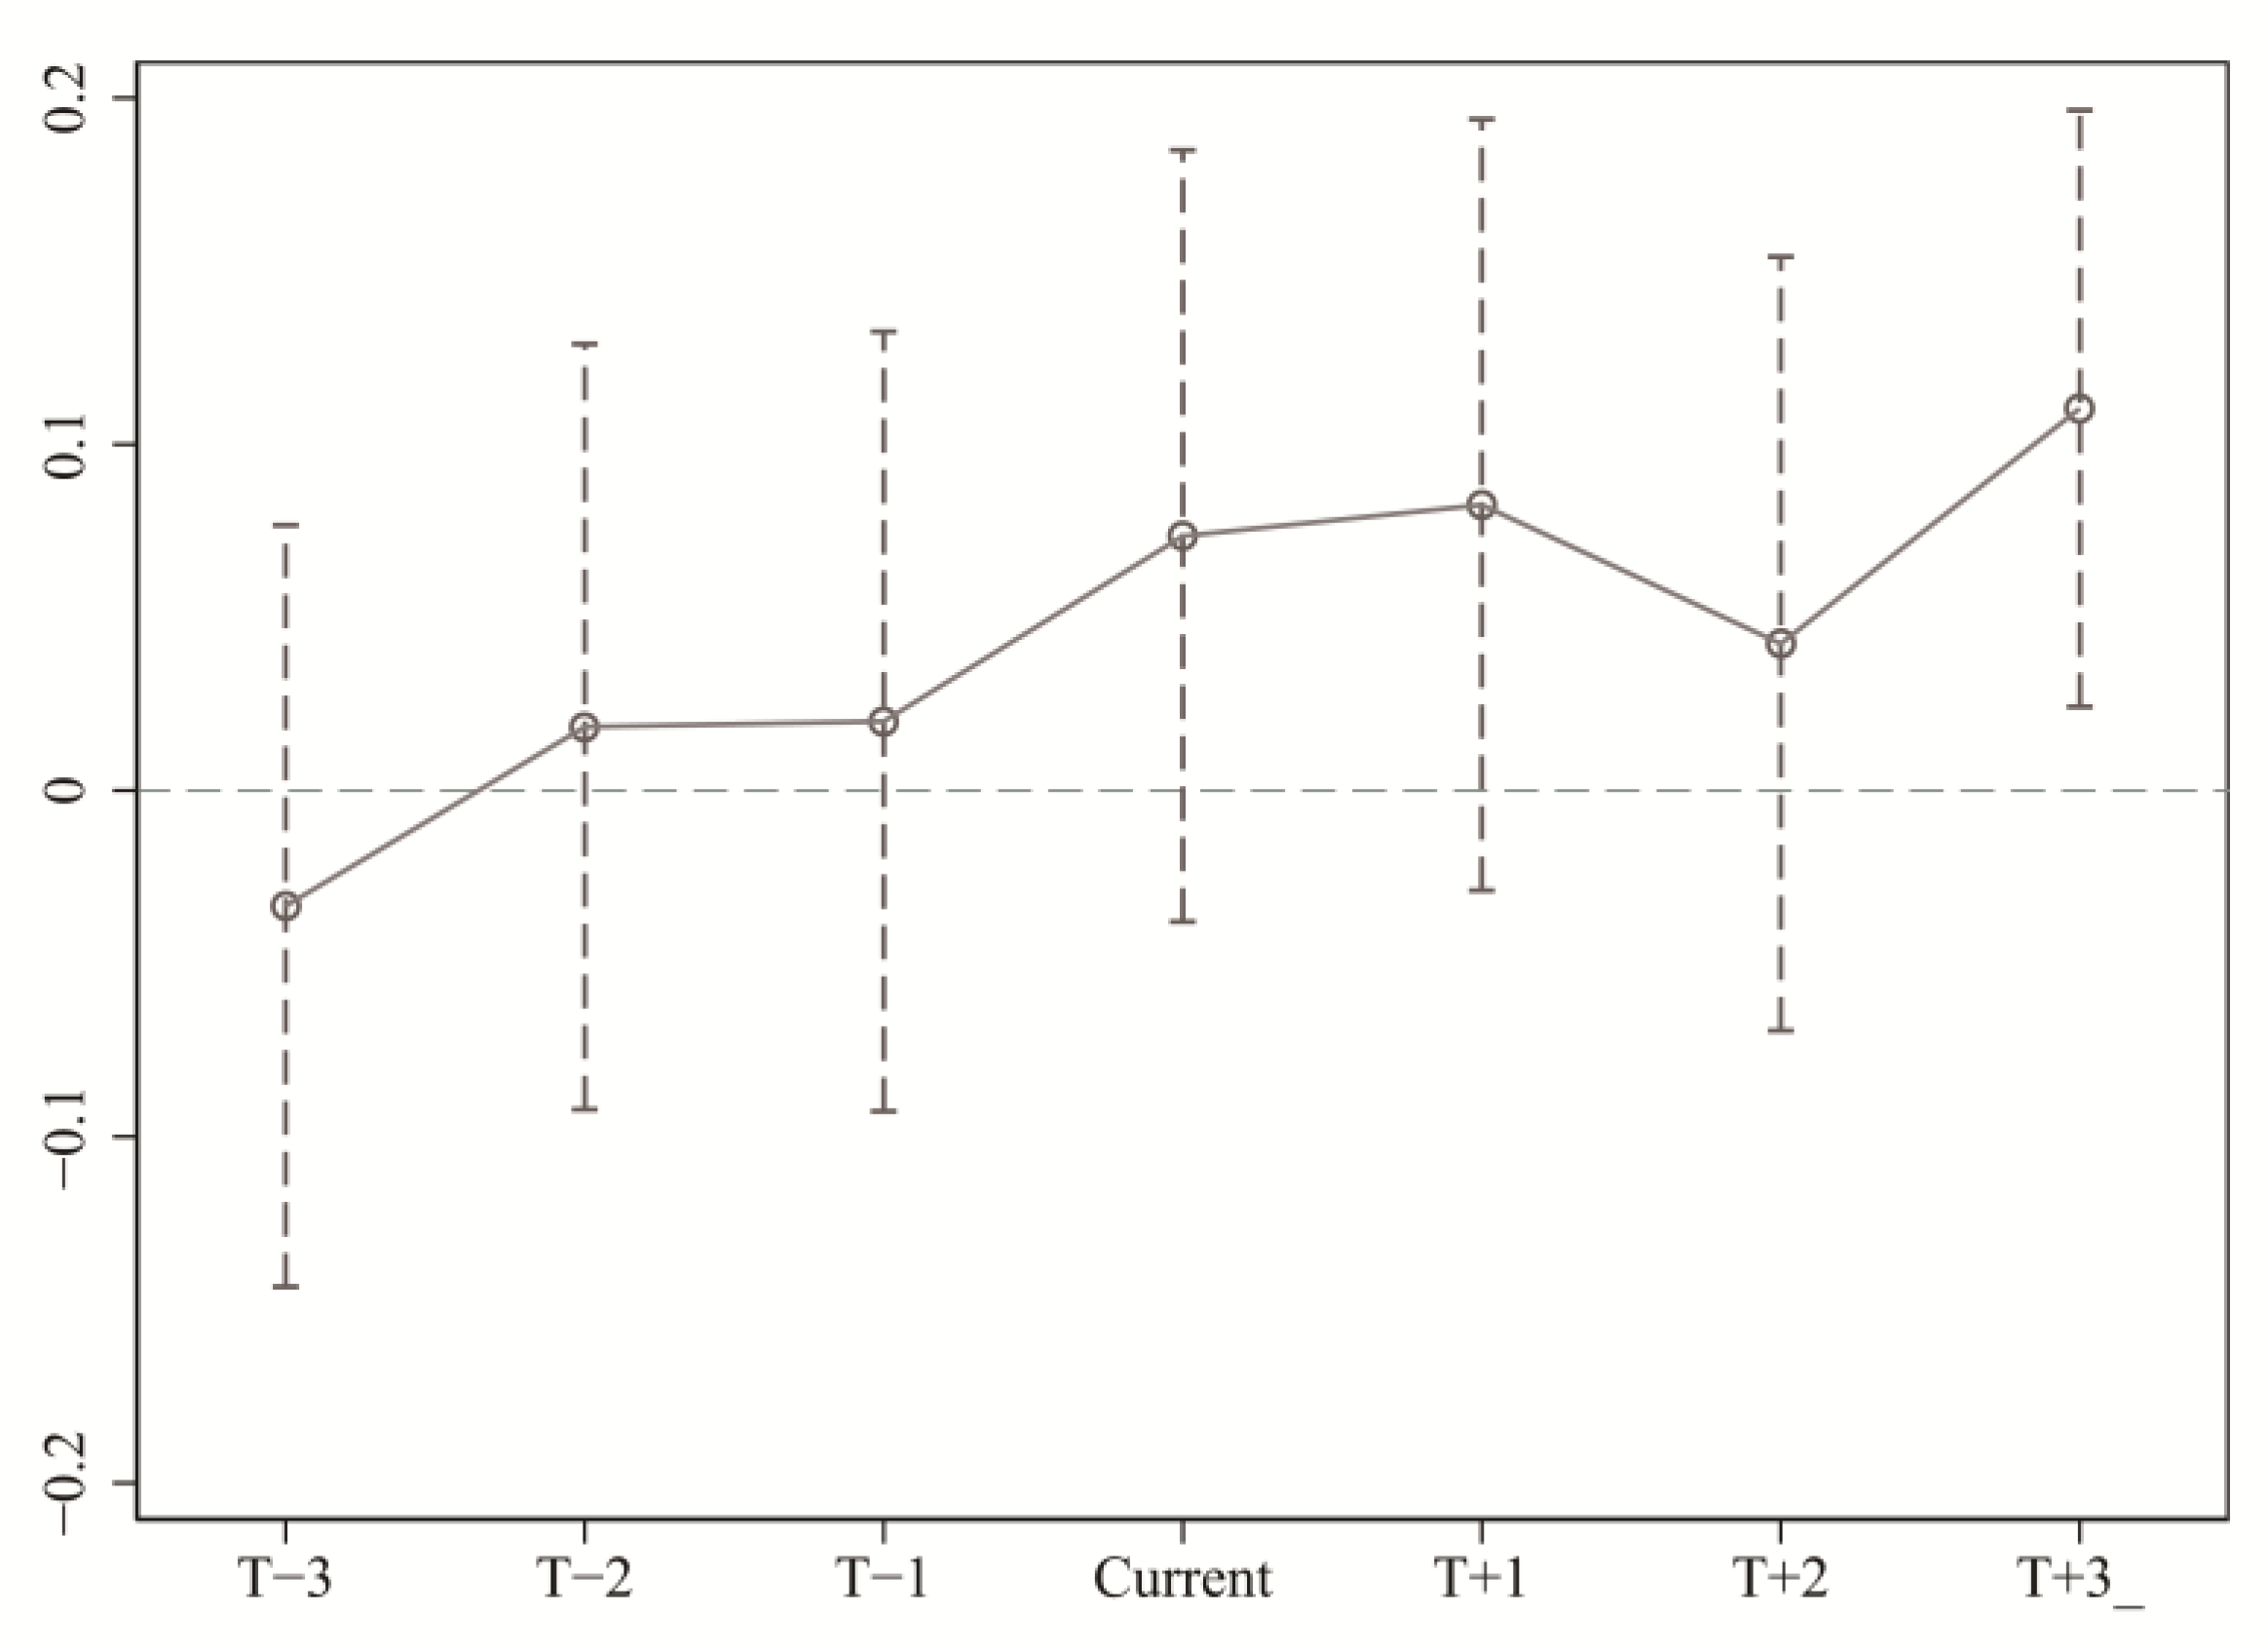
4.1. Parallel Trend Test
4.2. Baseline Regression
5. Mechanism Analysis
5.1. Impact of Energy Efficiency
5.2. Impact of Green Innovation
5.3. Impact of Industry Structure
6. Heterogeneity Analysis
7. Robustness Test
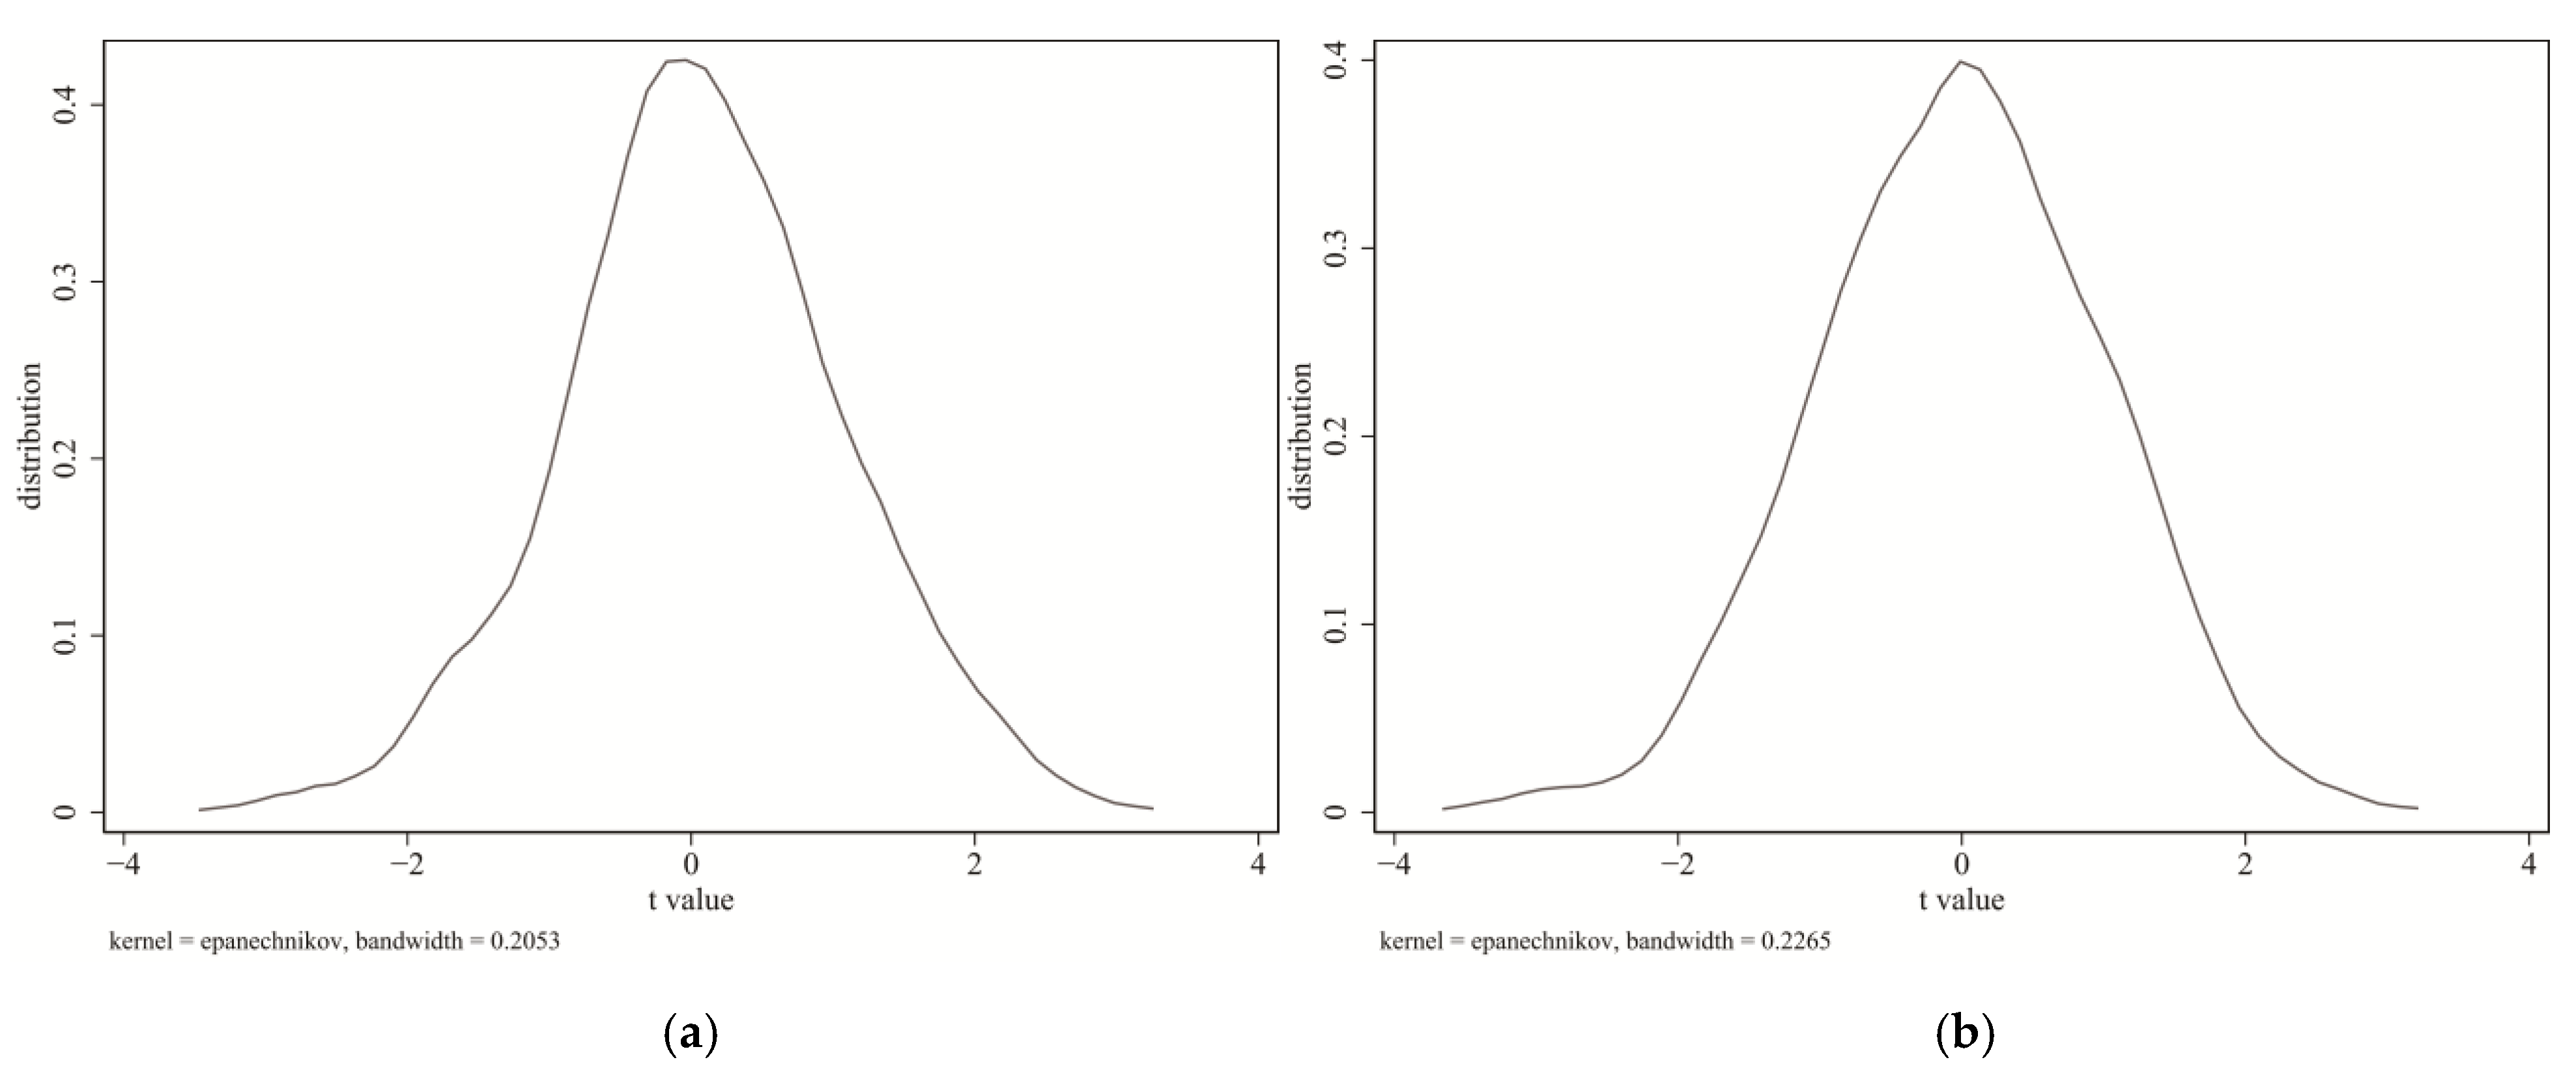
7.1. Placebo Test
7.2. PSM-SDID
7.3. Carbon ETS
8. Discussion and Conclusions
8.1. Discussion
8.2. Conclusions
Author Contributions
Funding
Institutional Review Board Statement
Informed Consent Statement
Data Availability Statement
Conflicts of Interest
References
- Vennemo, H.; Aunan, K.; Lindhjem, H.; Seip, H.M. Environmental Pollution in China: Status and Trends. Rev. Environ. Econ. Policy 2009, 3, 209–230. [Google Scholar] [CrossRef] [Green Version]
- Lu, Z.N.; Chen, H.; Hao, Y.; Wang, J.; Song, X.; Mok, T.M. The dynamic relationship between environmental pollution, economic development and public health: Evidence from China. J. Clean. Prod. 2017, 166, 134–147. [Google Scholar] [CrossRef]
- Chen, S. Environmental pollution emissions, regional productivity growth and ecological economic development in China. China Econ. Rev. 2015, 35, 171–182. [Google Scholar] [CrossRef]
- Solomon, B.D. Global CO2 emissions trading: Early lessons from the US acid rain program. Clim. Chang. 1995, 30, 75–96. [Google Scholar] [CrossRef]
- Chestnut, L.G.; Mills, D.M. A fresh look at the benefits and costs of the US acid rain program. J. Environ. Manag. 2005, 77, 252–266. [Google Scholar] [CrossRef]
- Barreca, A.I.; Neidell, M.; Sanders, N. Long-run pollution exposure and mortality: Evidence from the Acid Rain Program. J. Public Econ. 2021, 200, 104440. [Google Scholar] [CrossRef]
- Zhang, D.; Karplus, V.J.; Cassisa, C.; Zhang, X. Emissions trading in China: Progress and prospects. Energy Policy 2014, 75, 9–16. [Google Scholar] [CrossRef]
- Yan, Y.; Zhang, X.; Zhang, J.; Li, K. Emissions trading system (ETS) implementation and its collaborative governance effects on air pollution: The China story. Energy Policy 2020, 138, 111282. [Google Scholar] [CrossRef]
- Zhang, C. Using multivariate analyses and GIS to identify pollutants and their spatial patterns in urban soils in Galway, Ireland. Environ. Pollut. 2006, 142, 501–511. [Google Scholar] [CrossRef]
- Cheng, Z. The spatial correlation and interaction between manufacturing agglomeration and environmental pollution. Ecol. Indic. 2016, 61, 1024–1032. [Google Scholar] [CrossRef]
- Liu, K.; Lin, B. Research on influencing factors of environmental pollution in China: A spatial econometric analysis. J. Clean. Prod. 2018, 206, 356–364. [Google Scholar] [CrossRef]
- Wang, J.; Wang, K.; Shi, X.; Wei, Y.-M. Spatial heterogeneity and driving forces of environmental productivity growth in China: Would it help to switch pollutant discharge fees to environmental taxes? J. Clean. Prod. 2019, 223, 36–44. [Google Scholar] [CrossRef]
- Yu, D.J.; Li, J. Evaluating the employment effect of China’s carbon emission trading policy: Based on the perspective of spatial spillover. J. Clean. Prod. 2021, 292, 126052. [Google Scholar] [CrossRef]
- Yang, Z.; Fan, M.; Shao, S.; Yang, L. Does carbon intensity constraint policy improve industrial green production performance in China? A quasi-DID analysis. Energy Econ. 2017, 68, 271–282. [Google Scholar] [CrossRef]
- Hu, Y.; Ren, S.; Wang, Y.; Chen, X. Can carbon emission trading scheme achieve energy conservation and emission reduction? Evidence from the industrial sector in China. Energy Econ. 2020, 85, 104590. [Google Scholar] [CrossRef]
- Li, J.; Du, Y.X. Spatial effect of environmental regulation on green innovation efficiency: Evidence from prefectural-level cities in China. J. Clean. Prod. 2021, 286, 125032. [Google Scholar] [CrossRef]
- Cai, X.; Lu, Y.; Wu, M.; Yu, L. Does environmental regulation drive away inbound foreign direct investment? Evidence from a quasi-natural experiment in China. J. Dev. Econ. 2016, 123, 73–85. [Google Scholar] [CrossRef]
- Hou, B.; Wang, B.; Du, M.; Zhang, N. Does the SO2 emissions trading scheme encourage green total factor productivity? An empirical assessment on China’s cities. Environ. Sci. Pollut. Res. 2019, 27, 6375–6388. [Google Scholar] [CrossRef]
- Yao, S.; Yu, X.; Yan, S.; Wen, S. Heterogeneous emission trading schemes and green innovation. Energy Policy 2021, 155, 112367. [Google Scholar] [CrossRef]
- Shi, D.; Li, S.L. Emissions Trading System and Energy Use Efficiency—Measurements and Empirical Evidence for Cities at and above the Prefecture Level. China Ind. Econ. 2020, 138, 5–23. [Google Scholar]
- Todorović, J.Đ.; Đorđević, M.; Ristić, M. Environmental taxes as the instrument of environmental policy in developing countries. Нoви Екoнoмист 2018, 12, 45–52. [Google Scholar] [CrossRef] [Green Version]
- Joskow, P.L.; Schmalensee, R. The political economy of market-based environmental policy: The US acid rain program. J. Law Econ. 1998, 41, 37–84. [Google Scholar] [CrossRef]
- Chan, H.R.; Chupp, B.A.; Cropper, M.L.; Muller, N.Z. The impact of trading on the costs and benefits of the Acid Rain Program. J. Environ. Econ. Manag. 2018, 88, 180–209. [Google Scholar] [CrossRef] [Green Version]
- Zhang, Y.; Li, S.; Luo, T.; Gao, J. The effect of emission trading policy on carbon emission reduction: Evidence from an integrated study of pilot regions in China. J. Clean. Prod. 2020, 265, 121843. [Google Scholar] [CrossRef]
- Tang, K.; Liu, Y.; Zhou, D.; Qiu, Y. Urban carbon emission intensity under emission trading system in a developing economy: Evidence from 273 Chinese cities. Environ. Sci. Pollut. Res. 2020, 28, 5168–5179. [Google Scholar] [CrossRef]
- Vespermann, J.; Wald, A. Much Ado about Nothing?—An analysis of economic impacts and ecologic effects of the EU-emission trading scheme in the aviation industry. Transp. Res. Part A Policy Pract. 2011, 45, 1066–1076. [Google Scholar] [CrossRef]
- Zhang, W.; Li, J.; Li, G.; Guo, S. Emission reduction effect and carbon market efficiency of carbon emissions trading policy in China. Energy 2020, 196, 117117. [Google Scholar] [CrossRef]
- Rogge, K.S.; Schneider, M.; Hoffmann, V.H. The innovation impact of the EU Emission Trading System—Findings of company case studies in the German power sector. Ecol. Econ. 2011, 70, 513–523. [Google Scholar] [CrossRef]
- Lyu, X.; Shi, A.; Wang, X. Research on the impact of carbon emission trading system on low-carbon technology innovation. Carbon Manag. 2020, 11, 183–193. [Google Scholar] [CrossRef]
- Zhang, L.; Cao, C.; Tang, F.; He, J.; Li, D. Does China’s emissions trading system foster corporate green innovation? Evidence from regulating listed companies. Technol. Anal. Strat. Manag. 2018, 31, 199–212. [Google Scholar] [CrossRef]
- Porter, M.E. America’s Green Strategy. Sci. Am. 1991, 264, 168. [Google Scholar] [CrossRef]
- Ambec, S.; Barla, P. A theoretical foundation of the Porter hypothesis. Econ. Lett. 2002, 75, 355–360. [Google Scholar] [CrossRef]
- Lv, M.; Bai, M. Evaluation of China’s carbon emission trading policy from corporate innovation. Financ. Res. Lett. 2021, 39, 101565. [Google Scholar] [CrossRef]
- Tang, H.-L.; Liu, J.-M.; Mao, J.; Wu, J.-G. The effects of emission trading system on corporate innovation and productivity-empirical evidence from China’s SO2 emission trading system. Environ. Sci. Pollut. Res. 2020, 27, 21604–21620. [Google Scholar] [CrossRef] [PubMed]
- Feng, C.; Shi, B.; Kang, R. Does Environmental Policy Reduce Enterprise Innovation?—Evidence from China. Sustainability 2017, 9, 872. [Google Scholar] [CrossRef] [Green Version]
- Yi, M.; Fang, X.; Wen, L.; Guang, F.; Zhang, Y. The Heterogeneous Effects of Different Environmental Policy Instruments on Green Technology Innovation. Int. J. Environ. Res. Public Health 2019, 16, 4660. [Google Scholar] [CrossRef] [PubMed] [Green Version]
- Philibert, C. How could emissions trading benefit developing countries. Energy Policy 2000, 28, 947–956. [Google Scholar] [CrossRef]
- Sahoo, N.R.; Mohapatra, P.K.J.; Sahoo, B.K.; Mahanty, B. Rationality of energy efficiency improvement targets under the PAT scheme in India–A case of thermal power plants. Energy Econ. 2017, 66, 279–289. [Google Scholar] [CrossRef]
- Ba, F.; Thiers, P.R.; Liu, Y. The evolution of China’s emission trading mechanisms: From international offset market to domestic Emission Trading Scheme. Environ. Plan. C Politi-Space 2018, 36, 1214–1233. [Google Scholar] [CrossRef]
- Oliveira, T.D.; Gurgel, A.C.; Tonry, S. International market mechanisms under the Paris Agreement: A cooperation between Brazil and Europe. Energy Policy 2019, 129, 397–409. [Google Scholar] [CrossRef]
- Muldavin, J. The paradoxes of environmental policy and resource management in reform-era China. Econ. Geogr. 2000, 76, 244–271. [Google Scholar] [CrossRef]
- Wu, J.; Deng, Y.; Huang, J.; Morck, R.; Yeung, B. Incentives and Outcomes: China’s Environmental Policy; No. w18754; National Bureau of Economic Research: Cambridge, MA, USA, 2013. [Google Scholar]
- Li, Y.; Chen, Y. Development of an SBM-ML model for the measurement of green total factor productivity: The case of pearl river delta urban agglomeration. Renew. Sustain. Energy Rev. 2021, 145, 111131. [Google Scholar] [CrossRef]
- Qiao, Z.; Li, Z. Do foreign institutional investors enhance firm innovation in China? Appl. Econ. Lett. 2018, 26, 1125–1128. [Google Scholar] [CrossRef]
- Marcus, M.; Sant’Anna, P.H.C. The role of parallel trends in event study settings: An application to environmental economics. J. Assoc. Environ. Resour. Econ. 2021, 8, 235–275. [Google Scholar]
- Li, X.; Shu, Y.; Jin, X. Environmental regulation, carbon emissions and green total factor productivity: A case study of China. Environ. Dev. Sustain. 2021, 1–21. [Google Scholar] [CrossRef]
- MacGill, I.; Outhred, H.; Nolles, K. National Emissions Trading for Australia: Key Design Issues and Complementary Policies for Promoting Energy Efficiency, Infrastructure Investment and Innovation. Australas. J. Environ. Manag. 2004, 11, 78–87. [Google Scholar] [CrossRef] [Green Version]
- Wang, Y.; Sun, X.; Guo, X. Environmental regulation and green productivity growth: Empirical evidence on the Porter Hy-pothesis from OECD industrial sectors. Energy Policy 2019, 132, 611–619. [Google Scholar] [CrossRef]
- Zang, J.; Wan, L.; Li, Z.; Wang, C.; Wang, S. Does emission trading scheme have spillover effect on industrial structure upgrading? Evidence from the EU based on a PSM-DID approach. Environ. Sci. Pollut. Res. 2020, 27, 12345–12357. [Google Scholar] [CrossRef] [PubMed]
- Albrizio, S.; Kozluk, T.; Zipperer, V. Environmental policies and productivity growth: Evidence across industries and firms. J. Environ. Econ. Manag. 2017, 81, 209–226. [Google Scholar] [CrossRef]
- Shinkuma, T.; Sugeta, H. Tax versus emissions trading scheme in the long run. J. Environ. Econ. Manag. 2016, 75, 12–24. [Google Scholar] [CrossRef]
- Jacobsen, L.B.; Nielsen, M.; Nielsen, R. Gains of integrating sector-wise pollution regulation: The case of nitrogen in Danish crop production and aquaculture. Ecol. Econ. 2016, 129, 172–181. [Google Scholar] [CrossRef]
- Nemesio, I.V. Strengthening environmental rule of law: Enforcement, combatting corruption, and encouraging citizen suits. Geo. Int’l Envtl. L. Rev. 2014, 27, 321. [Google Scholar]
- Liu, C.; Ma, C.; Xie, R. Structural, Innovation and Efficiency Effects of Environmental Regulation: Evidence from China’s Carbon Emissions Trading Pilot. Environ. Resour. Econ. 2020, 75, 741–768. [Google Scholar] [CrossRef]
- Li, R.; Ramanathan, R. Exploring the relationships between different types of environmental regulations and environmental performance: Evidence from China. J. Clean. Prod. 2018, 196, 1329–1340. [Google Scholar] [CrossRef]
- Fan, G.; Wang, X.; Zhu, H. NERI Index of Marketization of China’s Provinces 2011 Report; Economic Science Press: Beijing, China, 2011; pp. 273–283. [Google Scholar]
- Song, M.; Chen, Y.; An, Q. Spatial econometric analysis of factors influencing regional energy efficiency in China. Environ. Sci. Pollut. Res. 2018, 25, 13745–13759. [Google Scholar] [CrossRef] [PubMed]
- Tang, K.; Qiu, Y.; Zhou, D. Does command-and-control regulation promote green innovation performance? Evidence from China’s industrial enterprises. Sci. Total Environ. 2020, 712, 136362. [Google Scholar] [CrossRef]
- Allen, F.; Qian, J.; Qian, M. Law, finance, and economic growth in China. Financ. Econ. 2005, 77, 57–116. [Google Scholar] [CrossRef] [Green Version]
- Zhang, B.; Chen, X.; Guo, H. Does central supervision enhance local environmental enforcement? Quasi-experimental evidence from China. J. Public Econ. 2018, 164, 70–90. [Google Scholar] [CrossRef]


| Model | Panel-DID | SDID-SDM |
|---|---|---|
| Variables | (1) | (2) |
| DID | 0.491 *** | 0.662 *** |
| (11.57) | (2.93) | |
| W × DID | 2.190 ** | |
| (2.11) | ||
| Control | Y | Y |
| Year-fe | Y | Y |
| City-fe | Y | Y |
| Obs. | 3934 | 3934 |
| R2 | 0.440 | 0.472 |
| Model | Energy Efficiency | Green Innovation | Industry Structure |
|---|---|---|---|
| Variables | (1) | (2) | (3) |
| DID × ee | 0.036 ** | ||
| (2.21) | |||
| W × DID × ee | 0.413 * | ||
| (1.65) | |||
| DID × gti | 0.280 * | ||
| (1.83) | |||
| W × DID × gti | 3.725 * | ||
| (1.91) | |||
| DID × str | −0.295 ** | ||
| (−2.26) | |||
| W × DID × str | 1.857 * | ||
| (1.75) | |||
| Control | Y | Y | Y |
| Year-fe | Y | Y | Y |
| City-fe | Y | Y | Y |
| Obs. | 3934 | 3934 | 3934 |
| R2 | 0.356 | 0.359 | 0.355 |
| Model | Marketization Level | Environmental Enforcement | Energy Consumption Endowment | |||
|---|---|---|---|---|---|---|
| (1) | (2) | (3) | (4) | (5) | (6) | |
| Variables | High | Low | Strong | Weak | Heavy | Light |
| DID | 0.758 *** | 0.014 | 0.680 | 0.433 ** (2.29) | 0.611 *** | 11.394 *** |
| (3.08) | (0.03) | (1.06) | (2.74) | (5.25) | ||
| W × DID | 3.189 *** | 2.496 | −6.246 *** | 6.064 * (1.958) | 2.732 ** | −6.434 *** |
| (3.76) | (1.20) | (−2.77) | (2.24) | (−2.59) | ||
| Control | Y | Y | Y | Y | Y | Y |
| Year-fe | Y | Y | Y | Y | Y | Y |
| City-fe | Y | Y | Y | Y | Y | Y |
| Obs. | 2268 | 1666 | 2240 | 1694 | 2450 | 1484 |
| R2 | 0.434 | 0.501 | 0.486 | 0.519 | 0.412 | 0.536 |
| Model | PSM-SDID | Carbon ETS |
|---|---|---|
| Variables | (1) | (2) |
| DID | 0.640 *** | |
| (2.84) | ||
| W × DID | 3.110 ** | |
| (2.56) | ||
| DDD | 0.195 * | |
| (1.87) | ||
| W × DDD | 43.441 *** | |
| (6.63) | ||
| Control | Y | Y |
| Year-fe | Y | Y |
| City-fe | Y | Y |
| Obs. | 3201 | 3934 |
| R2 | 0.150 | 0.271 |
Publisher’s Note: MDPI stays neutral with regard to jurisdictional claims in published maps and institutional affiliations. |
© 2021 by the authors. Licensee MDPI, Basel, Switzerland. This article is an open access article distributed under the terms and conditions of the Creative Commons Attribution (CC BY) license (https://creativecommons.org/licenses/by/4.0/).
Share and Cite
Wang, S.; Chen, G.; Han, X. An Analysis of the Impact of the Emissions Trading System on the Green Total Factor Productivity Based on the Spatial Difference-in-Differences Approach: The Case of China. Int. J. Environ. Res. Public Health 2021, 18, 9040. https://doi.org/10.3390/ijerph18179040
Wang S, Chen G, Han X. An Analysis of the Impact of the Emissions Trading System on the Green Total Factor Productivity Based on the Spatial Difference-in-Differences Approach: The Case of China. International Journal of Environmental Research and Public Health. 2021; 18(17):9040. https://doi.org/10.3390/ijerph18179040
Chicago/Turabian StyleWang, Susheng, Gang Chen, and Xue Han. 2021. "An Analysis of the Impact of the Emissions Trading System on the Green Total Factor Productivity Based on the Spatial Difference-in-Differences Approach: The Case of China" International Journal of Environmental Research and Public Health 18, no. 17: 9040. https://doi.org/10.3390/ijerph18179040