1. Introduction
AGD is a sustainable development plan proposed by China based on its own conditions. AGD requires agriculture to transform from a high-input development patterns to a resource-saving and environmental-friendly development patterns. It is different from agricultural sustainable development, as AGD mainly emphasizes the protection of the agricultural environment. The agricultural environment is the environment on which agricultural organisms rely for survival, development, and reproduction. It mainly includes farmland soil, agricultural water, air, and agricultural organisms. Under the high-input production patterns of traditional agriculture, the agricultural environment is easily affected by production activities. For example, air pollution in agricultural production areas, agricultural water pollution and soil pollution in farmland. Only by realizing AGD can China improve the agricultural environment and promote the high-quality development of agriculture. The realization of AGD depends on the support of national policies, and the government needs to encourage agricultural producers to change production patterns through financial subsidy and other means. Since the reform and opening-up, the Chinese government’s support policies for agriculture have been mostly aimed at stabilizing income and increasing the output of agricultural products. The pollution problem is becoming more and more serious, and achieving AGD has been hampered in China.
China is a country with frequent natural disasters and imperfect agricultural market. In order to mitigate the impact of natural risks and market risks on farmers, the government begins to implement AISP. The policy encourages farmers to participate in insurance by sharing insurance premiums [
1]. In the Administrative Measures for the Pilot Program of AISP from the Central Government, the government stipulated that farmers can receive government subsidies when purchasing specific agricultural insurance. At the beginning of the policy, the government mainly included several agricultural products which are planted in the widest range in China and have the greatest impact on people’s lives. Subsidized agricultural products include corn, rice, wheat, soybeans and cotton. In 2007, China officially carried out the pilot reform of AISP in Inner Mongolia, Jilin, Jiangsu, Hunan, Xinjiang, and Sichuan provinces. It was extended to all provinces of China in 2012. AISP does not guide subsidized farmers to adopt environmental-friendly production patterns. With the expansion of production scale, the input of production factors such as pesticides and fertilizers is increasing. The problem of handling agricultural products is also severe. China has achieved agricultural development at the cost of destroying the agricultural environment in a long period of time.
AGD is the common pursuit of many countries, but some countries have failed to achieve AGD. The main reason for this phenomenon is that the subsidy policy is not perfect. The traditional subsidy policy has failed to form a connection with AGD. Therefore, the subsidized farmers did not have the consciousness to change the production patterns and still adopted the high-input production patterns. The conflict between income growth and environmental protection has intensified. Taking China’s AISP as an example, this paper attempts to identify the impact of the subsidy policy without the guidance of the concept of AGD on the agricultural environment and farmers’ income. This will help government departments pay more attention to potential environmental problems when optimizing policies in the future, and formulate subsidy policies that take into account income growth and environmental protection. This paper also attempts to explore the ways in which policies affect the agricultural environment, and points out the role of multiple production factors. The research results can provide suggestions for the government to realize the AGD.
2. Literature Review
The research on the income effect and environmental effect shows that AISP has achieved remarkable results. The impact of AISP on farmers’ income is mainly manifested in reducing income fluctuation. Research shows that the agricultural production income of subsidized farmers is more stable after purchasing insurance [
2,
3]. Agricultural insurance can play a role in hedging risks when the grain yield or the price of grain falls [
4] and compensate farmers for losses through a compensation mechanism. AISP increases the expected value of the agricultural production income [
5]. Yu [
6,
7] found that the subsidy policy increases farmers’ income by expanding agricultural planting areas through empirical research. AISP can also play a role in transfer payments. It redistributes national income between the non-agricultural and agricultural sectors in the form of a subsidy [
8]. With the support of policies, farmers’ welfare has been improved [
9], and agricultural production losses have also been effectively controlled [
10]. AISP can also increase farmers’ income indirectly by adjusting the supply and demand of agricultural insurance. The net income that farmers can obtain after risk hedging is declining due to higher insurance premiums. Most farmers do not purchase insurance. Moral hazard and adverse selection are common problems in the insurance business, so the insurance company is unwilling to provide agricultural insurance. AISP can increases the insurance rate by sharing the insurance costs of farmers and granting insurance companies management fee subsidies. Farmers are willing to expand the scale of production after purchasing insurance, so that their income will also increase. Other scholars have researched AISP in Poland [
11], China [
12], India [
13], and the European Union [
14]. They have affirmed the role of subsidy policy in promoting farmers’ income. However, some scholars found that the subsidy policy did not positively impact farmers’ income. Take China as an example. Under the current policy of “low insurance premiums, wide coverage, low security, and low remuneration,” crop insurance has no significant impact on farmers’ income [
15]. Subsidy policy can also promote the expansion of low-quality farmland, and the risk of a decline in grain yield is becoming increasingly serious [
16].
The view that AISP can affect the agricultural environment has been confirmed in many studies. Some scholars believe that AISP is conducive to reducing the nonpoint source pollution [
17] and will not cause serious environmental pollution problems [
18,
19]. Zhong [
20] empirically studied the chemical use behavior of farmers after participating in insurance. The results show no significant causal relationship between insurance participation and the amount of chemical use. However, most studies show that the subsidy policy will have adverse effects on the environment. First, financial subsidies encourage farmers to produce in high-risk areas, which will cause damage to the ecological environment. Capitanio [
21] conducted an empirical study on the environmental effects of crop insurance subsidies, which was based on the data of 1092 farms in Puglia, southern Italy. The author believes that policy interventions to help farmers cope with risks may have adverse effects on the environment. Walters [
22] compared the environmental indicators of different insured areas and found that the insurance plan mainly affects the agricultural environment through the distribution mechanism for land. Second, subsidies have increased the use of chemicals such as pesticides and fertilizers, increasing environmental pollution [
23,
24]. As the increase in pesticide input can make the output more volatile, it is easier for farmers to obtain insurance compensation [
25]. Due to the lack of policy guidance, China’s agriculture has failed to achieve AGD. The pollution problem is particularly prominent after the implementation of AISP. For example, the gas from the disposal of agricultural products can generate air pollution [
26,
27,
28], and the use of chemicals such as pesticides can pollute soil [
29,
30]. The increasing use of fossil fuels is also an urgent problem in China. With the expansion of production scale, the demand for agricultural machineries has gradually increased, which has promoted the consumption of diesel and other fuels. Most of China’s agricultural machineries do not have exhaust gas treatment equipment, so the excessive use of agricultural machineries has led to a deterioration in air quality. The extensive treatment of straw is another significant cause of agricultural pollution. China’s annual straw production is as high as 700 million tons, and there is no effective treatment technology. In most areas, the traditional open burning method is still used to process straw, bringing massive pressure to the ecological environment.
In terms of research content, the above papers pay more attention to the direct impact of AISP. They mainly empirically tested the change in food production and fertilizer use after the implementation of AISP. Most papers ignored the environmental pollution caused by the treatment of agricultural products, and failed to fully sort out the mechanism of the policy. This paper attempts to make up for these shortcomings. In terms of the research sample, research on China’s AISP is concentrated in a few provinces. This paper selected the panel data of 316 prefecture-level cities, trying to analyze the effect of the policy from the national level. In terms of empirical methods, this paper adopts the time-varying DID method. This method is suitable for analyzing policies that have been implemented in different regions at different times.
4. Results
4.1. Benchmark Regression Analysis
The research found that AISP increased the farmers’ income and harmed the air quality. The results are shown in
Table 2. In column
a, the coefficient of
Dit was significantly positive, which indicates that AISP has a significant role in promoting the Pcni. Column
b adds control variables on the basis of column
a. The regression results show that
β1 was significant at the significance level of 1%. It confirms the income-increasing effect of AISP. Columns
c and
d test the causal relationship between AISP and PM2.5. As shown in column
c, AISP had a negative impact on the PM2.5, but the result was not significant. After adding the control variables, the coefficient of the core explanatory variable was 0.019, and it was significant at the 5% level of significance, indicating that the air quality of each city declined during the pilot period. The policy provides conditions for the farmers’ income growth by mitigating production risks. However, the government’s lack of attention to environmental issues has led to the continuous deterioration of air quality in the pilot cities.
4.2. Robustness Test
This paper used three methods to verify the accuracy of the conclusions. The first method was parallel trend testing. The second method was the placebo test. In the third method, the explained variables in Equation (1) were replaced by rural households’ average operating net income and rural households’ average property net income.
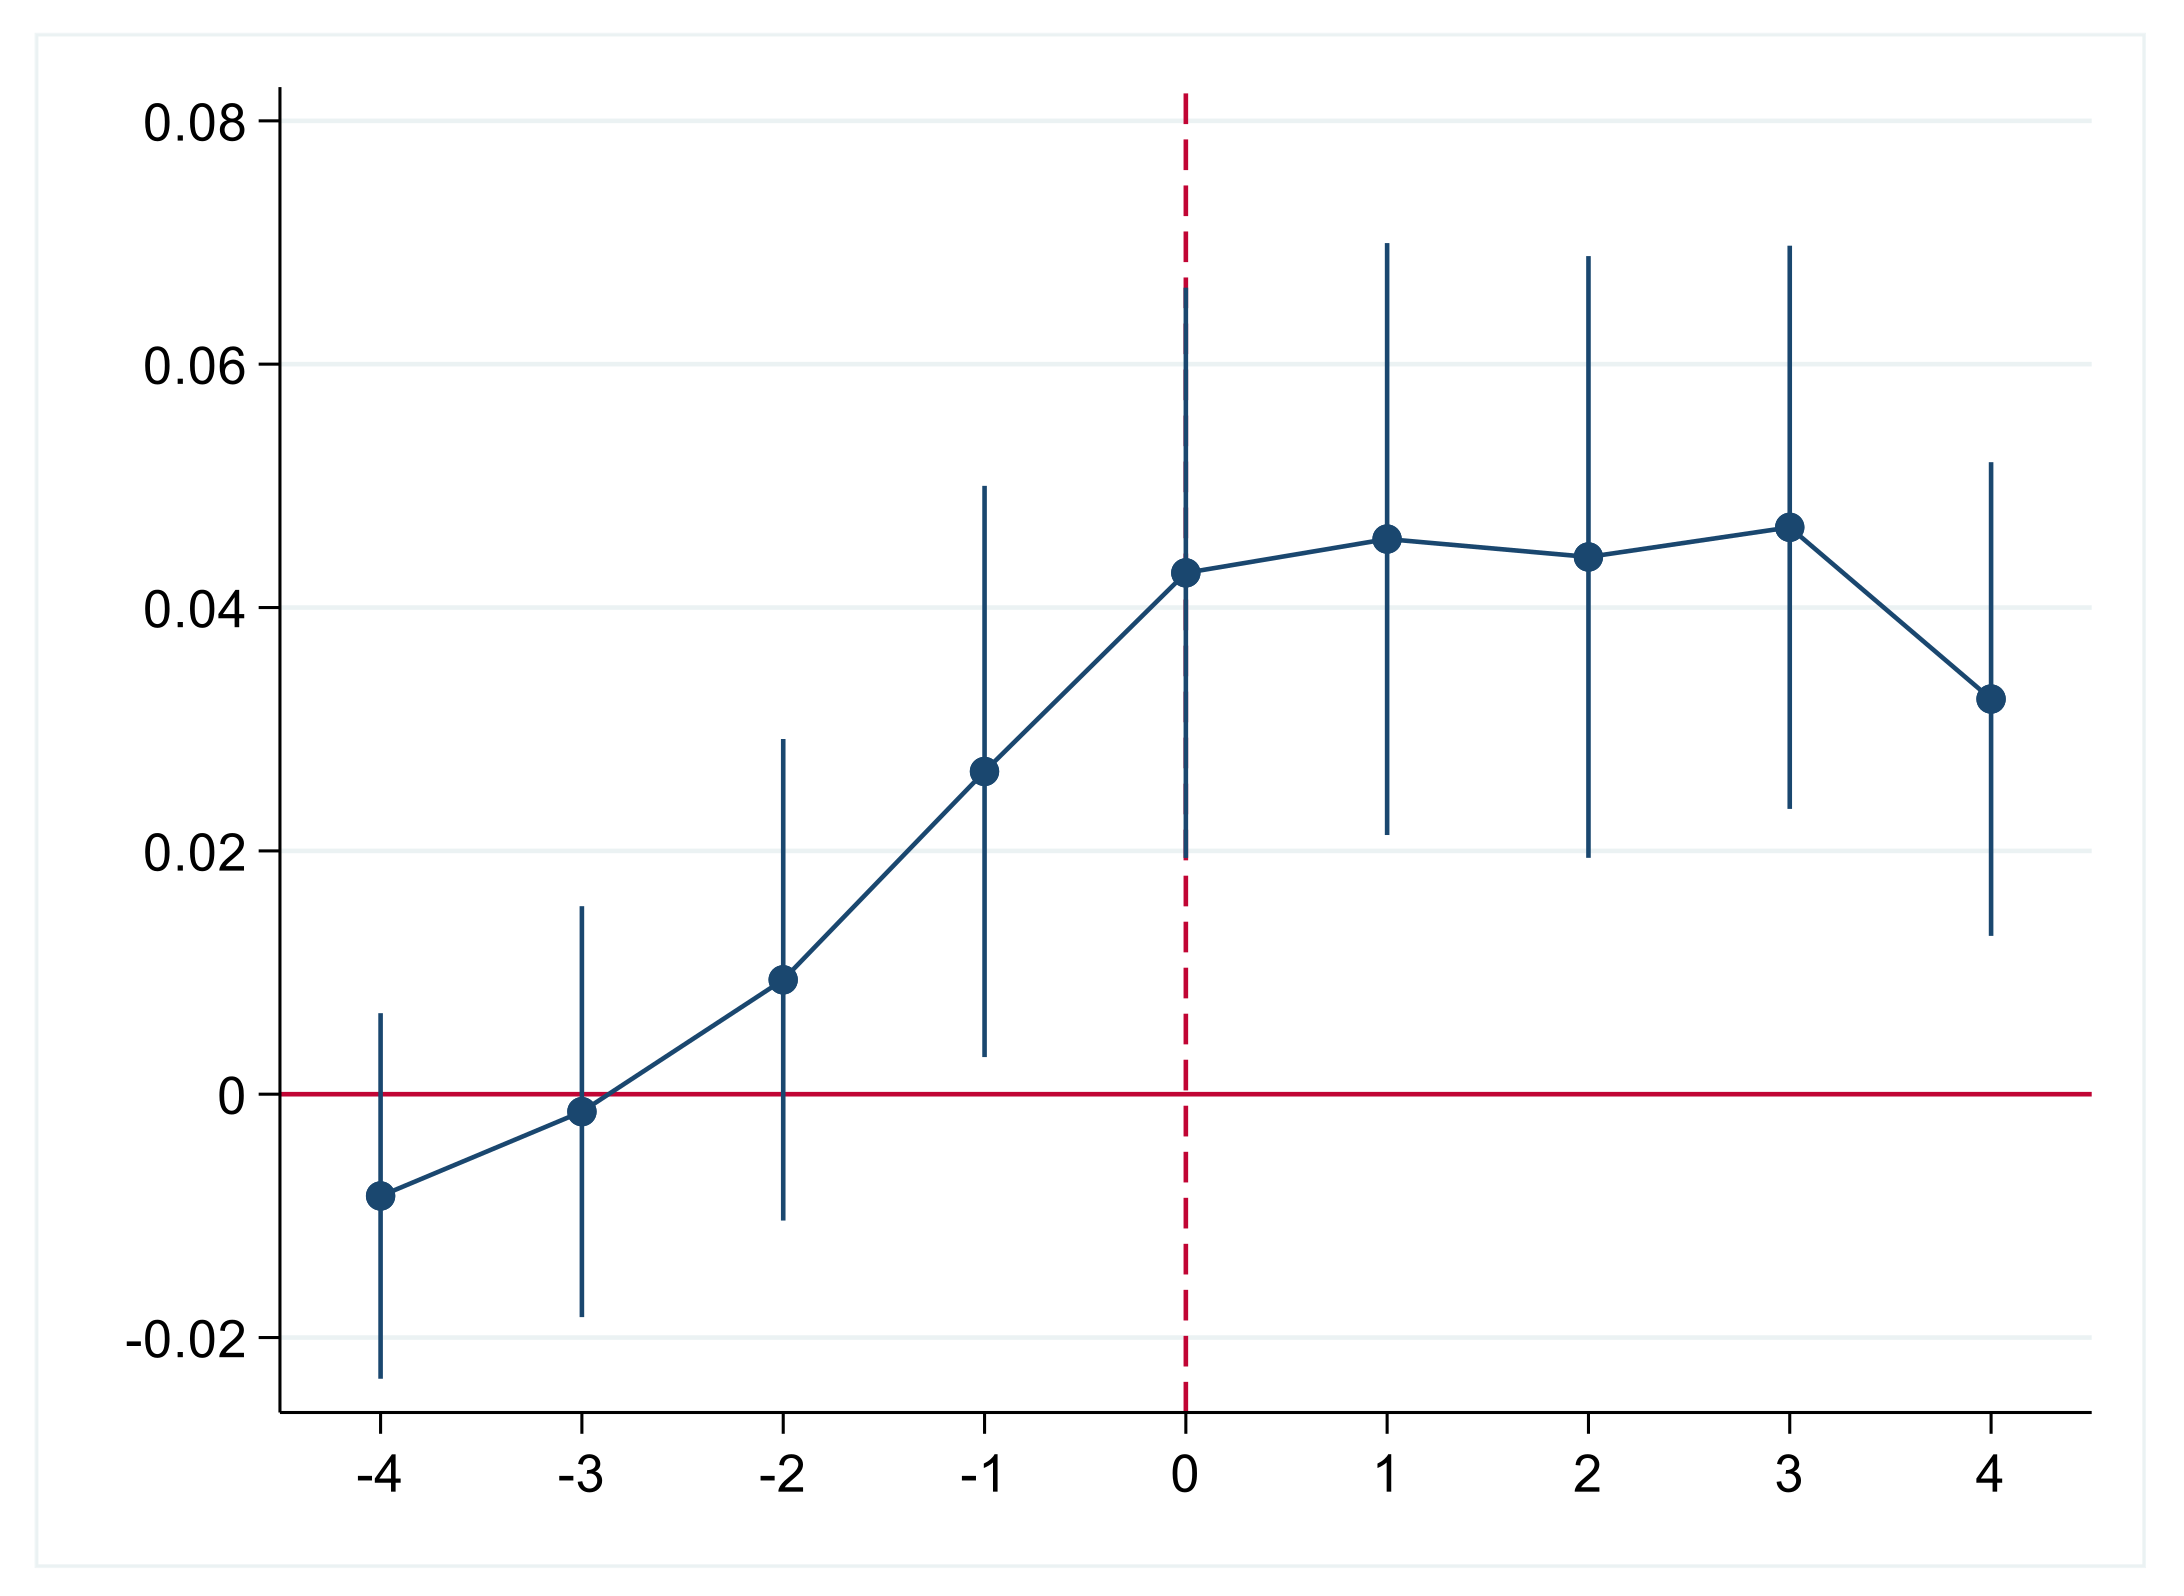
4.2.1. Parallel Trend Test
The assumption of a parallel trend is the premise for using the time-varying DID model, requiring that the Pcni in the pilot cities and non-pilot cities had the same trend of change before the implementation of AISP. Therefore, the following model was constructed to carry out a parallel trend test on the sample data. The specifics are as follows:
where
Dkit is a policy dummy variable of each city based on the policy start year. When the city is in the
kth year before the pilot,
D−kit takes the value 1, and the rest is 0. When the city is in the
kth year after the pilot,
Dkit takes the value 1, and the rest is 0. The meaning of the remaining variables remains unchanged. In
Figure 1, the estimated results of the coefficients from
D−4it to
D−2it indicated that there was no difference in the change trend of Pcni among cities before the introduction of the policy. The reason for the significant coefficient of
D−1it may be the predictability of the policy, as farmers predicted the direction of the future policy development and responded in advance. Farmers have a lower expected value of production risk when they know that AISP will be implemented in their area. Therefore, farmers expand the scale of production in advance to gain more benefits. Overall, the test results basically met the parallel trend hypothesis.
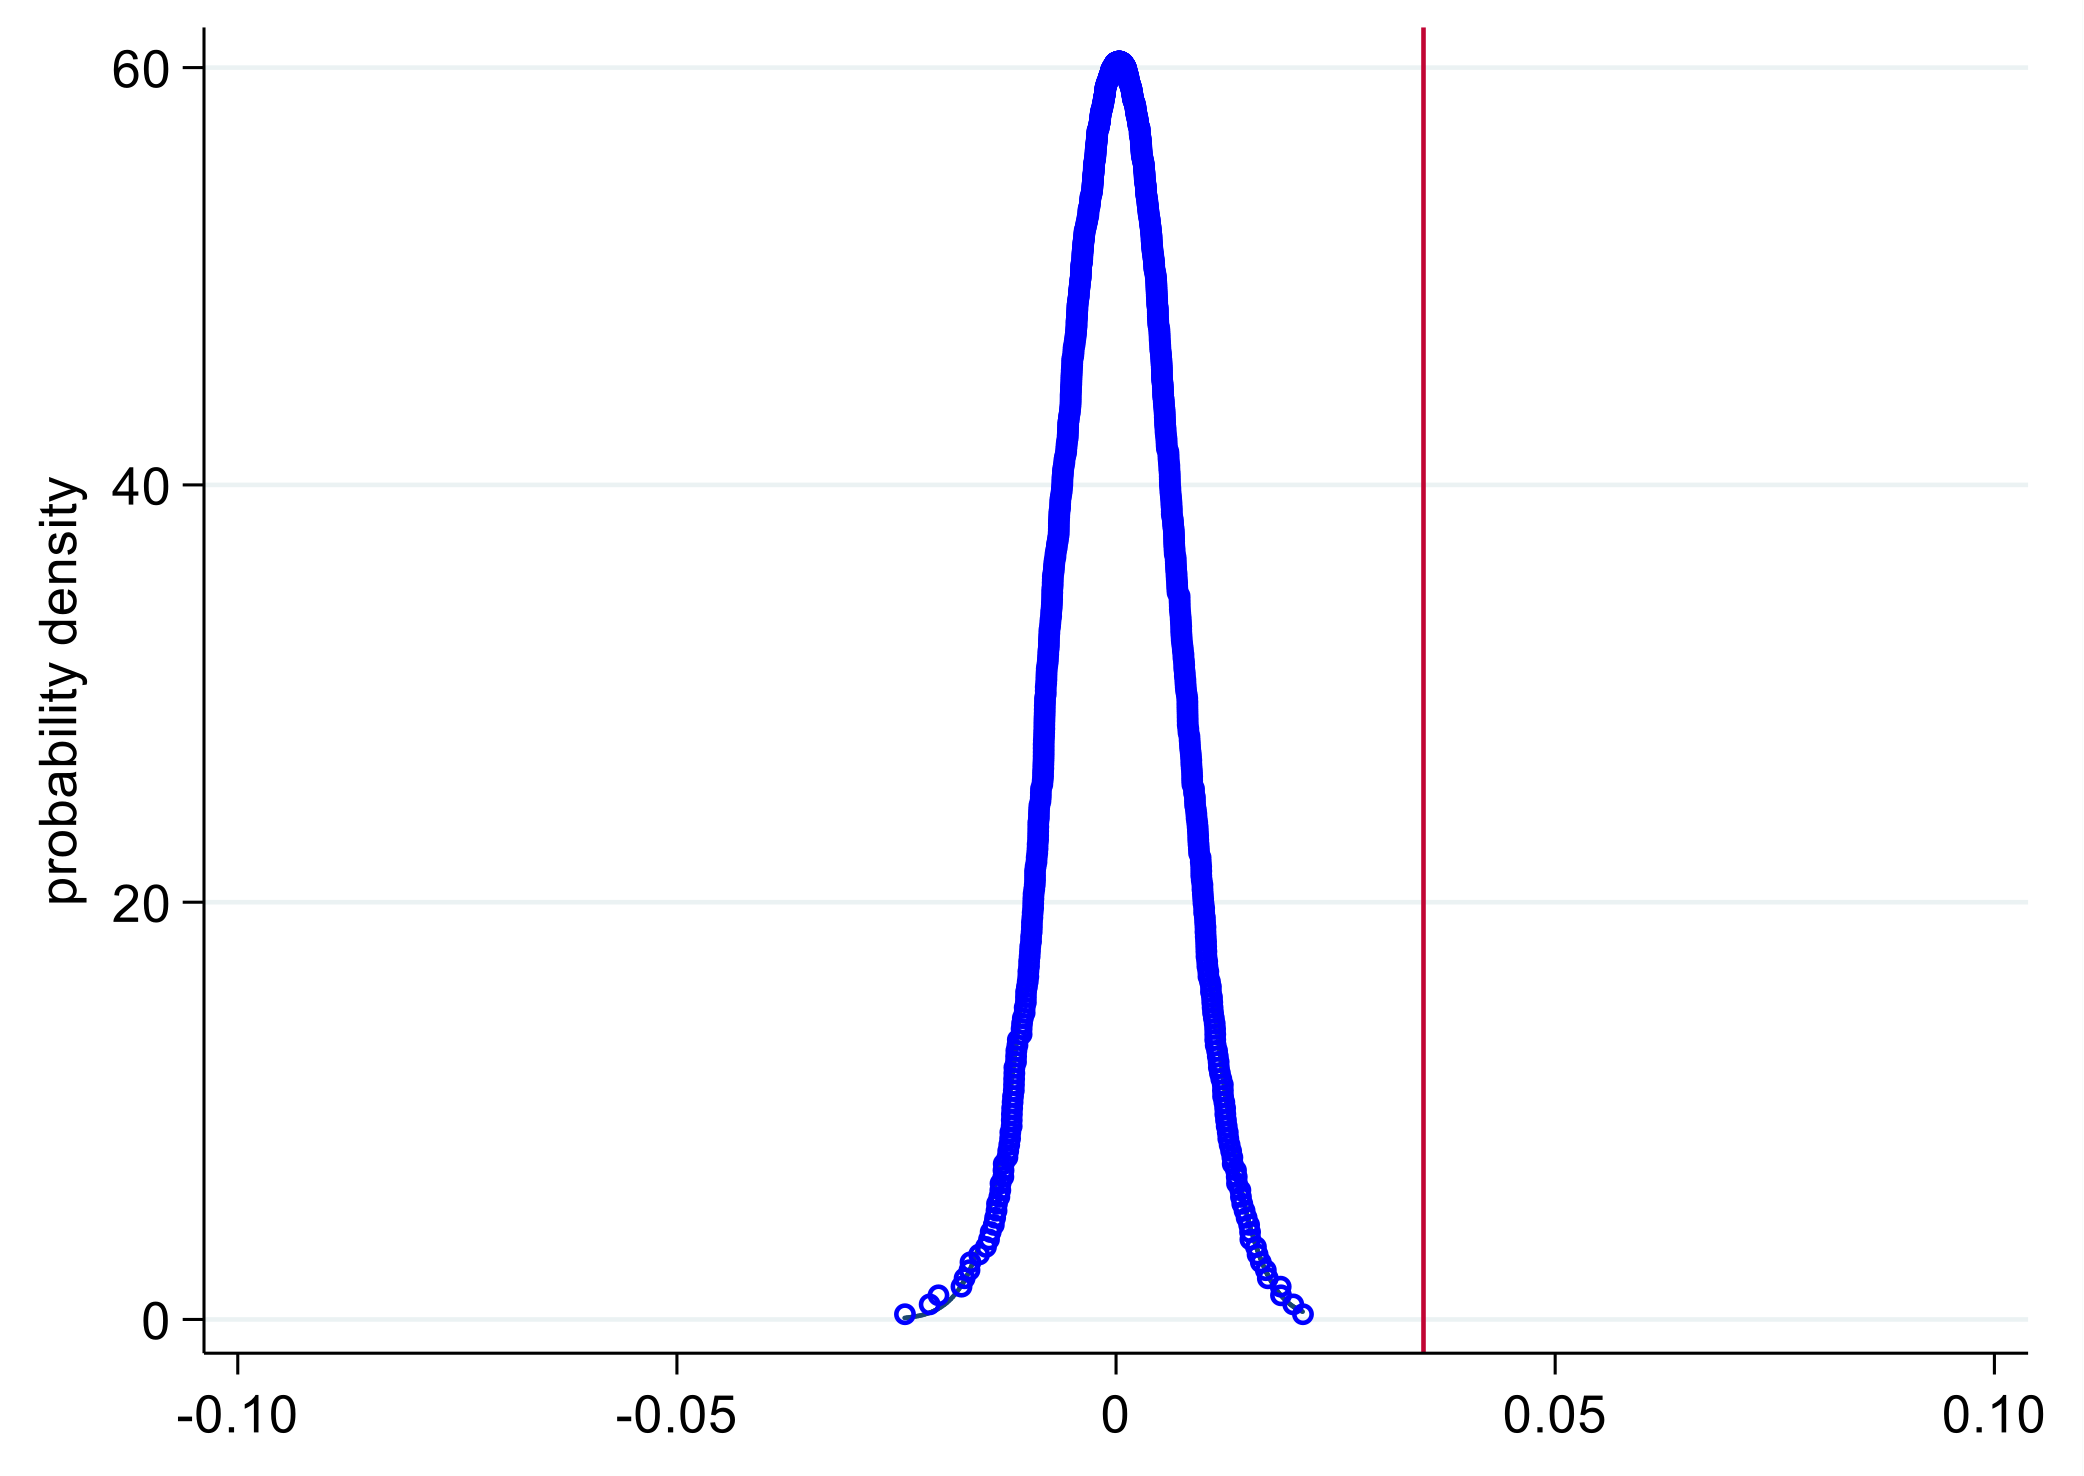
4.2.2. Placebo Test
Considering the characteristics of the step-by-step pilot of AISP, this paper conducted random non-replacement sampling according to the number of pilot cities in different years. For example, there were 78 pilot cities in 2007, so 78 cities were randomly selected from all 316 cities. This paper assumed that the selected cities began to implement AISP in 2007. Then, the “pseudo” policy dummy variable (
Dit*) was created to replace
Dit in Equation (1). After all sampling was over, a benchmark regression was performed on the new model. At this time, the order of the pilot program was different from the actual one, and AISP should not have had the effect of increasing income. The coefficient (
β1*) of the “pseudo” policy dummy variable should be close to 0. The kernel density figure of
β1* was drawn after repeating the above operation 1000 times. As shown in
Figure 2, the estimated value of
β1* was evenly distributed around 0. The red line represents the coefficient of the core explanatory variable in the actual test, which was 0.035. Under random sampling, there was no obvious policy effect. This test proved that AISP can only function under the guidance of the government’s reform plan.
4.2.3. Replace the Explained Variable
The purpose of AISP is to decrease production risks and promote agricultural development, so it does not affect the property income of rural families. Therefore, we selected rural households’ average operating net income and rural households’ average property net income as the explained variables and performed the regression test after replacing
Yit in Equation (1). The results are shown in
Table 3. In columns
a and
b, the core explanatory variable coefficients were 0.039 and 0.044, and both were significant at the 1% significance level, which shows that AISP promotes the operating income of rural families. In columns
c and
d, the coefficient of
Dit was not significant, regardless of whether the control variable wad added or not, which shows that AISP does not change the property income of rural households. In summary, the policy effect of AISP is unique and does not affect non-agricultural income.
4.3. Mechanism Analysis
The implementation of AISP gave farmers an incentive to expand production. At this time, farmers’ investment in production factors such as planting areas and agricultural machinery was conducive to achieving income growth. Large input of production factors also increases the output of agricultural products and increases the use of fossil fuels. The lack of a reasonable treatment will have adverse effects on the agricultural environment. Therefore, Mpfa and Gsa have a major impact on policy effects. To further clarify the mechanism of AISP, this paper built Equation (3) on the basis of Equation (1). The specific model is as follows:
where
Mit represents the Mpfa or Gsa.
Xit represent control variables,
ηt is the year fixed effect,
δi is the city fixed effect, and
εit is the random error term.
The research results show that policy can achieve income effects and environmental effects by encouraging farmers to increase Mpfa or Gsa.
Table 4 lists the results of the mechanism analysis. In column
a, the impact of AISP on Mpfa was 0.48, which was significant at the 1% level of significance. AISP increased the rural households’ holding of significant property fixed assets. Further analysis shows that, with the support of AISP, farmers increased their investment in major productive fixed assets, and the mechanization level of production was significantly improved, promoting the increase in the net income of rural residents. At the same time, Mpfa increased the demand for chemical fuel in agriculture. Without effective pollution treatment technology, the air quality has gradually deteriorated. In column
b, the impact of AISP on Gsa was 0.007, which was significant at the 1% significance level. AISP increased Gsa. Further analysis shows that AISP improved farmers’ income expectations. Under the compensation mechanism of insurance, the expected future income of agricultural production is significantly improved and more stable. Farmers can improve their income level by increasing Gsa. In addition, the development of green agricultural technology in rural areas is uneven, and farmers’ environmental awareness is not strong. Therefore, it is difficult to solve the straw problem caused by the increase in Gsa, and the excessively rapid increase in the amount of straw burned has aggravated air pollution.
4.4. Heterogeneity Test
There are obvious regional development differences in China, so the policy effects of different regions may be heterogeneous. To test whether the effects of AISP are heterogeneous, this paper introduced the interaction term (Dit × Groupi) in Equation (1), where Groupi is the grouping variable. This paper used four classification methods. Eastern China generally develops faster than that of other regions, and it has a better economic foundation. This difference may bring about different income effects. Therefore, in the first classification method, the model divided the samples according to geographic location. When the city is in Eastern China, the value of Groupi was 1, and the rest was 0. The jurisdictions of some cities in China contain large grain-producing areas, so they are more susceptible to income effects from AISP. In the second classification method, the value of Groupi was 1 for cities with large grain-producing areas in the jurisdiction and 0 for the rest. China’s annual straw production is unevenly distributed in space, so the environmental effects of AISP may be different. In the third classification method, the sample was classified based on administrative location and straw yield. Among all administrative regions, East China had the largest straw yield, so the value of Groupi was 1 for the prefecture-level cities in East China, and the rest were 0. In the fourth classification method, the paper arranged the prefecture-level cities in ascending order according to the proportion of the primary industry to GDP in 2006. For the top 50% of the prefecture-level cities, Groupi took the value 1, and for the rest it was 0. The purpose was to verify whether the environmental effects of AISP are more obvious in areas where agriculture accounts for a relatively high proportion of the regional economy.
The results of the study are shown in
Table 5. Column
a shows the regression results of the first classification method. AISP had a significant positive impact on the Pcni in each city. On this basis, the coefficient of the interaction term was −0.022, and it was significant at the 10% significance level. That shows that compared with the eastern region, the policy effect in the central and western regions was better. It may be that regions with slow development are more likely to be influenced by AISP. Column
b shows the regression result of the second classification method. The coefficient of
Dit was also significantly positive, and it proves that the income-increasing effect of AISP was universal. On this basis, the coefficient of the interaction term was 0.038, which was significant on the 1% level of significance, indicating that regions with a higher grain output are more likely to increase production and income under the incentives of AISP. Column
c shows the regression result of the third classification method. The coefficient of
Dit was significantly positive, proving the causal relationship between AISP and air pollution. The coefficient of the interaction term was 0.033, which was significant at the 1% level of significance, indicating that areas with large straw production have more serious air pollution during the period of AISP. Column
d shows the regression result of the fourth classification method. The coefficient of the interaction term was −0.021. On this basis,
β1 was significantly positive, which was significant at the 5% significance level. The areas where the primary industry occupies a large proportion have a larger scale of agricultural production. The yield of straw and the holding of agricultural machineries are much higher than those in other areas. Therefore, air pollution problems in these areas have become more significant after the implementation of AISP.
5. Discussion
Based on the practice of China’s AISP, this paper using time-varying DID to identify the policy effect. When researching the income effect of AISP, this paper finds that AISP promoted the income growth of farmers. The research method used in this paper was similar to that of Zhao [
15], but the conclusions are quite different. Zhao [
15] uses a research method that combines propensity score matching and DID. The author believes that AISP has not significantly increased farmers’ income. The reason for the difference in conclusions may be that the paper [
15] only selects the data of farmers in Inner Mongolia as the sample. Different regions have different levels of agricultural development and development patterns. Research on the effects of AISP in only one province may underestimate the actual effects of policy. In the mechanism analysis, this paper selects variables different from Yu [
6,
7]. Yu [
6,
7] uses the crop planting area to analyze the policy mechanism. On the basis of the aforementioned article, this paper addes Mpfa to the mechanism analysis. The final conclusions confirm that the subsidy policy can affect the income of farmers through these variables.
By analyzing the environmental effects of AISP, the conclusions drawn in this paper are the same as Capitanio [
21]. The government helps farmers mitigate production risks through subsidy policy, which indirectly leads to extensive production and environmental pollution. After the policy is issued, the disposal of agricultural products puts pressure on the agricultural environment. The increase in demand for production factors has also generated air pollution problems. The contradiction between agricultural development and environmental protection has increased. This paper also finds that there are regional differences in the environmental effects of AISP. The empirical results show that areas with higher straw production or a higher proportion of the primary industry in GDP are more significantly affected by AISP. The scale of agricultural production in these areas was high before the implementation of the policy, and the use of agricultural machineries and fossil fuels was much higher than in other areas. Based on policy support, these areas have sufficient foundations to expand production scale, which aggravate environmental pollution. The conclusion that the expansion of production scale can lead to environmental pollution has also been confirmed in the research of Smith [
23].
6. Conclusions
From the perspective of the environment, the treatment of crop straw needs the government’s attention during the implementation of the policy. In empirical studies, PM2.5 in areas with high straw yields is more susceptible to policy influences. The reason is the lack of technology and facilities for processing straw in rural areas. AISP should not only aim at increasing food production, but also highlight the importance of environmental protection. The government should appropriately raise the subsidy standard for farmers who actively use straw processing equipment or adopt environmental-friendly production patterns. This measure is conducive to the realization of the combination of subsidy policy and environmental protection. The paper also finds that a large amount of investment in agricultural machineries is the cause of environmental pollution. The government needs to set up special machineries purchasing subsidies and promote energy-saving and environmental-friendly agricultural facilities in rural areas.
From the perspective of income, AISP has achieved the goal of income growth by expanding the scale of production. The government should continue to expand the scope of AISP. Most large grain-producing areas are located in central and western China, and local farmers rely on grain production as a source of income. These farmers face greater income risks, and AISP is particularly important to them. The empirical results also showed that the income growth level of farmers in this region is higher than that in the eastern region, so the government should increase the subsidy standards for these areas.


