
Review of Associations between Built Environment Characteristics and Severe Acute Respiratory Syndrome Coronavirus 2 Infection Risk

 ,
,  ,
,
Abstract
:1. Introduction
1.1. Coronavirus Disease 2019
1.2. Major Factors Associated with SARS-CoV-2 Infection
1.3. Our Contributions
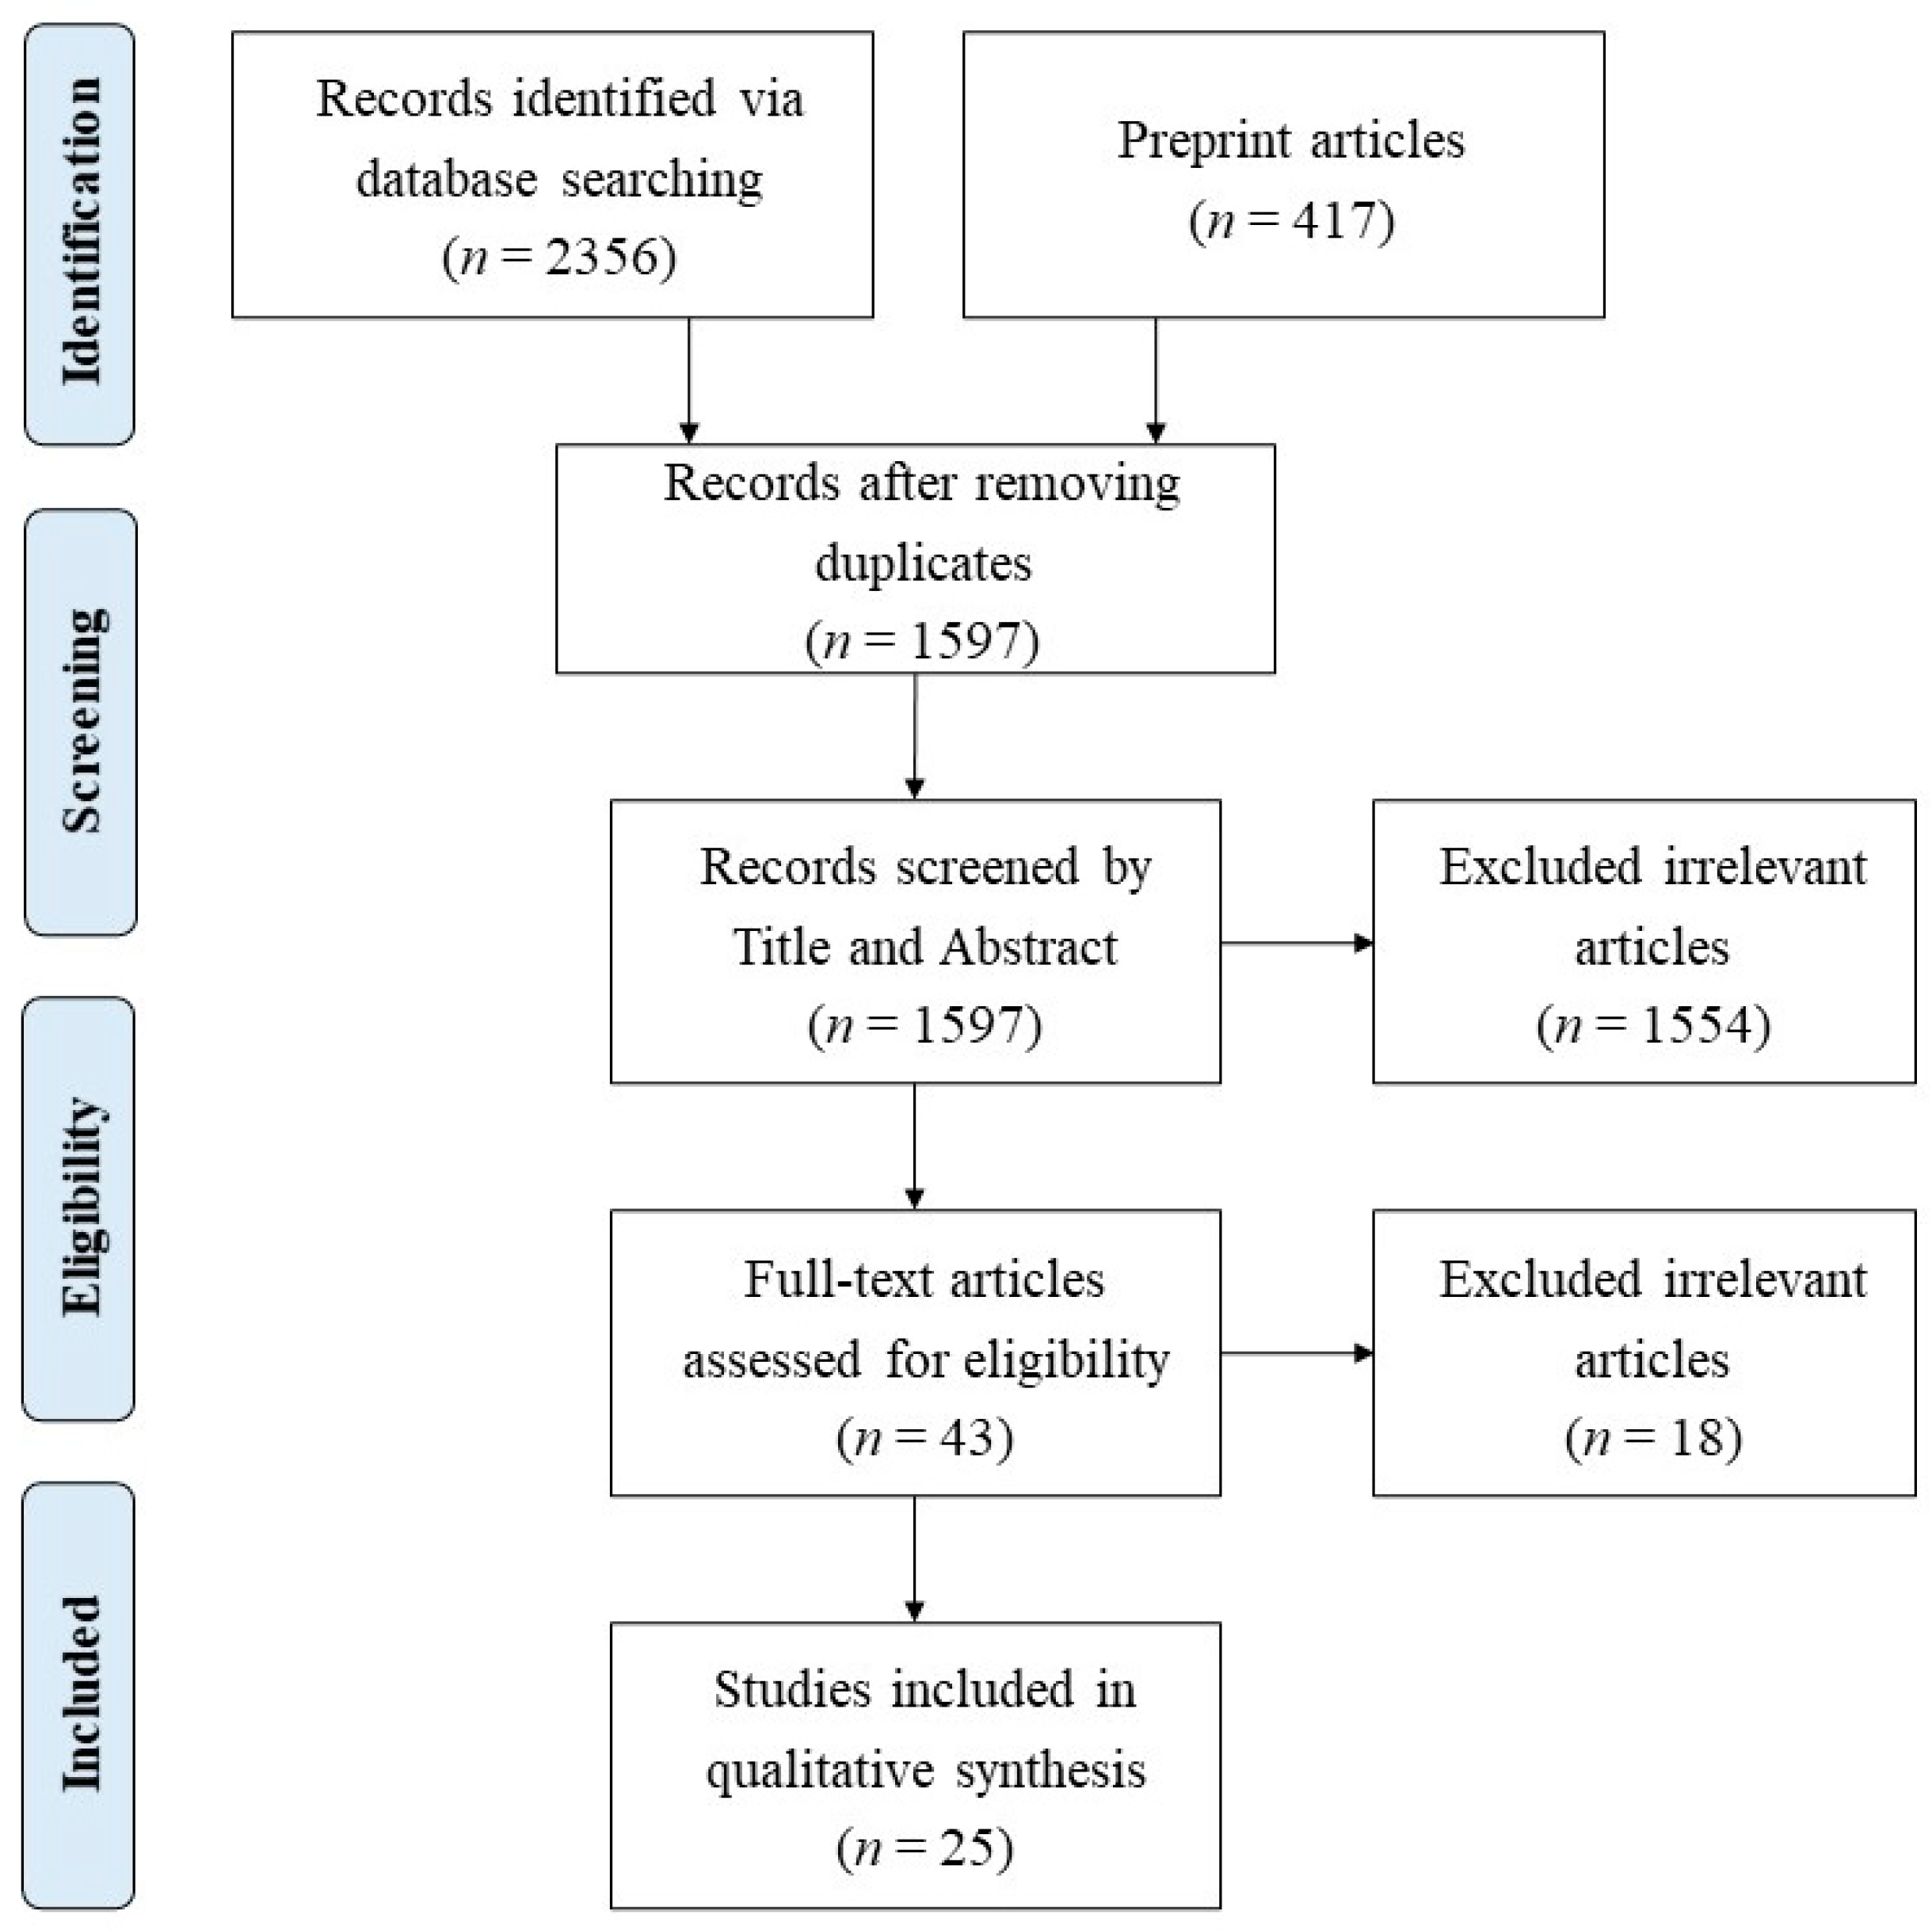
2. Methods
- Examined the association between COVID-19 and certain aspects of the built environment;
- Were written in English; and
- Were not letters, notes, opinions, commentaries, or reviews.
3. Results
3.1. Study Characteristics
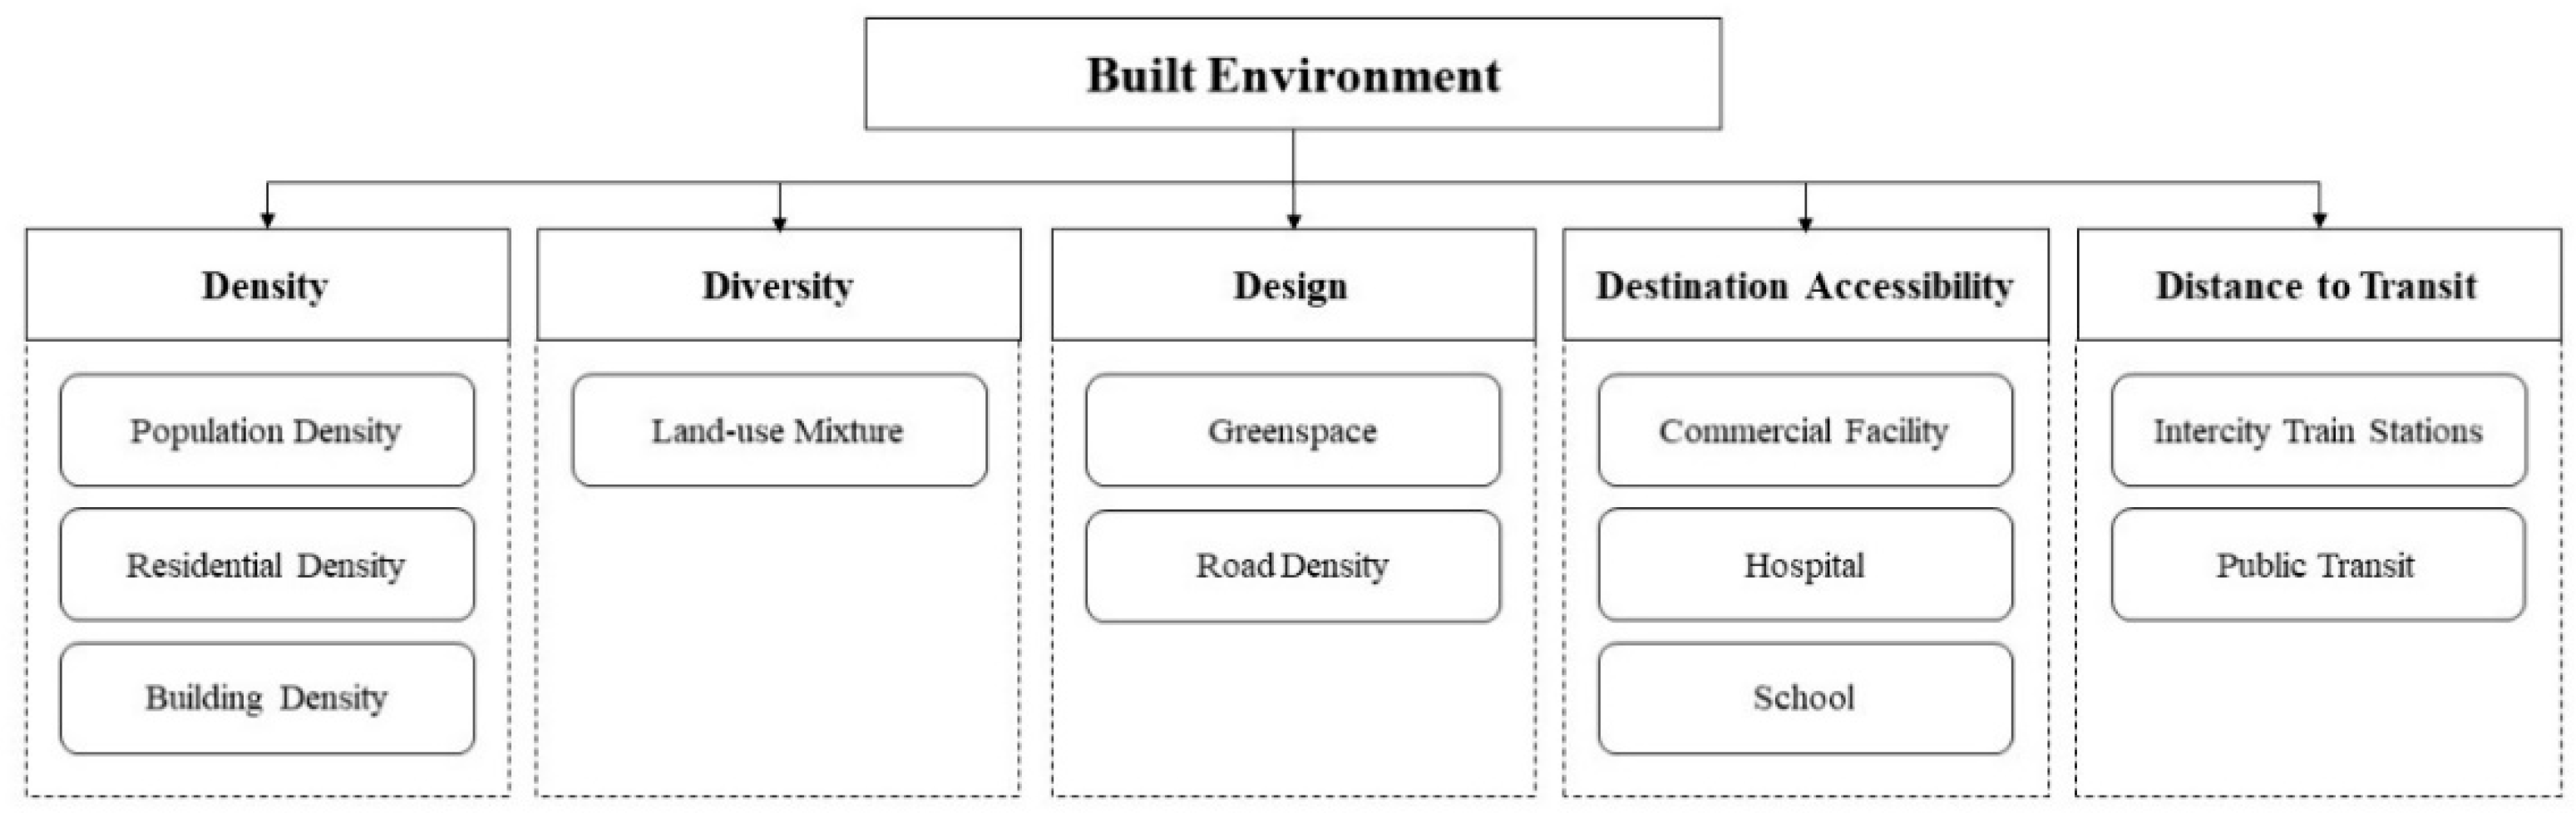
3.2. Built Environment Metrics
3.3. COVID-19 Metrics
3.4. Associations between the Built Environment and SARS-CoV-2 Infection
4. Discussion
4.1. Major Findings
4.1.1. Commercial Facility Density
4.1.2. School Density
4.1.3. Road Density
4.1.4. Accessibility to Public Transit
4.1.5. Availability of Green Space
4.1.6. Urban Density
4.1.7. Hospital Density
4.2. Recommendations for Future Studies
5. Conclusions
Funding
Institutional Review Board Statement
Informed Consent Statement
Data Availability Statement
Conflicts of Interest
Appendix A

| No. | References | Country | Study Design | Geographical Unit | Sample Size (n) | COVID-19 Metrics | Built Environment Metrics | Data Analysis | Results |
|---|---|---|---|---|---|---|---|---|---|
| 1 | Li, Peng [30] | China | Cross-sectional | 1000 m buffer of COVID-19 cluster | 639 | Cluster size | 1. Building density 2. Number of commercial facilities 3. Number of medical services | Structural equation model | Commercial vitality has a significant impact on the number of confirmed cases in an infectious cluster. |
| 2 | Yip, Huang [31] | China | Cross-sectional | Town Planning Unit (TPU) | 154 | Case number | 1. Distance/number to clinics 2. Distance/number to restaurants 3. Distance/number to markets 4. Distance/number to metro stations 5. Population density | 1. Cox proportional hazards regression 2. Ordinary least squares 3. Negative binomial regression | 1.The data is divided into two phases before (Phase 1) and during the social distancing measure was relaxed (Phase 2). In Phase 1, clinics and restaurants are more likely to influence the prevalence of COVID-19. In Phase 2, public market, public transportation, and the clinics influence the prevalence of COVID-19. 2. In Phase 1, the areas of tertiary planning units with more restaurants are found to be positively associated with the period of the prevalence of COVID-19. In Phase 2, restaurants and public markets induce long time occurrence of the COVID-19. 3.In Phase 1, restaurant and public markets are the two built environments that influence the number of COVID-19 confirmed cases. In Phase 2, the number of restaurants is positively related to the number of COVID-19 reported cases. |
| 3 | Credit [32] | US | Cross-sectional | Zip code | - | Incidence | 1. Population density 2. Hospital accessibility score | Ordinary least squares | Population density is negatively associated with COVID-19 infection rates at the neighbourhood-level. |
| 4 | DiMaggio, Klein [33] | US | Cross-sectional | Zip code | 177 | Case number | 1. Population density 2. Housing density 3. School density | Bayesian hierarchical Poisson spatial models | Risk was approximately doubled by environmental characteristics such as population and housing density. |
| 5 | Hamidi, Sabouri [34] | US | Cross-sectional | County | 913 | Incidence | Activity density (population + employment) | Structural equation model | After controlling for metropolitan population, county density is not significantly related to the infection rate. |
| 6 | Gaskin, Zare [35] | US | Cross-sectional | County | 3132 | Case number | 1. Population density 2. Distance/number to airports 3. Number of train stations | 1. Negative binomial regressions 2. Cox regressions | The number of COVID-19 cases is positively related to proximity to airports. |
| 7 | Hu, Yue [36] | US | Cross-sectional | Town | 357 | Incidence | Road density | 1. Spatial lag model 2. Spatial error model | Road density is significant explanatory variables. |
| 8 | Huang, Kwan [37] | China | Cross-sectional | TPU | 291 | Incidence | 1. Population density 2. Residential density 3. Building height 4. Transport facility density 5. Land-use diversity | 1. Global Poisson regression 2. Geographically weighted Poisson regression | 1. Private residential density, transport facility density and building height have positive association with COVID-19 incidence. 2. Population density and land-use diversity have negative association with COVID-19 incidence. |
| 9 | Jin, Leng [38] | China | Cross-sectional with case-control | Neighbourhood | 4329 (experiment) 17,316 (control) | Case number | 1. Number of restaurants 2. Number of shopping centres 3. Number of hotels 4. Number of living facilities 5. Number of recreational facilities 6. Number of public transits 7. Number of educational institutions 8. Number of health service facilities | Multivariable logistic regression models | 1. Having more restaurants, shopping centres, hotels, living facilities, recreational facilities, public transits, educational institutions, and health service facilities was associated with significantly higher odds of having COVID-19 cases in a neighbourhood. 2. The associations for restaurants, hotels, recreational, and education facilities were more pronounced in cities with fewer than six million people than those in larger cities. |
| 10 | Johnson, Hordley [39] | England | Cross-sectional | Local authority | 299 | Incidence | 1. Availability of greenspace 2. Population density | Linear mixed effect models | After accounting for known mechanisms behind transmission rates, we found that park use decreased residual pre-peak case rates, especially when greenspace was low and contiguous. |
| 11 | Klompmaker, Hart [40] | US | Cross-sectional | County | 3089 | Incidence | NDVI | Negative binomial mixed models | 1. An increase of 0.1 in NDVI was associated with a 6% decrease in COVID-19 incidence rate. 2. Associations with COVID-19 incidence were stronger in counties with high population density and in counties with stay-at-home orders. |
| 12 | Li, Zhou [41] | China | Cross-sectional | Community | 1025 | Incidence | 1. Hospital density 2. Commercial facility density 3. Subway station density 4. Land-use mixture 5. Road density 6. FAR | 1. Ordinary least squares model 2. Geographically weighted regression model | 1. The distribution and density of major hospitals exerted a positive association with the epidemic situation. 2. The density of commercial facilities was the most prevalently distributed factor over the city that presented a positive association with the epidemic severity. |
| 13 | Liu [42] | China | Cross-sectional | City | 312 | Case number | 1. Subway lines length 2. Per capita greenspace 3. Population density | Ordinary least squares model | 1. Subway was positively connected with the virus transmission. 2. Population density was negatively associated with the spread of COVID-19 at the early stage of the epidemic. |
| 14 | Hamidi, Ewing [43] | US | Longitudinal | County | 1165 | Incidence | Population density | Multilevel Linear Model | After controlling for metropolitan size and other confounding variables, county density leads to significantly lower infection rates. |
| 15 | Ibrahim, Mohammed Eid [28] | Multiple conutries | Cross-sectional | Country | 50 | Case number | Population density | Stringency index model | Population density was found to be not a significant contributor in controlling COVID-19 epidemic in the very first month of spread. |
| 16 | Nguyen, Huang [44] | US | Cross-sectional | Zip code | 30556 | Case number | Land-use mixture | Poisson regression models | Indicators of mixed land use was connected with higher COVID-19 cases. |
| 17 | Rahman, Zafri [45] | Bangladesh | Cross-sectional | District | - | Incidence | Road density | 1. Ordinary least squares model 2. Spatial lag model 3. Spatial error model4. Geographically weighted regression model | Road density had no significant influence on the occurrence rates of COVID-19. |
| 18 | Scarpone, Brinkmann [46] | Germany | Cross-sectional | County | 401 | Incidence | Access to long-distance train stations | 1. Geospatial analysis heuristic 2. Geographical interpretation 3. Bayesian machine learning analysis 4. Generalised Additive Model | There appeared to be no significant observable partial dependence for long-distance train stations. |
| 19 | Ma, Li [47] | China | Cross-sectional | Town | 2994 | Incidence | 1. Density of elementary and middle schools 2. Commercial facility density 3. Density of road intersections 4. Hospital density | 1. Random forest approach 2. Bivariate local indicators of spatial association | The density of convenience shops, supermarkets, and shopping malls was one of the most important factors to infection cases. |
| 20 | You, Wu [48] | China | Cross-sectional | District | 13 | Incidence | 1. Population density 2. Public green space density 3. Hospital density | 1. Pearson correlation analysis 2. Spatial lag model 3. Spatial lag model | 1. Increasing population density and public green space density were associated with an increased COVID-19 morbidity rate. 2. Increasing hospital density was associated with a decreased COVID-19 morbidity rate. |
| 21 | You and Pan [49] | US | Cross-sectional | County | 989 | Case number | 1. Percentage of Urban Vegetation 2. Population density | Path analysis model | Each 1% increase in the percentage of urban vegetation will lead to a 2.6% decrease in cumulative COVID-19 cases. |
| 22 | Li, Ma [50] | China | Cross-sectional | City | 255 | Incidence | 1. Centrality of railway stations 2. Population density | Mixed geographically weighted regression model | The associations are positive for the density of the POIs around railway stations. |
| 23 | Tribby and Hartmann [51] | England | Cross-sectional | ZIP code | 144 | Incidence | 1. Population density 2. Density of park | 1. Ordinary least squares model 2. Geographically weighted regression model | Population per square kilometre was negatively associated with case rates. |
| 24 | Kan, Kwan [52] | China | Cross-sectional | Large Street Block Group | 1622 | Case number | 1. Density of commercial land 2. NDVI 3. Population density | Space-time scan statistic | More green spaces and lower commercial land density are linked to a higher risk for the residences of confirmed cases. |
| 25 | Sy, White [53] | US | Cross-sectional | County | 1151 | Basic reproductive number | Population density | Linear mixed models | Counties with greater population density have greater rates of transmission of SARS-CoV-2, likely due to increased contact rates in areas with greater density. |
References
- WHO. WHO Director-General’s Opening Remarks at the Media Briefing on COVID-19—11 March 2020. 2020. Available online: https://www.who.int/director-general/speeches/detail/who-director-general-s-opening-remarks-at-the-media-briefing-on-covid-19---11-march-2020 (accessed on 21 June 2021).
- WHO. WHO Coronavirus Disease (COVID-19) Dashboard. 2021. Available online: https://covid19.who.int/?gclid=Cj0KCQiApsiBBhCKARIsAN8o_4jdYdBtZvwv-k_yQ08IanJ40b4umaZj-yBUY_N3722Q_fTZ0_baz1kaAjdwEALw_wcB (accessed on 21 June 2021).
- Jayaweera, M.; Perera, H.; Gunawardana, B.; Manatunge, J. Transmission of COVID-19 virus by droplets and aerosols: A critical review on the unresolved dichotomy. Environ. Res. 2020, 188, 109819. [Google Scholar] [CrossRef] [PubMed]
- Galbadage, T.; Peterson, B.M.; Gunasekera, R.S. Does COVID-19 Spread through Droplets Alone? Front. Public Health 2020, 8, 163. [Google Scholar] [CrossRef] [Green Version]
- Gautam, S.; Hens, L. COVID-19: Impact by and on the environment, health and economy. Environ. Dev. Sustain. 2020, 22, 4953–4954. [Google Scholar] [CrossRef]
- Sarkodie, S.A.; Owusu, P.A. Global assessment of environment, health and economic impact of the novel coronavirus (COVID-19). Environ. Dev. Sustain. 2021, 23, 5005–5015. [Google Scholar] [CrossRef]
- Duque, R.B. Black Health Matters Too horizontal ellipsis Especially in the Era of COVID-19: How Poverty and Race Converge to Reduce Access to Quality Housing, Safe Neighborhoods, and Health and Wellness Services and Increase the Risk of Co-morbidities Associated with Global Pandemics. J. Racial Ethn. Health Disparit. 2020. [Google Scholar] [CrossRef]
- Kaufman, H.W.; Niles, J.K.; Nash, D.B. Disparities in SARS-CoV-2 Positivity Rates: Associations with Race and Ethnicity. Popul. Health Manag. 2020. [Google Scholar] [CrossRef]
- Ruprecht, M.M.; Wang, X.; Johnson, A.K.; Xu, J.; Felt, D.; Ihenacho, S.; Stonehouse, P.; Curry, C.W.; DeBroux, C.; Costa, D.; et al. Evidence of Social and Structural COVID-19 Disparities by Sexual Orientation, Gender Identity, and Race/Ethnicity in an Urban Environment. J. Hered. 2021, 98, 27–40. [Google Scholar] [CrossRef]
- Sobral, M.F.F.; Duarte, G.B.; da Penha Sobral, A.I.; Marinho, M.L.; de Souza Melo, A. Association between climate variables and global transmission oF SARS-CoV-2. Sci. Total Environ. 2020, 729, 138997. [Google Scholar] [CrossRef]
- Pirouz, B.; Shaffiee Haghshenas, S.; Pirouz, B.; Shaffiee Haghshenas, S.; Piro, P. Development of an Assessment Method for Investigating the Impact of Climate and Urban Parameters in Confirmed Cases of COVID-19: A New Challenge in Sustainable Development. Int. J. Environ. Res. Public Health 2020, 17, 2801. [Google Scholar] [CrossRef] [Green Version]
- Afshordi, N.; Holder, B.; Bahrami, M.; Lichtblau, D. Diverse local epidemics reveal the distinct effects of population density, demographics, climate, depletion of susceptibles, and intervention in the first wave of COVID-19 in the United States. medRxiv 2020, arXiv:2007.00159. [Google Scholar]
- Zaki, N.; Alashwal, H.; Ibrahim, S. Association of hypertension, diabetes, stroke, cancer, kidney disease, and high-cholesterol with COVID-19 disease severity and fatality: A systematic review. Diabetes Metab. Syndr. Clin. Res. Rev. 2020, 14, 1133–1142. [Google Scholar] [CrossRef]
- McKee, K.L.; Crandell, I.C.; Hanlon, A.L. County-Level Social Distancing and Policy Impact in the United States: A Dynamical Systems Model. JMIR Public Health Surveill. 2020, 6, e23902. [Google Scholar] [CrossRef]
- Castex, G.; Dechter, E.; Lorca, M. COVID-19: The impact of social distancing policies, cross-country analysis. Econ. Disaster Clim. Chang. 2020, 5, 135–159. [Google Scholar] [CrossRef] [PubMed]
- Rapoport, A. Spatial organization and the built environment. In Companion Encyclopedia of Anthropology: Humanity, Culture and Social Life; Routledge: Oxon, UK, 1994; pp. 460–502. [Google Scholar]
- Renalds, A.; Smith, T.H.; Hale, P.J. A Systematic Review of Built Environment and Health. Fam. Community Health 2010, 33, 68–78. [Google Scholar] [CrossRef]
- Jackson, R.J.; Dannenberg, A.L.; Frumkin, H. Health and the Built Environment: 10 Years after. Am. J. Public Health 2013, 103, 1542–1544. [Google Scholar] [CrossRef] [PubMed]
- Lee, I.-M.; Ewing, R.; Sesso, H.D. The Built Environment and Physical Activity Levels: The Harvard Alumni Health Study. Am. J. Prev. Med. 2009, 37, 293–298. [Google Scholar] [CrossRef] [Green Version]
- Evans, G.W. The Built Environment and Mental Health. J. Hered. 2003, 80, 536–555. [Google Scholar] [CrossRef] [PubMed]
- Frank, L.D.; Iroz-Elardo, N.; MacLeod, K.; Hong, A. Pathways from built environment to health: A conceptual framework linking behavior and exposure-based impacts. J. Transp. Health 2019, 12, 319–335. [Google Scholar] [CrossRef]
- Ewing, R.; Cervero, R. Travel and the built environment: A meta-analysis. J. Am. Plan. Assoc. 2010, 76, 265–294. [Google Scholar] [CrossRef]
- Feng, J.; Glass, T.A.; Curriero, F.C.; Stewart, W.F.; Schwartz, B.S. The built environment and obesity: A systematic review of the epidemiologic evidence. Health Place 2010, 16, 175–190. [Google Scholar] [CrossRef]
- Saelens, B.E.; Handy, S.L. Built environment correlates of walking: A review. Med. Sci. Sports Exerc. 2008, 40, S550–S566. [Google Scholar] [CrossRef] [Green Version]
- Lai, K.Y.; Webster, C.; Kumari, S.; Sarkar, C. The nature of cities and the COVID-19 pandemic. Curr. Opin. Environ. Sustain. 2020, 46, 27–31. [Google Scholar] [CrossRef]
- Megahed, N.A.; Ghoneim, E.M. Antivirus-built environment: Lessons learned from COVID-19 pandemic. Sustain. Cities Soc. 2020, 61, 102350. [Google Scholar] [CrossRef] [PubMed]
- Dietz, L.; Horve, P.F.; Coil, D.A.; Fretz, M.; Eisen, J.A.; Van Den Wymelenberg, K. 2019 Novel Coronavirus (COVID-19) Pandemic: Built Environment Considerations to Reduce Transmission. mSystems 2020, 5, e00245-20. [Google Scholar] [CrossRef] [Green Version]
- Ibrahim, A.M.; Eid, M.M.; Mostafa, N.N.; Bishady, N.E.-H.M.; Elghalban, S.H. Modeling the effect of population density on controlling COVID-19 initial Spread with the use of MATLAB numerical methods and stringency index model. In Proceedings of the 2020 2nd Novel Intelligent and Leading Emerging Sciences Conference (NILES), Giza, Egypt, 24–26 October 2020; Nile University; pp. 612–617. [Google Scholar]
- Moher, D.; Liberati, A.; Tetzlaff, J.; Altman, D.G. Preferred reporting items for systematic reviews and meta-analyses: The PRISMA statement. Int. J. Surg. 2010, 8, 336–341. [Google Scholar] [CrossRef] [Green Version]
- Li, B.; Peng, Y.; He, H.; Wang, M.; Feng, T. Built environment and early infection of COVID-19 in urban districts: A case study of Huangzhou. Sustain. Cities Soc. 2021, 66, 102685. [Google Scholar] [CrossRef]
- Yip, T.L.; Huang, Y.; Liang, C. Built environment and the metropolitan pandemic: Analysis of the COVID-19 spread in Hong Kong. Build. Environ. 2021, 188, 107471. [Google Scholar] [CrossRef]
- Credit, K. Neighbourhood inequity: Exploring the factors underlying racial and ethnic disparities in COVID-19 testing and infection rates using ZIP code data in Chicago and New York. Reg. Sci. Policy Pr. 2020, 12, 1249–1271. [Google Scholar] [CrossRef]
- DiMaggio, C.; Klein, M.; Berry, C.; Frangos, S. Black/African American Communities are at highest risk of COVID-19: Spatial modeling of New York City ZIP Code–level testing results. Ann. Epidemiol. 2020, 51, 7–13. [Google Scholar] [CrossRef] [PubMed]
- Hamidi, S.; Sabouri, S.; Ewing, R. Does Density Aggravate the COVID-19 Pandemic? J. Am. Plan. Assoc. 2020, 86, 495–509. [Google Scholar] [CrossRef]
- Gaskin, D.J.; Zare, H.; Delarmente, B.A. Geographic disparities in COVID-19 infections and deaths: The role of transportation. Transp. Policy 2021, 102, 35–46. [Google Scholar] [CrossRef]
- Hu, T.; Yue, H.; Wang, C.; She, B.; Ye, X.; Liu, R.; Zhu, X.; Guan, W.W.; Bao, S. Racial Segregation, Testing Site Access, and COVID-19 Incidence Rate in Massachusetts, USA. Int. J. Environ. Res. Public Health 2020, 17, 9528. [Google Scholar] [CrossRef] [PubMed]
- Huang, J.; Kwan, M.-P.; Kan, Z.; Wong, M.; Kwok, C.; Yu, X. Investigating the Relationship between the Built Environment and Relative Risk of COVID-19 in Hong Kong. ISPRS Int. J. Geo-Inf. 2020, 9, 624. [Google Scholar] [CrossRef]
- Jin, X.; Leng, Y.; Gong, E.; Xiong, S.; Yao, Y.; Vedanthan, R.; Yang, Z.; Chen, K.; Wu, C.; Yan, L. Neighborhood-Level Public Facilities and COVID-19 Transmission: A Nationwide Geospatial Study in China. medRxiv 2020. [Google Scholar] [CrossRef]
- Johnson, T.F.; Hordley, L.A.; Greenwell, M.P.; Evans, L.C. Associations between COVID-19 transmission rates, park use, and landscape structure. Sci. Total Environ. 2021, 148123. [Google Scholar] [CrossRef] [PubMed]
- Klompmaker, J.O.; Hart, J.E.; Holland, I.; Sabath, M.; Wu, X.; Laden, F.; Dominici, F.; James, P. County-level exposures to greenness and associations with COVID-19 incidence and mortality in the United States. Environ. Res. 2021, 199, 111331. [Google Scholar] [CrossRef] [PubMed]
- Li, X.; Zhou, L.; Jia, T.; Peng, R.; Fu, X.; Zou, Y. Associating COVID-19 Severity with Urban Factors: A Case Study of Wuhan. Int. J. Environ. Res. Public Health 2020, 17, 6712. [Google Scholar] [CrossRef]
- Liu, L. Emerging study on the transmission of the Novel Coronavirus (COVID-19) from urban perspective: Evidence from China. Cities 2020, 103, 102759. [Google Scholar] [CrossRef]
- Hamidi, S.; Ewing, R.; Sabouri, S. Longitudinal analyses of the relationship between development density and the COVID-19 morbidity and mortality rates: Early evidence from 1165 metropolitan counties in the United States. Health Place 2020, 64, 102378. [Google Scholar] [CrossRef]
- Nguyen, Q.C.; Huang, Y.; Kumar, A.; Duan, H.; Keralis, J.M.; Dwivedi, P.; Meng, H.-W.; Brunisholz, K.D.; Jay, J.; Javanmardi, M.; et al. Using 164 Million Google Street View Images to Derive Built Environment Predictors of COVID-19 Cases. Int. J. Environ. Res. Public Health 2020, 17, 6359. [Google Scholar] [CrossRef]
- Rahman, M.H.; Zafri, N.M.; Ashik, F.; Waliullah, M. GIS-based spatial modeling to identify factors affecting COVID-19 incidence rates in Bangladesh. medRxiv 2020. [Google Scholar] [CrossRef]
- Scarpone, C.; Brinkmann, S.T.; Große, T.; Sonnenwald, D.; Fuchs, M.; Walker, B.B. A multimethod approach for county-scale geospatial analysis of emerging infectious diseases: A cross-sectional case study of COVID-19 incidence in Germany. Int. J. Health Geogr. 2020, 19, 1–17. [Google Scholar] [CrossRef]
- Ma, S.; Li, S.; Zhang, J. The Spread of COVID-19 in China at Its Initial Stage: A Township-Level Analysis in Association with the Built Environment. SSRN Electron. J. 2020. [Google Scholar] [CrossRef]
- You, H.; Wu, X.; Guo, X. Distribution of COVID-19 Morbidity Rate in Association with Social and Economic Factors in Wuhan, China: Implications for Urban Development. Int. J. Environ. Res. Public Health 2020, 17, 3417. [Google Scholar] [CrossRef] [PubMed]
- You, Y.; Pan, S. Urban Vegetation Slows down the Spread of Coronavirus Disease (COVID-19) in the United States. Geophys. Res. Lett. 2020, 47. [Google Scholar] [CrossRef]
- Li, S.; Ma, S.; Zhang, J. Association of built environment attributes with the spread of COVID-19 at its initial stage in China. Sustain. Cities Soc. 2021, 67, 102752. [Google Scholar] [CrossRef]
- Tribby, C.P.; Hartmann, C. COVID-19 Cases and the Built Environment: Initial Evidence from New York City. Prof. Geogr. 2021, 1–12. [Google Scholar] [CrossRef]
- Kan, Z.; Kwan, M.-P.; Wong, M.S.; Huang, J.; Liu, D. Identifying the space-time patterns of COVID-19 risk and their associations with different built environment features in Hong Kong. Sci. Total Environ. 2021, 772, 145379. [Google Scholar] [CrossRef]
- Sy, K.T.L.; White, L.F.; Nichols, B.E. Population density and basic reproductive number of COVID-19 across United States counties. PLoS ONE 2021, 16, e0249271. [Google Scholar] [CrossRef] [PubMed]
- McCormack, G.R.; Shiell, A. In search of causality: A systematic review of the relationship between the built environment and physical activity among adults. Int. J. Behav. Nutr. Phys. Act. 2011, 8, 125. [Google Scholar] [CrossRef] [Green Version]
- Ding, D.; Sallis, J.F.; Kerr, J.; Lee, S.; Rosenberg, D.E. Neighborhood Environment and Physical Activity Among Youth: A Review. Am. J. Prev. Med. 2011, 41, 442–455. [Google Scholar] [CrossRef]
- Frank, L.D. Land Use and Transportation Interaction: Implications on Public Health and Quality of Life. J. Plan. Educ. Res. 2000, 20, 6–22. [Google Scholar] [CrossRef]
- Ewing, R.; Schmid, T.; Killingsworth, R.; Zlot, A.; Raudenbush, S. Relationship between Urban Sprawl and Physical Activity, Obesity, and Morbidity. Am. J. Health Promot. 2003, 18, 47–57. [Google Scholar] [CrossRef]
- Wolch, J.R.; Byrne, J.; Newell, J. Urban green space, public health, and environmental justice: The challenge of making cities ‘just green enough’. Landsc. Urban Plan. 2014, 125, 234–244. [Google Scholar] [CrossRef] [Green Version]
- Barnett, D.W.; Barnett, A.; Nathan, A.; Van Cauwenberg, J.; Cerin, E. Built environmental correlates of older adults’ total physical activity and walking: A systematic review and meta-analysis. Int. J. Behav. Nutr. Phys. Act. 2017, 14, 1–24. [Google Scholar] [CrossRef] [Green Version]
- Kärmeniemi, M.M.; Lankila, T.; Ikäheimo, T.; Koivumaa-Honkanen, H.; Korpelainen, R. The Built Environment as a Determinant of Physical Activity: A Systematic Review of Longitudinal Studies and Natural Experiments. Ann. Behav. Med. 2018, 52, 239–251. [Google Scholar] [CrossRef] [PubMed] [Green Version]
- Qian, H.; Miao, T.; Liu, L.; Zheng, X.; Luo, D.; Li, Y. Indoor Transmission of SARS-CoV-2 2020. Available online: https://www.medrxiv.org/content/medrxiv/early/2020/04/07/2020.04.04.20053058.full.pdf (accessed on 21 June 2021).
- Sharmin, S.; Kamruzzaman, M. Association between the built environment and children’s independent mobility: A meta-analytic review. J. Transp. Geogr. 2017, 61, 104–117. [Google Scholar] [CrossRef]
- Shen, J.; Duan, H.; Zhang, B.; Wang, J.; Ji, J.; Wang, J.; Pan, L.; Wang, X.; Zhao, K.; Ying, B.; et al. Prevention and control of COVID-19 in public transportation: Experience from China. Environ. Pollut. 2020, 266, 115291. [Google Scholar] [CrossRef]
- Shamshiripour, A.; Rahimi, E.; Shabanpour, R.; Mohammadian, A. (Kouros) How is COVID-19 reshaping activity-travel behavior? Evidence from a comprehensive survey in Chicago. Transp. Res. Interdiscip. Perspect. 2020, 7, 100216. [Google Scholar] [CrossRef] [PubMed]
- Molloy, J.; Schatzmann, T.; Schoeman, B.; Tchervenkov, C.; Hintermann, B.; Axhausen, K.W. Observed impacts of the COVID-19 first wave on travel behaviour in Switzerland based on a large GPS panel. Transp. Policy 2021, 104, 43–51. [Google Scholar] [CrossRef]
- Johnson, T.F.; Hordley, L.A.; Greenwell, M.P.; Evans, L.C. Effect of park use and landscape structure on COVID-19 transmission rates. Sci. Total Environ. 2020. [Google Scholar] [CrossRef]
- Markevych, I.; Schoierer, J.; Hartig, T.; Chudnovsky, A.; Hystad, P.; Dzhambov, A.; de Vries, S.; Triguero-Mas, M.; Brauer, M.; Nieuwenhuijsen, M.J.; et al. Exploring pathways linking greenspace to health: Theoretical and methodological guidance. Environ. Res. 2017, 158, 301–317. [Google Scholar] [CrossRef]
- Yang, L.; Ao, Y.; Ke, J.; Lu, Y.; Liang, Y. To walk or not to walk? Examining non-linear effects of streetscape greenery on walking propensity of older adults. J. Transp. Geogr. 2021, 94, 103099. [Google Scholar] [CrossRef]
- Woodby, B.; Arnold, M.M.; Valacchi, G. SARS-CoV-2 infection, COVID-19 pathogenesis, and exposure to air pollution: What is the connection? Ann. N. Y. Acad. Sci. 2021, 1486, 15–38. [Google Scholar] [CrossRef] [PubMed]
- Lu, Y.; Zhao, J.; Wu, X.; Lo, S.M. Escaping to nature during a pandemic: A natural experiment in Asian cities during the COVID-19 pandemic with big social media data. Sci. Total Environ. 2021, 777, 146092. [Google Scholar] [CrossRef]
- Lu, Y.; Chen, L.; Liu, X.; Yang, Y.; Sullivan, W.C.; Xu, W.; Webster, C.; Jiang, B. Green spaces mitigate racial disparity of health: A higher ratio of green spaces indicates a lower racial disparity in SARS-CoV-2 infection rates in the USA. Environ. Int. 2021, 152, 106465. [Google Scholar] [CrossRef] [PubMed]
- Marotz, C.; Belda-Ferre, P.; Ali, F.; Das, P.; Huang, S.; Cantrell, K.; Jiang, L.; Martino, C.; Diner, R.E.; Rahman, G.; et al. Microbial context predicts SARS-CoV-2 prevalence in patients and the hospital built environment. medRxiv 2020. [Google Scholar] [CrossRef]
- Zhou, F.; Yu, T.; Du, R.; Fan, G.; Liu, Y.; Liu, Z.; Xiang, J.; Wang, Y.; Song, B.; Gu, X.; et al. Clinical course and risk factors for mortality of adult inpatients with COVID-19 in Wuhan, China: A retrospective cohort study. Lancet 2020, 395, 1054–1062. [Google Scholar] [CrossRef]
- Lu, Y.; Chen, L.; Yang, Y.; Gou, Z. The Association of Built Environment and Physical Activity in Older Adults: Using a Citywide Public Housing Scheme to Reduce Residential Self-Selection Bias. Int. J. Environ. Res. Public Health 2018, 15, 1973. [Google Scholar] [CrossRef] [Green Version]
- Boone-Heinonen, J.; Guilkey, D.K.; Evenson, K.R.; Gordon-Larsen, P. Residential self-selection bias in the estimation of built environment effects on physical activity between adolescence and young adulthood. Int. J. Behav. Nutr. Phys. Act. 2010, 7, 1–11. [Google Scholar] [CrossRef] [Green Version]
- Van Cauwenberg, J.; De Bourdeaudhuij, I.; De Meester, F.; Van Dyck, D.; Salmon, J.; Clarys, P.; Deforche, B. Relationship between the physical environment and physical activity in older adults: A systematic review. Health Place 2011, 17, 458–469. [Google Scholar] [CrossRef] [PubMed]


| No. | References | Urban Density | Land-Use Mixture | Availability of GREENSPACE | Road Density | Accessibility to Public Transit | Accessibility to Intercity Train Station | Density of Commercial Facilities | Density of Hospitals | Density of Schools |
|---|---|---|---|---|---|---|---|---|---|---|
| 1 | Li, Peng [30] | 0 | + | 0 | ||||||
| 2 | Yip, Huang [31] | +/0 | 0/0 | +/+/+/0 | 0/0 | |||||
| 3 | Credit [32] | − | 0 | |||||||
| 4 | DiMaggio, Klein [33] | +/+ | 0 | |||||||
| 5 | Hamidi, Sabouri [34] | +/0 | ||||||||
| 6 | Gaskin, Zare [35] | 0 | 0 | |||||||
| 7 | Hu, Yue [36] | + | ||||||||
| 8 | Huang, Kwan [37] | −/+/+ | - | + | ||||||
| 9 | Jin, Leng [38] | + | +/+/+/+/+ | + | + | |||||
| 10 | Johnson, Hordley [39] | 0 | − | |||||||
| 11 | Klompmaker, Hart [40] | − | ||||||||
| 12 | Li, Zhou [41] | 0 | 0 | 0 | 0 | + | + | |||
| 13 | Liu [42] | −/0 | − | + | ||||||
| 14 | Hamidi, Ewing [43] | - | ||||||||
| 15 | Ibrahim, Mohammed Eid [28] | 0 | ||||||||
| 16 | Nguyen, Huang [44] | + | ||||||||
| 17 | Rahman, Zafri [45] | 0 | ||||||||
| 18 | Scarpone, Brinkmann [46] | 0 | ||||||||
| 19 | Ma, Li [47] | + | + | + | + | |||||
| 20 | You, Wu [48] | + | + | - | ||||||
| 21 | You and Pan [49] | 0 | − | |||||||
| 22 | Li, Ma [50] | + | + | |||||||
| 23 | Tribby and Hartmann [51] | − | 0 | |||||||
| 24 | Kan, Kwan [52] | 0 | + | − | ||||||
| 25 | Sy, White [53] | 0 |
| Built Environment Factors | Positive (+) | Negative (−) | Inconclusive (0) |
|---|---|---|---|
| Factors with strong evidence | |||
| Commercial facility density (+) | 11 | 0 | 2 |
| School density (+) | 2 | 0 | 1 |
| Road density (+) | 2 | 0 | 2 |
| Accessibility to public transit (+) | 3 | 0 | 3 |
| Availability of green space (−) | 2 | 4 | 1 |
| Factors with weak evidence | |||
| Urban density | 8 | 5 | 11 |
| Hospital density | 3 | 1 | 4 |
| Land-use mixture | 1 | 1 | 1 |
| Accessibility to intercity train stations | 1 | 0 | 2 |
Publisher’s Note: MDPI stays neutral with regard to jurisdictional claims in published maps and institutional affiliations. |
© 2021 by the authors. Licensee MDPI, Basel, Switzerland. This article is an open access article distributed under the terms and conditions of the Creative Commons Attribution (CC BY) license (https://creativecommons.org/licenses/by/4.0/).
Share and Cite
Wang, J.; Wu, X.; Wang, R.; He, D.; Li, D.; Yang, L.; Yang, Y.; Lu, Y. Review of Associations between Built Environment Characteristics and Severe Acute Respiratory Syndrome Coronavirus 2 Infection Risk. Int. J. Environ. Res. Public Health 2021, 18, 7561. https://doi.org/10.3390/ijerph18147561
Wang J, Wu X, Wang R, He D, Li D, Yang L, Yang Y, Lu Y. Review of Associations between Built Environment Characteristics and Severe Acute Respiratory Syndrome Coronavirus 2 Infection Risk. International Journal of Environmental Research and Public Health. 2021; 18(14):7561. https://doi.org/10.3390/ijerph18147561
Chicago/Turabian StyleWang, Jingjing, Xueying Wu, Ruoyu Wang, Dongsheng He, Dongying Li, Linchuan Yang, Yiyang Yang, and Yi Lu. 2021. "Review of Associations between Built Environment Characteristics and Severe Acute Respiratory Syndrome Coronavirus 2 Infection Risk" International Journal of Environmental Research and Public Health 18, no. 14: 7561. https://doi.org/10.3390/ijerph18147561