
Relationship between Air Pollutant Exposure and Gynecologic Cancer Risk


 ,
,
Abstract
:1. Introduction
2. Methods
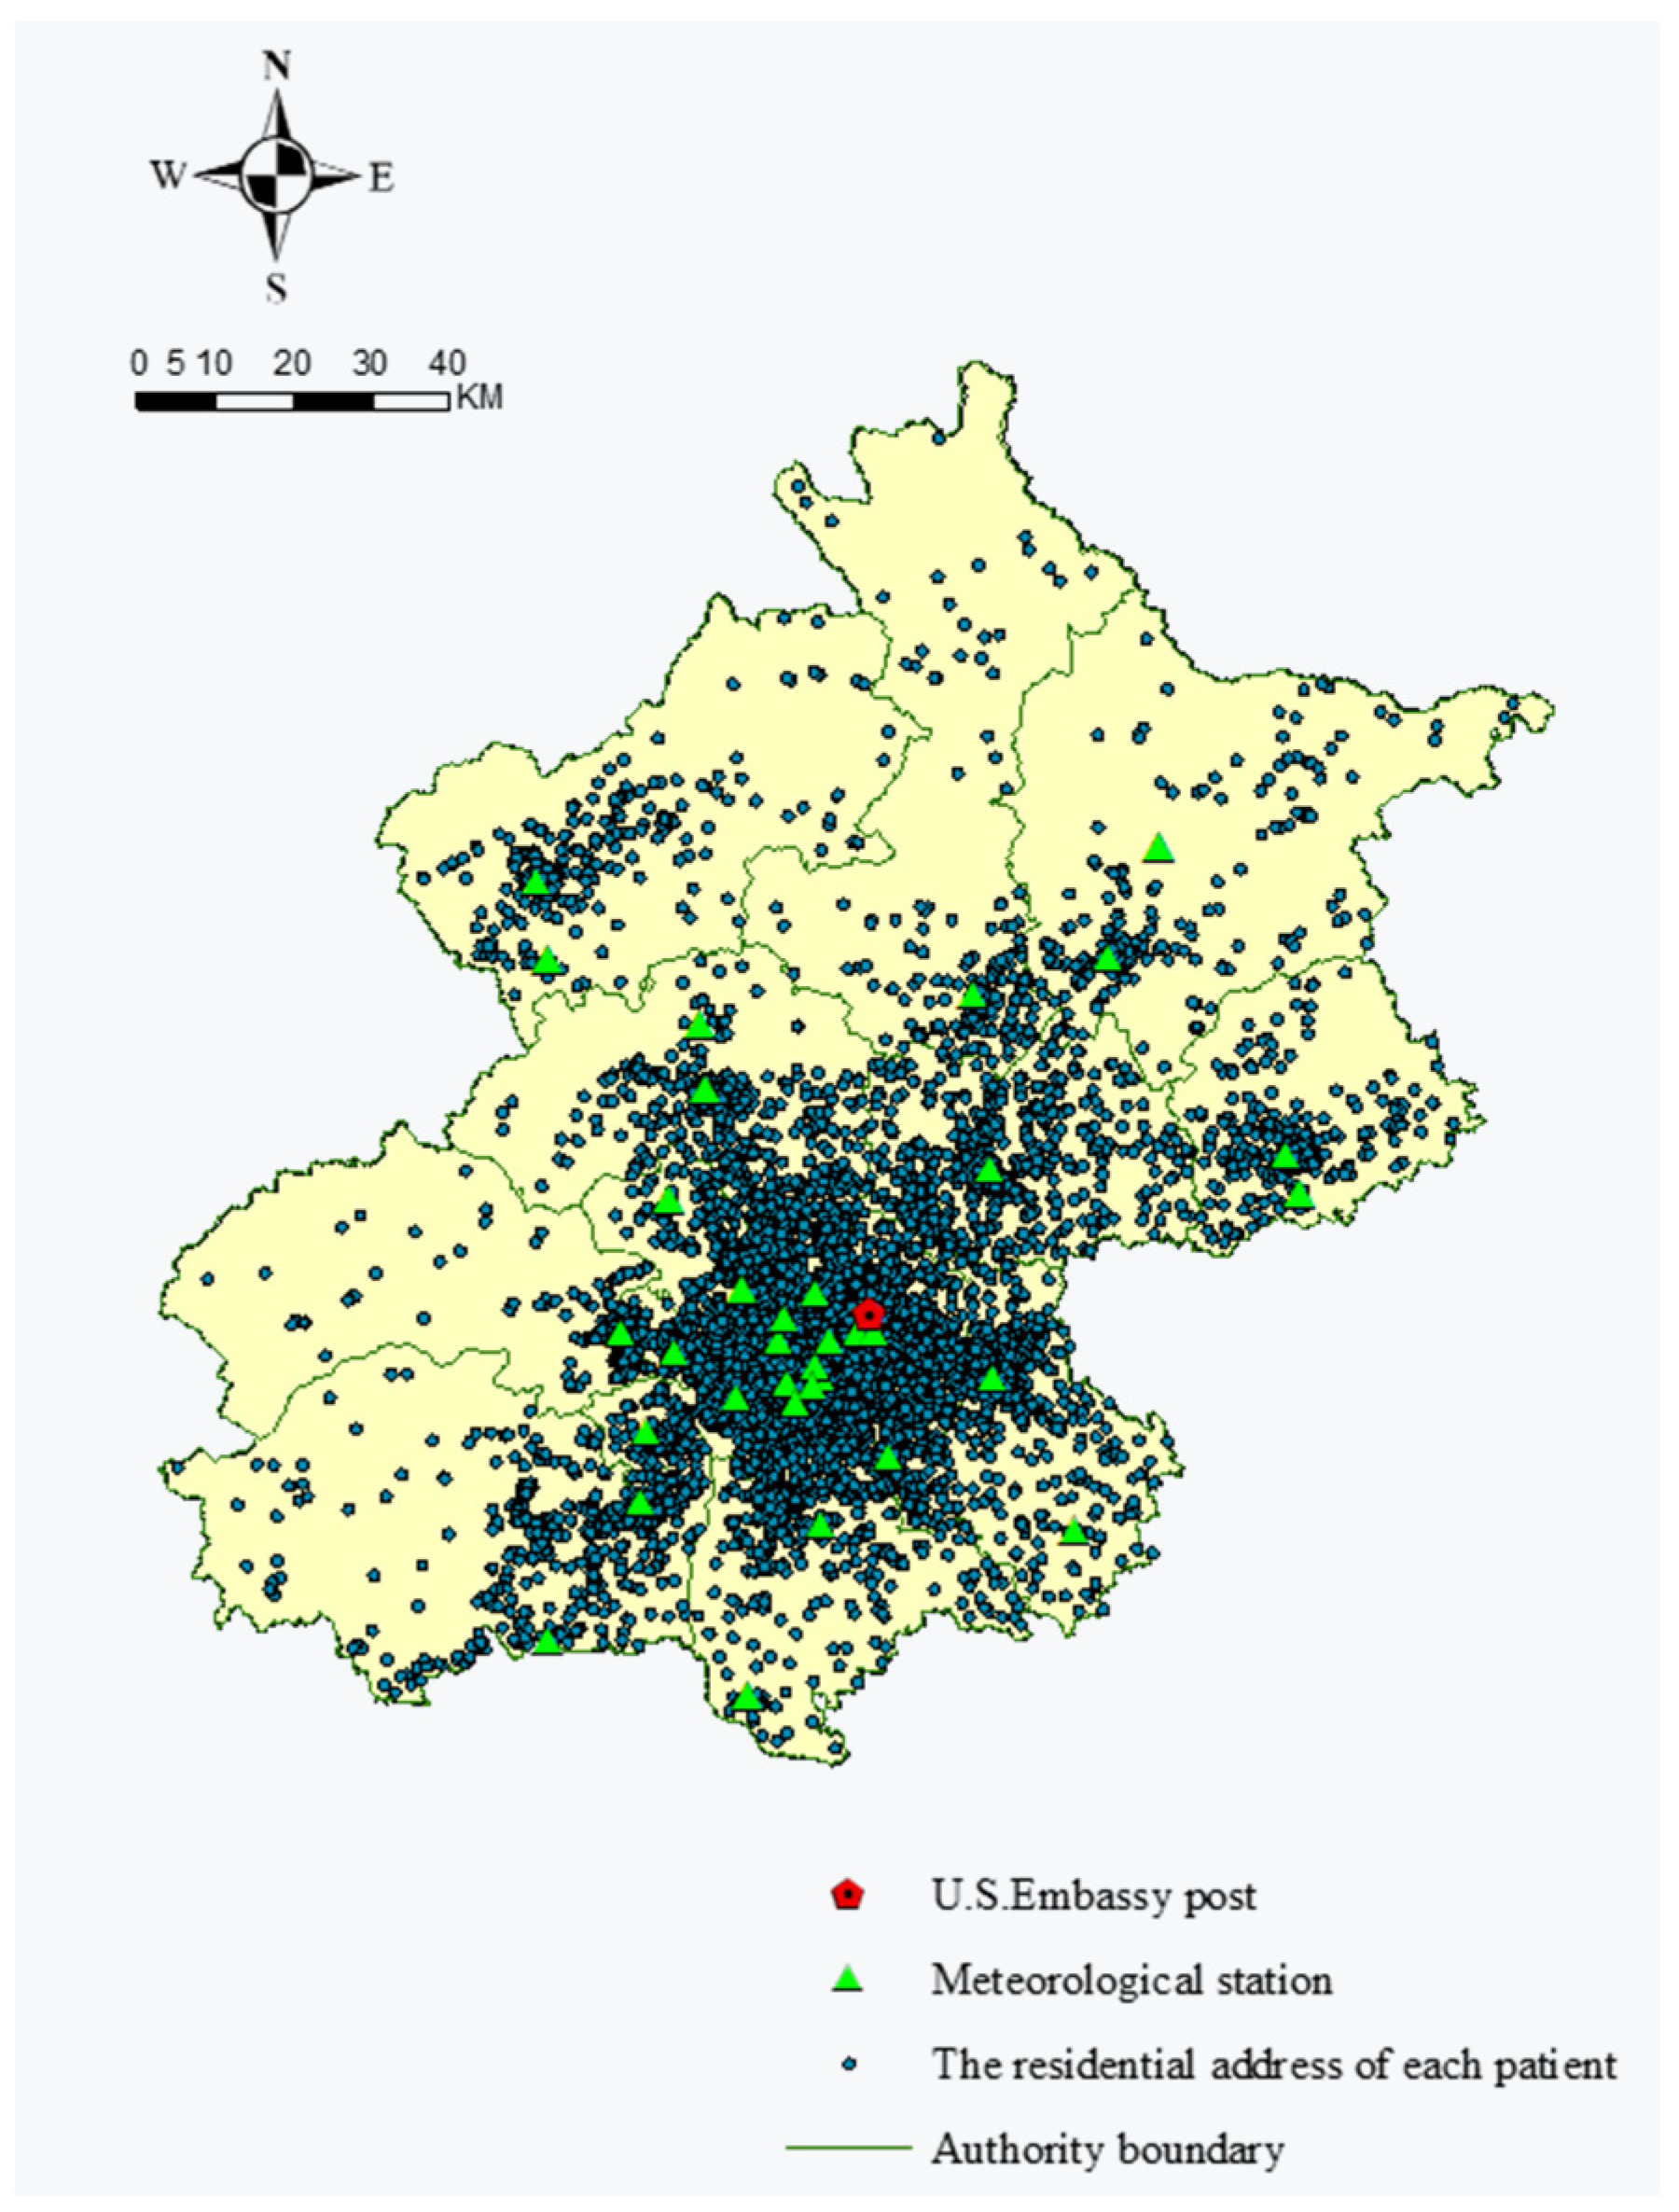
2.1. Data
2.1.1. Air Pollution Data
2.1.2. Meteorological Measurement Data
2.1.3. Interpolation of Missing Air Pollutants and Meteorological Data
2.1.4. Women’s Clinical Data
2.2. Assessment of 35,989 Patients’ Air Pollutant Exposure
2.3. Variables Selection
2.4. The Model
3. Results
3.1. Linking Air Pollution Exposure to Gynecological Cancer Risks
3.2. Associations between Gynecological Cancer Risk and Exposure to PM2.5, SO2, O3, and CO
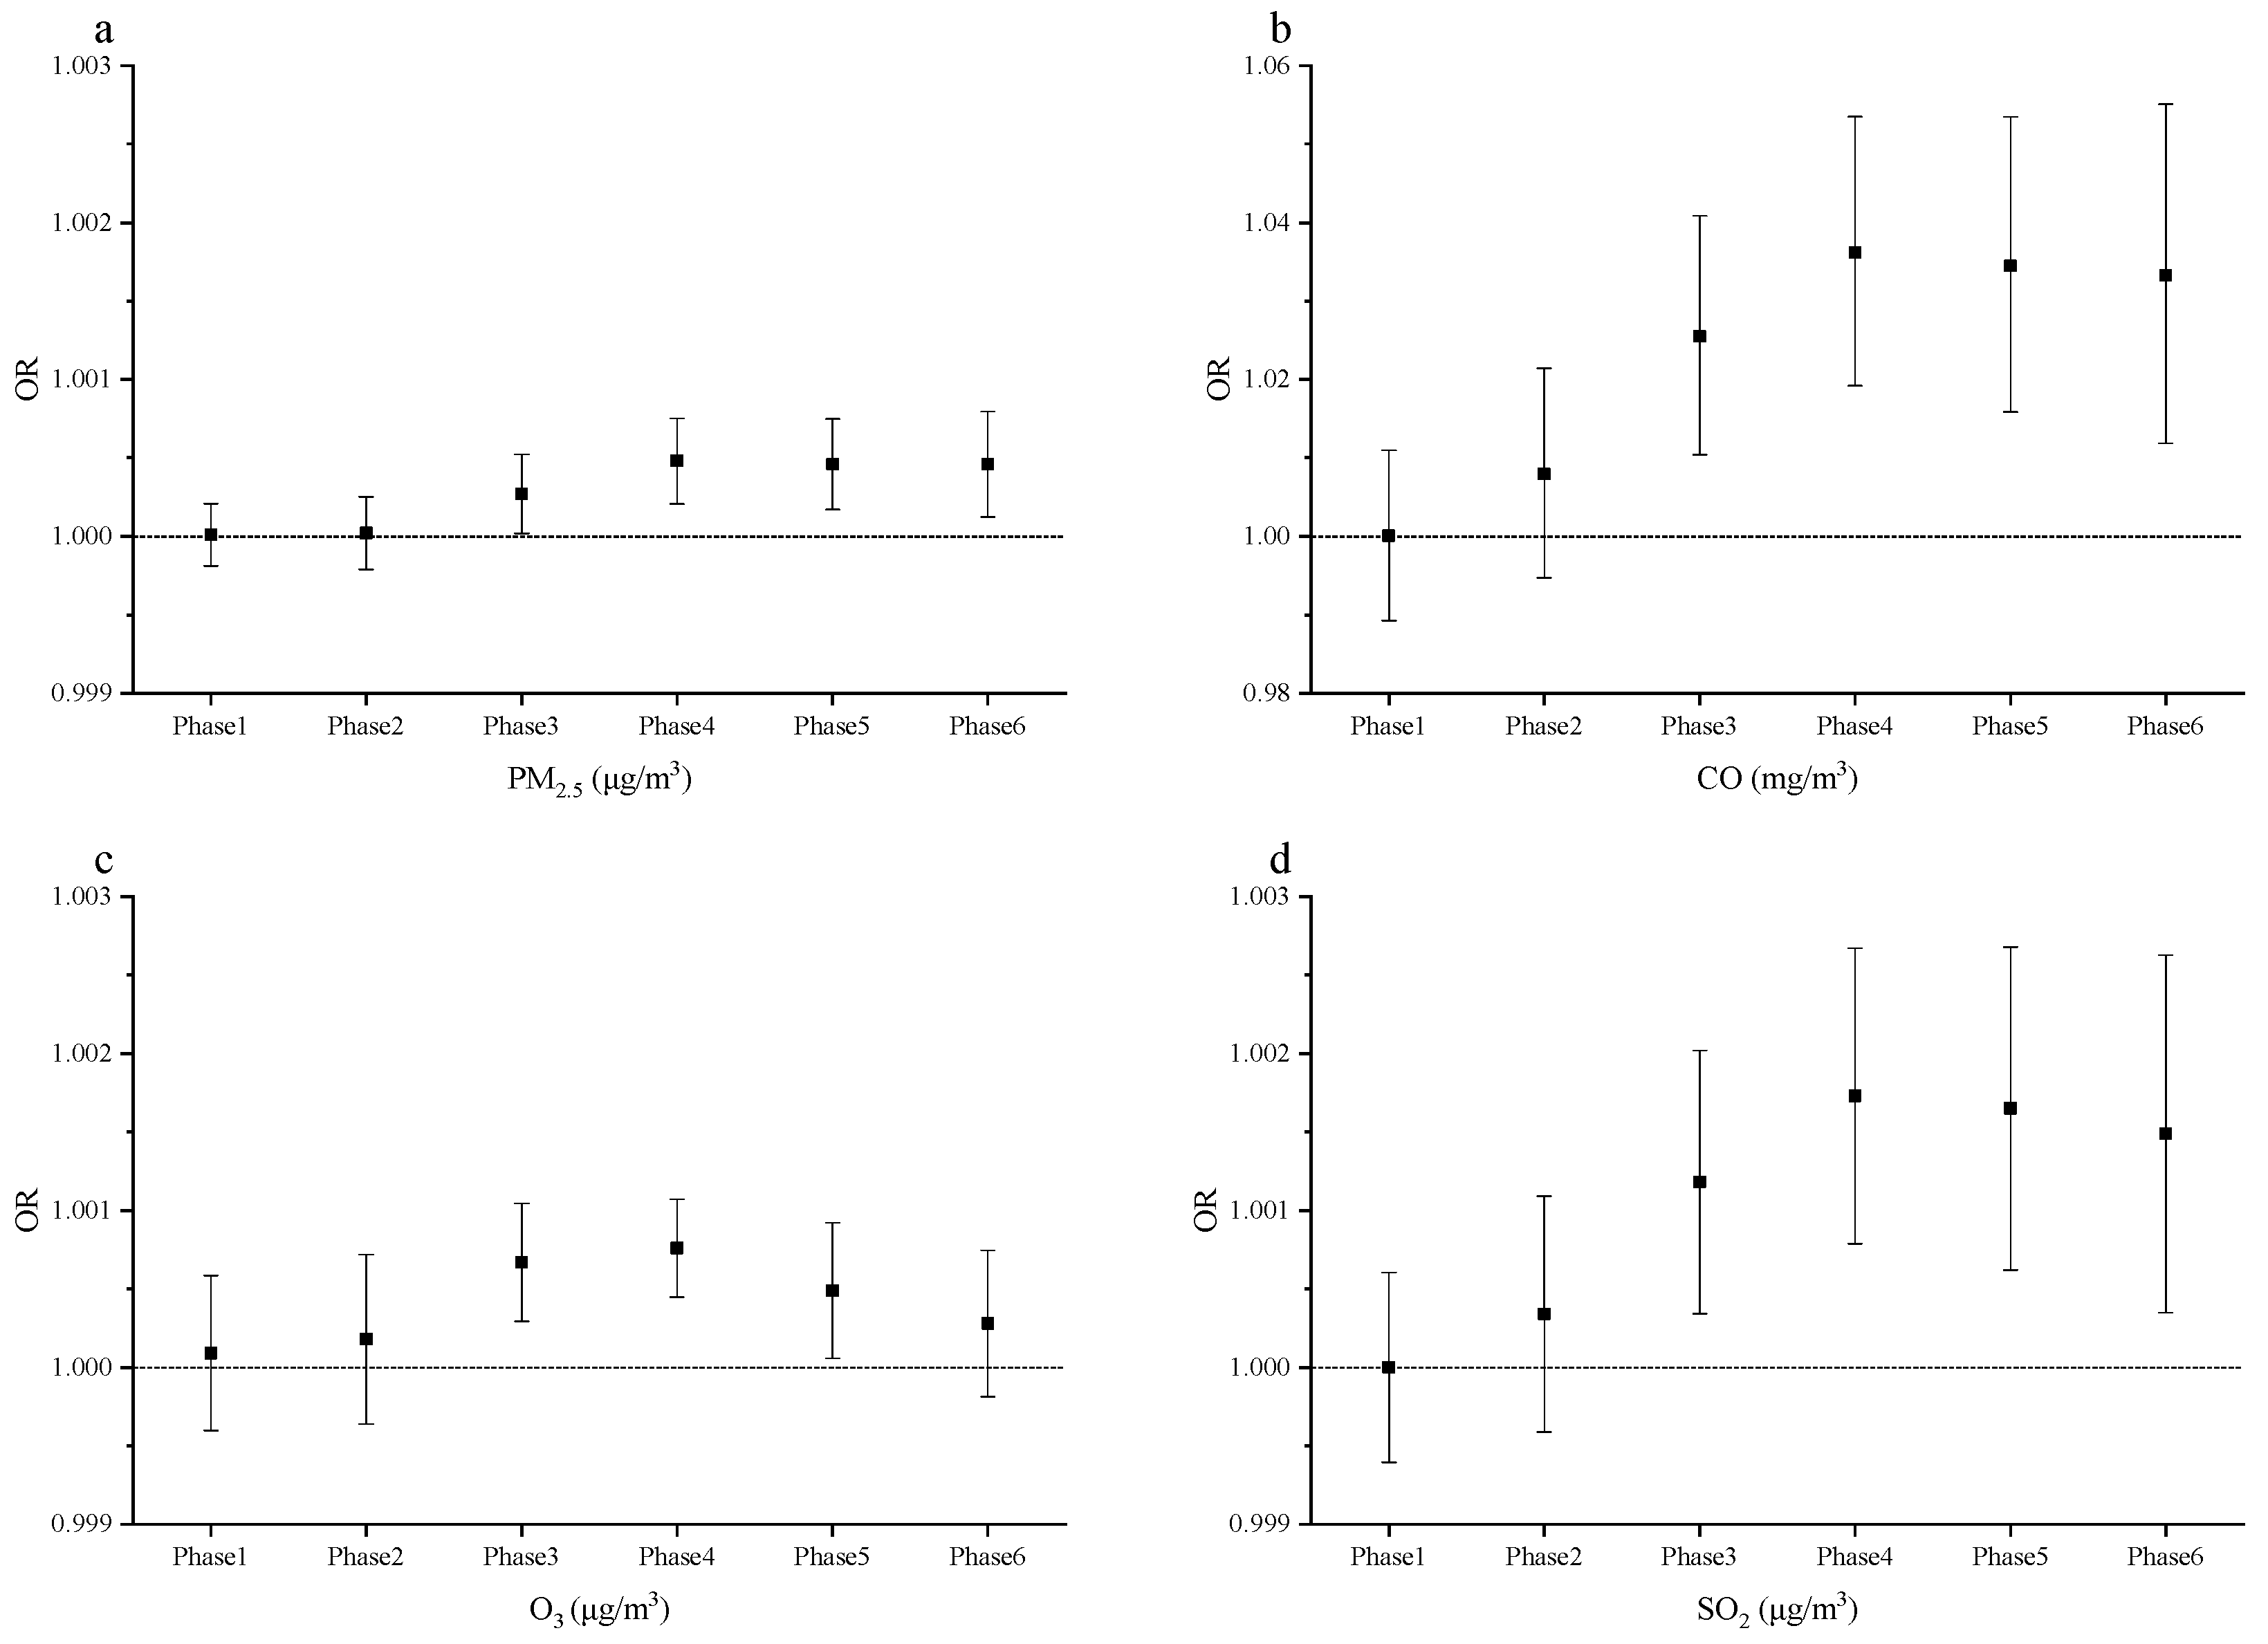
3.2.1. Correlations between Women’s Exposures in Different Time Periods
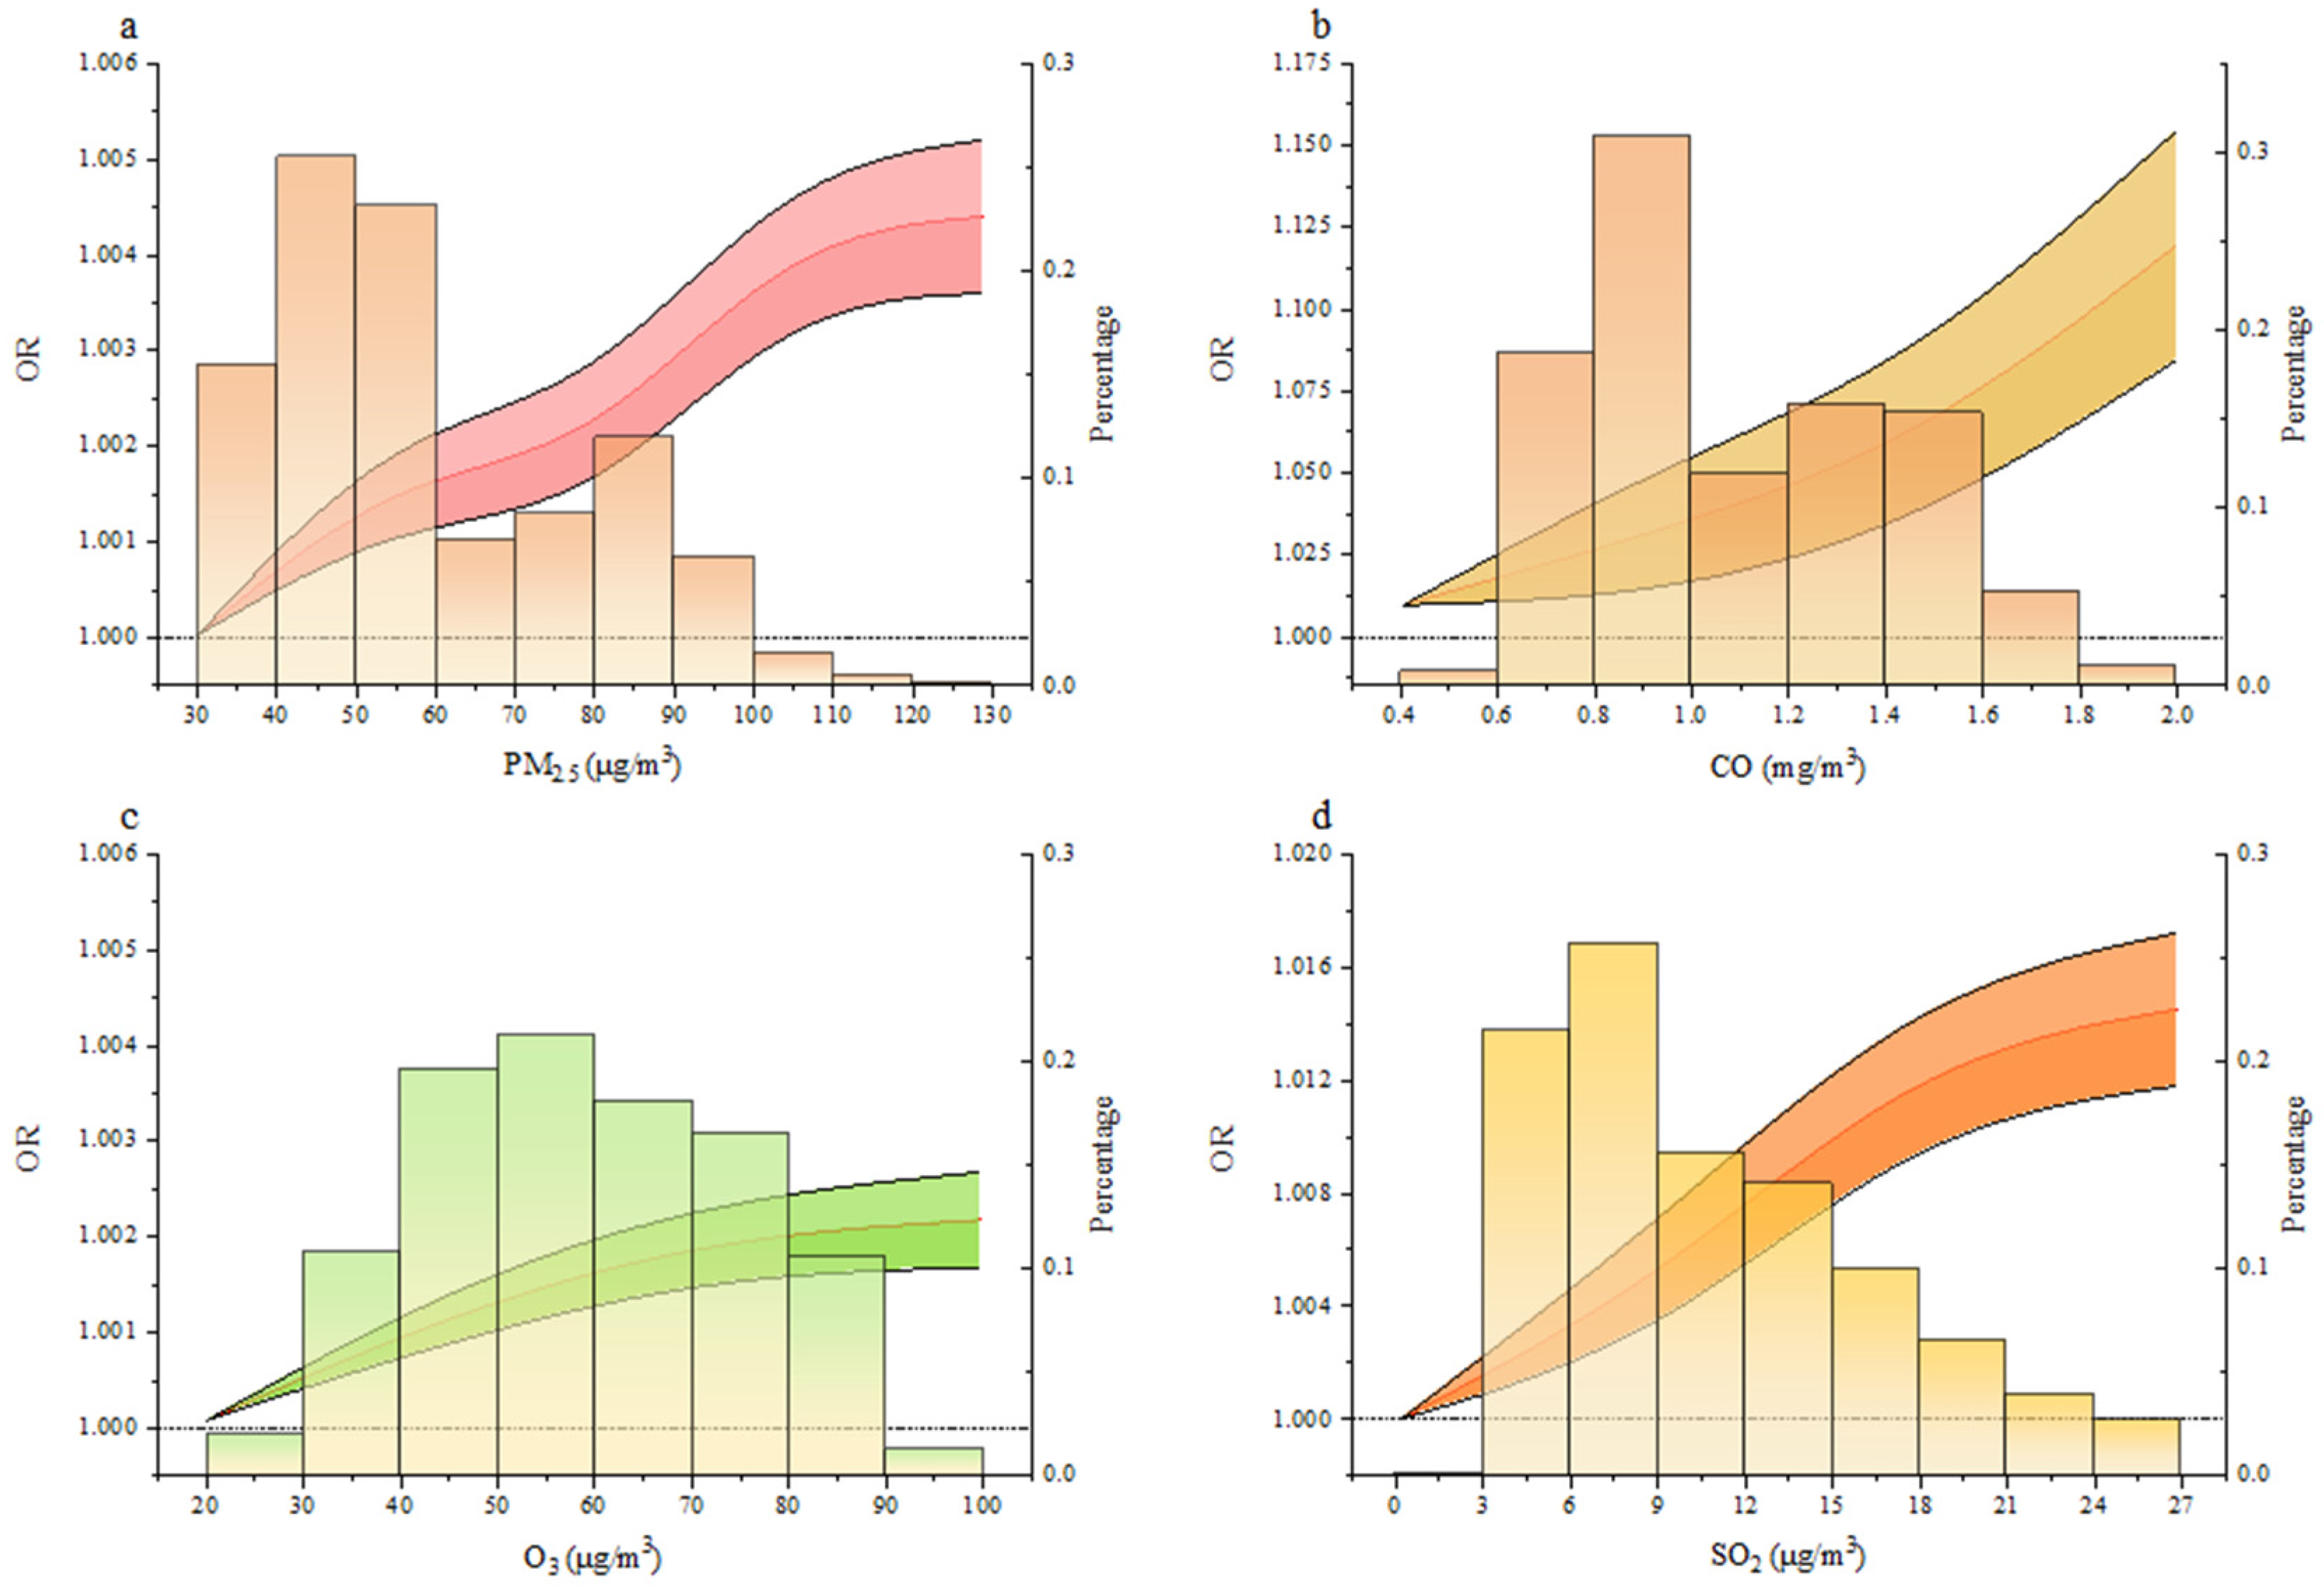
3.2.2. Impacts of Air Quality on Gynecological Cancer Risks
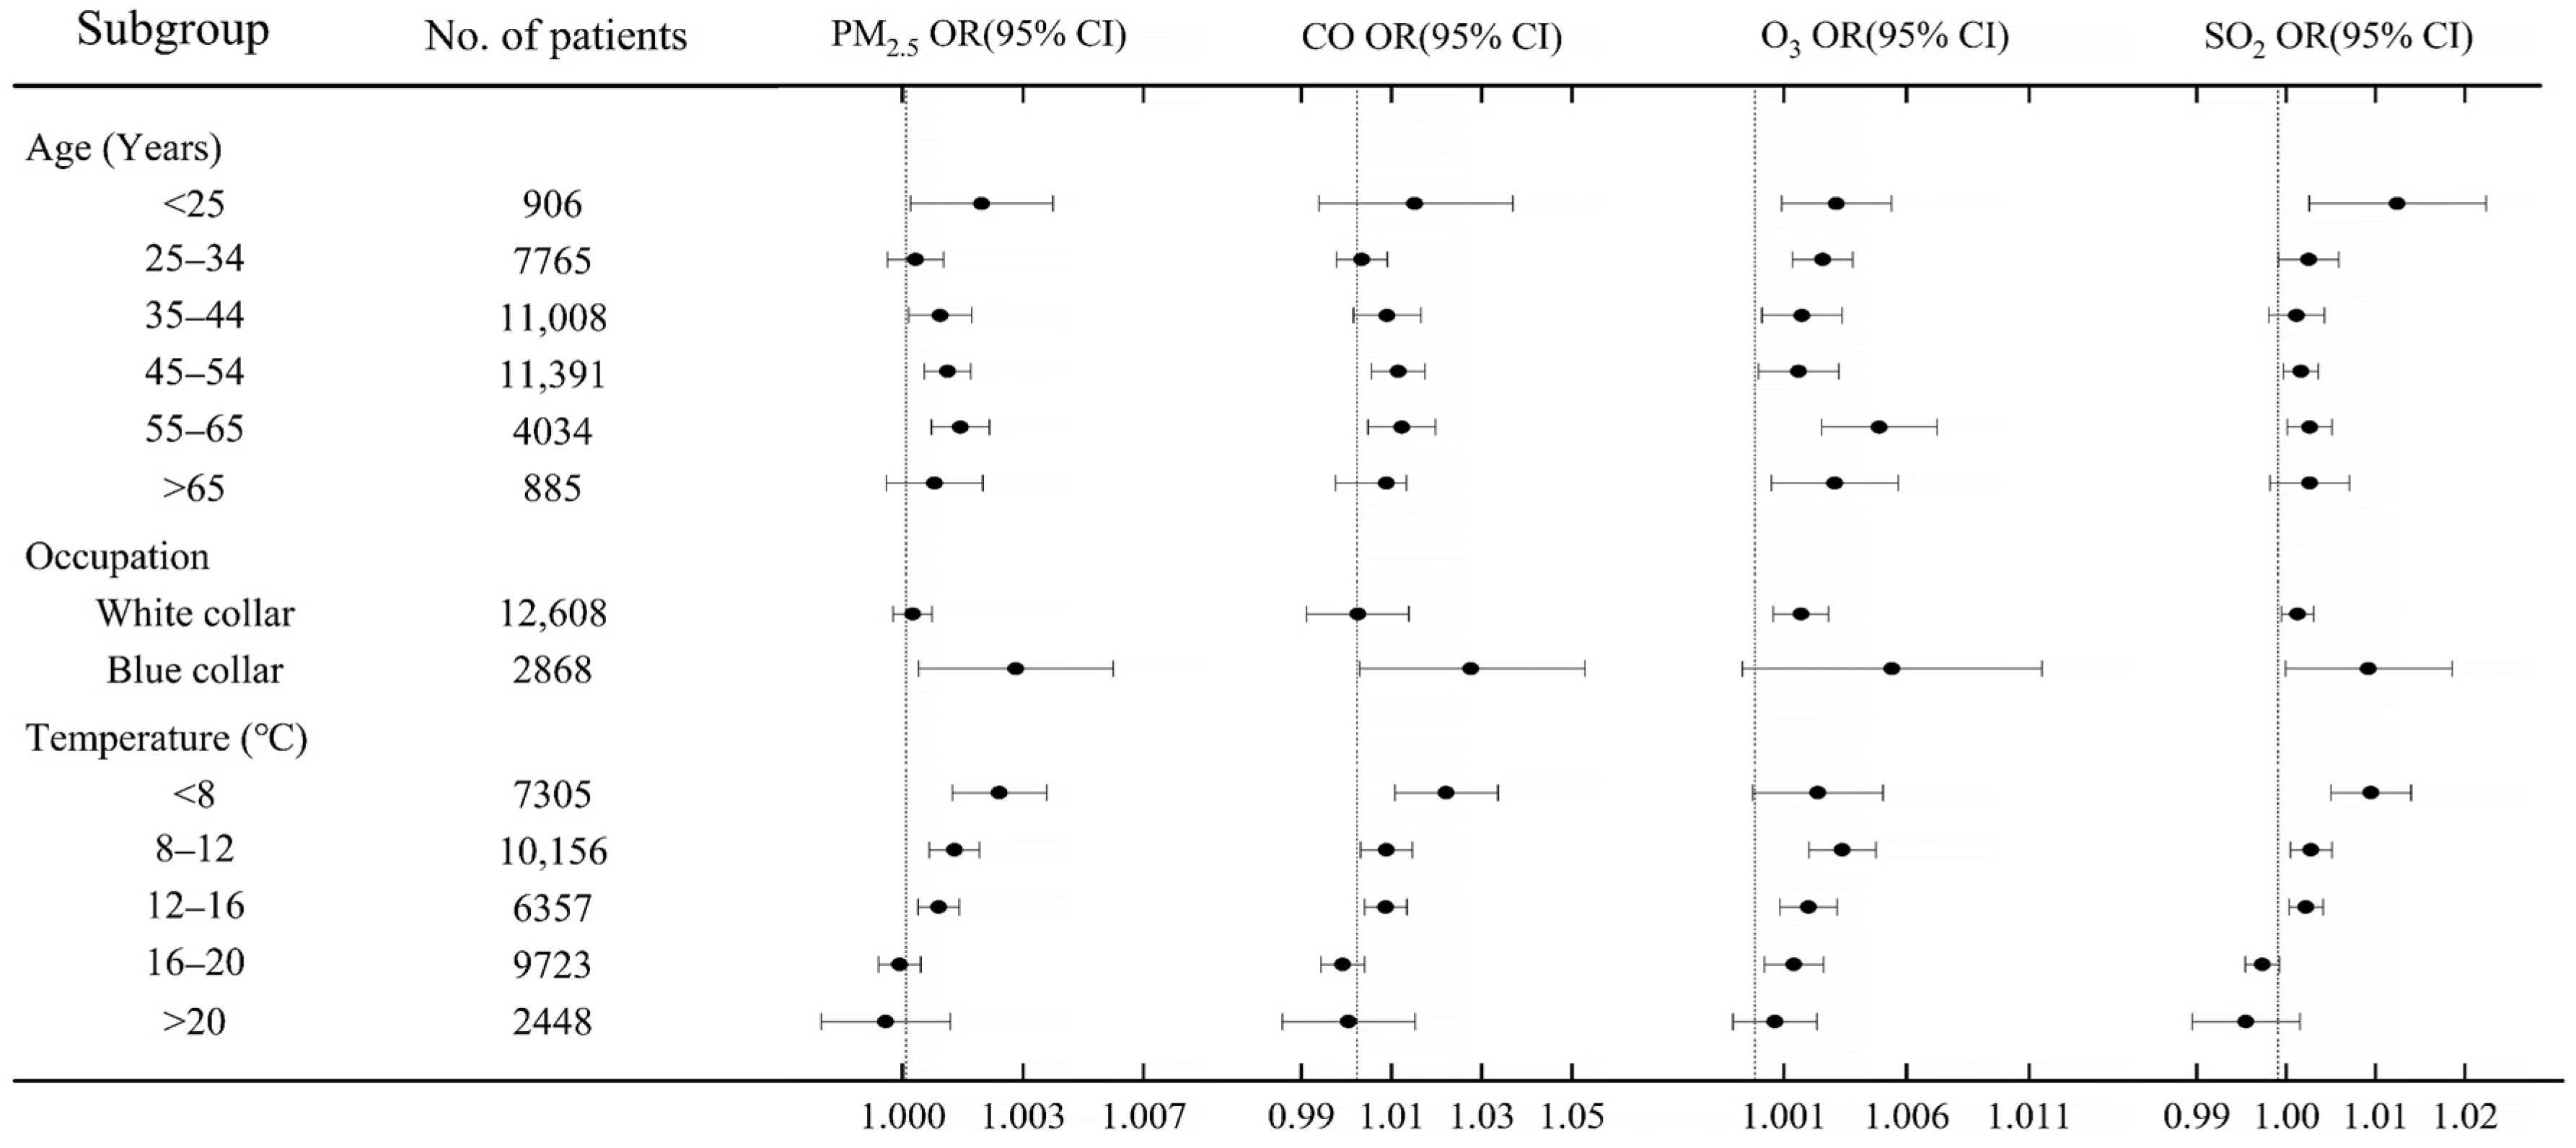
3.3. Associations between Air Pollution and Gynecological Cancer Risks by Sociodemographic Characteristics
3.4. Sensitivity Analysis
4. Discussion
Author Contributions
Funding
Institutional Review Board Statement
Informed Consent Statement
Data Availability Statement
Conflicts of Interest
References
- Liang, Y.; Fang, L.; Pan, H.; Zhang, K.; Kan, H.; Brook, J.R.; Sun, Q. PM2.5 in Beijing-Temporal Pattern and Its Association with Influenza. Environ. Health Glob. Access Sci. Source 2014, 13, 102. [Google Scholar] [CrossRef] [PubMed] [Green Version]
- Eckel, S.P.; Cockburn, M.; Shu, Y.-H.; Deng, H.; Lurmann, F.W.; Liu, L.; Gilliland, F.D. Air Pollution Affects Lung Cancer Survival. Thorax 2016, 71, 891–898. [Google Scholar] [CrossRef] [PubMed] [Green Version]
- English, J.S.C.; Dawe, R.S.; Ferguson, J. Environmental Effects and Skin Disease. Br. Med. Bull. 2003, 68, 129–142. [Google Scholar] [CrossRef] [Green Version]
- Goldsmith, L.A. Skin Effects of Air Pollution. Otolaryngol. Neck Surg. 1996, 114, 217–219. [Google Scholar] [CrossRef]
- Zhang, L.; Liu, W.; Hou, K.; Lin, J.; Zhou, C.; Tong, X.; Wang, Z.; Wang, Y.; Jiang, Y.; Wang, Z.; et al. Air Pollution-Induced Missed Abortion Risk for Pregnancies. Nat. Sustain. 2019, 2, 1011–1017. [Google Scholar] [CrossRef]
- Franklin, B.A.; Brook, R.; Pope, C.A., III. Air Pollution and Cardiovascular Disease. Curr. Probl. Cardiol. 2015, 40, 207–238. [Google Scholar] [CrossRef]
- Pun, V.C.; Kazemiparkouhi, F.; Manjourides, J.; Suh, H.H. Long-Term PM2.5 Exposure and Respiratory, Cancer, and Cardiovascular Mortality in Older US Adults. Am. J. Epidemiol. 2017, 186, 961–969. [Google Scholar] [CrossRef]
- Raaschou-Nielsen, O.; Ketzel, M.; Harbo Poulsen, A.; Sørensen, M. Traffic-related Air Pollution and Risk for Leukaemia of an Adult Population. Int. J. Cancer 2016, 138, 1111–1117. [Google Scholar] [CrossRef]
- Wang, J.; Xie, P.; Xu, Y.; Kettrup, A.; Schramm, K.-W. Differing Estrogen Activities in the Organic Phase of Air Particulate Matter Collected during Sunny and Foggy Weather in a Chinese City Detected by a Recombinant Yeast Bioassay. Atmos. Environ. 2004, 38, 6157–6166. [Google Scholar] [CrossRef]
- Loomis, D.; Grosse, Y.; Lauby-Secretan, B.; El Ghissassi, F.; Bouvard, V.; Benbrahim-Tallaa, L.; Guha, N.; Baan, R.; Mattock, H.; Straif, K. The carcinogenicity of outdoor air pollution. Lancet Oncol. 2013, 14, 1262–1263. [Google Scholar] [CrossRef]
- Chen, H.; Goldberg, M.S.; Villeneuve, P.J. A Systematic Review of Relation between Long-Term Exposure to Ambient Air Pollution and Chronic Disease: On-Line Appendix. TSP 2008, 1, 10–99. [Google Scholar]
- To, T.; Zhu, J.; Villeneuve, P.J.; Simatovic, J.; Feldman, L.; Gao, C.; Williams, D.; Chen, H.; Weichenthal, S.; Wall, C.; et al. Chronic Disease Prevalence in Women and Air Pollution—A 30-Year Longitudinal Cohort Study. Environ. Int. 2015, 80, 26–32. [Google Scholar] [CrossRef]
- International Agency for Research on Cancer. GLOBOCAN 2008: Cancer Incidence and Mortality Worldwide in 2008. Available online: http://globocan.iarc.fr/ (accessed on 14 May 2021).
- Adami, H.O.; Hunter, D.; Trichopoulos, D. Textbook of Cancer Epidemiology; Oxford University Press: New York City, NY, USA, 2009. [Google Scholar] [CrossRef]
- Parkin, D.M.; Bray, F.; Ferlay, J.; Pisani, P. Estimating the World Cancer Burden: Globocan 2000. Int. J. Cancer 2001, 94, 153–156. [Google Scholar] [CrossRef]
- Sankaranarayanan, R.; Ferlay, J. Worldwide Burden of Gynecological Cancer. In Handbook of Disease Burdens and Quality of Life Measures; Preedy, V.R., Watson, R.R., Eds.; Springer: New York, NY, USA, 2010; pp. 803–823. [Google Scholar] [CrossRef]
- Kamangar, F.; Dores, G.M.; Anderson, W.F. Patterns of Cancer Incidence, Mortality, and Prevalence across Five Continents: Defining Priorities to Reduce Cancer Disparities in Different Geographic Regions of the World. J. Clin. Oncol. 2006, 24, 2137–2150. [Google Scholar] [CrossRef]
- Jiang, X.; Tang, H.; Chen, T. Epidemiology of Gynecologic Cancers in China. J. Gynecol. Oncol. 2018, 29, 1–7. [Google Scholar] [CrossRef] [Green Version]
- Huynh, S.; Von Euler-Chelpin, M.; Raaschou-Nielsen, O.; Hertel, O.; Tjønneland, A.; Lynge, E.; Vejborg, I.; Andersen, Z.J. Long-Term Exposure to Air Pollution and Mammographic Density in the Danish Diet, Cancer and Health Cohort. Environ. Health Glob. Access Sci. Source 2015, 14, 1–7. [Google Scholar] [CrossRef] [Green Version]
- Wei, Y.; Davis, J.; Bina, W.F. Ambient Air Pollution Is Associated with the Increased Incidence of Breast Cancer in US. Int. J. Environ. Health Res. 2012, 22, 12–21. [Google Scholar] [CrossRef]
- Shields, T.; Gridley, G.; Moradi, T.; Adami, J.; Plato, N.; Dosemeci, M. Occupational Exposures and the Risk of Ovarian Cancer in Sweden. Am. J. Ind. Med. 2002, 42, 200–213. [Google Scholar] [CrossRef]
- Scheurer, M.E.; Danysh, H.E.; Follen, M.; Lupo, P.J. Association of Traffic-Related Hazardous Air Pollutants and Cervical Dysplasia in an Urban Multiethnic Population: A Cross-Sectional Study. Environ. Health Glob. Access Sci. Source 2014, 13, 1–8. [Google Scholar] [CrossRef] [Green Version]
- Mahalingaiah, S.; Hart, J.E.; Laden, F.; Terry, K.L.; Boynton-Jarrett, R.; Aschengrau, A.; Missmer, S.A. Air Pollution and Risk of Uterine Leiomyomata. Epidemiology 2014, 25, 682–688. [Google Scholar] [CrossRef] [Green Version]
- Huo, Q.; Zhang, N.; Wang, X.; Jiang, L.; Ma, T.; Yang, Q. Effects of Ambient Particulate Matter on Human Breast Cancer: Is Xenogenesis Responsible? PLoS ONE 2013, 8, e76609. [Google Scholar] [CrossRef] [PubMed]
- Hwang, J.; Bae, H.; Choi, S.; Yi, H.; Ko, B.; Kim, N. Impact of Air Pollution on Breast Cancer Incidence and Mortality: A Nationwide Analysis in South Korea. Sci. Rep. 2020, 10, 1–8. [Google Scholar] [CrossRef] [PubMed]
- Jedrychowski, W.; Maugeri, U.; Bianchi, I. Environmental Pollution in Central and Eastern European Countries: A Basis for Cancer Epidemiology. Rev. Environ. Health 1997, 12, 1–24. [Google Scholar] [CrossRef] [PubMed]
- Hystad, P.; Villeneuve, P.J.; Goldberg, M.S.; Crouse, D.L.; Johnson, K. Exposure to Traffic-Related Air Pollution and the Risk of Developing Breast Cancer among Women in Eight Canadian Provinces: A Case-Control Study. Environ. Int. 2015, 74, 240–248. [Google Scholar] [CrossRef]
- Heijmans, B.T.; Tobi, E.W.; Stein, A.D.; Putter, H.; Blauw, G.J.; Susser, E.S.; Slagboom, P.E.; Lumey, L.H. Persistent Epigenetic Differences Associated with Prenatal Exposure to Famine in Humans. Proc. Natl. Acad. Sci. USA 2008, 105, 17046–17049. [Google Scholar] [CrossRef] [Green Version]
- Capello, F.; Gaddi, A.V. (Eds.) Clinical Handbook of Air Pollution-Related Diseases; Springer International Publishing: Cham, Switzerland, 2018. [Google Scholar] [CrossRef]
- Calderón-Garcidueñas, L.; Engle, R.; Mora-Tiscareño, A.M.A.; Styner, M.; Gómez-Garza, G.; Zhu, H.; Jewells, V.; Torres-Jardón, R.; Romero, L.; Monroy-Acosta, M.E.; et al. Exposure to Severe Urban Air Pollution Influences Cognitive Outcomes, Brain Volume and Systemic Inflammation in Clinically Healthy Children. Brain Cogn. 2011, 77, 345–355. [Google Scholar] [CrossRef]
- Loomis, D.; Huang, W.; Chen, G. The International Agency for Research on Cancer (IARC) Evaluation of the Carcinogenicity of Outdoor Air Pollution: Focus on China. Chin. J. Cancer 2014, 33, 189–196. [Google Scholar] [CrossRef]
- Bowe, B.; Xie, Y.; Li, T.; Yan, Y.; Xian, H.; Al-Aly, Z. The 2016 Global and National Burden of Diabetes Mellitus Attributable to PM2.5 Air Pollution. Lancet Planet. Health 2018, 2, e301–e312. [Google Scholar] [CrossRef] [Green Version]
- Bonner, M.R.; Han, D.; Nie, J.; Rogerson, P.; Vena, J.E.; Muti, P.; Trevisan, M.; Edge, S.B.; Freudenheim, J.L. Breast Cancer Risk and Exposure in Early Life to Polycyclic Aromatic Hydrocarbons Using Total Suspended Particulates as a Proxy Measure. Cancer Epidemiol. Prev. Biomark. 2005, 14, 53–60. [Google Scholar]
- Liu, M.; Lin, J.; Wang, Y.; Sun, Y.; Zheng, B.; Shao, J.; Chen, L.; Zheng, Y.; Chen, J.; Fu, T.M.; et al. Spatiotemporal Variability of NO2 and PM2.5 over Eastern China: Observational and Model Analyses with a Novel Statistical Method. Atmos. Chem. Phys. 2018, 18, 12933–12952. [Google Scholar] [CrossRef] [Green Version]
- Liang, X.; Li, S.; Zhang, S.; Huang, H.; Chen, S.X. PM2.5 Data Reliability, Consistency, and Air Quality Assessment in Five Chinese Cities. J. Geophys. Res. 2016, 121, 10220–10236. [Google Scholar] [CrossRef]
- Desquilbet, L.; Mariotti, F. Dose-Response Analyses Using Restricted Cubic Spline Functions in Public Health Research. Stat. Med. 2010, 29, 1037–1057. [Google Scholar] [CrossRef]
- Ou, C.Q.; Hedley, A.J.; Chung, R.Y.; Thach, T.Q.; Chau, Y.K.; Chan, K.P.; Yang, L.; Ho, S.Y.; Wong, C.M.; Lam, T.H. Socioeconomic Disparities in Air Pollution-Associated Mortality. Environ. Res. 2008, 107, 237–244. [Google Scholar] [CrossRef]
- Forastiere, F.; Stafoggia, M.; Tasco, C.; Picciotto, S.; Agabiti, N.; Cesaroni, G.; Perucci, C.A. Socioeconomic Status, Particulate Air Pollution, and Daily Mortality: Differential Exposure or Differential Susceptibility. Am. J. Ind. Med. 2007, 50, 208–216. [Google Scholar] [CrossRef]
- Crouse, D.L.; Goldberg, M.S.; Ross, N.A.; Chen, H.; Labrèche, F. Postmenopausal Breast Cancer Is Associated with Exposure to Traffic-Related Air Pollution in Montreal, Canada: A Case-Control Study. Environ. Health Perspect. 2010, 118, 1578–1583. [Google Scholar] [CrossRef] [Green Version]
- Reding, K.W.; Young, M.T.; Szpiro, A.A.; Han, C.J.; DeRoo, L.A.; Weinberg, C.; Kaufman, J.D.; Sandler, D.P. Breast Cancer Risk in Relation to Ambient Air Pollution Exposure at Residences in the Sister Study Cohort. Cancer Epidemiol. Biomark. Prev. 2015, 24, 1907–1909. [Google Scholar] [CrossRef] [Green Version]
- Woolson, R.F. Wilcoxon Signed-Rank Test. Wiley Encyclopedia of Clinical Trials. Wiley Encycl. Clin. Trials 2007, 1–3. [Google Scholar] [CrossRef]
- Enkhmaa, D.; Warburton, N.; Javzandulam, B.; Uyanga, J.; Khishigsuren, Y.; Lodoysamba, S.; Enkhtur, S.; Warburton, D. Seasonal Ambient Air Pollution Correlates Strongly with Spontaneous Abortion in Mongolia. BMC Pregnancy Childbirth 2014, 14, 1–7. [Google Scholar] [CrossRef] [Green Version]
- Yan, S.; Cao, H.; Chen, Y.; Wu, C.; Hong, T.; Fan, H. Spatial and Temporal Characteristics of Air Quality and Air Pollutants in 2013 in Beijing. Environ. Sci. Pollut. Res. 2016, 23, 13996–14007. [Google Scholar] [CrossRef]
- Raaschou-Nielsen, O.; Andersen, Z.J.; Hvidberg, M.; Jensen, S.S.; Ketzel, M.; Sørensen, M.; Hansen, J.; Loft, S.; Overvad, K.; Tjønneland, A. Air Pollution from Traffic and Cancer Incidence: A Danish Cohort Study. Environ. Health 2011, 10, 67. [Google Scholar] [CrossRef] [Green Version]
- Moktar, A.; Singh, R.; Vadhanam, M.V.; Ravoori, S.; Lillard, J.W.; Gairola, C.G.; Gupta, R.C. Cigarette Smoke Condensate-Induced Oxidative DNA Damage and Its Removal in Human Cervical Cancer Cells. Int. J. Oncol. 2011, 39, 941–947. [Google Scholar] [PubMed]
- Brody, J.G.; Moysich, K.B.; Humblet, O.; Attfield, K.R.; Beehler, G.P.; Rudel, R.A. Environmental Pollutants and Breast Cancer: Epidemiologic Studies. Cancer 2007, 109 (Suppl. S12), 2667–2711. [Google Scholar] [CrossRef] [PubMed]
- Hung, L.J.; Tsai, S.S.; Chen, P.S.; Yang, Y.H.; Liou, S.H.; Wu, T.N.; Yang, C.Y. Traffic Air Pollution and Risk of Death from Breast Cancer in Taiwan: Fine Particulate Matter (PM 2.5) as a Proxy Marker. Aerosol. Air Qual. Res. 2012, 12, 275–282. [Google Scholar] [CrossRef] [Green Version]
- Li, X.; Ding, L.; Song, L.; Gao, W.; Wang, L.; Wang, J. Effects of Exposure to Polycyclic Aromatic Hydrocarbons Combined with High-Risk Human Papillomavirus Infection on Cervical Intraepithelial Neoplasia: A Population Study in Shanxi Province, China. Int. J. Cancer 2020, 146, 2406–2412. [Google Scholar] [CrossRef] [PubMed]
- Craig, Z.R.; Wang, W.; Flaws, J.A. Endocrine-Disrupting Chemicals in Ovarian Function: Effects on Steroidogenesis, Metabolism and Nuclear Receptor Signaling. Reproduction 2011, 142, 633–646. [Google Scholar] [CrossRef] [PubMed]
- Petroff, B.K.; Roby, K.F.; Gao, X.; Son, D.S.; Williams, S.; Johnson, D.; Rozman, K.K.; Terranova, P.F. A Review of Mechanisms Controlling Ovulation with Implications for the Anovulatory Effects of Polychlorinated Dibenzo-p-Dioxins in Rodents. Toxicology 2001, 158, 91–107. [Google Scholar] [CrossRef]
- Hombach-Klonisch, S.; Pocar, P.; Kietz, S.; Klonisch, T. Molecular Actions of Polyhalogenated Arylhydrocarbons (PAHs) in Female Reproduction. Curr. Med. Chem. 2012, 12, 599–616. [Google Scholar] [CrossRef]
- Wernli, K.J.; Ray, R.M.; Gao, D.L.; Fitzgibbons, E.D.; Camp, J.E.; Astrakianakis, G.; Seixas, N.; Wong, E.Y.; Li, W.; De Roos, A.J. Occupational Exposures and Ovarian Cancer in Textile Workers. Epidemiology 2008, 19, 244–250. [Google Scholar] [CrossRef]
- Perry, N.M.; Allgood, P.C.; Duffy, S.W.; Mokbel, K. Exposure to Traffic Emissions throughout Life and Risk of Breast Cancer. Cancer Causes Control 2008, 19, 435. [Google Scholar] [CrossRef]
- Wu, J.; Ren, C.; Delfino, R.J.; Chung, J.; Wilhelm, M.; Ritz, B. Association between Local Traffic-Generated Air Pollution and Preeclampsia and Preterm Delivery in the South Coast Air Basin of California. Environ. Health Perspect. 2009, 117, 1773–1779. [Google Scholar] [CrossRef]
- Vinikoor-Imler, L.C.; Gray, S.C.; Edwards, S.E.; Miranda, M.L. The Effects of Exposure to Particulate Matter and Neighbourhood Deprivation on Gestational Hypertension. Paediatr. Perinat. Epidemiol. 2012, 26, 91–100. [Google Scholar] [CrossRef] [Green Version]
- Wu, M.; Ries, J.J.; Proietti, E.; Vogt, D.; Hahn, S.; Hoesli, I. Development of Late-Onset Preeclampsia in Association with Road Densities as a Proxy for Traffic-Related Air Pollution. Fetal Diagn. Ther. 2016, 39, 21–27. [Google Scholar] [CrossRef] [Green Version]
- Lee, P.-C.; Roberts, J.M.; Catov, J.M.; Talbott, E.O.; Ritz, B. First Trimester Exposure to Ambient Air Pollution, Pregnancy Complications and Adverse Birth Outcomes in Allegheny County, PA. Matern. Child Health J. 2013, 17, 545–555. [Google Scholar] [CrossRef]
- Guo, Y.; Zeng, H.; Zheng, R.; Li, S.; Barnett, A.G.; Zhang, S.; Zou, X.; Huxley, R.; Chen, W.; Williams, G. The Association between Lung Cancer Incidence and Ambient Air Pollution in China: A Spatiotemporal Analysis. Environ. Res. 2016, 144, 60–65. [Google Scholar] [CrossRef]
- Zhao, Y.; Wang, S.; Aunan, K.; Seip, H.M.; Hao, J. Air Pollution and Lung Cancer Risks in China-a Meta-Analysis. Sci. Total Environ. 2006, 366, 500–513. [Google Scholar] [CrossRef]
- Cheng, I.; Tseng, C.; Wu, J.; Yang, J.; Conroy, S.M.; Shariff-Marco, S.; Li, L.; Hertz, A.; Gomez, S.L.; Le Marchand, L.; et al. Association between Ambient Air Pollution and Breast Cancer Risk: The Multiethnic Cohort Study. Int. J. Cancer 2020, 146, 699–711. [Google Scholar] [CrossRef]
- Derhovanessian, E.; Solana, R.; Larbi, A.; Pawelec, G. Immunity, Ageing and Cancer. Immun. Ageing 2008, 5, 1–16. [Google Scholar] [CrossRef] [PubMed] [Green Version]
- Kiecolt-Glaser, J.K.; Glaser, R. Stress and Immunity: Age Enhances the Risks. Curr. Dir. Psychol. Sci. 2001, 10, 18–21. [Google Scholar] [CrossRef]
- Peterson, C.E.; Rauscher, G.H.; Johnson, T.P.; Kirschner, C.V.; Barrett, R.E.; Kim, S.; Fitzgibbon, M.L.; Joslin, C.E.; Davis, F.G. The Association between Neighborhood Socioeconomic Status and Ovarian Cancer Tumor Characteristics. Cancer Causes Control 2014, 25, 633–637. [Google Scholar] [CrossRef] [PubMed]
- El-Hougeiri, N.; El Fadel, M. Correlation of Indoor-Outdoor Air Quality in Urban Areas. Indoor Built Environ. 2004, 13, 421–431. [Google Scholar] [CrossRef]
- Wallace, L.; Williams, R. Use of Personal-Indoor-Outdoor Sulfur Concentrations to Estimate the Infiltration Factor and Outdoor Exposure Factor for Individual Homes and Persons. Environ. Sci. Technol. 2005, 39, 1707–1714. [Google Scholar] [CrossRef]
- Zanobetti, A.; O’Neill, M.S. Longer-Term Outdoor Temperatures and Health Effects: A Review. Curr. Epidemiol. Rep. 2018, 5, 125–139. [Google Scholar] [CrossRef]
- Jin, Y.; Andersson, H.; Zhang, S. Air Pollution Control Policies in China: A Retrospective and Prospects. Int. J. Environ. Res. Public Health 2016, 13, 1219. [Google Scholar] [CrossRef] [PubMed] [Green Version]


| Figure 2 | Subgroup | Non-Cancer | Cancer | p-Values | PM2.5 | CO | O3 | SO2 |
|---|---|---|---|---|---|---|---|---|
| Age (Years) | <25 | 830 (91.6%) | 76 (8.4%) | 0.011 | 0.039 | 0.040 | 0.005 | 0.003 |
| 25–34 | 7192 (92.6%) | 573 (7.4%) | 0.041 | 0.009 | 0.051 | 0.002 | ||
| 35–44 | 9830 (89.3%) | 1178 (10.7%) | 0.001 | 0.012 | 0.032 | 0.027 | ||
| 45–54 | 9236 (81.1%) | 2155 (18.9%) | 0.000 | 0.042 | 0.002 | 0.017 | ||
| 55–65 | 2294 (56.9%) | 1740 (43.1%) | 0.005 | 0.002 | 0.035 | 0.001 | ||
| >65 | 446 (50.4%) | 439 (49.6%) | 0.002 | 0.006 | 0.047 | 0.003 | ||
| Occupation | White collar | 11,180 (88.7%) | 1428 (11.3%) | 0.007 | 0.000 | 0.000 | 0.032 | 0.004 |
| Blue collar | 2245 (78.3%) | 623 (21.7%) | 0.041 | 0.021 | 0.016 | 0.034 | ||
| Temperature (°C) | <8 | 6010 (82.3%) | 1295 (17.7%) | 0.032 | 0.000 | 0.000 | 0.000 | 0.002 |
| 8–12 | 8366 (82.4%) | 1790 (17.6%) | 0.031 | 0.034 | 0.029 | 0.047 | ||
| 12–16 | 5328 (83.8%) | 1029 (16.2%) | 0.001 | 0.015 | 0.016 | 0.005 | ||
| 16–20 | 8109 (83.4%) | 1614 (16.6%) | 0.017 | 0.020 | 0.048 | 0.006 | ||
| >20 | 2015 (82.3%) | 433 (17.7%) | 0.032 | 0.015 | 0.037 | 0.044 | ||
| Relative Humidity (%) | <40 | 691 (85%) | 122 (15%) | 0.018 | 0.024 | 0.031 | 0.039 | 0.003 |
| 40–50 | 9245 (87.3%) | 1349 (12.7%) | 0.012 | 0.024 | 0.021 | 0.025 | ||
| 50–60 | 18,893 (86.2%) | 3027 (13.8%) | 0.008 | 0.007 | 0.019 | 0.020 | ||
| 60–70 | 1832 (81.4%) | 419 (18.6%) | 0.037 | 0.002 | 0.001 | 0.036 | ||
| >70 | 360 (87.6%) | 51 (12.4%) | 0.005 | 0.002 | 0.043 | 0.010 |
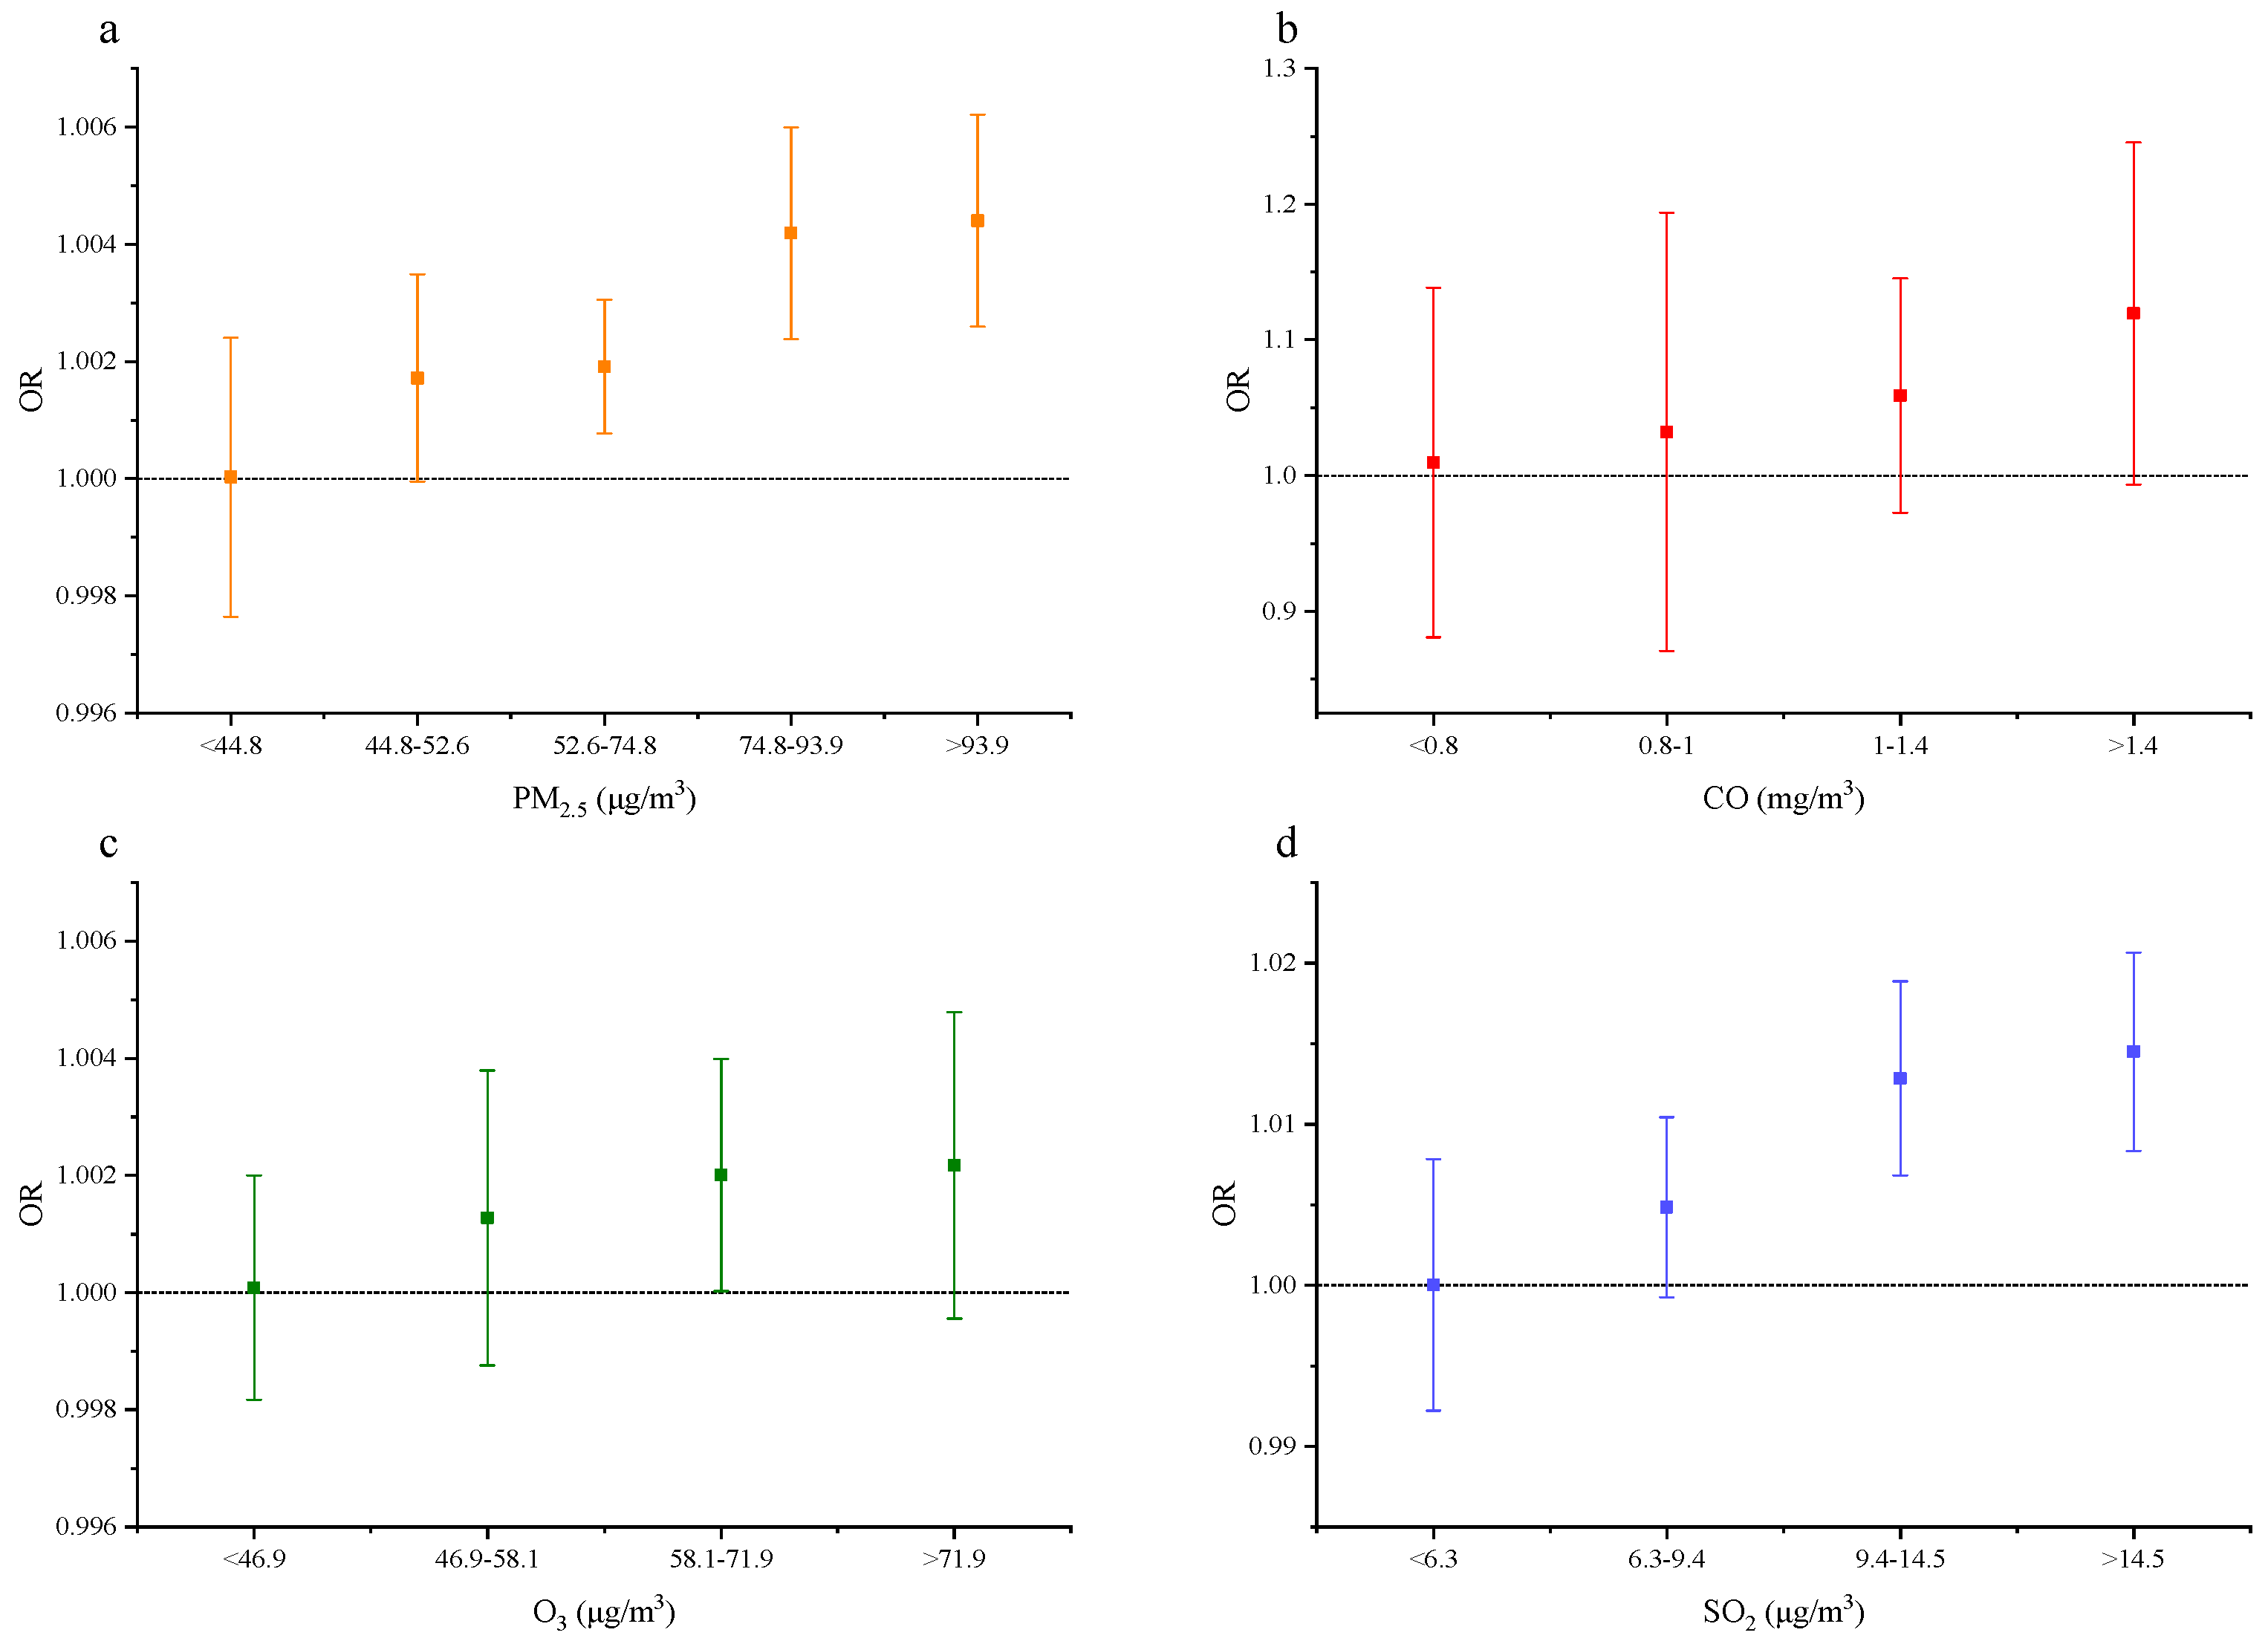
| PM2.5 (μg/m3) | ORs (Jun. 2014–Dec. 2017, Controlling for SO2 and O3) | ORs (Dec. 2008–Dec. 2017, without Controlling Other Pollutants) | ORs (Jun. 2014–Dec. 2017, without Controlling Other Pollutants) |
|---|---|---|---|
| <44.8 | 1.000 (0.998, 1.002) | 1.000 (0.998, 1.002) | 1.000 (0.998, 1.002) |
| 44.8–52.6 | 1.002 (1.000, 1.003) | 1.002 (1.000, 1.004) | 1.002 (1.000, 1.004) |
| 52.6–74.8 | 1.002 (1.001, 1.003) | 1.004 (1.003, 1.005) | 1.002 (1.001, 1.003) |
| 74.8–93.9 | 1.004 (1.002, 1.006) | 1.005 (1.003, 1.006) | 1.003 (1.001, 1.005) |
| >93.9 | 1.004 (1.003, 1.006) | 1.005 (1.003, 1.007) | 1.004 (1.003, 1.006) |
| SO2 (μg/m3) | ORs (Jun. 2014–Dec. 2017, Controlling for PM2.5, CO, and O3) | ORs (Jun. 2014–Dec. 2017, without Controlling Other Pollutants) |
|---|---|---|
| <6.3 | 1.000 (0.992, 1.008) | 1.001 (0.993, 1.009) |
| 6.3–9.4 | 1.005 (0.999, 1.010) | 1.003 (0.997, 1.008) |
| 9.4–14.5 | 1.013 (1.007, 1.019) | 1.010 (1.004, 1.016) |
| >14.5 | 1.015 (1.008, 1.021) | 1.011 (1.005, 1.018) |
| CO (mg/m3) | ORs (Jun. 2014–Dec. 2017, Controlling for SO2 and O3) | ORs (Jun. 2014–Dec. 2017, without Controlling Other Pollutants) |
|---|---|---|
| <0.8 | 1.010 (0.881, 1.139) | 1.003 (0.880, 1.125) |
| 0.8–1 | 1.032 (0.871, 1.194) | 1.055 (0.977, 1.133) |
| 1–1.4 | 1.059 (0.973, 1.145) | 1.071 (0.962, 1.180) |
| >1.4 | 1.120 (0.993, 1.246) | 1.122 (0.944, 1.298) |
| O3 (μg/m3) | ORs (Jun. 2014–Dec. 2017, Controlling for PM2.5, SO2, and CO) | ORs (Jun. 2014–Dec. 2017, without Controlling Other Pollutants) |
|---|---|---|
| <46.9 | 1.000 (0.998, 1.002) | 1.000 (0.998, 1.002) |
| 46.9–58.1 | 1.001 (0.999, 1.004) | 1.001 (0.999, 1.004) |
| 58.1–71.9 | 1.002 (1.000, 1.004) | 1.002 (1.000, 1.004) |
| >71.9 | 1.002 (1.000, 1.005) | 1.002 (0.999, 1.004) |
Publisher’s Note: MDPI stays neutral with regard to jurisdictional claims in published maps and institutional affiliations. |
© 2021 by the authors. Licensee MDPI, Basel, Switzerland. This article is an open access article distributed under the terms and conditions of the Creative Commons Attribution (CC BY) license (https://creativecommons.org/licenses/by/4.0/).
Share and Cite
Yu, Q.; Zhang, L.; Hou, K.; Li, J.; Liu, S.; Huang, K.; Cheng, Y. Relationship between Air Pollutant Exposure and Gynecologic Cancer Risk. Int. J. Environ. Res. Public Health 2021, 18, 5353. https://doi.org/10.3390/ijerph18105353
Yu Q, Zhang L, Hou K, Li J, Liu S, Huang K, Cheng Y. Relationship between Air Pollutant Exposure and Gynecologic Cancer Risk. International Journal of Environmental Research and Public Health. 2021; 18(10):5353. https://doi.org/10.3390/ijerph18105353
Chicago/Turabian StyleYu, Qiwei, Liqiang Zhang, Kun Hou, Jingwen Li, Suhong Liu, Ke Huang, and Yang Cheng. 2021. "Relationship between Air Pollutant Exposure and Gynecologic Cancer Risk" International Journal of Environmental Research and Public Health 18, no. 10: 5353. https://doi.org/10.3390/ijerph18105353