Case Report

Anaerobic Ammonium Oxidation Bacteria in a Freshwater Recirculating Pond Aquaculture System

1
Fishery Machinery and Instrument Research Institute, Chinese Academy of Fisheries Sciences, Shanghai 200092, China
2
East China Normal University, Shanghai 200241, China
*
Author to whom correspondence should be addressed.
Int. J. Environ. Res. Public Health 2021, 18(9), 4941; https://doi.org/10.3390/ijerph18094941
Submission received: 17 March 2021 / Revised: 26 April 2021 / Accepted: 27 April 2021 / Published: 6 May 2021
(This article belongs to the Section Environmental Microbiology)

Abstract

:
Anaerobic ammonium oxidation (anammox) is a key biochemical process to reduce nitrogen pollution in aquaculture, especially in water recirculating pond aquaculture system (RPAS). We used 16S RNA and quantified PCR to study the distribution and environmental impacts of anammox bacteria in RPAS. The results show that the anammox bacterial community distributions and diversities that are apparently unit-specific and seasonal have significant (p < 0.05) difference variation in the RPAS. Most of the anaerobic ammonium oxidation bacteria sequences (77.72%) retrieved from the RPAS belong to the Brocadia cluster. The abundance of anammox bacterial in the RPAS ranged from 3.33 × 101 to 41.84 × 101 copies per ng of DNA. The environmental parameter of temperature and nitrogen composition in water could have impacted the anammox bacterial abundance. This study provides more information on our understanding of the anammox bacteria in the RPAS, and provides an important basis for RPAS improvement and regulation.

1. Introduction

Anaerobic ammonium oxidation (anammox) is a key reaction in RPAS, directly influencing the RPAS efficiency. Since anammox was first found in a wastewater treatment plant in the Netherlands in 1995 [1], widespread anammox bacteria have been found in marine environments, and there is growing evidence of its presence in estuaries [2,3], wetlands [4,5], freshwater rivers [6], freshwater lakes and various soil types [7,8,9]. However, only limited investigations regarding anammox bacteria have been conducted for aquaculture systems. Moreover, the reported works are mainly focused on indoor recirculating aquaculture systems (RAS) [10,11] and marine aquaculture ponds [12]. China is the largest aquaculture country in the world, and the proportion of aquaculture in fish production increased to 73.7% in 2016 [13]. However, since the 1980s, rapid deterioration by diseases has become frequent, pollution emissions have increased, and the production quality has declined, causing serious challenges to aquaculture [14]. A water recirculating pond aquaculture system (RPAS) is an advanced technology aquaculture around the world. RPAS could change traditional pond aquaculture and has the following advantages: (1) improves yield and production efficiency; (2) improves the digestibility and absorption rate of feed; (3) reduces production energy consumption and recycles used water; (4) improves labor efficiency and supports multi-level breeding, which can be well distributed to the market; and (5) is beneficial to the industrialized management of pond aquaculture. However, to the best of our knowledge, there is limited information available regarding anammox bacteria in freshwater RPAS. In this paper we detected the anammox process by phylogenetic and quantitative PCR approach to investigate the distribution, diversity and abundance of anammox bacteria in the RPAS and the relationship between their bacterial characteristics and the prevalent environmental factors, which are important for RPAS improvement and regulation.

2. Materials and Methods

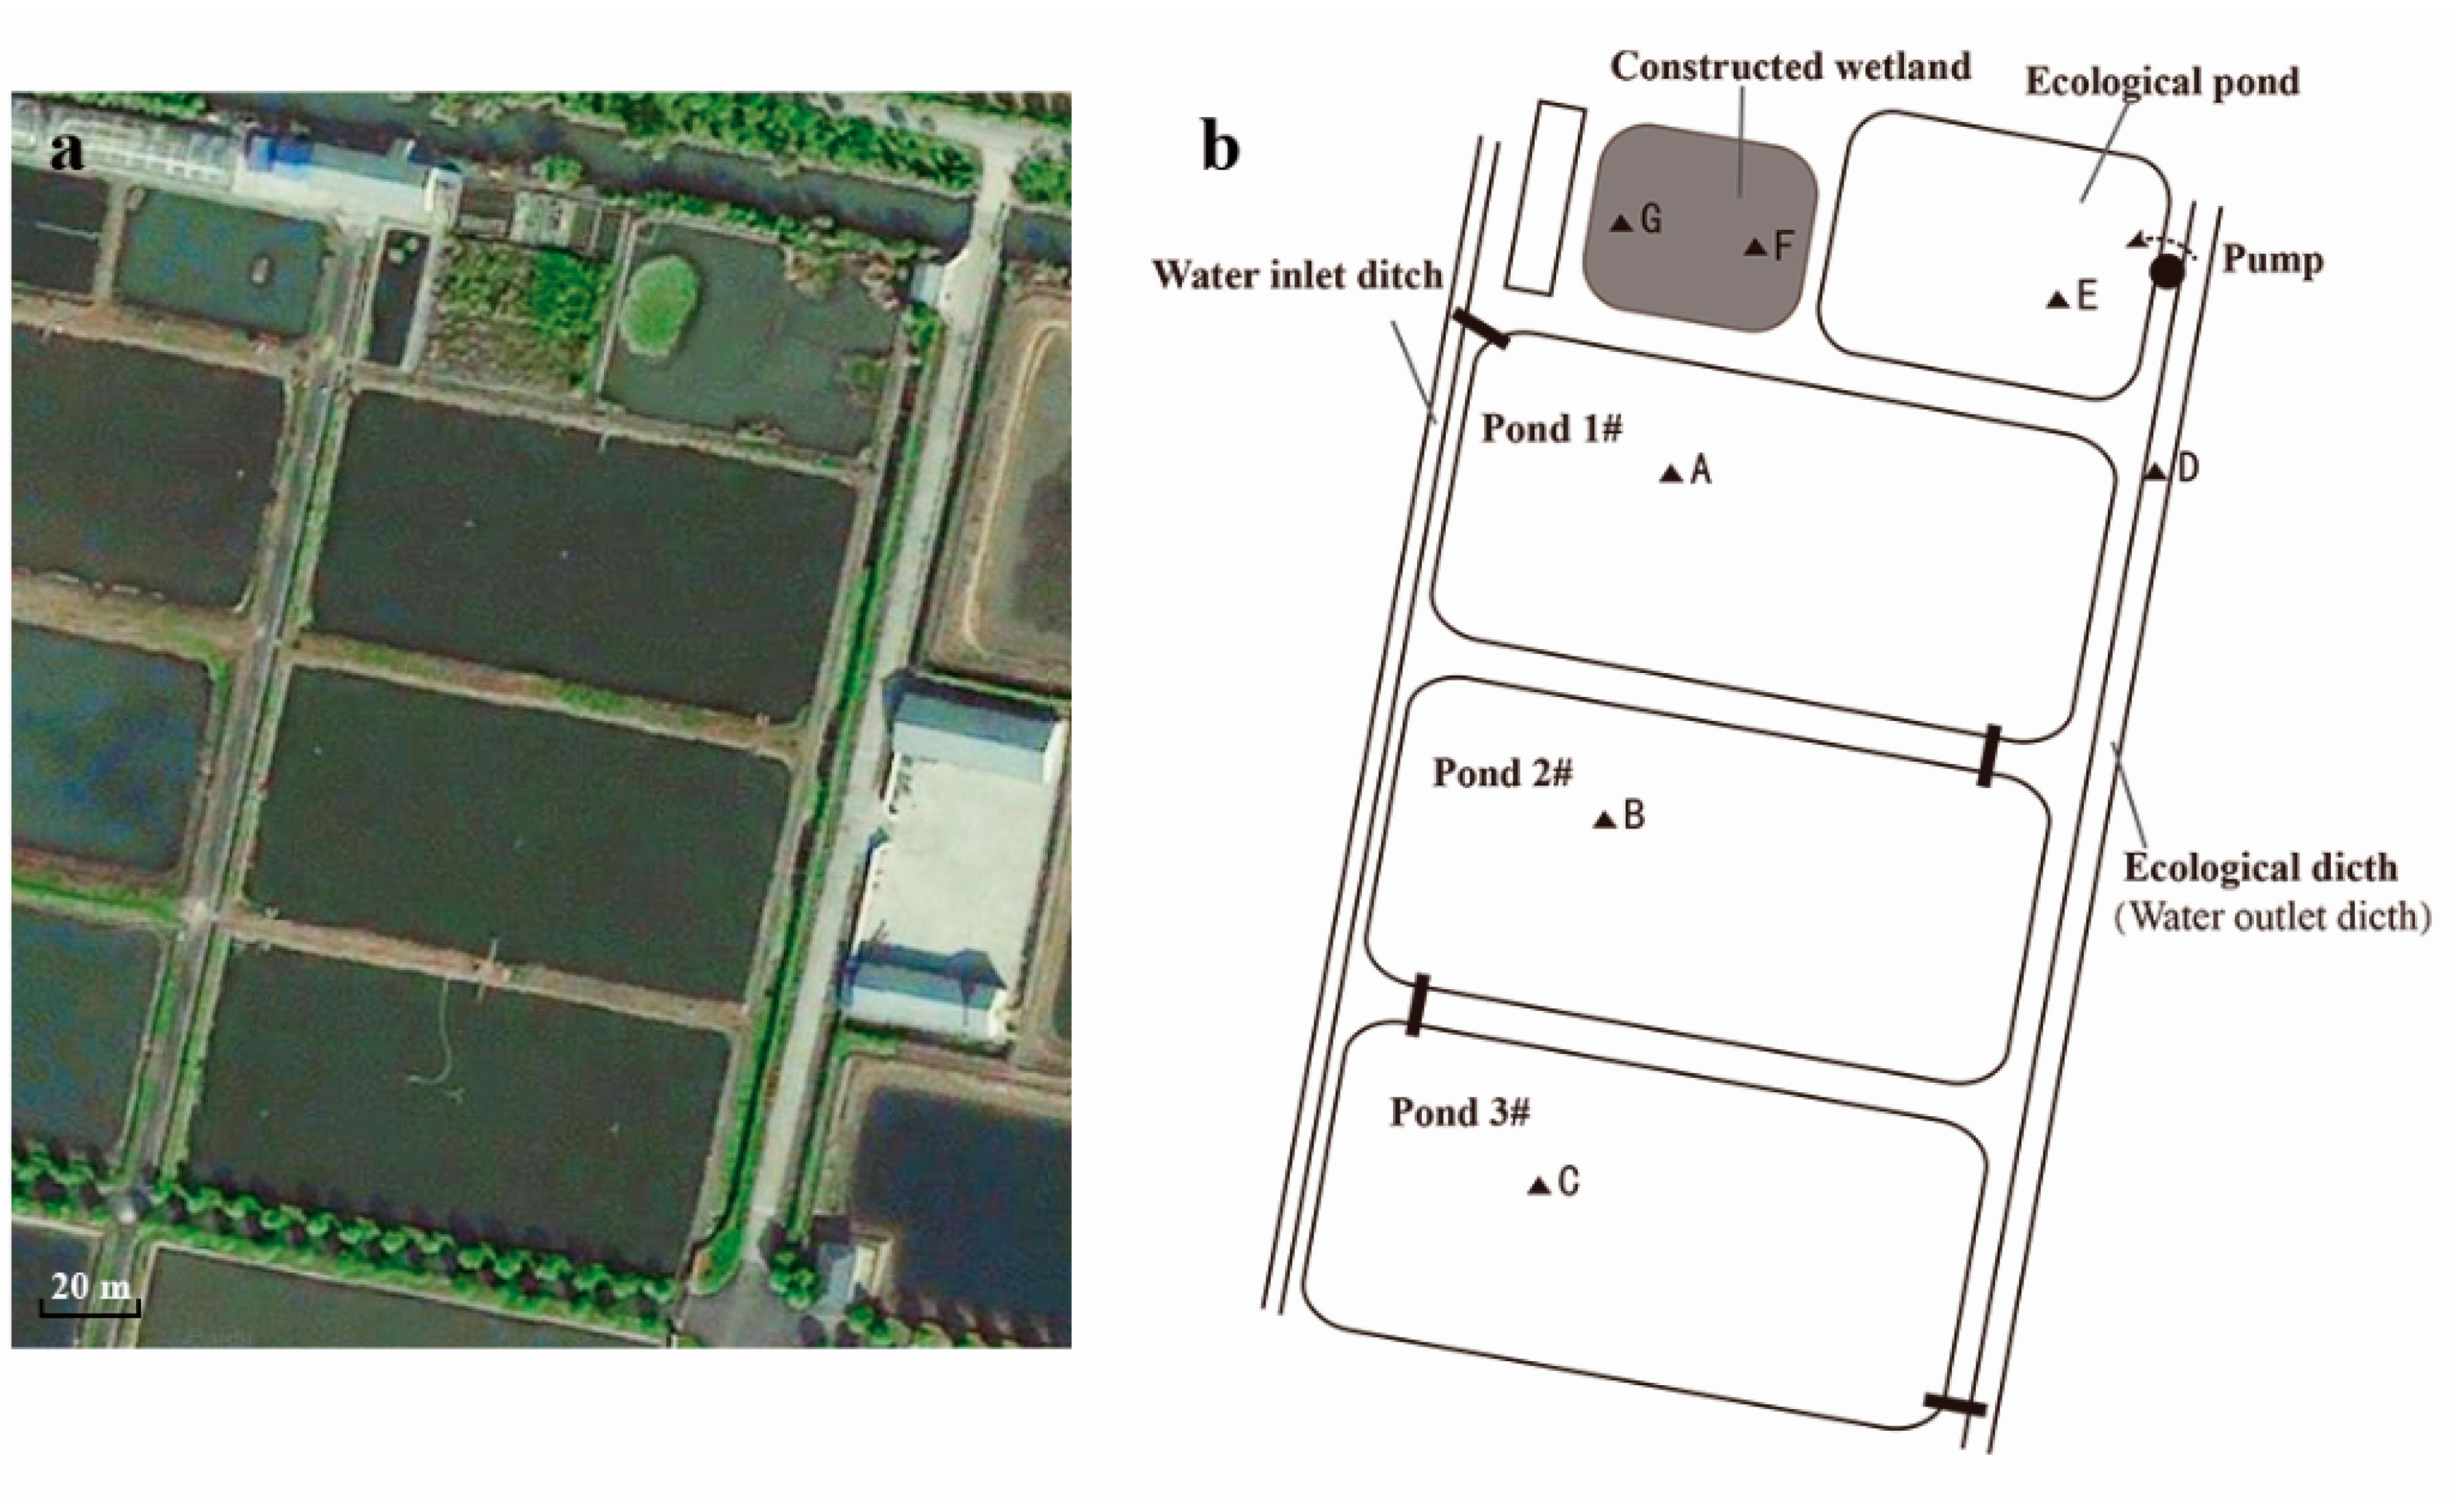
2.1. RPAS Description

This study chose a typical water recirculating pond aquaculture system (RPAS) in China: the RPAS was located in Punan aquaculture farm (31°57′01″ N, 120°08′52″ E), Songjiang, Shanghai, China, and covers an area of about 2 ha. It consists of three functional units: an aquaculture pond (CP), pre-treatment unit (PT) and constructed wetland (CW) [15]. The RPAS system was started in 2010 (Figure 1).

2.2. Sample Collection and Physicochemical Analyses

Seven representative sample sites (black triangles in Figure 1b) were selected from pond 1# to CW and labeled with A–G. Sites A–C represent the culture pond unit (CP). Sites D and E are located at the eco-ditch and eco-pond, respectively, representing the pre-treatment unit (PT). Sites F and G represent the inlet and outlet parts of CW, respectively. In CP and PT units (sites A–E), surface sediments (0–5 cm) and corresponding overlying waters within a 0.5 m radius were collected. Three replicate sub-samples were collected at each sampling site and homogenized to obtain a representative sample. Due to the absence of soil in CW, samples of gravel from sites F and G were collected for the molecular analyses. For each site, the gravel sample was taken by layer at the depths of 0–20 (surface layer), 30–40 (middle layer) and 50–60 cm (bottom layers), and then were mixed. Interstitial water samples from sites F and G were also collected. All sediment, gravel and water samples were immediately put into ice boxes and transported back to the laboratory shortly after collection. In the laboratory, samples for subsequent molecular studies were kept at −80 °C and samples for physiochemical analysis were processed immediately. Sampling was conducted in March, June and September 2014, which correspondingly represented the prophase, metaphase and anaphase of the aquaculture period.
Temperature, pH, salinity, redox potentials (ORP) and dissolved oxygen (DO) in overlapping water of sites A–E and interstitial water in sites F and G were measured in situ prior to sampling using an YSI Pro Plus (YSI Inc., Yellow Springs, OH, USA). Inorganic N of the sediments was extracted with 2 M KCl in a 1:4 ratio (sediment to solution) for 1 h. Total phosphorus (TP), orthophosphate (PO4+-P), nitrite (NO2-N), nitrate (NO3-N), ammonia (NH4+-N), total nitrogen (TN) and total organic carbon (TOC) in water samples and PO4+-P, NO2-N, NO3-N, NH4+-N and TOC in sediment samples were quantified spectrophotometrically according to a previous study [16]. Sediment dry weights (DW) were measured after being dried in an oven at 105 °C for 24 h until constant weight was achieved. The concentration of PO4+-P, NO2-N, NO3-N, NH4+-N and TOC in sediments were recalculated based on their DW contents. All the tests were operated in three replicates.

2.3. DNA Extraction and Nested PCR

Environmental DNA was extracted from sediments samples using Power Soil DNA Kit (Mo Bio Laboratories, Inc., Carlsbad, CA, USA), following the manufacturer’s instructions. For the gravel samples, moderate amounts of the samples were mixed with 200 mL sterile PBS solution, and then rotated at 200 r/min for 1 h. The suspension solution was filtered with 0.22 μm Millipore Sterivex™ filter units (Millipore Corporation, Billerica, MA, USA). Genomic DNA was extracted from the filters using Power Soil DNA Kit. DNA of each sample was extracted three times and pooled to minimize the bias. Nested-PCR assay was conducted to detect anammox 16S rRNA genes, the detailed steps refer to the literature of Zhu et al. [17]. The initial amplification was carried out using the PLA46f-630r primer combination with a thermal profile of 96 °C for 10 min, followed by 35 cycles of 60 s at 96 °C, 1 min at 56 °C and 1 min at 72 °C [18]. Then, a 500-times diluted (1 μL) PCR product was used as template for the second amplification with Amx368f-Amx820r primers using a thermal profile of 96 °C for 10 min, followed by 25 cycles of 30 s at 96 °C, 1 min at 58 °C, 1 min at 72 °C [19]. All quantitative PCR products from different primer sets were electrophoresed on 1% agarose gels.

2.4. Quantitative PCR Assay

The 16S rRNA genes of anammox bacteria and total bacteria were analyzed by quantitative PCR (qPCR) using CFX96 real-time system (Life Science Research, Education, Process Separations, Food Science. Bio-Rad Laboratories (Shanghai) Co., Ltd., Room 601, Anlian Building, No. 168 Jingzhou Road, Yangpu District, Shanghai, China 200082). Anammox bacterial 16S rRNA genes were quantified with the primer set of AMX-808-F/AMX-1040-R and the TaqMan probe AMX-931 according to the TaqMan fluorogenic PCR method developed by Hamersley et al. [20]. The general bacterial primer pair of 1055F/1392R was selected for the total bacterial 16S rRNA gene assay [21], the specific steps were performed according to Zhu et al. [17]. All qPCR amplifications were performed in triplicate. Negative controls containing no template DNA were subjected to the same qPCR procedure to exclude any possible contamination.
Standard curves were constructed with ten-fold serial dilution of standard plasmids containing corresponding target 16S rRNA genes. The plasmid DNA concentration was determined on GeneQuant II RNA/DNA calculator (Amersham-Pharmacia Biotech., Buckinhamshire, UK), the copy number of target genes was calculated from the concentration of extracted plasmid DNA. The qPCR amplification efficiency was 90–93%, the correlation coefficients (R2) were greater than 0.99 for the two targeted genes.

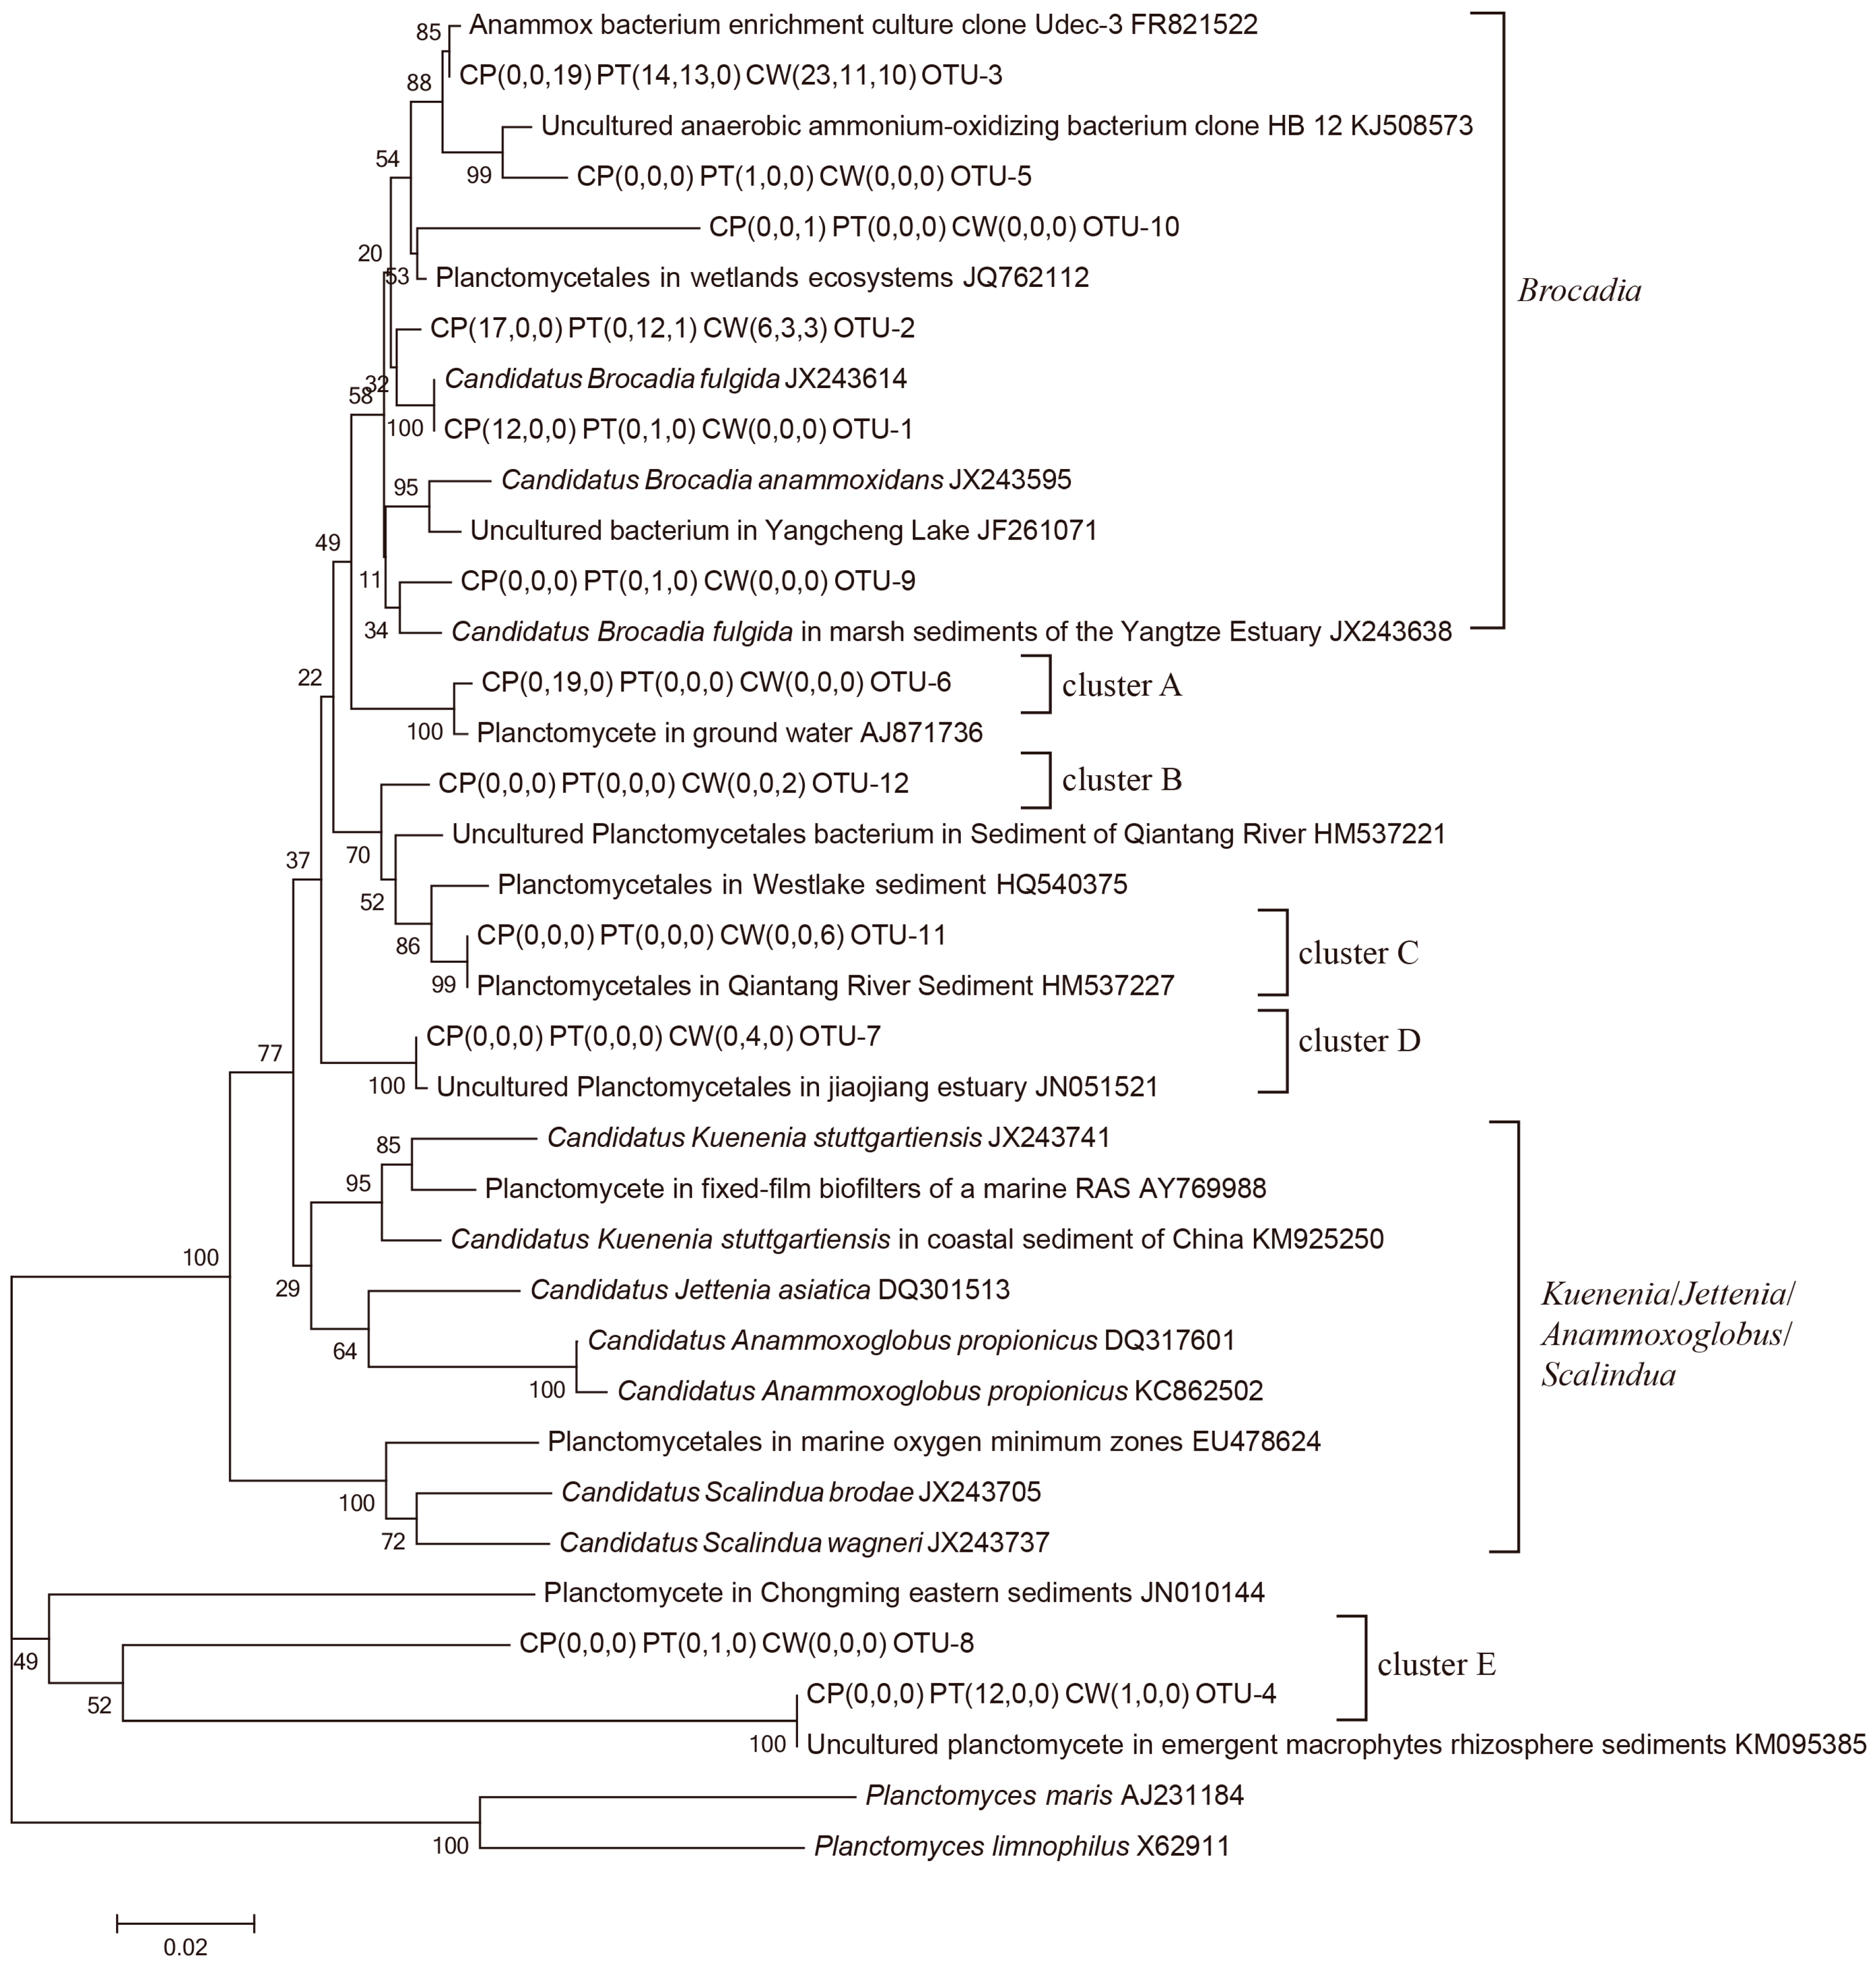
2.5. Cloning, Sequencing and Phylogenetic Analysis

PCR-amplified DNA fragments of the desired size were excised from the gel and purified with GeneJET™ Gel Extraction Kit (Thermo Scientific, Waltham, MA, USA). The obtained purified fragments from sites A–C, sites D–E and sites F–G were equivalently pooled (m/m) to form 3 composite samples, representing the units of culture pond, pre-treatment unit and constructed wetland, respectively. Each of the composite DNA fragments was ligated into a pUCm-T vector (Sangon Biotech Co., Ltd., Shanghai, China) and transformed into Escherichia coli DH5a. Cloned inserts of targeting gene fragments were verified by PCR amplification with the primers M13 F/R. Sequencing was performed by Sangon Biotech Co., Ltd. (Shanghai, China). The obtained DNA sequences were examined and edited using DNASTAR Laser gene SeqMan Program (DNASTAR, Madison, WI, USA). The most closely related 16S rRNA gene sequences were found in the public databases NCBI BLAST (http://www.ncbi.nih.gov, accessed on 6 May 2021). The partial 16S rRNA genes of anammox bacteria were manually compiled and aligned by using Clustal W [22]. Mega4.5 adjacency method was used to construct phylogenetic tree, and 1000 repeated bootstrap resampling was used to estimate the confidence of tree nodes.

2.6. Nucleotide Sequence Accession Numbers

The sequences determined in this study for anammox bacteria are available in GenBank database under accession numbers KP701041, KP701042, KP701045 and KP729590–KP729598.

2.7. Statistical Analysis

Operational taxonomic units (OTUs) for community analysis were defined by a 3% difference in nucleotide sequences. The coverage, diversity (Shannon, Simpson) and richness index (Chaol and SACE) for each clone library were calculated by Mothur v1.33.3 program. The correlations between microbial communities and environmental factors were analyzed using Pearson’s moment correlation analysis of SPSS version 16.0. The redundancy analysis (RDA) of CANOCO (ver. 4.5; Microcomputer Power, Ithaca, NY, USA) was chosen to analyze the relationship between anammox community distribution and environmental factors [23].

3. Results

3.1. Physicochemical Characteristics of the RPAS

In eastern China, the pond culture cycle is generally about 10 months. In China pond culture, the total nitrogen (TN), total phosphorus (TP) and chemical oxygen demand are required to be less than 5 mg/L, 1 mg/L and 25 mg/L, respectively [24]. Therefore, the water quality of pond culture is also required to be within this range. During the 10 months of the experiment period, the physicochemical properties of the sampling sites in the RPAS are summarized in Table 1. All of the sampling sites showed slightly alkaline pH values between 7.02 and 7.65. For the TOC, TN, and NH4+-N concentrations in the water, the values ranked in the order of CP > PT > CW, implying the purifying effects of the PT and CW. The concentration of NH4+-N, NO2-N and NO3-N in the water of the system were relatively low, indicating its suitability for fish culture. For the sediments, the TOC contents were between 2.16 and 3.75 g/kg, while the NH4+-N contents varied from 117.47 to 164.26 mg/kg, which was remarkably higher than the contents of NO2-N and NO3-N (Table 1).

3.2. Diversity and Distribution of Anammox Bacteria in RPAS

Of the nine 16S rRNA gene clone libraries of anammox bacteria, a total of 202 positive clones were identified and separated into 12 OTUs (Figure 2). The positive clones of different samples varied from 17 to 30, with 1–5 OTUs in each sample. A total of 202 sequences from nine libraries yielded 105 unique OTUs, with the highest diversity at the CW in March (CW3). The library coverage values were generally greater than 95.0% except for the PT value in June (PT6), which was 76.5%, indicating that the majority of the anammox bacteria were represented in these clone libraries. The PT6 sample had the highest OTU number, whereas the highest Shannon index (1.21) and lowest Simpson index (0.3) were found in a sample from the CW in September (CW9). The lowest OTU number was detected in the CP in June (CP6) and PT in September (PT9) and only consisted of a single OTU. The highest SACE estimator was 4.76 in CW3, and the highest Chaol estimator was 11.00 in PT6. Based on the diversity (Shannon and Simpson) and richness indices (SACE and Chaol) of the16S rRNA genes (Table 2), it shows an apparent unit-specific or seasonal variation in community diversities.
The phylogenetic 16S rRNA gene sequences of the anammox bacteria from this study and their closest relatives are depicted in a consensus tree, as shown in Figure 2. The consensus tree indicated that the 16S rRNA gene sequences are grouped into six clusters, i.e., the Brocadia cluster and A, B, C, D and E clusters, which account for 77.72, 9.41, 0.99, 2.97, 1.98 and 6.93% of all of the sequences selected, respectively. The majority of the 16S rRNA gene sequences (77.72%) belonging to the Brocadia cluster consisted of sequences from all the samples except for that from the CP in June (CP6) (Table 3). These sequences were affiliated with OTU1, 2, 3, 5, 9 and 10 and showed 95.0–100.0% identities with Ca. Brocadia fulgida (JX243614), except for OTU-10, which only showed 92.1% identity. OTU-1 was 100% identical to Ca. Brocadia fulgida, while OTU-2 and 3 had 98.3 and 97.3% identity, respectively. Cluster E was the third large fraction of sequences (6.93% sequences) and mainly retrieved from PT3 (Figure 2). These sequences shared low identity (72.1–83.1%) with known anammox bacteria and clustered outside all known anammox bacterial genera. In addition, among the twelve OTUs of all samples, OTU-2 and 3 accounted for a percentage greater than 10%, at 44.55% and 25.25%, respectively. This indicated that the sequences related to OTU-2 and 3 represented the most common and dominant anammox bacteria in the aquaculture system. The distributions of anammox bacteria among the samples from the three units presented slight differences (Table 3). Sequences from six of the nine samples (CP3, CP9, PT3, PT6, PT9 and CW3) were completely grouped into the Brocadia cluster. All of the sequences from CP6 belonged to cluster A. Sequences from the CW were distributed in all anammox bacteria clusters except for cluster A, indicating that the CW has a comparatively higher anammox community diversity than the CP and PT.

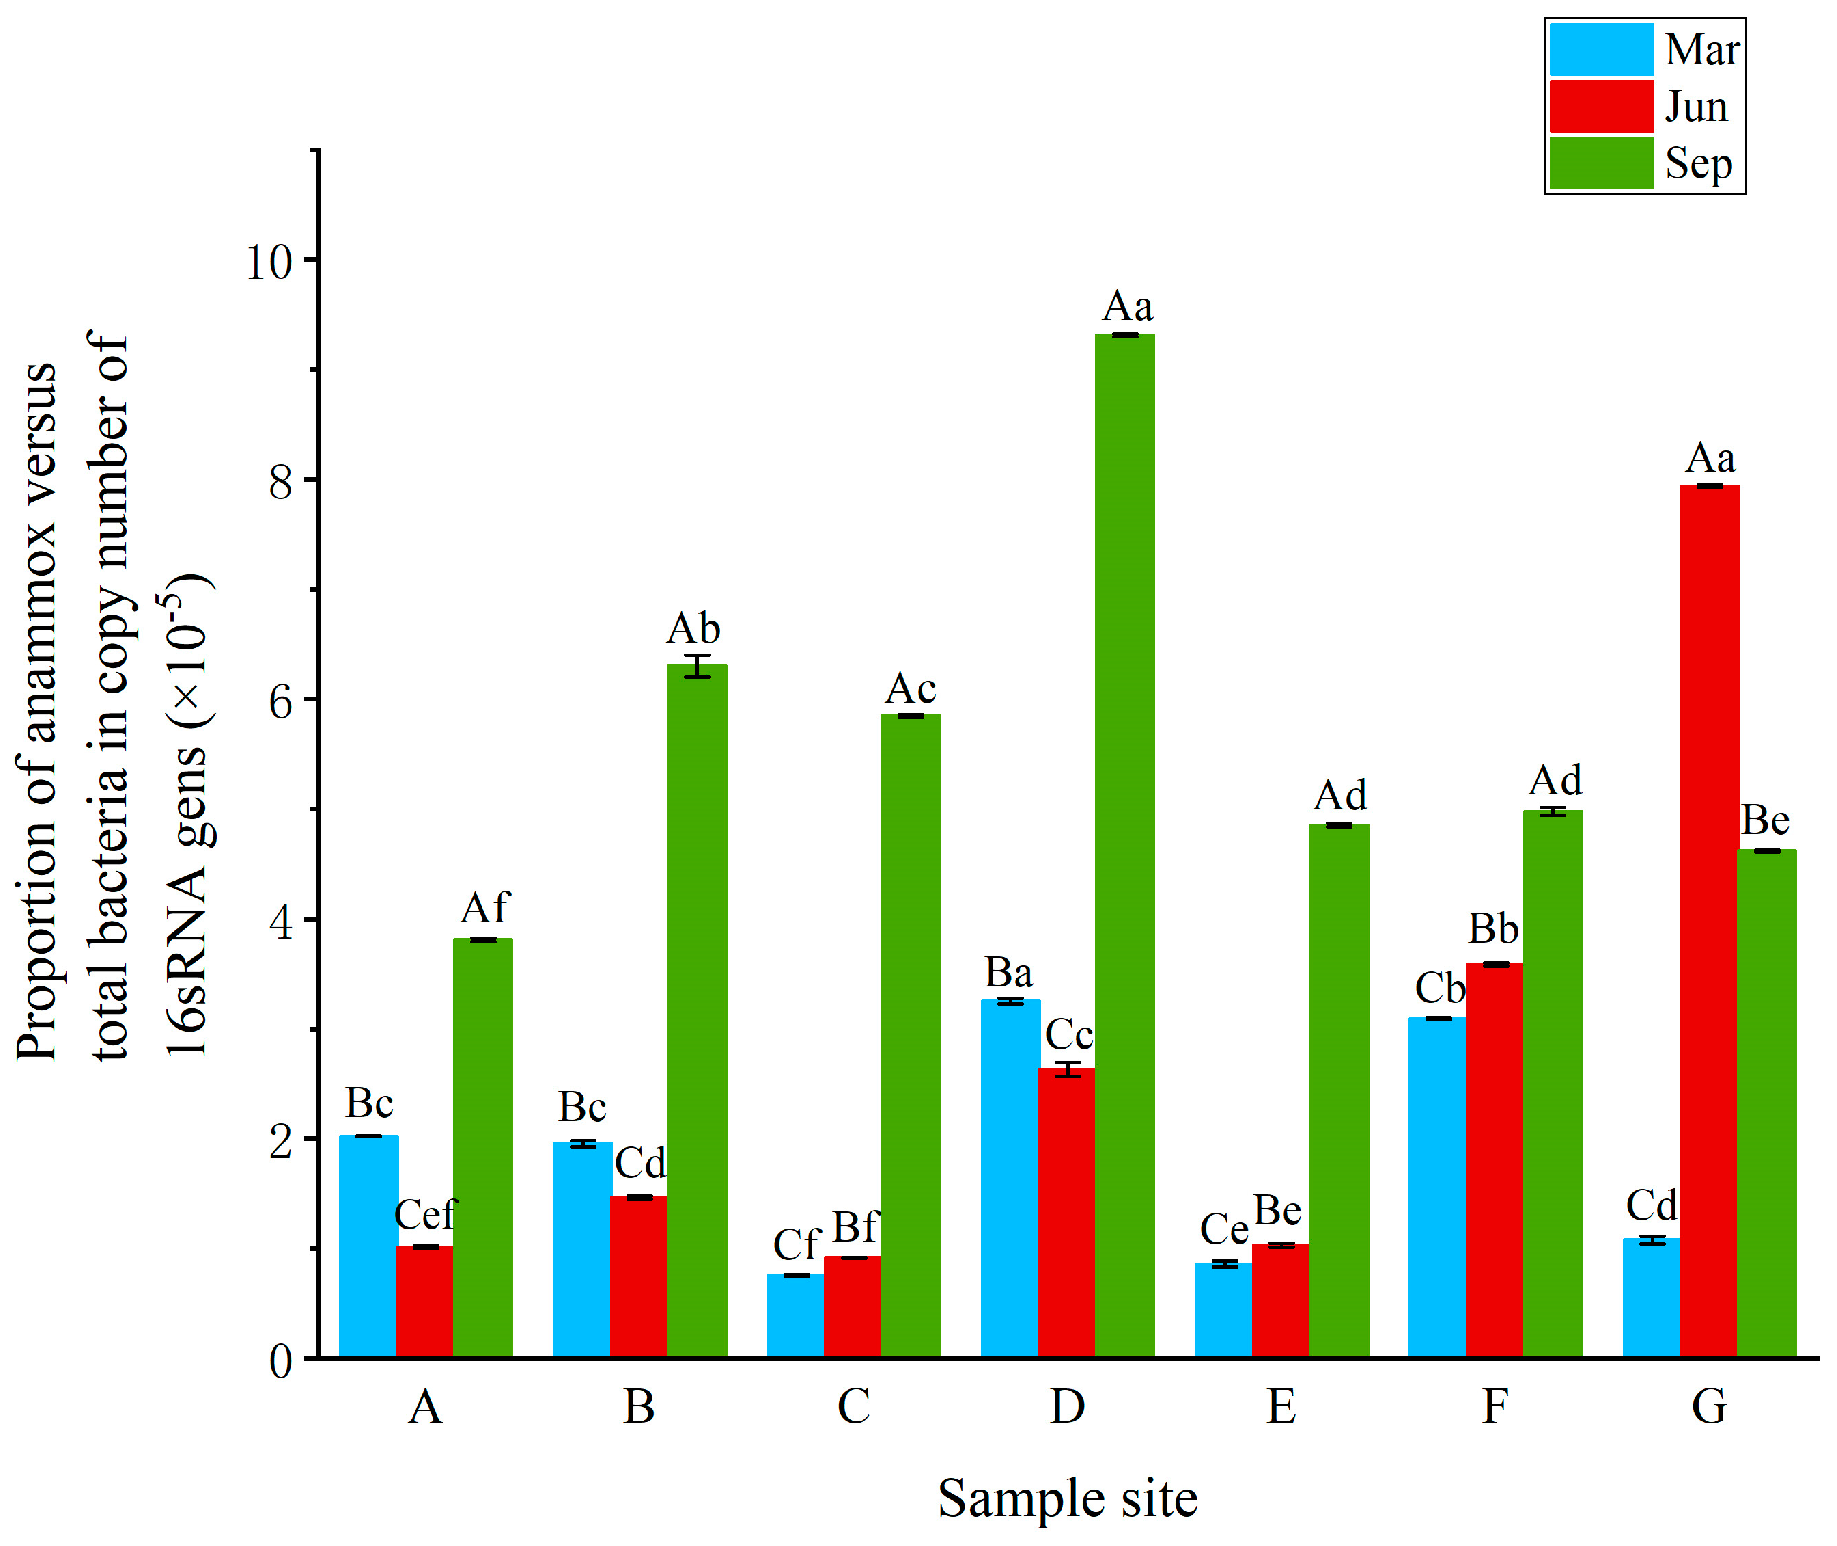
3.3. Abundance of Anammox Bacteria in RPAS

The used Real-time quantified PCR analyses showed that the gene copies of the anammox and total bacteria varied with the difference in sampling site (Table 4). Generally, the copy numbers of anammox bacteria varied from 3.33 × 101 to 41.84 × 101 copies per ng of DNA (4.93 × 10⁵–121.80 × 10⁵ copies per g DW for sites A–E), with the highest abundance (41.84 × 101 copies per ng of DNA) observed at site G in June (G6). The abundance of total bacterial 16S rRNA genes ranged from 1.13 × 10⁶ to 7.81 × 10⁶ copies per ng of DNA (3.33 × 10¹⁰–14.70 × 10¹⁰ copies per g DW for sites A–E). The highest 16S rRNA gene copies (7.81 × 10⁶ copies per ng of DNA) were detected at site A in June (A6). The proportion of anammox bacteria was between 0.66 × 10⁻⁵ and 9.42 × 10⁻⁵, while the proportion in September was generally higher than that in March and June except for site G. In June, the proportion of anammox bacteria in the CW (sites F and G) was higher than that in the other units (CP and PT) (Figure 3).

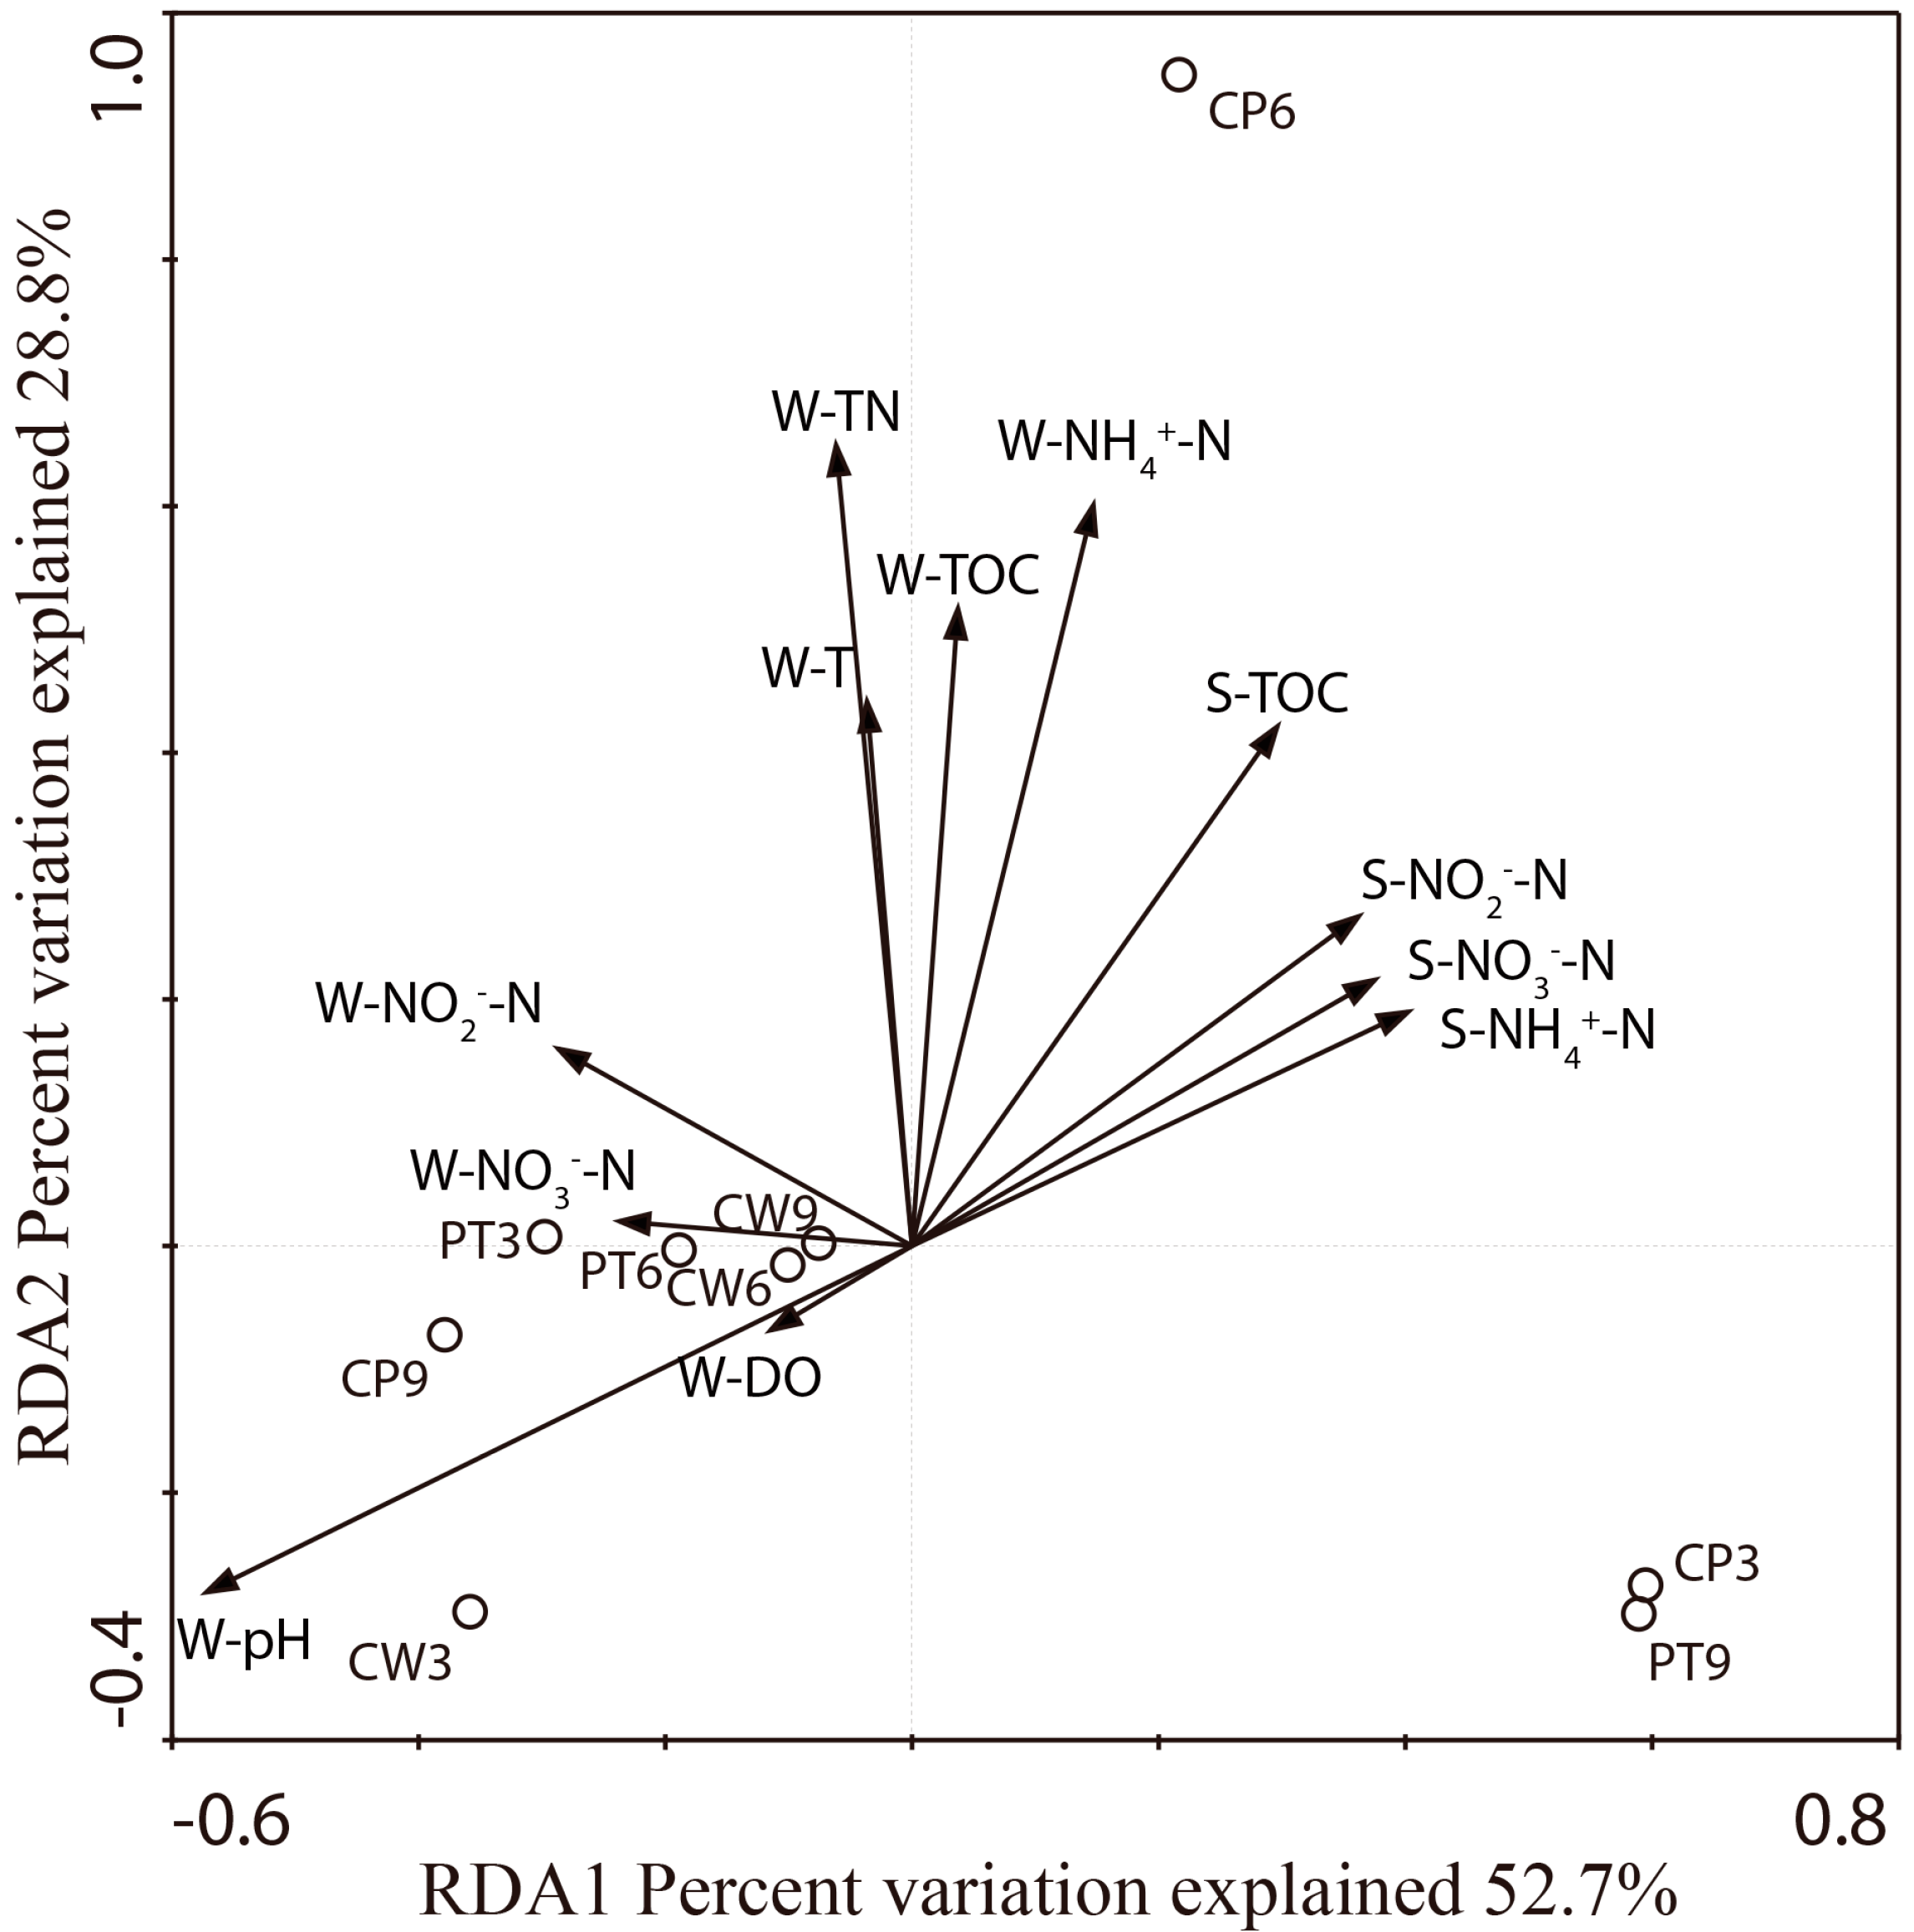
3.4. Correlations of Anammox Bacteria with Environmental Factors

Pearson’s moment correlation analysis indicated that the Shannon index and SACE estimator were significantly (p < 0.05) negatively correlated with the NH4+-N concentration in water, while Simpson index was positively (p < 0.05) correlated with it (Table 5). The abundance of anammox bacteria 16S rRNA genes was significantly (p < 0.05) negatively correlated with the NO2-N content of sediment. RDA was used to correlate the community assemblages of anammox bacteria with the environmental factors for further elucidation of the varying anammox bacteria community compositions in the aquaculture system. The first two RDA dimensions could explain 81.5% of the total variance in the anammox bacterial composition and the cumulative variance of the anammox bacteria environment relationship (Figure 4).

4. Discussion

Numerous previous studies have demonstrated the widespread occurrence of anammox bacteria in natural and man-made ecosystems [10,11,12]. The anammox bacteria genera Ca. Brocadia, Ca. Jettenia and Ca. Kuenenia were reported to be the most common and dominant genera in terrestrial freshwater habitats [25]. This study showed that 77.72% of the sequences retrieved from the RPAS belonged to the Brocadia cluster, suggesting that Ca. Brocadia is the representative anammox bacteria in the RPAS. Ca. Brocadia may be ubiquitous in freshwater ecosystems [26,27]. Ca. Brocadia may have a diverse metabolism and possess strong adaptability [28]. Bryant et al. suggested that more homogeneous organic matter in an environment reduces the various niches available for microbes and therefore leads to decreased diversity [29]. The higher diversity of the CW, compared to that of the other units (CP and PT) observed in this study, is important for optimizing RPAS.
Furthermore, it was estimated that the anammox process accounted for 9–40% of the nitrogen loss in freshwater ecosystems. The proportion of anammox bacteria observed in this study was within the range found in other freshwater [30] and marine [9] environments (10−5–10−3) but was relatively low. The relatively low proportion observed and the shift in September may be related to some aquaculture environment characteristics. These results showed a heterogeneous spatial and temporal distribution of the anammox bacterial abundance in the RPAS. It is helpful for us to regulate the system environment to give rein to the role of anaerobic ammonia oxidation.
In this study, the NH4+-N concentration in water was significantly negatively correlated with the Shannon index and SACE estimator, and the NO2-N content in sediment was significantly negatively correlated with the anammox bacteria abundance (Table 5 and Figure 4). High NH4+-N concentration was also reported to stimulate anammox bacteria in many anammox bioreactors, and relatively high ammonia loading can be beneficial for anammox bacteria growth [17]. The abundance of anammox communities that was both spatially and temporally heterogeneous, obtained here may be related to some specific characteristics in RPAS systems (e.g., recirculating water). This provides a clue for enhancing the anaerobic ammonia oxidation function in wetlands.
In summary, this research makes us more familiar with the anammox bacteria in RPAS, and provides a strong evidence for the regulation of the RPAS.

Author Contributions

X.-G.L. designed the research plan, J.W. performed the simulations and analysis, Z.-F.W., G.-F.C., Z.-J.G. wrote the paper. All authors have read and agreed to the published version of the manuscript.

Funding

“Modern agricultural industrial technology system in China” (grant No. CARS-46), and the National key R & D plan of China (grant No. 2019YFD0900300) and Shanghai Sailing Program (No. 18YF1407500) for financial support.

Institutional Review Board Statement

Not applicable.

Informed Consent Statement

Not applicable.

Acknowledgments

The authors would like to thank the “Modern agricultural industrial technology system in China” (grant no. CARS-46), the National key R & D plan of China (grant no. 2019YFD0900300) and the Shanghai Sailing Program (No. 18YF1407500) for financial support. The authors also thank the reviewers for their contribution in improving our manuscript.

Conflicts of Interest

The author declares no competing interest.

References

  1. Mulder, A.; van de Graaf, A.A.; Robertson, L.A.; Kuenen, J.G. Anaerobic ammonium oxidation discovered in a denitrifying fluidized bed reactor. FEMS Microbiol. Ecol. 1995, 16, 177–183. [Google Scholar] [CrossRef]
  2. Trimmer, M.; Nicholls, J.C.; Deflandre, B. Anaerobic ammonium oxidation measured in sediments along the Thames estuary, United Kingdom. Appl. Environ. Microbiol. 2003, 69, 6447–6454. [Google Scholar] [CrossRef] [PubMed] [Green Version]
  3. Wang, S.; Zhu, G.; Peng, Y.; Jetten, M.S.; Yin, C. Anammox bacterial abundance, activity, and contribution in riparian sediments of the Pearl River estuary. Environ. Sci. Technol. 2012, 46, 8834–8842. [Google Scholar] [CrossRef] [PubMed]
  4. Lee, K.; Wang, Y.; Zhang, G.; Gu, J. Distribution patterns of ammonia-oxidizing bacteria and anammox bacteria in the freshwater marsh of Honghe wetland in Northeast China. Ecotoxicology 2014, 23, 1930–1942. [Google Scholar] [CrossRef]
  5. Wang, Y.; Feng, Y.; Ma, X.; Gu, J. Seasonal dynamics of ammonia/ammonium-oxidizing prokaryotes in oxic and anoxic wetland sediments of subtropical coastal mangrove. Appl. Microbiol. Biot. 2013, 97, 7919–7934. [Google Scholar] [CrossRef] [Green Version]
  6. Sun, W.; Xia, C.; Xu, M.; Guo, J.; Wang, A.; Sun, G. Diversity and distribution of planktonic anaerobic ammonium-oxidizing bacteria in the Dongjiang River, China. Microbiol. Res. 2014, 169, 897–906. [Google Scholar] [CrossRef]
  7. Humbert, S.; Tarnawski, S.; Fromin, N.; Mallet, M.P.; Aragno, M.; Zopfi, J. Molecular detection of anammox bacteria in terrestrial ecosystems: Distribution and diversity. ISME J. 2010, 4, 450–454. [Google Scholar] [CrossRef]
  8. Sato, Y.; Ohta, H.; Yamagishi, T.; Guo, Y.; Nishizawa, T.; Rahman, M.H.; Kuroda, H.; Kato, T.; Saito, M.; Yoshinaga, I.; et al. Detection of anammox activity and 16S rRNA genes in ravine paddy field soil. Microbes Environ. 2012, 27, 316–319. [Google Scholar] [CrossRef] [PubMed] [Green Version]
  9. Shen, L.D.; Liu, S.; Lou, L.P.; Liu, W.P.; Xu, X.Y.; Zheng, P.; Hu, B.L. Broad distribution of diverse anaerobic Ammonium-Oxidizing bacteria in Chinese agricultural soils. Appl. Environ. Microbiol. 2013, 79, 6167–6172. [Google Scholar] [CrossRef] [Green Version]
  10. Tal, Y.; Watts, J.; Schreier, H.J. Anaerobic ammonium-oxidizing (anammox) bacteria and associated activity in fixed-film biofilters of a marine recirculating aquaculture system. Appl. Environ. Microbiol. 2006, 72, 2896–2904. [Google Scholar] [CrossRef] [Green Version]
  11. Van Kessel, M.A.H.J.; Harhangi, H.R.; Flik, G.; Jetten, M.S.M.; Klaren, P.H.M.; Op Den Camp, H.J.M. Anammox bacteria in different compartments of recirculating aquaculture systems. Biochem. Soc. Trans. 2011, 39, 1817–1821. [Google Scholar] [CrossRef] [Green Version]
  12. Amano, T.; Yoshinaga, I.; Yamagishi, T.; Thuoc, C.V.; Thu, P.T.; Ueda, S.; Kato, K.; Sako, Y.; Suwa, Y. Contribution of anammox bacteria to benthic nitrogen cycling in a mangrove forest and shrimp ponds, haiphong, vietnam. Microbes Environ. 2011, 26, 1–6. [Google Scholar] [CrossRef] [Green Version]
  13. FAO (Food and Agriculture Organization of the United Nations, Fisheries and Aquaculture Department). The State of World Fisheries and Aquaculture 2018: Meeting the Sustainable Development Goals; Food and Agriculture Organization of the United Nations: Rome, Italy, 2018. [Google Scholar]
  14. Liu, X.G.; Che, X.; Wang, X.D.; Zhu, H.; Cheng, G.F.; Gu, Z.J.; Liu, C. The technology and method for green and clean pond aquaculture. Chin. Fish. Qual. Stand. 2018, 8, 1–8. [Google Scholar]
  15. Liu, X. Study on Pond Aquaculture Pollution and Ecological Engineering Regulation Techniques; Nanjing Agricultural University: Nanjing, China, 2011. [Google Scholar]
  16. Bao, S.D. Chemical Analysis for Agricultural Soil; China Agriculture Press: Beijing, China, 2000. (In Chinese) [Google Scholar]
  17. Zhu, G.; Wang, S.; Wang, Y.; Wang, C.; Risgaard-Petersen, N.; Jetten, M.S.M.; Yin, C. Anaerobic mmonia oxidation in a fertilized paddy soil. ISME J. 2011, 5, 1905–1912. [Google Scholar] [CrossRef] [PubMed]
  18. Juretschko, S.; Timmermann, G.; Schmid, M.; Schleifer, K.H.; Pommerening-Roser, A.; Koops, H.P. Combined molecular and conventional analyses of nitrifying bacterium diversity in activated sludge: Nitrosococcus mobilis and Nitrospira-like bacteria as dominant populations. Appl. Environ. Microbiol. 1998, 64, 3042–3051. [Google Scholar] [CrossRef] [PubMed] [Green Version]
  19. Schmid, M.; Walsh, K.; Webb, R.; Rijpstra, W.; van de Pas-Schoonen, K.; Verbruggen, M.J.; Hill, T.; Moffett, B.; Fuerst, J.; Schouten, S.; et al. Candidatus “Scalindua brodae”, sp nov., Candidatus “Scalindua wagneri”, sp nov., Two new species of anaerobic ammonium oxidizing bacteria. Syst. Appl. Microbiol. 2003, 26, 529–538. [Google Scholar] [CrossRef] [PubMed] [Green Version]
  20. Hamersley, M.R.; Lavik, G.; Woebken, D.; Rattray, J.E.; Lam, P.; Hopmans, E.C. Anaerobic ammonium oxidation in the Peruvian oxygen minimum zone. Limnol. Oceanogr. 2007, 52, 923–933. [Google Scholar] [CrossRef]
  21. Dionisi, H.M.; Harms, G.; Layton, A.C.; Gregory, I.R.; Parker, J.; Hawkins, S.A.; Robinson, K.G.; Sayler, G.S. Power analysis for real-time PCR quantification of genes in activated sludge and analysis of the variability introduced by DNA extraction. Appl. Environ. Microbiol. 2003, 69, 6597–6604. [Google Scholar] [CrossRef] [PubMed] [Green Version]
  22. Thompson, J.D.; Higgins, D.G.; Gibson, T.J. CLUSTAL W: Improving the sensitivity of progressive multiple sequence alignment through sequence weighting, position-specific gap penalties and weight matrix choice. Nucleic Acids Res. 1994, 22, 4673–4680. [Google Scholar] [CrossRef] [Green Version]
  23. Ter Braak, C.; Smilauer, P. CANOCO Reference Manual and Canodraw for Windows User’s Guide: Software for Canonical Community Ordination (Version 4.5); Microcomputer Power: Ithaca, NY, USA, 2002. [Google Scholar]
  24. Ministry of Agriculture of the People’s Republic of China. Requirements for Water Discharge from Freshwater Aquaculture Pond; Fisheries industry standard of the people’s Republic of China, SC/T 9101-2007; China Agriculture Press: Beijing, China, 2007. [Google Scholar]
  25. Hirsch, M.D.; Long, Z.T.; Song, B. Anammox bacterial diversity in various aquatic ecosystems based on the detection of hydrazine oxidase genes (hzoA/hzoB). Microb. Ecol. 2011, 61, 264–276. [Google Scholar] [CrossRef]
  26. Humbert, S.; Zopfi, J.; Tarnawski, S. Abundance of anammox bacteria in different wetland soils. Environ. Microbiol. Rep. 2012, 4, 484–490. [Google Scholar] [CrossRef]
  27. Wenk, C.B.; Blees, J.; Zopfi, J.; Veronesi, M.; Bourbonnais, A.; Schubert, C.J.; Niemann, H.; Lehmann, M.F. Anaerobic ammonium oxidation (anammox) bacteria and sulfide-dependent denitrifiers coexist in the water column of a meromictic south-alpine lake. Limnol. Oceanogr. 2013, 58, 1–12. [Google Scholar] [CrossRef] [Green Version]
  28. Gori, F.; Tringe, S.G.; Kartal, B.; Marchiori, E.; Jetten, M.S.M. The metagenomic basis of anammox metabolism in Candidatus ‘Brocadia fulgida’ (vol 39, pg 1799, 2011). Biochem. Soc. Trans. 2012, 40, 295. [Google Scholar] [CrossRef] [Green Version]
  29. Bryant, J.A.; Stewart, F.J.; Eppley, J.M.; DeLong, E.F. Microbial community phylogenetic and trait diversity declines with depth in a marine oxygen minimum zone. Ecology 2012, 93, 1659–1673. [Google Scholar] [CrossRef] [PubMed]
  30. Sonthiphand, P.; Neufeld, J.D. Evaluating primers for profiling anaerobic ammonia oxidizing bacteria within freshwater environments. PLoS ONE 2013, 8, e57242. [Google Scholar] [CrossRef] [Green Version]
Figure 1. The RPAS and detailed description: (a) actual picture of the RPAS; (b) structural layout of the RPAS.
Ijerph 18 04941 g001
Figure 2. The 16S rRNA gene clone libraries of anammox bacteria in the RPAS.
Ijerph 18 04941 g002
Figure 3. The relative abundances of the anammox bacteria in the RPAS. Letters: a significant diffrerence.
Ijerph 18 04941 g003
Figure 4. RDA of anammox bacteria and environment relationship.
Ijerph 18 04941 g004
Table 1. Physicochemical characteristics of water and sediment samples from the RPAS.
TimeUnits Overlying Water/Interstitial Water aSediments
T
(℃)
DO
(mg/L)
pHTOC
(mg/L)
TN
(mg/L)
NH4+-N
(mg/L)
NO2-N
(mg/L)
NO3-N
(mg/L)
TOC
(g/kg)
NH4+-N
(mg/kg)
NO2-N
(mg/kg)
NO3-N
(mg/kg)
MarchCP11.42 ± 0.022.47 ± 0.437.02 ± 0.08ndndndndnd2.87 ± 0.31117.47 ± 23.500.19 ± 0.014.21 ± 0.42
PT13.43 ± 0.358.94 ± 0.687.77 ± 0.16ndndndndnd3.53 ± 0.72120.75 ± 31.200.13 ± 0.013.93 ± 0.99
CW11.15 ± 0.211.95 ± 0.787.52 ± 0.11ndndndndnd
JuneCP24.87 ± 0.232.54 ± 0.617.20 ± 0.1711.17 ± 0.2916.44 ± 1.930.79 ± 0.020.03 ± 0.000.11 ± 0.033.75 ± 0.37136.77 ± 17.190.18 ± 0.023.63 ± 0.42
PT27.10 ± 0.216.06 ± 1.357.60 ± 0.0510.60 ± 0.3014.89 ± 2.190.50 ± 0.020.02 ± 0.000.04 ± 0.012.93 ± 0.19143.54 ± 22.700.19 ± 0.042.30 ± 0.28
CW24.44 ± 0.691.74 ± 0.837.65 ± 0.048.92 ± 0.1913.46 ± 1.390.33 ± 0.030.02 ± 0.010.19 ± 0.10
SeptemberCP23.35 ± 0.022.93 ± 0.047.54 ± 0.058.62 ± 0.339.24 ± 0.690.58 ± 0.030.10 ± 0.000.56 ± 0.022.16 ± 0.06128.50 ± 40.530.16 ± 0.013.57 ± 0.49
PT22.58 ± 0.185.03 ± 1.887.63 ± 0.118.16 ± 0.195.71 ± 1.540.55 ± 0.020.02 ± 0.000.17 ± 0.022.20 ± 0.08164.26 ± 75.350.13 ± 0.002.93 ± 0.24
CW23.20 ± 0.851.07 ± 0.497.50 ± 0.086.97 ± 0.146.45 ± 0.570.21 ± 0.050.02 ± 0.010.17 ± 0.03
a Overlying water for the CP and PT and interstitial water for the CW; “nd” no data, “–” not applicable; “CP” culture pond unit, “PT” pre-treatment unit, “CW” constructed wetland unit. Values are the mean ± SD calculated from three samples for the CP and two samples for the PT and CW, respectively.
Table 2. Biodiversity and predicted richness of the anammox 16S rRNA genes recovered from the RPAS.
TimeUnitsClonesUnique SequencesOTUsCoverage (%)ShannonSimpsonSACEChaol
MarchCP2992100.00.680.500.002.00
PT2714396.30.820.450.003.00
CW3023396.70.640.624.763.00
JuneCP1991100.00.001.000.001.00
PT1710576.50.870.570.0011.00
CW18153100.00.930.423.003.00
SeptemberCP2013295.00.200.900.002.00
PT2171100.00.001.000.001.00
CW21164100.01.210.304.004.00
“CP” culture pond unit, “PT” pre-treatment unit, “CW” constructed wetland unit.
Table 3. Relative abundance of the phylogenetic types based on the anammox 16S rRNA genes recovered from the RPAS.
Total NumbersRelative Abundance (%)
MarchJuneSeptember
OTUsClonesCPPTCWCPPTCWCPPTCW
Brocadia6157100100100010077.7810010061.9
Cluster A11900010000000
Cluster B12000000009.52
Cluster C160000000028.57
Cluster D140000022.22000
“CP” culture pond unit, “PT” pre-treatment unit, “CW” constructed wetland unit.
Table 4. Quantification of anammox and total bacterial 16S rRNA gene copies in the RPAS.
March
ABCDEFG
Abundance (copies/ng DNA)Anammox Bacteria (×101)10.02 ± 0.66ac 9.45 ± 4.13ac 4.04 ± 1.82a 18.83 ± 4.18b3.89 ± 0.43a 11.31 ± 2.96c 4.18 ± 2.22a
Total Bacteria (×106)4.81 ± 0.10a 4.81 ± 0.47a 6.11 ± 0.44b5.89 ± 0.75bc 4.86 ± 0.53b 3.61 ± 0.45c 3.69 ± 0.39c
Abundance (copies/g DW)Anammox Bacteria (×105)17.76 ± 1.16a 15.29 ± 6.68a 7.57 ± 3.42b 22.11 ± 4.91a 4.93 ± 0.54b
Total Bacteria (×1010)8.52 ± 0.18a 7.78 ± 0.76ad 11.45 ± 0.82c6.91 ± 0.88bd 6.15 ± 0.67b
June
ABCDEFG
Abundance (copies/ng DNA)Anammox Bacteria (×101)8.31 ± 0.92ab 7.96 ± 1.21ab3.33 ± 0.05a 11.16 ± 2.92ab3.66 ± 2.33a 16.83 ± 4.09b 41.84 ± 9.46c
Total Bacteria (×106)7.81 ± 0.12a 5.41 ± 0.34b 3.33 ± 0.09c 4.35 ± 0.15d3.58 ± 0.22c 4.61 ± 0.39d 5.19 ± 0.57b
Abundance (copies/g DW)Anammox Bacteria (×105)23.88 ± 2.63a13.15 ± 2.00b 5.53 ± 0.08b 34.94 ± 9.15c 9.20 ± 5.85b
Total Bacteria (×1010)22.44 ± 0.33a 8.94 ± 0.56b 5.53 ± 0.15c 13.61 ± 0.46d 9.00 ± 0.56b
September
ABCDEFG
Abundance (copies/ng DNA)Anammox Bacteria (×101)4.32 ± 0.61a 19.54 ± 4.55b 14.08 ± 4.00bc 19.53 ± 0.20b 10.08 ± 2.83ac 15.82 ± 3.77ab 13.11 ± 4.65ab
Total Bacteria (×106)1.13 ± 0.00a3.12 ± 0.20b2.41 ± 0.29c2.07 ± 0.28c 2.06 ± 0.11c 3.10 ± 0.26b 2.82 ± 0.17b
Abundance (copies/g DW)Anammox Bacteria (×105)49.86 ± 7.06a83.24 ± 19.38a 85.86 ± 24.42a 121.80 ± 1.22b 48.32 ± 13.58a
Total Bacteria (×1010)13.07 ± 0.06a 13.28 ± 0.86a 14.70 ± 1.75a 12.93 ± 1.73a9.89 ± 0.51b
Sites A, B and C are in the culture pond unit (CP); sites D and E are in the pre-treatment unit (PT); and sites F and G are in the constructed wetland unit (CW). Significant differences (p < 0.05) between the sites at an identical time are indicated by different lowercase letters. Values are the mean ± SD calculated from the triplicate determination; “–” not applicable.
Table 5. Statistical analysis of anammox community structures with the physicochemical parameters in the recirculating pond aquaculture system (RPAS).
Physicochemical ParametersOTUsShannonSimpsonSACEChaolAbundance
W-Temperature0.124−0.1360.274−0.1780.3250.314
W-DO0.132−0.0480.043−0.5850.292−0.223
W-pH0.3840.226−0.1520.1680.2800.446
W-TOC−0.075−0.3500.394−0.6190.278−0.455
W-TN0.129−0.0240.046−0.2660.326−0.175
W-NH4+-N−0.642−0.876 *0.900 *−0.872 *−0.267−0.597
W-NO2-N−0.267−0.3770.387−0.357−0.264−0.152
W-NO3-N−0.308−0.2780.256−0.118−0.4250.140
S-TOC0.1130.267−0.3070.0000.055−0.680
S-NH4+-N−0.155−0.5130.6280.0000.0900.396
S-NO2-N0.3000.233−0.1700.0000.416−0.855 *
S-NO3-N−0.491−0.007−0.2170.000−0.699−0.069
* Correlation is significant at the 0.05 level (two-tailed). Bold: Significant difference (p < 0.05).
Publisher’s Note: MDPI stays neutral with regard to jurisdictional claims in published maps and institutional affiliations.

