
Factors Affecting Material-Cart Handling in the Roofing Industry: Evidence for Administrative Controls


Abstract
:1. Introduction
2. Experiment 1
2.1. Materials and Methods
2.1.1. Experiment Design
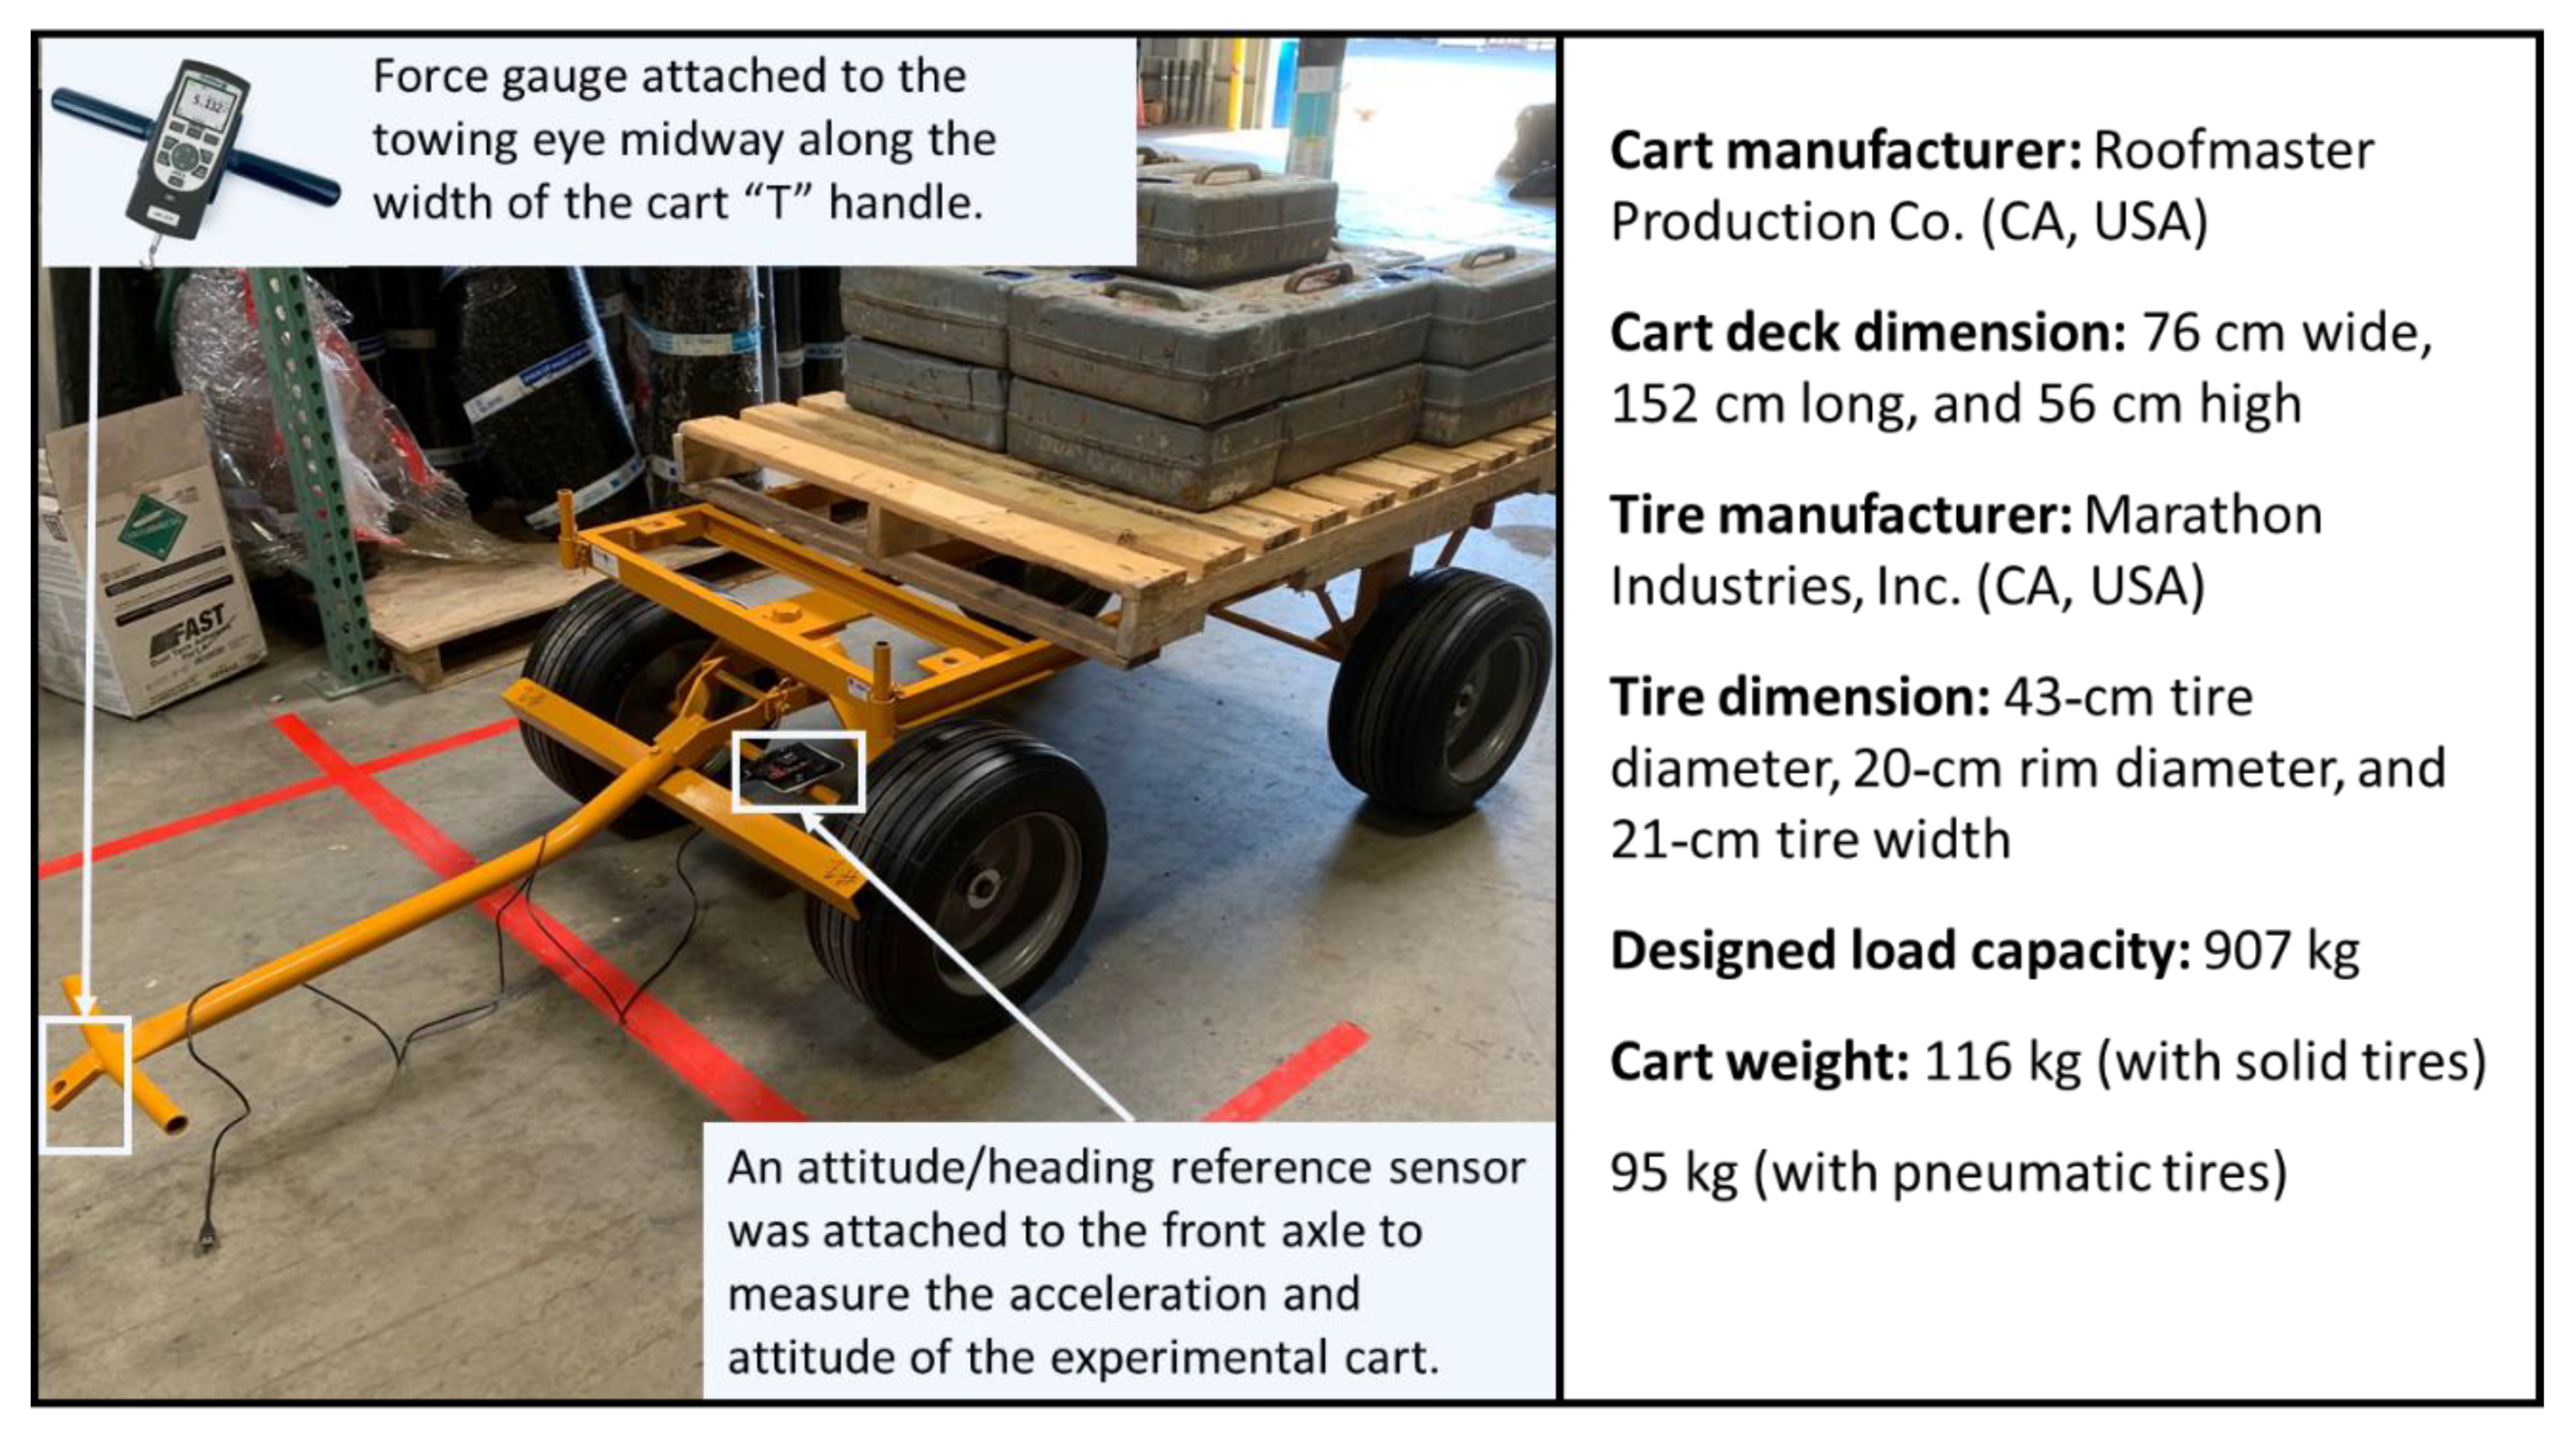
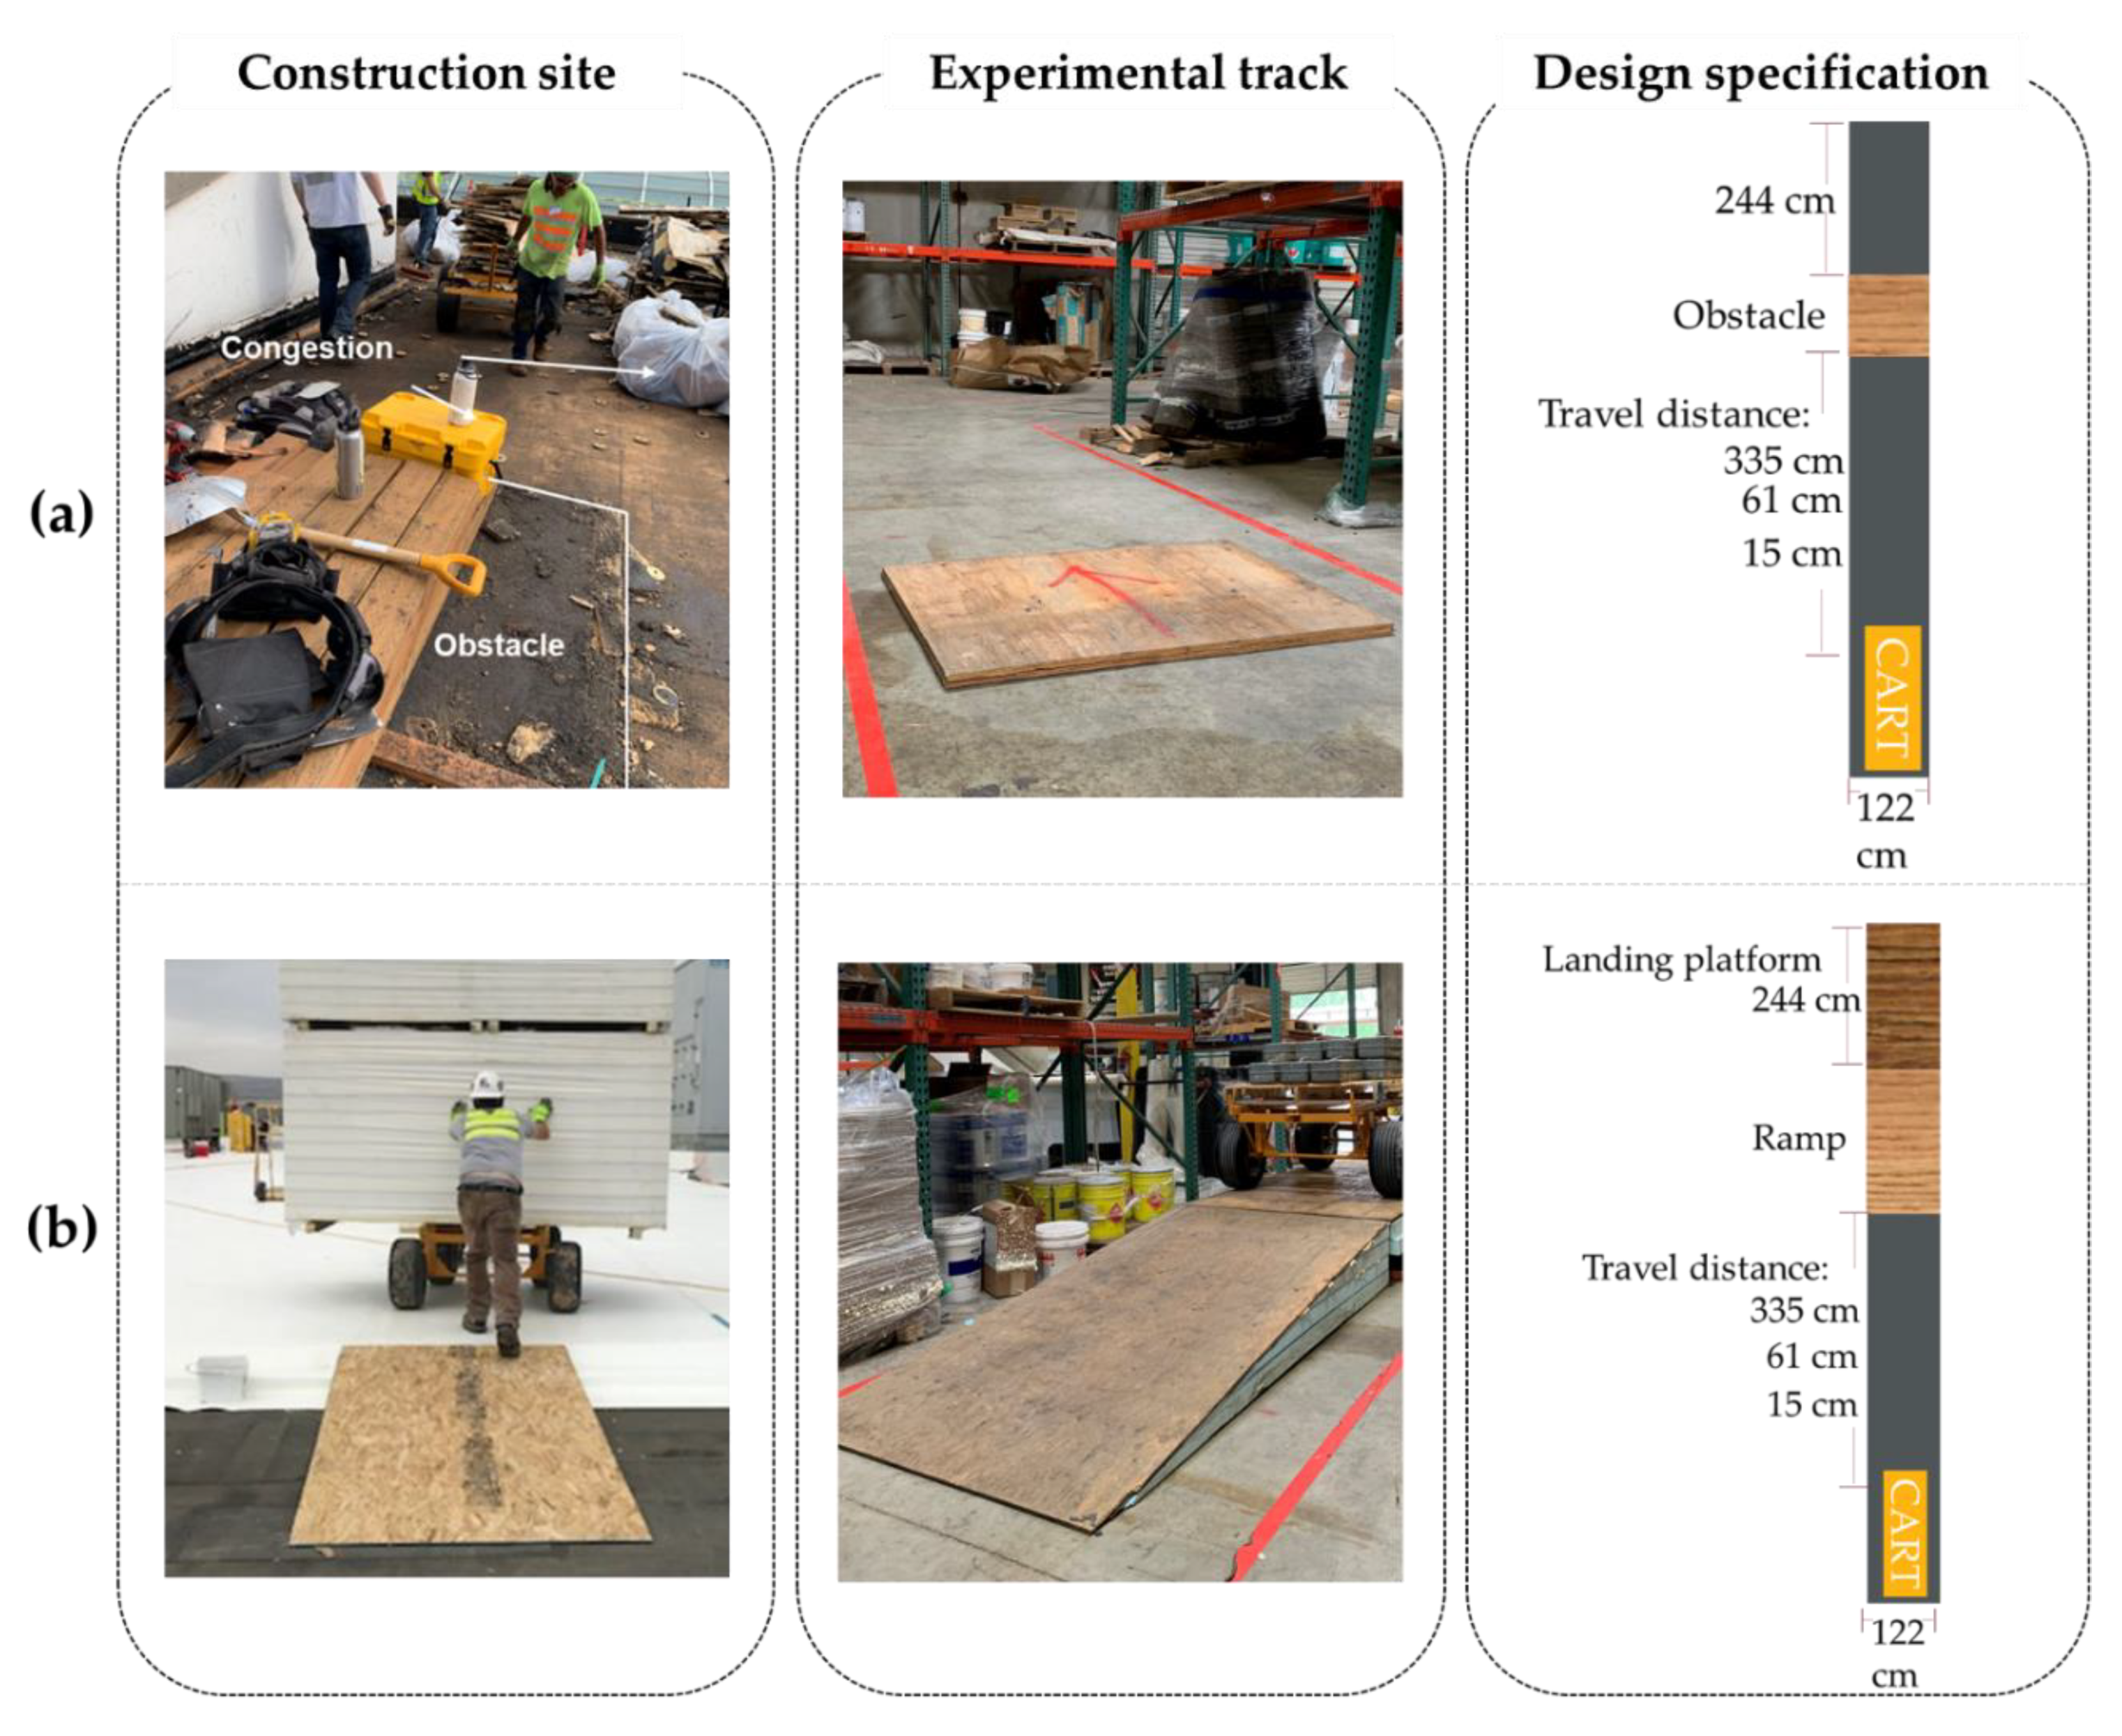
Apparatus
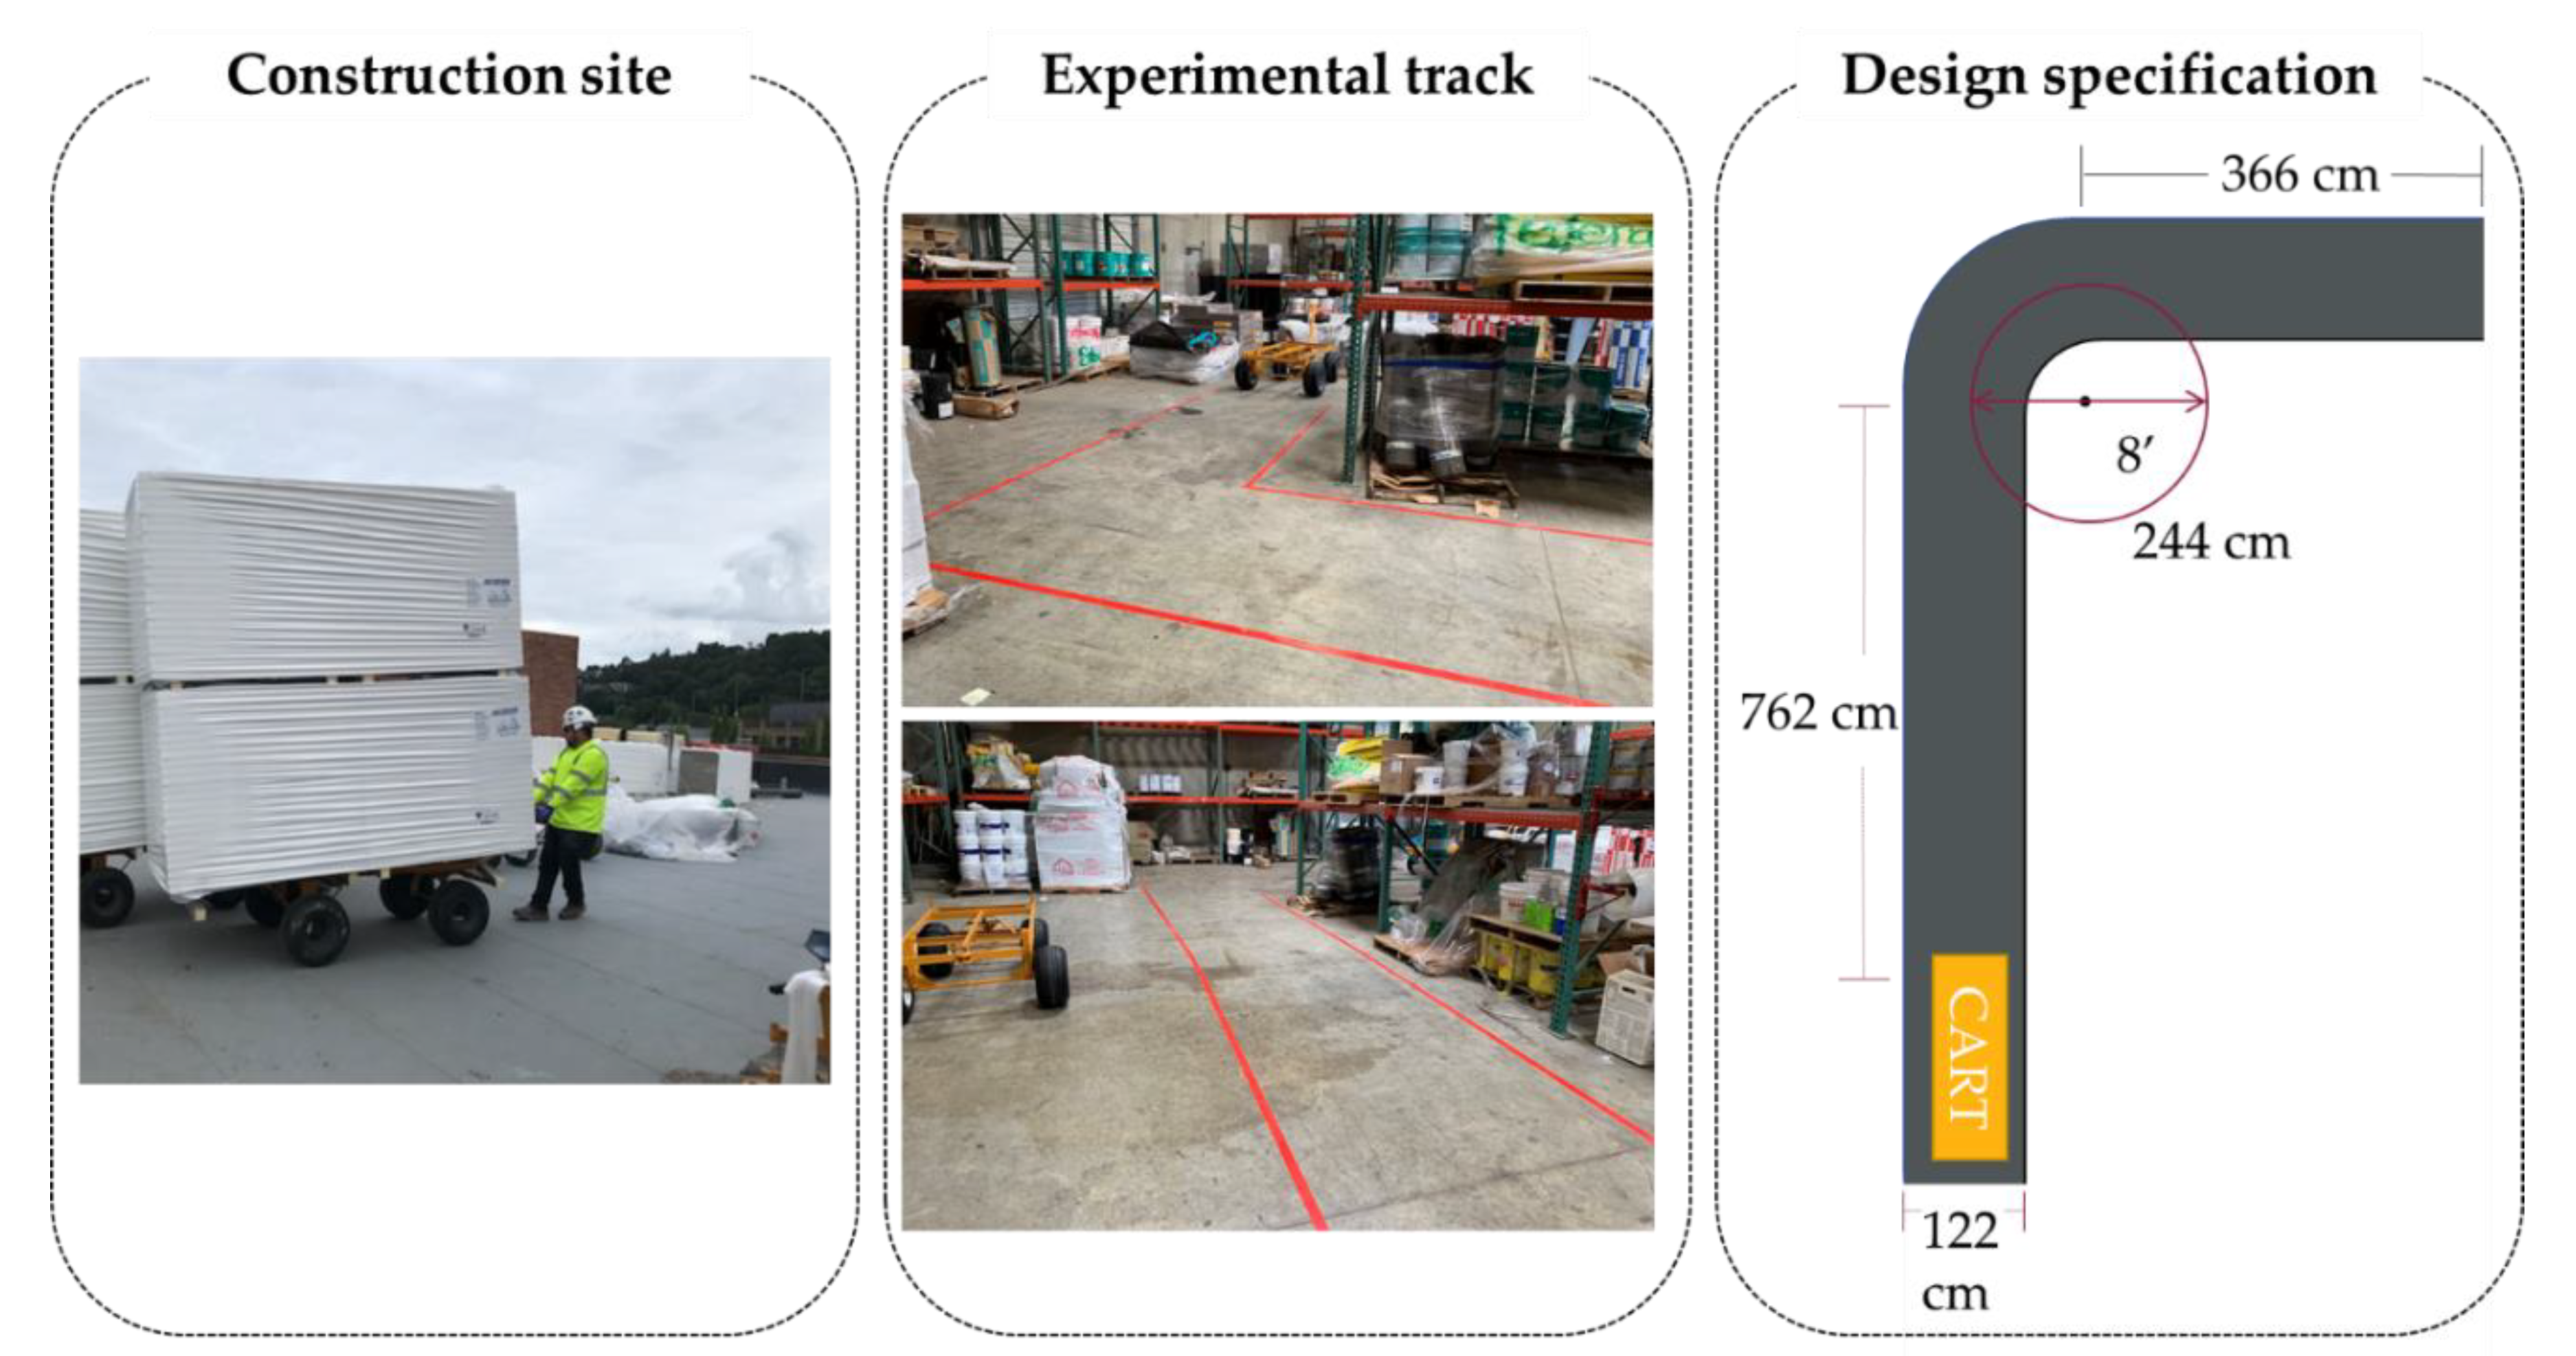
Laboratory Track
Subject
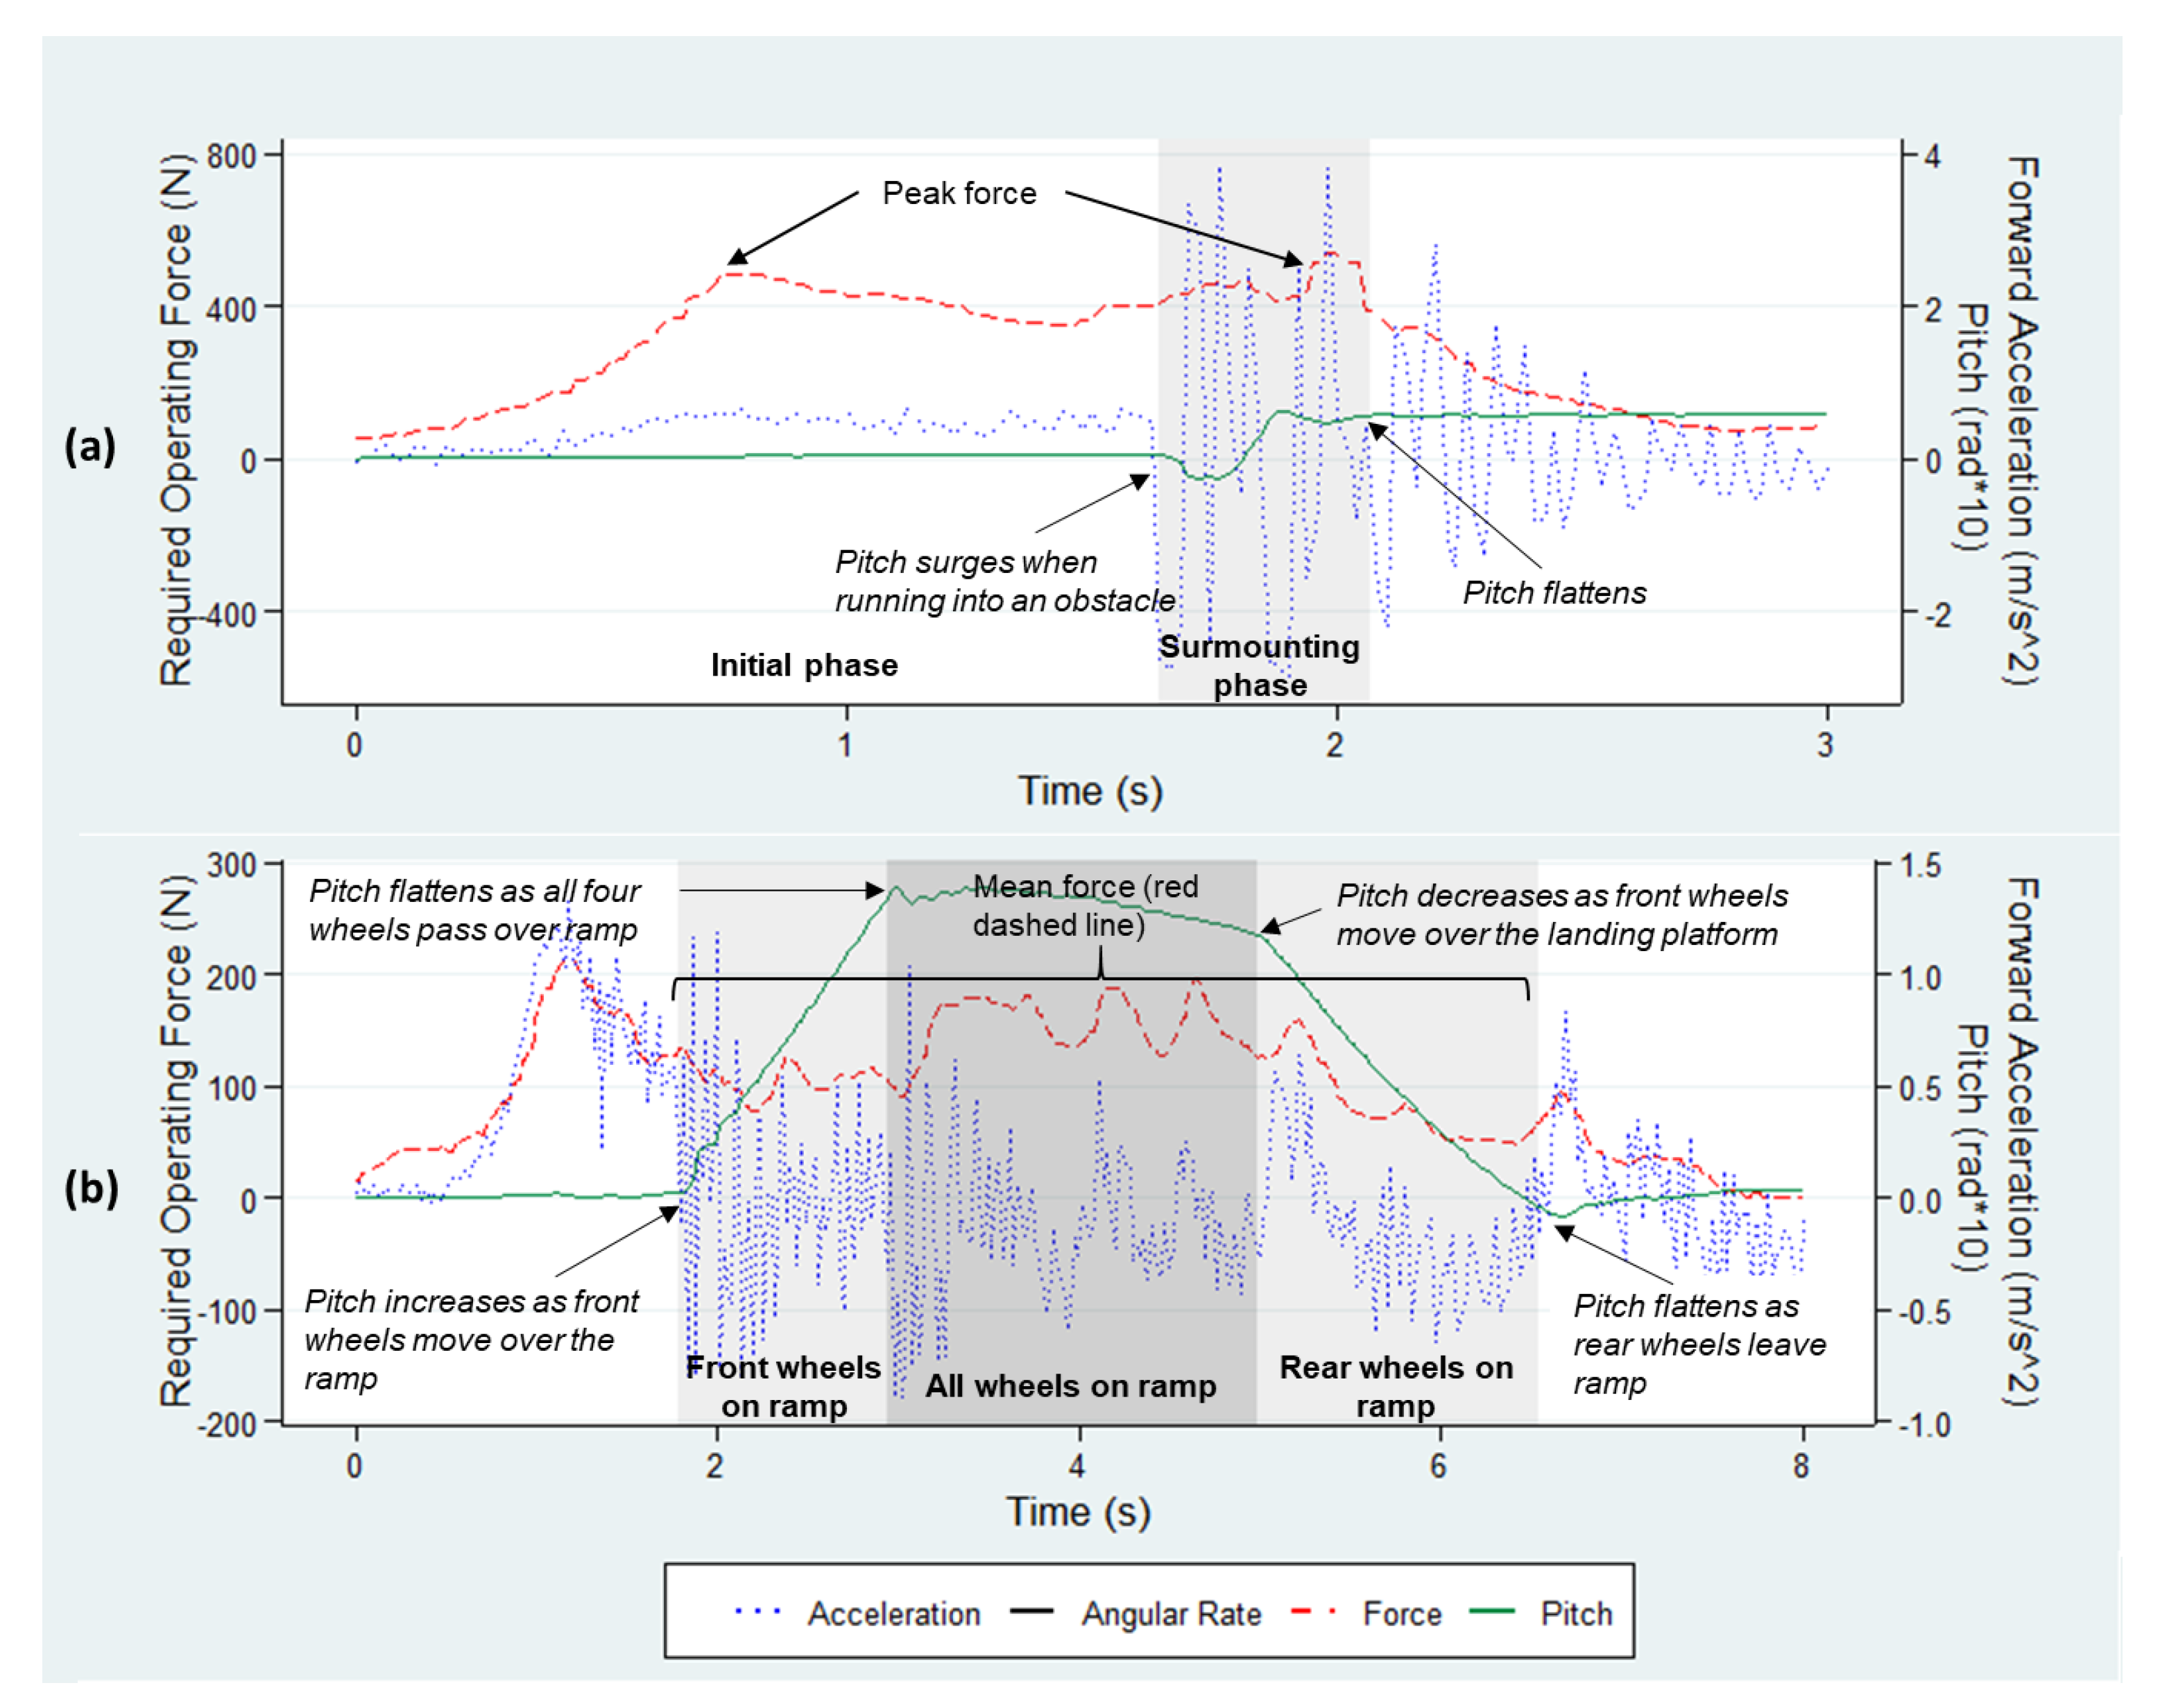
Experimental Procedure
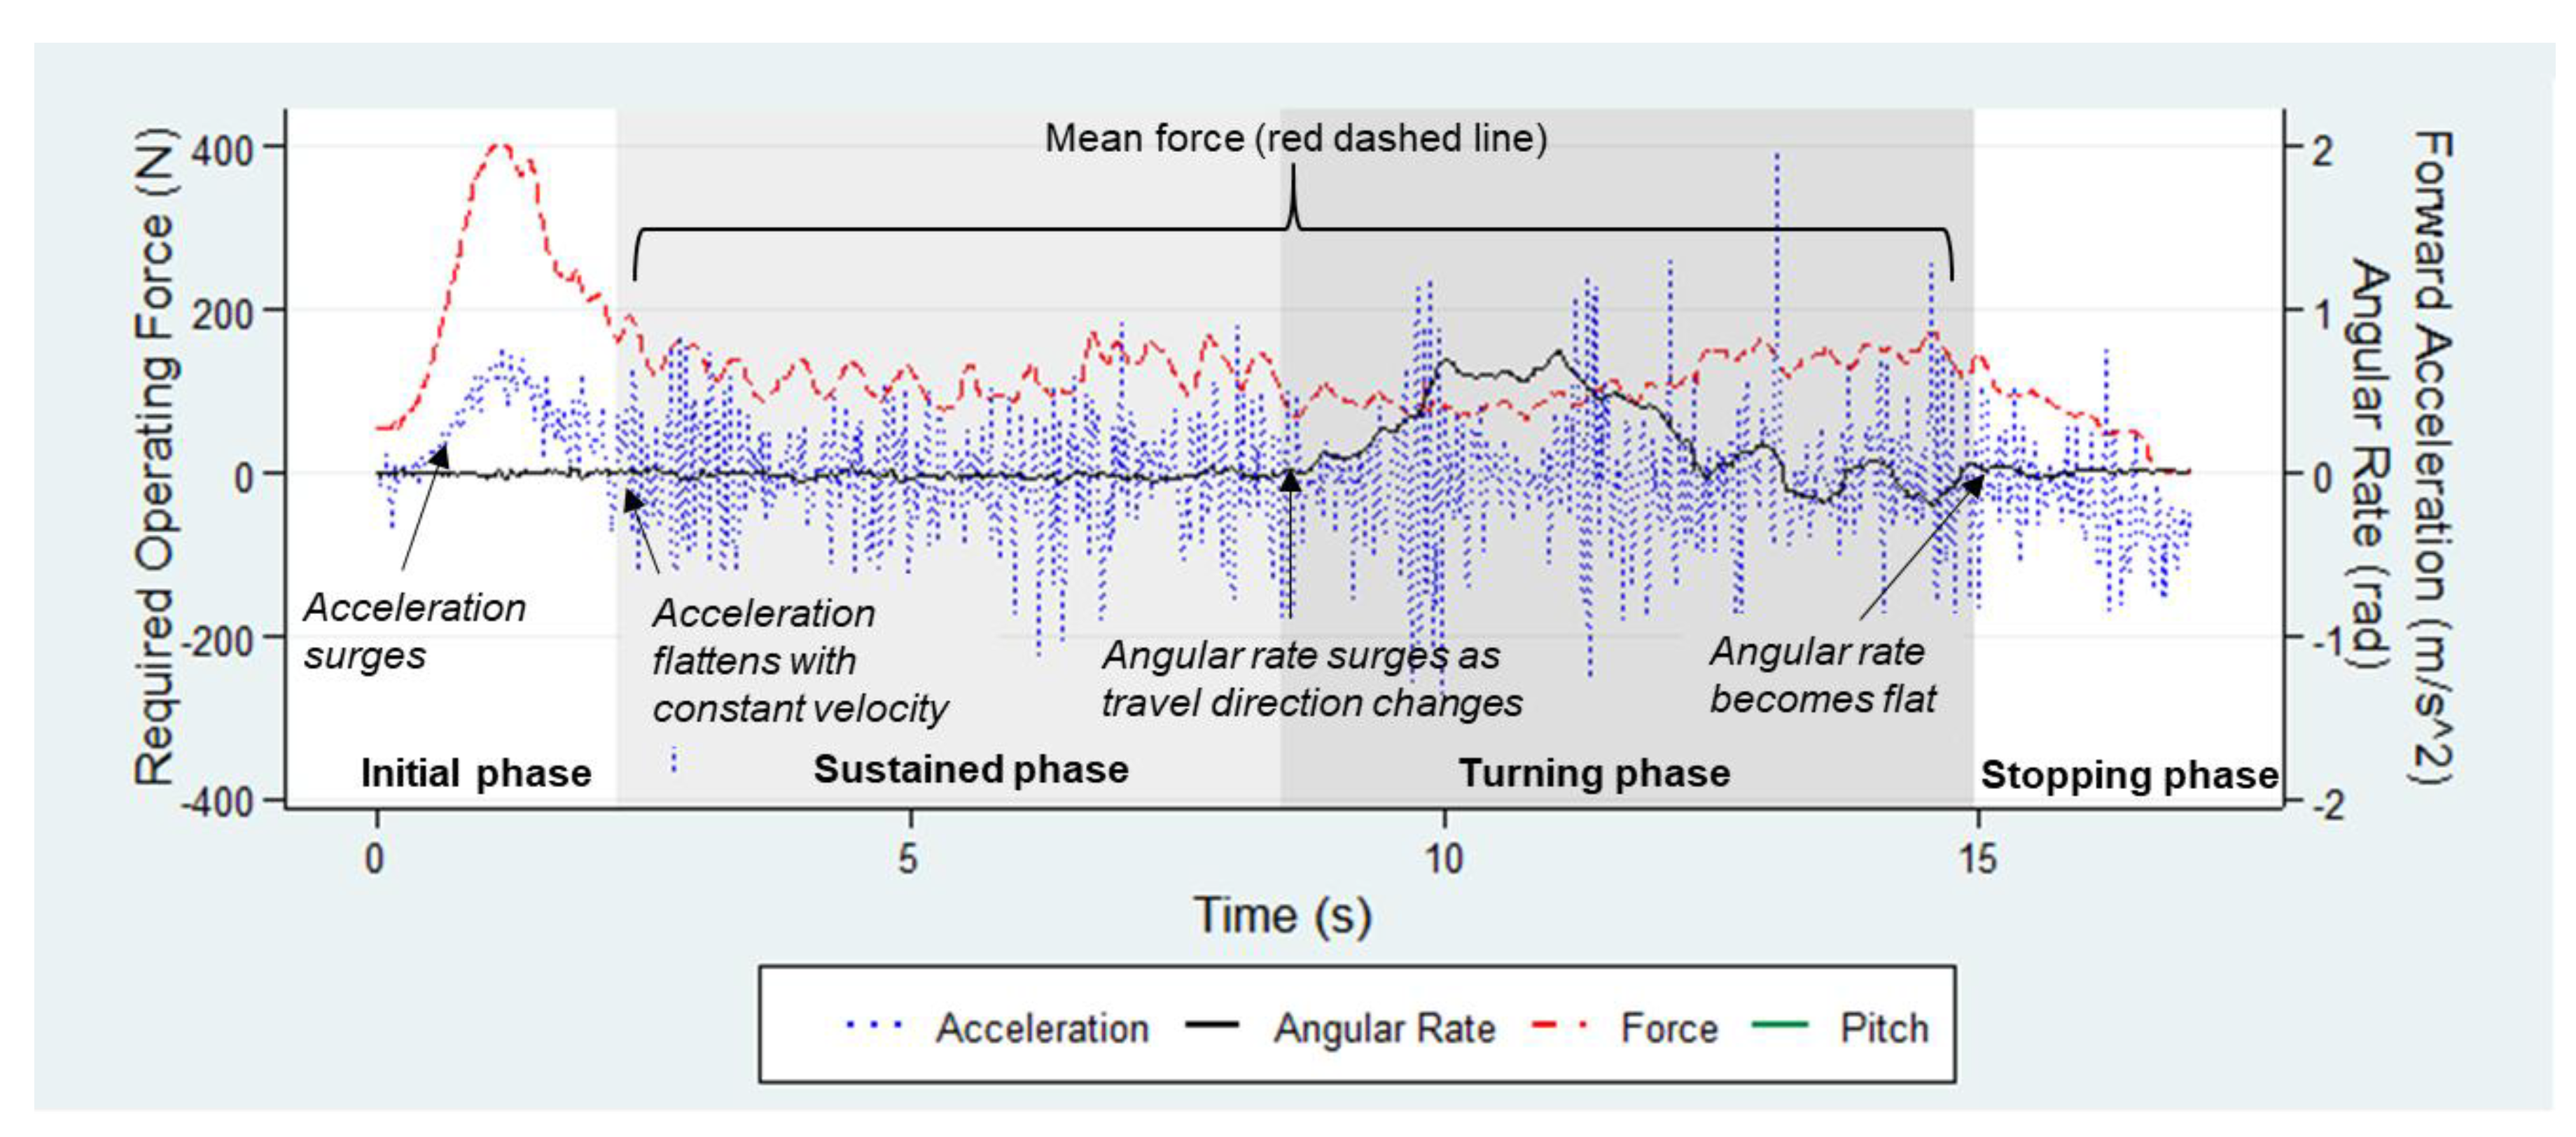
2.1.2. Data Analysis
Data Management
Statistical Analysis
2.2. Results
3. Experiment 2
3.1. Materials and Methods
3.1.1. Experiment Design
Apparatus
Laboratory Track
Subject
Experimental Procedure
3.1.2. Data Analysis
Data Management
Statistical Analysis
3.2. Results
4. Discussion
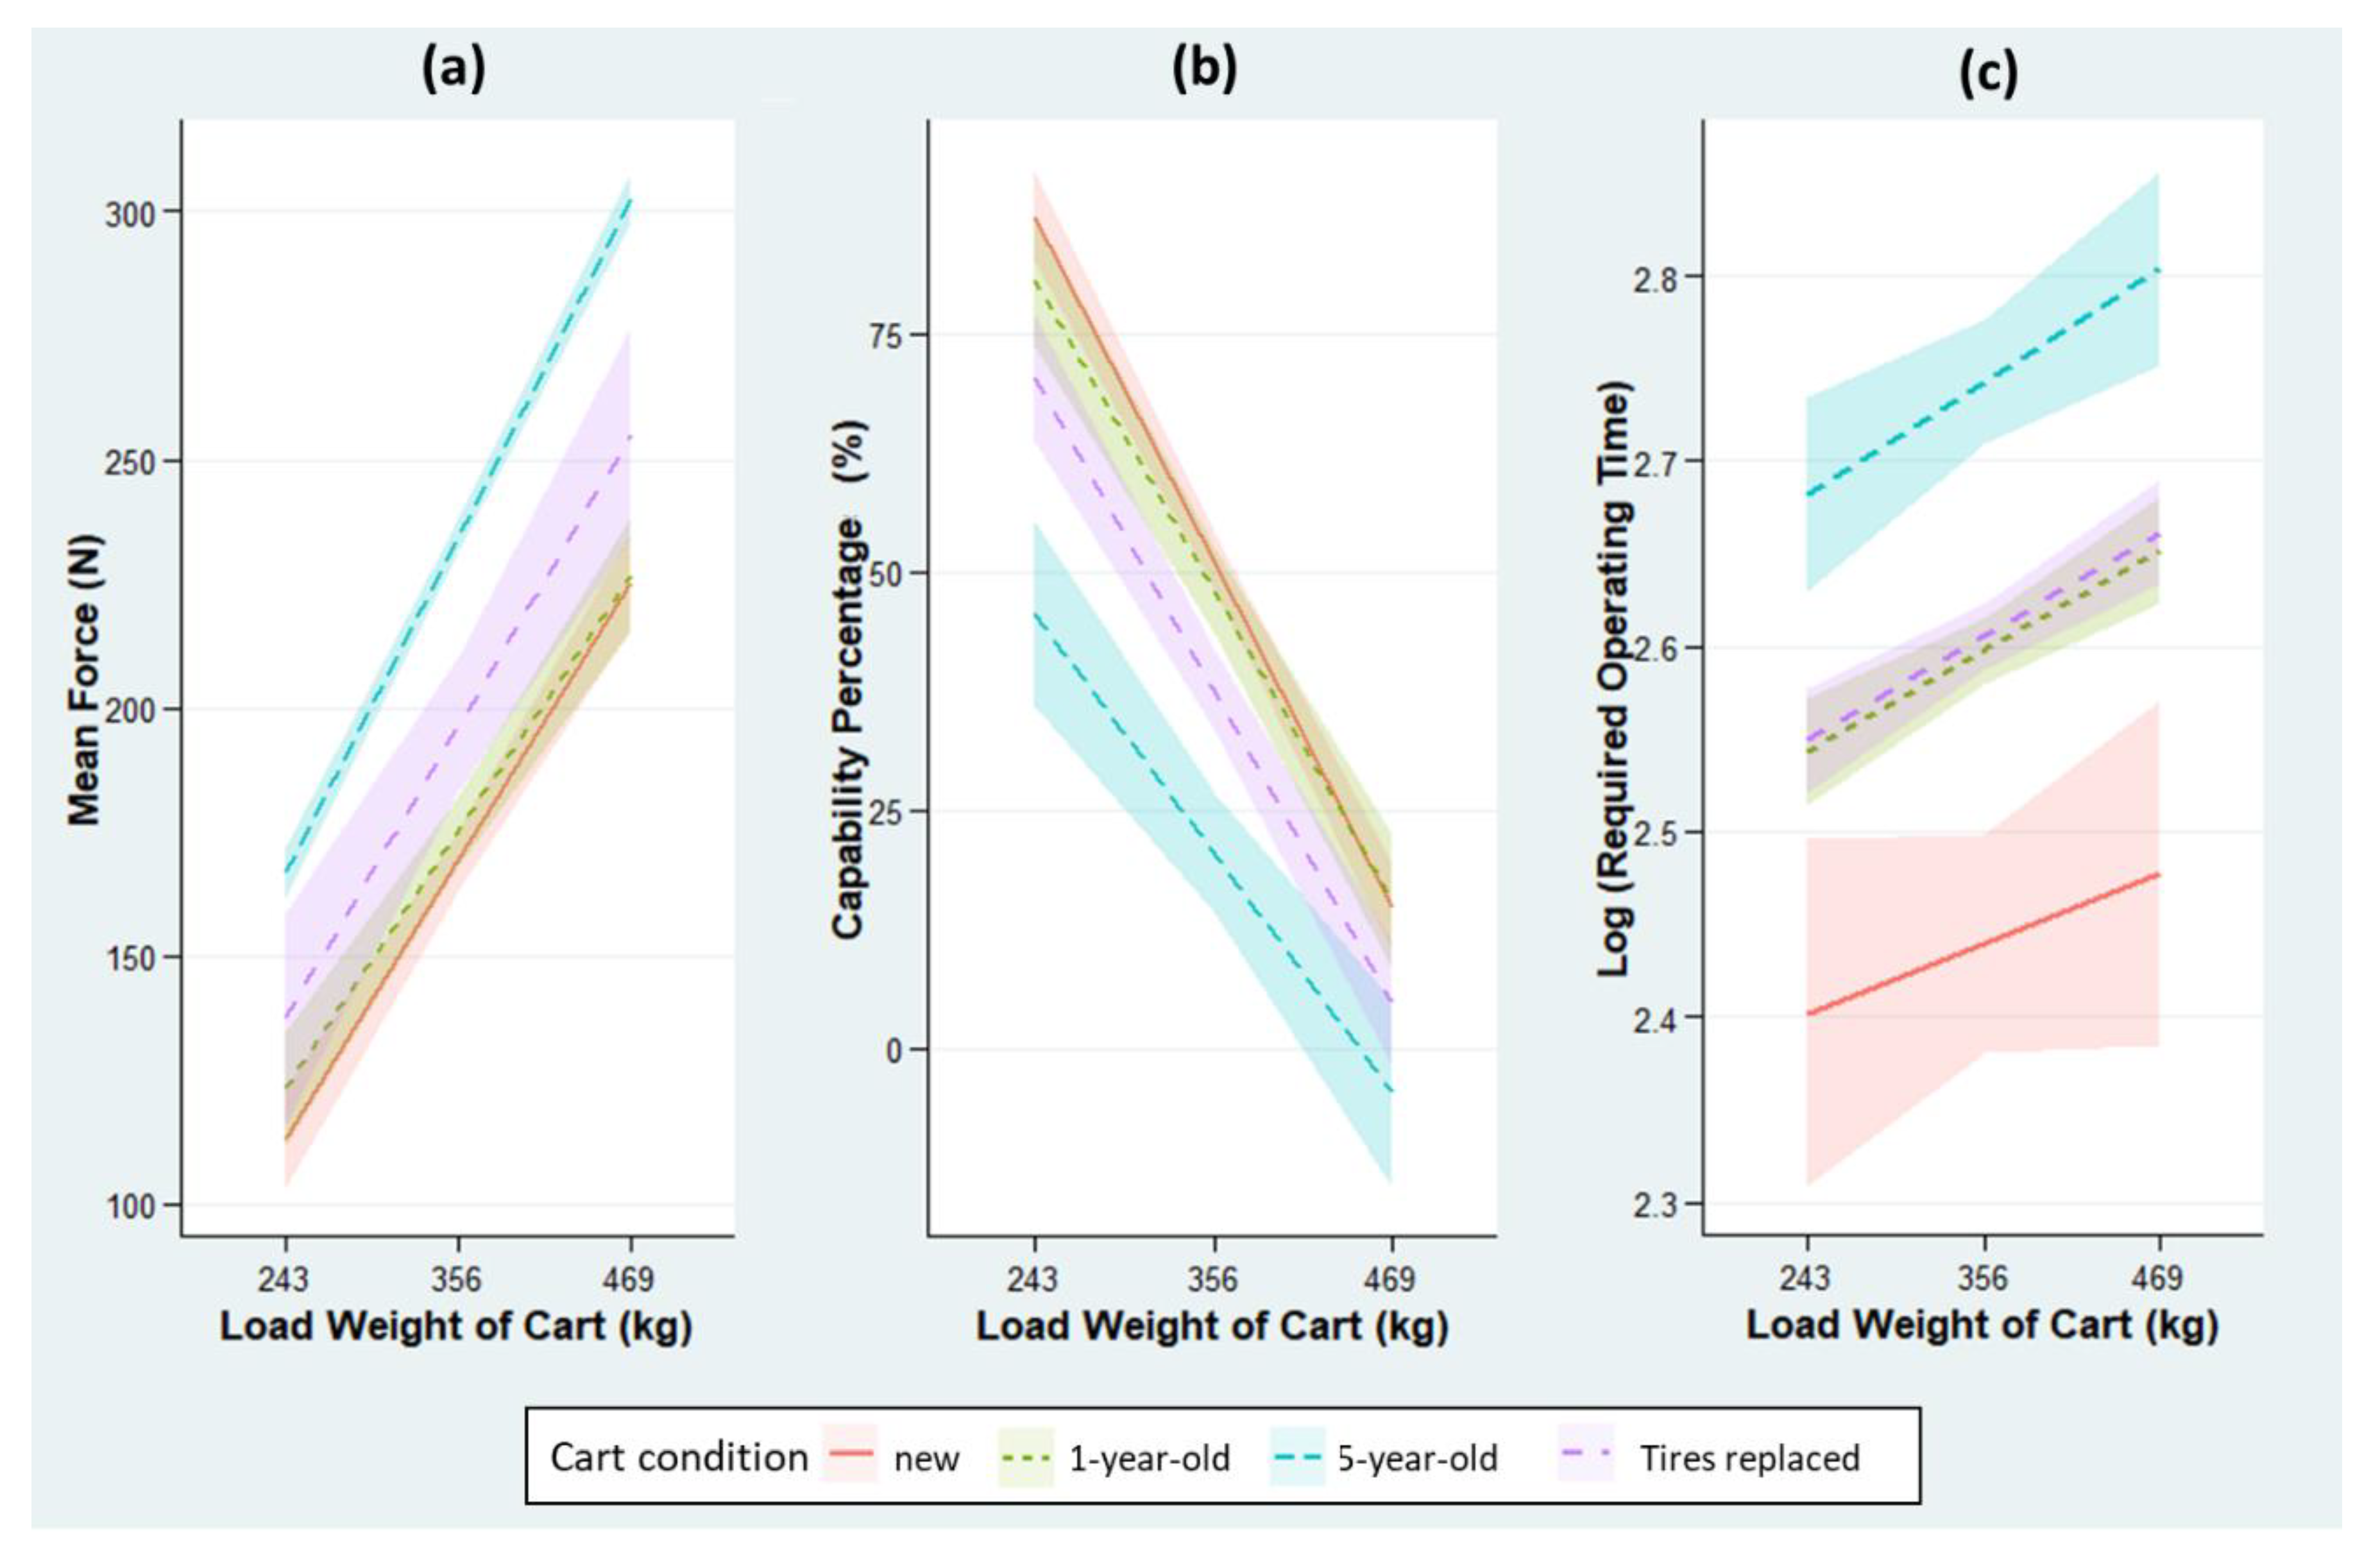
4.1. Effect of Cart Condition
4.2. Effect of Tire Type
4.3. Effect of Physical Environment-Related Factors
4.4. Effect of Cart Load
4.5. Limitations and Future Directions
5. Conclusions
Author Contributions
Funding
Institutional Review Board Statement
Informed Consent Statement
Data Availability Statement
Acknowledgments
Conflicts of Interest
References
- Bureau of Labor Statistics, U.S. Department of Labor. Occupational Outlook Handbook, Number of Nonfatal Occupational Injuries and Illnesses Involving Days Away from Work by Event or Exposure Leading to Injury or Illness and Summary Occupational Groups, Private Industry. 2017. Available online: https://www.bls.gov/iif/oshwc/osh/case/cd_r63_2017.htm (accessed on 4 February 2021).
- Dong, X.; Men, Y.; Fujimoto, A. The Construction Chart Book, 6th ed.; The Center for Construction Research and Training (CPWR): Silver Spring, MD, USA, 2018.
- Harris-Adamson, C.; Lin, J.-H. Effect of Handle Design on Pallet Jack Operations. In Ergonomics in Design: The Quarterly of Human Factors Applications; Sage: Thousand Oaks, CA, USA, 2013; Volume 21, pp. 15–21. [Google Scholar] [CrossRef]
- Harris-Adamson, C.; Mielke, A.; Xu, X.; Lin, J.-H. Ergonomic evaluation of standard and alternative pallet jack handless. Int. J. Ind. Ergon. 2016, 54, 113–119. [Google Scholar] [CrossRef]
- Lin, C.-L.; Chen, M.-S.; Wei, Y.-L.; Wang, M.-J.J. The evaluation of force exertions and muscle activities when operating a manual guided vehicle. Appl. Ergon. 2010, 41, 313–318. [Google Scholar] [CrossRef]
- Marras, W.S.; Knapik, G.G.; Ferguson, S. Loading along the lumbar spine as influence by speed, control, load magnitude, and handle height during pushing. Clin. Biomech. 2009, 24, 155–163. [Google Scholar] [CrossRef]
- Seo, N.J.; Armstrong, T.J.; Young, J.G. Effects of handle orientation, gloves, handle friction and elbow posture on maximum horizontal pull and push forces. Ergonomics 2010, 53, 92–101. [Google Scholar] [CrossRef]
- Ohnishi, A.; Takanokura, M.; Sugama, A. Evaluation of Interhandle Distance During Pushing and Pulling of a Four-Caster Cart for Upper Limb Exertion. Saf. Health Work 2016, 7, 237–243. [Google Scholar] [CrossRef] [Green Version]
- Jansen, J.P.; Hoozemans, M.J.M.; van der Beek, A.J.; Frings-Dresen, M.H.W. Evaluation of ergonomic adjustments of catering carts to reduce external pushing forces. Appl. Ergon. 2002, 33, 117–127. [Google Scholar] [CrossRef]
- Al-Eisawi, K.W.; Kerk, C.J.; Congleton, J.J.; Amendola, A.A.; Jenkins, O.C.; Gaines, W. Factors affecting minimum push and pull forces of manual carts. Appl. Ergon. 1999, 30, 235–245. [Google Scholar] [CrossRef]
- Hodson, L.; Methner, M.; Zumwalde, R.D. Approaches to Safe. Nanotechnology; Managing the Health and Safety Concerns Associated with Engineered Nanomaterials; NIOSH: Washington, DC, USA, 2009.
- Silverstein, B.; Clark, R. Interventions to reduce work-related musculoskeletal disorders. J. Electromyogr. Kinesiol. 2004, 14, 135–152. [Google Scholar] [CrossRef]
- Lahiri, S.; Markkanen, P.; Levenstein, C. The cost effectiveness of occupational health interventions: Preventing occupational back pain. Am. J. Ind. Med. 2005, 48, 515–529. [Google Scholar] [CrossRef]
- Lincoln, A.E.; Vernick, J.S.; Ogaitis, S.; Smith, G.S.; Mitchell, C.S.; Agnew, J. Interventions for the primary prevention of work-related carpal tunnel syndrome. Am. J. Prev. Med. 2000, 18, 37–50. [Google Scholar] [CrossRef]
- Goldgruber, J.; Ahrens, D. Effectiveness of workplace health promotion and primary prevention interventions: A review. J. Public Health 2010, 18, 75–88. [Google Scholar] [CrossRef] [Green Version]
- Garg, A.; Waters, T.R.; Kapellusch, J.; Karwowski, W. Psychophysical basis for maximum pushing and pulling forces: A review and recommendations. Int. J. Ind. Ergon. 2014, 44, 281–291. [Google Scholar] [CrossRef] [PubMed] [Green Version]
- Hoozemans, M.J.M.; van der Beek, A.J.; Fringsdresen, M.H.W.; van Dijk, F.J.H.; van der Woude, L.H.V. Pushing and pulling in relation to musculoskeletal disorders: A review of risk factors. Ergonomics 1998, 41, 757–781. [Google Scholar] [CrossRef] [PubMed]
- Argubi-Wollesen, A.; Wollesen, B.; Leitner, M.; Mattes, K. Human Body Mechanics of Pushing and Pulling: Analyzing the Factors of Task-related Strain on the Musculoskeletal System. Saf. Health Work 2017, 8, 11–18. [Google Scholar] [CrossRef] [Green Version]
- Lawson, J.; Potiki, J.; Watson, H. Development of Ergonomic Guidelines for Manually Handled Trolleys in the Health Industry. J. Occup. Health Saf. 1993, 9, 459. [Google Scholar]
- Jäger, M.; Luttmann, A.; Laurig, W. The load on the spine during the transport of dustbins. Appl. Ergon. 1984, 15, 91–98. [Google Scholar] [CrossRef]
- Bennett, A.I.; Desai, S.D.; Todd, A.I.; Freeland, H. The Effects of Load and Gradient on Hand Force Responses during Dynamic Pushing and Pulling Tasks. J. Ergon. Soc. S. Afr. 2008, 20, 3–15. [Google Scholar]
- Nimbarte, A.D.; Sun, Y.; Jaridi, M.; Hsiao, H. Biomechanical loading of the shoulder complex and lumbosacral joints during dynamic cart pushing task. Appl. Ergon. 2013, 44, 841–849. [Google Scholar] [CrossRef]
- Boyer, J.; Lin, J.-H.; Chang, C.-C. Description and analysis of hand forces in medicine cart pushing tasks. Appl. Ergon. 2013, 44, 48–57. [Google Scholar] [CrossRef]
- Tak, S.; Paquet, V.; Woskie, S.; Buchholz, B.; Punnett, L. Variability in Risk Factors for Knee Injury in Construction. J. Occup. Environ. Hyg. 2008, 6, 113–120. [Google Scholar] [CrossRef]
- Paquet, V.; Punnett, L.; Woskie, S.; Buchholz, B. Reliable exposure assessment strategies for physical ergonomics stressors in construction and other non-routinized work. Ergonomics 2005, 48, 1200–1219. [Google Scholar] [CrossRef]
- Dasgupta, P.; Sample, M.; Buchholz, B.; Brunette, M. Is worker involvement an ergonomic solution for construction intervention challenges: A systematic review. Theor. Issues Ergon. Sci. 2017, 18, 433–441. [Google Scholar] [CrossRef]
- Knapik, G.G.; Marras, W.S. Spine loading at different lumbar levels during pushing and pulling. Ergonomics 2009, 52, 60–70. [Google Scholar] [CrossRef]
- British Health and Safety Executive Risk Assessment of Pushing and Pulling (RAPP) Tool. Available online: http://www.hse.gov.uk/pubns/indg478.htm (accessed on 2 September 2018).
- Chengalur, S.N. Kodak’s Ergonomic Design for People at Work; John Wiley & Sons: Hoboken, NJ, USA, 2004. [Google Scholar]
- Andersen, J.H.; Haahr, J.P.; Frost, P. Risk factors for more severe regional musculoskeletal symptoms: A two-year prospective study of a general working population. Arthritis Rheum. 2007, 56, 1355–1364. [Google Scholar] [CrossRef]
- Van der Beek, A.J.; Dennerlein, J.T.; Huysmans, M.A.; Mathiassen, S.E.; Burdorf, A.; van Mechelen, W.; van Dieën, J.H.; Frings-Dresen, M.H.; Holtermann, A.; Janwantanakul, P.; et al. A research framework for the development and implementation of interventions preventing work-related musculoskeletal disorders. Scand. J. Work. Environ. Health 2017, 43, 526–539. [Google Scholar] [CrossRef]
- Glitsch, U.; Ottersbach, H.J.; Ellegast, R.; Schaub, K.; Franz, G.; Jäger, M. Physical workload of flight attendants when pushing and pulling trolleys aboard aircraft. Int. J. Ind. Ergon. 2007, 37, 845–854. [Google Scholar] [CrossRef]
- Lett, K.K.; McGill, S.M. Pushing and pulling: Personal mechanics influence spine loads. Ergonomics 2006, 49, 895–908. [Google Scholar] [CrossRef] [PubMed]
- Lee, J.; Nussbaum, M.A.; Kyung, G. Effects of work experience on work methods during dynamic pushing and pulling. Int. J. Ind. Ergon. 2014, 44, 647–653. [Google Scholar] [CrossRef]
- Hoozemans, M.J.M.; Kuijer, P.P.F.M.; Kingma, I.; van Dieën, J.H.; De Vries, W.H.K.; van der Woude, L.H.V.; Veeger, D.H.E.J.; van der Beek, A.J.; Frings-Dresen, M.H.W. Mechanical loading of the low back and shoulders during pushing and pulling activities. Ergonomics 2004, 47, 1–18. [Google Scholar] [CrossRef]
- Trivedi, N.; Yellapragada, M.; Lin, K.-Y. Assessing Worker Health and Well-Being in Construction: Case of Seattle. In Proceedings of the 2020 ASCE Construction Research Congress, Tempe, AZ, USA, 8 March 2020. [Google Scholar]
- Greene, B.L.; DeJoy, D.M.; Olejnik, S. Effects of an active ergonomics training program on risk exposure, worker beliefs, and symptoms in computer users. Work 2005, 24, 41–52. [Google Scholar]
- Resnick, M.L.; Chaffin, D.B. An ergonomic evaluation of handle height and load in maximal and submaximal cart pushing. Appl. Ergon. 1995, 26, 173–178. [Google Scholar] [CrossRef]
- Muggeo, V.M.R.; Muggeo, M.V.M. Regression Models with Break-Points/Change-Points Estimation, Version 1.3-1, Package “Segmented”; GNU General Public License. 2020. Available online: https://cran.r-project.org/web/packages/segmented/segmented.pdf (accessed on 4 February 2021).
- Snook, S.H.; Ciriello, V.M. The design of manual handling tasks: Revised tables of maximum acceptable weights and forces. Ergonomics 1991, 34, 1197–1213. [Google Scholar] [CrossRef] [PubMed]
- Zebregs, S.; van den Putte, B.; Neijens, P.; De Graaf, A. The Differential Impact of Statistical and Narrative Evidence on Beliefs, Attitude, and Intention: A Meta-Analysis. Health Commun. 2015, 30, 282–289. [Google Scholar] [CrossRef]
- Allen, M.; Preiss, R.W. Comparing the persuasiveness of narrative and statistical evidence using meta-analysis. Commun. Res. Rep. 1997, 14, 125–131. [Google Scholar] [CrossRef]
- Jung, M.-C.; Haight, J.M.; Freivalds, A. Pushing and pulling carts and two-wheeled hand trucks. Int. J. Ind. Ergon. 2005, 35, 79–89. [Google Scholar] [CrossRef]
- Ciriello, V.M. Psychophysically Determined Horizontal and Vertical Forces of Dynamic Pushing on High and Low Coefficient of Friction Floors for Female Industrial Workers. J. Occup. Environ. Hyg. 2005, 2, 136–142. [Google Scholar] [CrossRef]
- Ciriello, V.M.; Maikala, R.V.; Dempsey, P.G.; O’Brien, N.V. Psychophysically determined forces of dynamic pushing for female industrial workers: Comparison of two apparatuses. Appl. Ergon. 2010, 41, 141–145. [Google Scholar] [CrossRef]
- Ciriello, V.M.; Dempsey, P.G.; Maikala, R.V.; O’Brien, N.V. Revisited: Comparison of two techniques to establish maximum acceptable forces of dynamic pushing for male industrial workers. Int. J. Ind. Ergon. 2007, 37, 877–882. [Google Scholar] [CrossRef]
- Nussbaum, M.A.; Chaffin, D.B. Effects of pacing when using material handling manipulators. Hum. Factors J. Hum. Factors Ergon. Soc. 1999, 41, 214–225. [Google Scholar] [CrossRef] [PubMed]


| Cart Condition | Tire Type | Number of Carts Tested |
|---|---|---|
| Brand-new | Pneumatic | 2 |
| Brand-new | Solid | 2 |
| One-year-old (no noticeable structural damage) | Pneumatic | 5 |
| One-year-old (no noticeable structural damage) | Solid | 5 |
| Five-year-old (contaminated tires, broken/deformed bearings, warped axles, and loose turntables) | Solid (three years old) | 2 |
| Five-year-old (curved axles and loose turntables) | Solid (brand-new) | 2 |
| Effect | Required Operating Force, ROF (N) | Capability Percentage, CP (%) | Percentage Change in Required Operating Time, ROT (%) | ||||||
|---|---|---|---|---|---|---|---|---|---|
| β | s.e. | p-Value | β | s.e. | p-Value | β | s.e. | p-Value | |
| Intercept | 114 | 3.51 | <0.001 | 83.6 | 1.95 | <0.001 | 989 | 2.02 | <0.001 |
| Cart condition | |||||||||
| One-year-old vs. brand-new | 5.76 | 4.61 | 0.215 | −3.02 | 2.70 | 0.266 | 17.1 | 2.04 | <0.001 |
| Five-year-old vs. brand-new | 65.5 | 4.61 | <0.001 | −30.6 | 3.52 | <0.001 | 35.4 | 3.08 | <0.001 |
| Five-year-old after tire replacement vs. brand-new | 27.1 | 5.98 | <0.001 | −13.4 | 2.21 | <0.001 | 18.0 | 3.08 | <0.001 |
| Cart load (kg) | 0.487 | 0.025 | <0.001 | −0.289 | 0.013 | <0.001 | 0.046 | 0.008 | <0.001 |
| Effect | Required Operating Force, ROF (N) | Capability Percentage, CP (%) | Percentage Change in Required Operating Time, ROT (%) | ||||||
|---|---|---|---|---|---|---|---|---|---|
| β | s.e. | p-Value | β | s.e. | p-Value | β | s.e. | p-Value | |
| Intercept | 92.6 | 3.0 | <0.001 | 98.1 | 1.88 | <0.001 | 1029 | 2.01 | <0.001 |
| Cart condition (One-year-old vs. brand-new) | 11.7 | 2.79 | <0.001 | −7.30 | 1.82 | <0.001 | 15.6 | 1.82 | <0.001 |
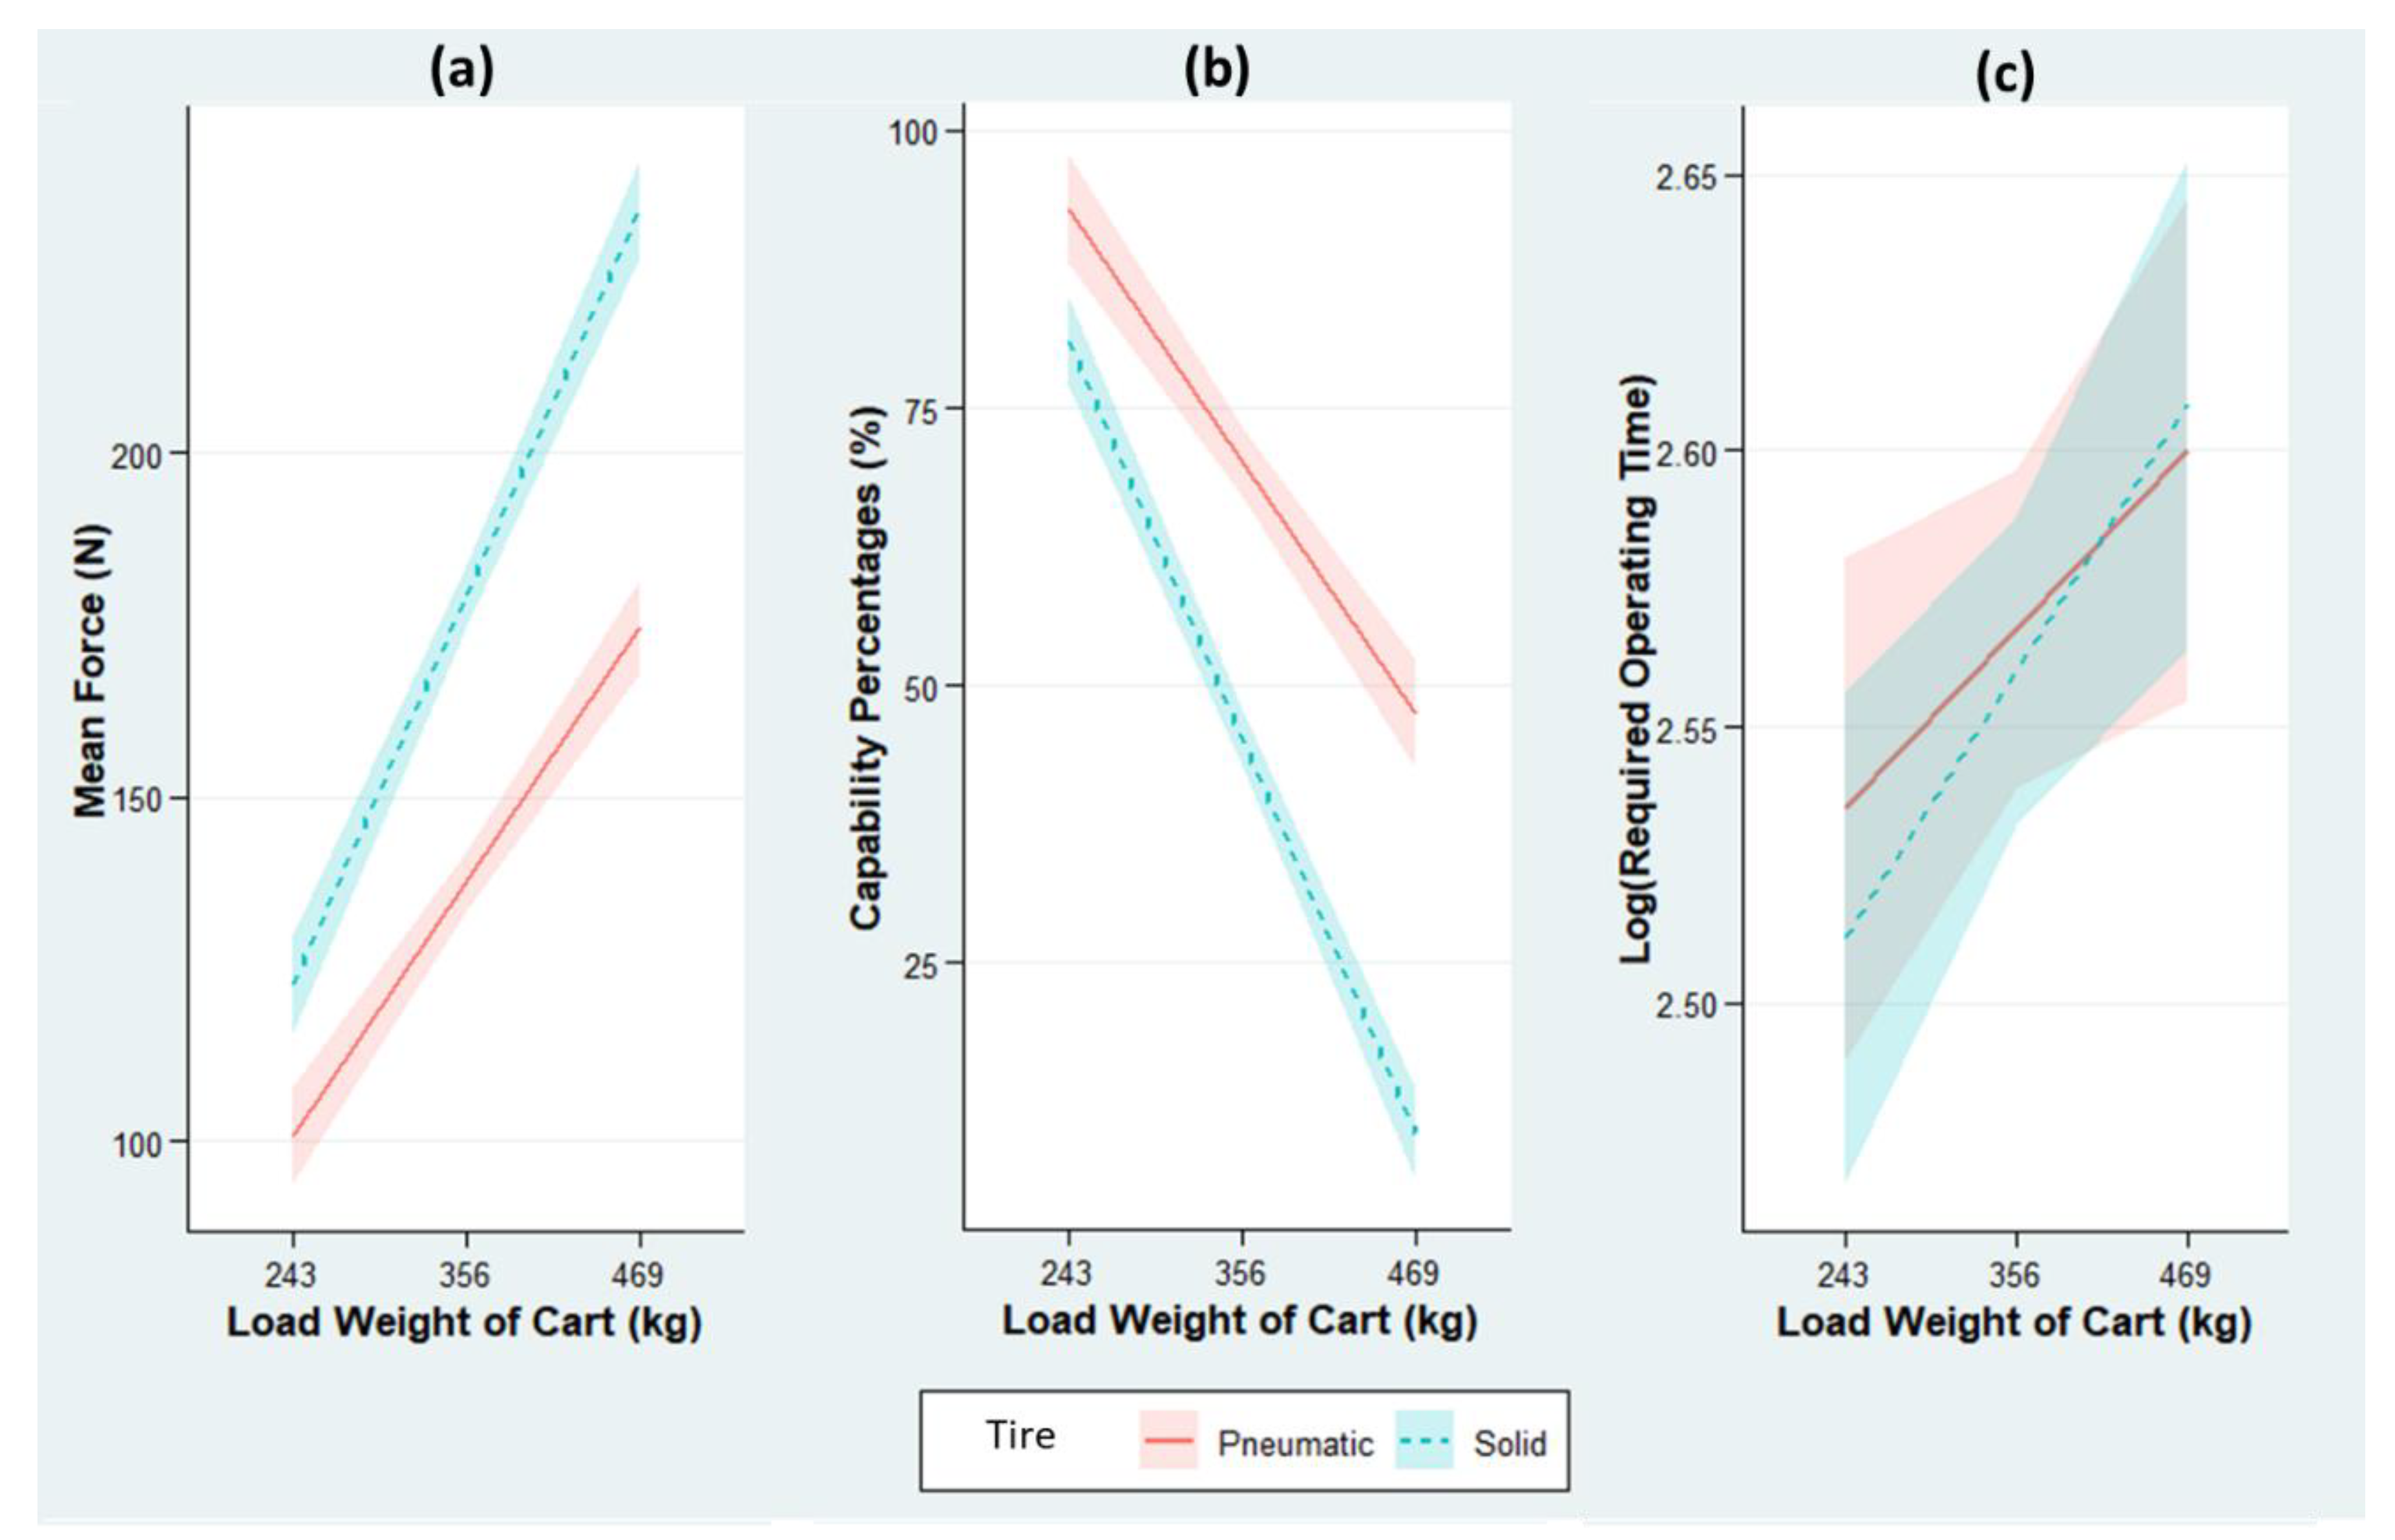
| Tire type (solid vs. pneumatic) | 22.0 | 3.55 | <0.001 | −11.9 | 2.12 | <0.001 | −0.75 | 1.64 | 0.645 |
| Cart load (kg) | 0.326 | 0.023 | <0.001 | −0.201 | 0.017 | <0.001 | 0.036 | 0.009 | <0.001 |
| Tire type × cart load | 0.173 | 0.031 | <0.001 | −0.115 | 0.020 | <0.001 | - | - | - |
| Effect | Required Operating Force, ROF (N) | Capability Percentage, CP (%) | Percentage Change in Required Operating Time, ROT (%) | ||||||
|---|---|---|---|---|---|---|---|---|---|
| β | s.e. | p-Value | β | s.e. | p-Value | β | s.e. | p-Value | |
| Intercept | 29.8 | 7.44 | 0.008 | 110 | 1.73 | <0.001 | 353 | 2.67 | <0.001 |
| Tire type (solid vs. pneumatic) | 60.5 | 5.91 | <0.001 | −14.7 | 1.38 | <0.001 | 2.38 | 1.87 | 0.003 |
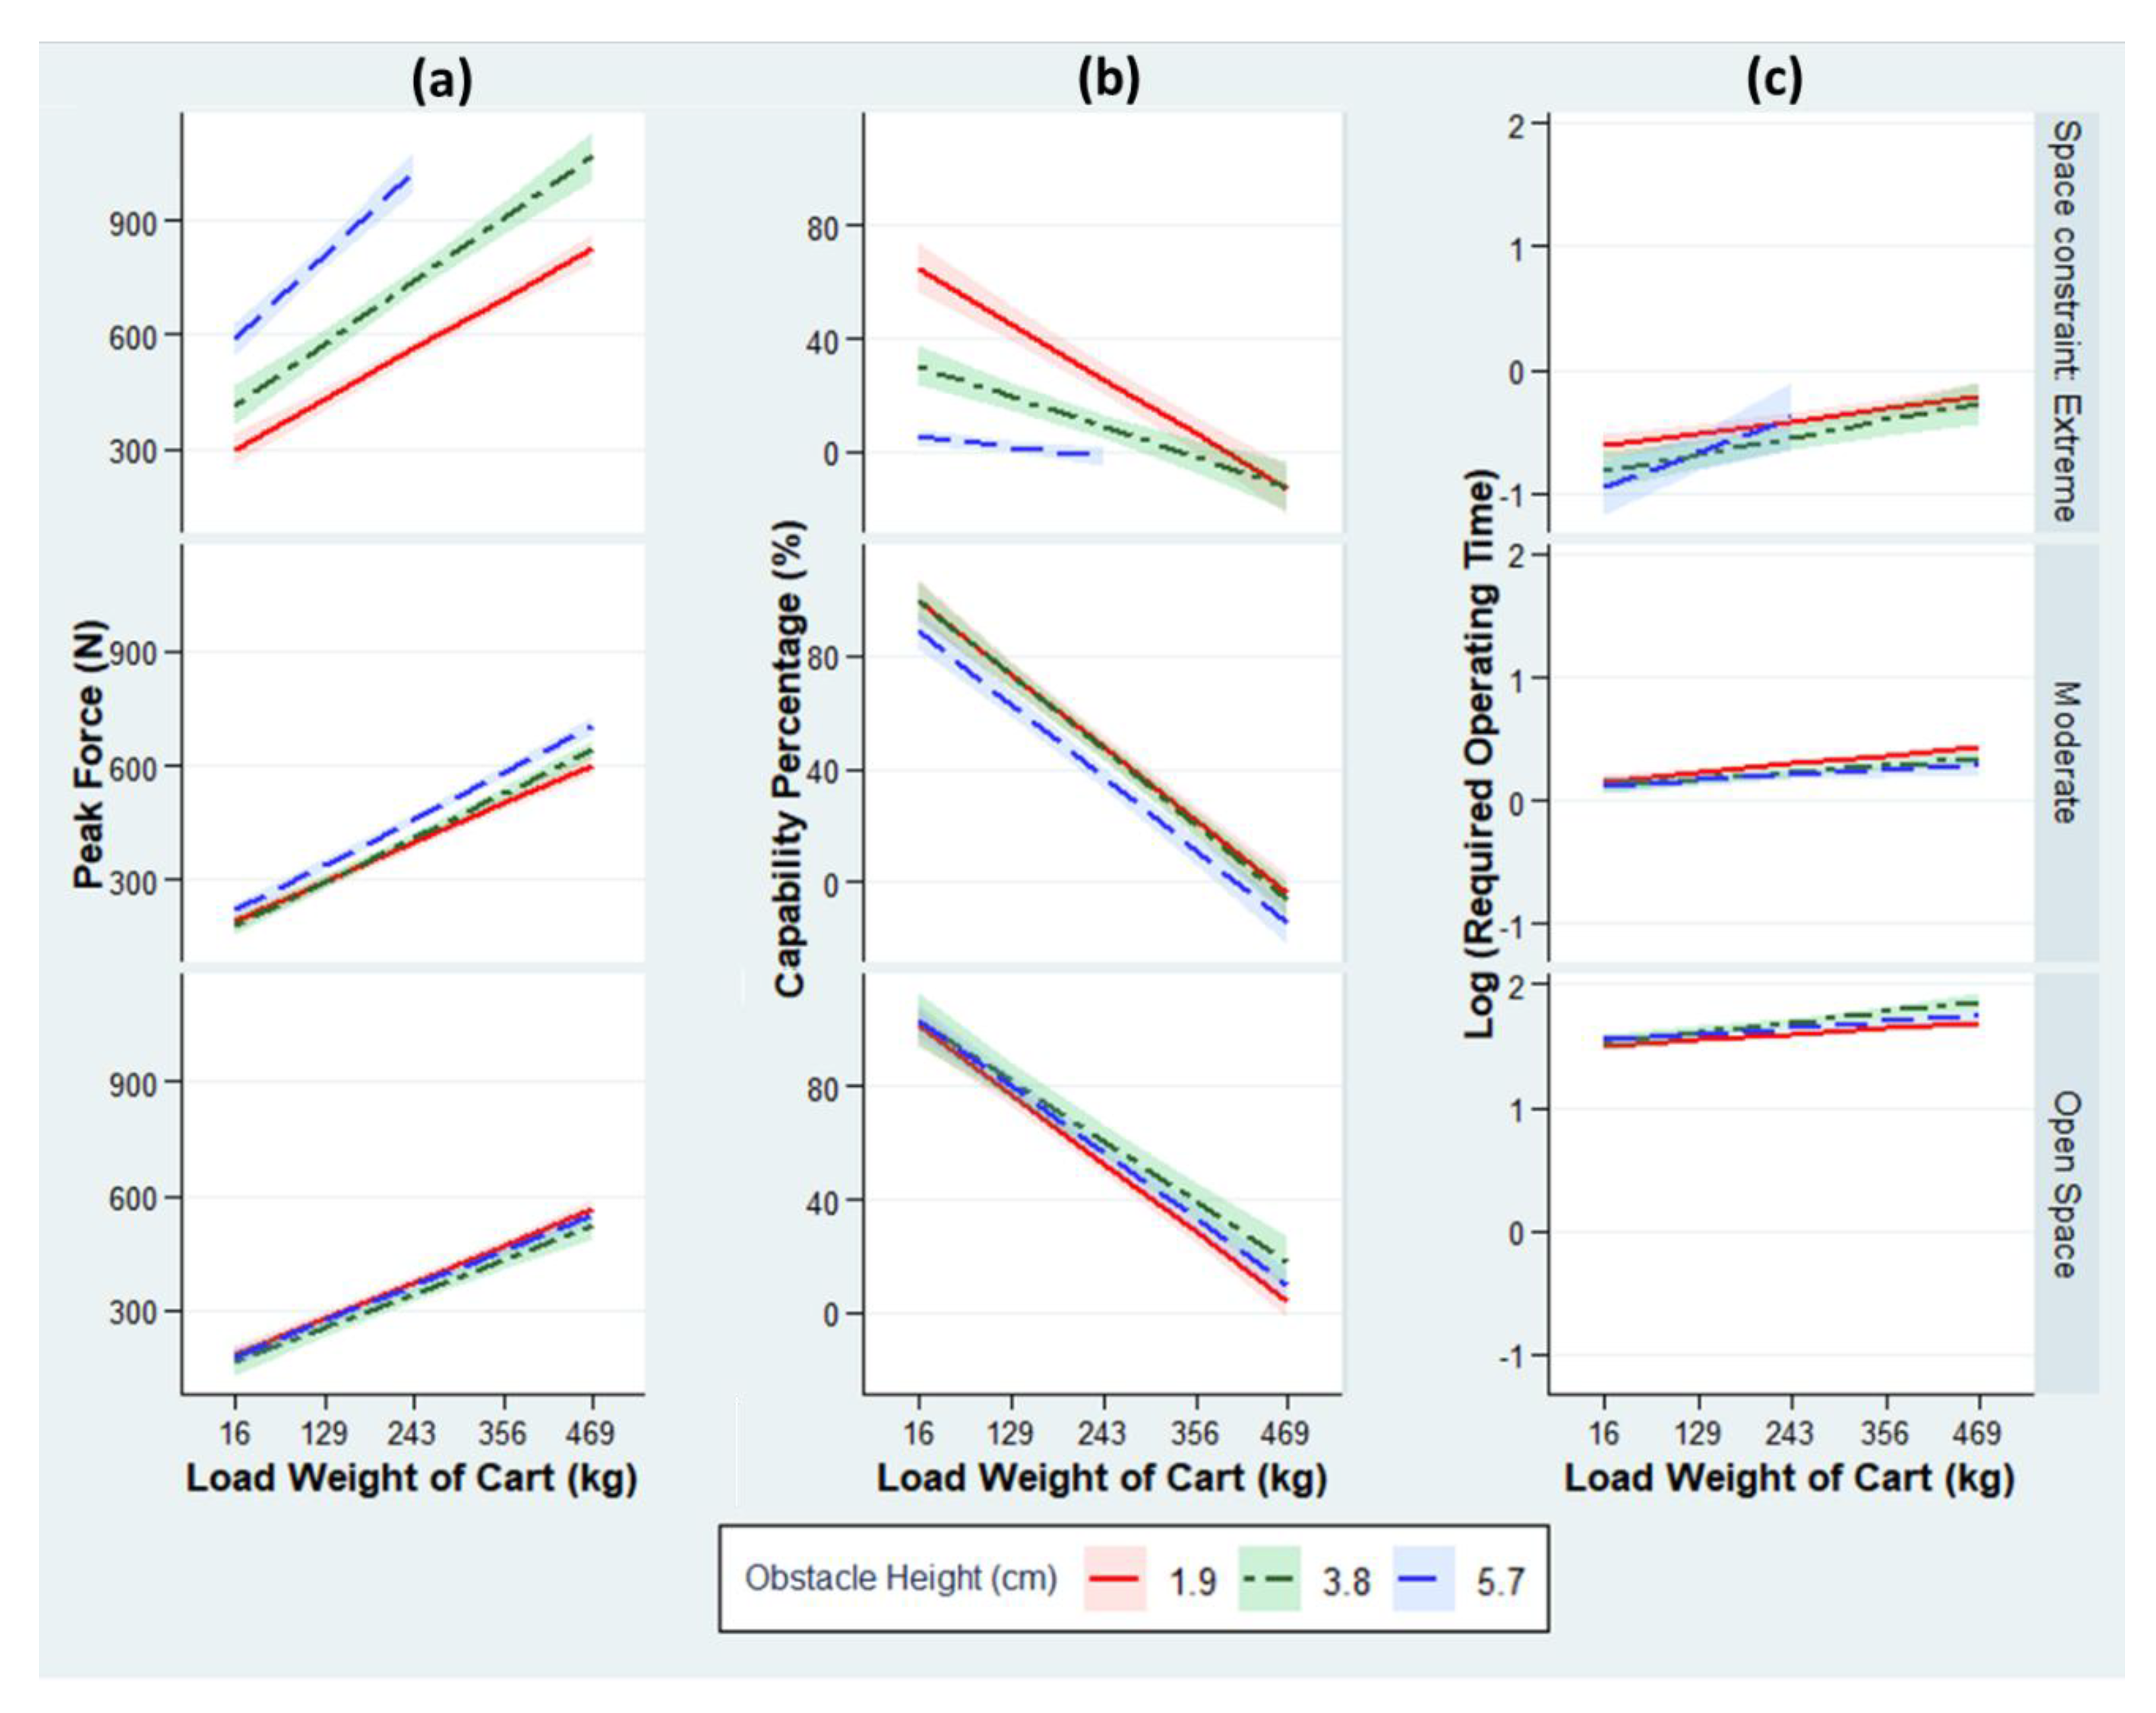
| Obstacle height (cm) | 25.0 | 2.23 | <0.001 | 0.996 | 0.523 | 0.057 | −1.83 | 0.612 | 0.204 |
| Space constraint | |||||||||
| Moderate vs. open space | 46.8 | 10.4 | <0.001 | 0.744 | 2.56 | 0.772 | −75.5 | 2.21 | <0.001 |
| Extreme vs. open space | 190 | 15.2 | <0.001 | −45.0 | 4.68 | <0.001 | −88.6 | 2.36 | <0.001 |
| Cart load (kg) | 0.546 | 0.022 | <0.001 | −0.210 | 0.005 | <0.001 | 0.071 | 0.006 | <0.001 |
| Obstacle height × space constraint | |||||||||
| Obstacle height × Moderate vs. open space | 2.03 | 4.59 | 0.569 | −3.77 | 0.486 | <0.001 | - | - | - |
| Obstacle height × Extreme vs. open space | 76.8 | 5.99 | <0.001 | −14.2 | 1.21 | <0.001 | - | - | - |
| Cart load × space constraint | |||||||||
| Cart load × Moderate vs. open space | 0.386 | 0.036 | <0.001 | −0.028 | 0.007 | <0.001 | - | - | - |
| Cart load × Extreme vs. open space | 0.845 | 0.057 | <0.001 | 0.072 | 0.012 | <0.001 | - | - | - |
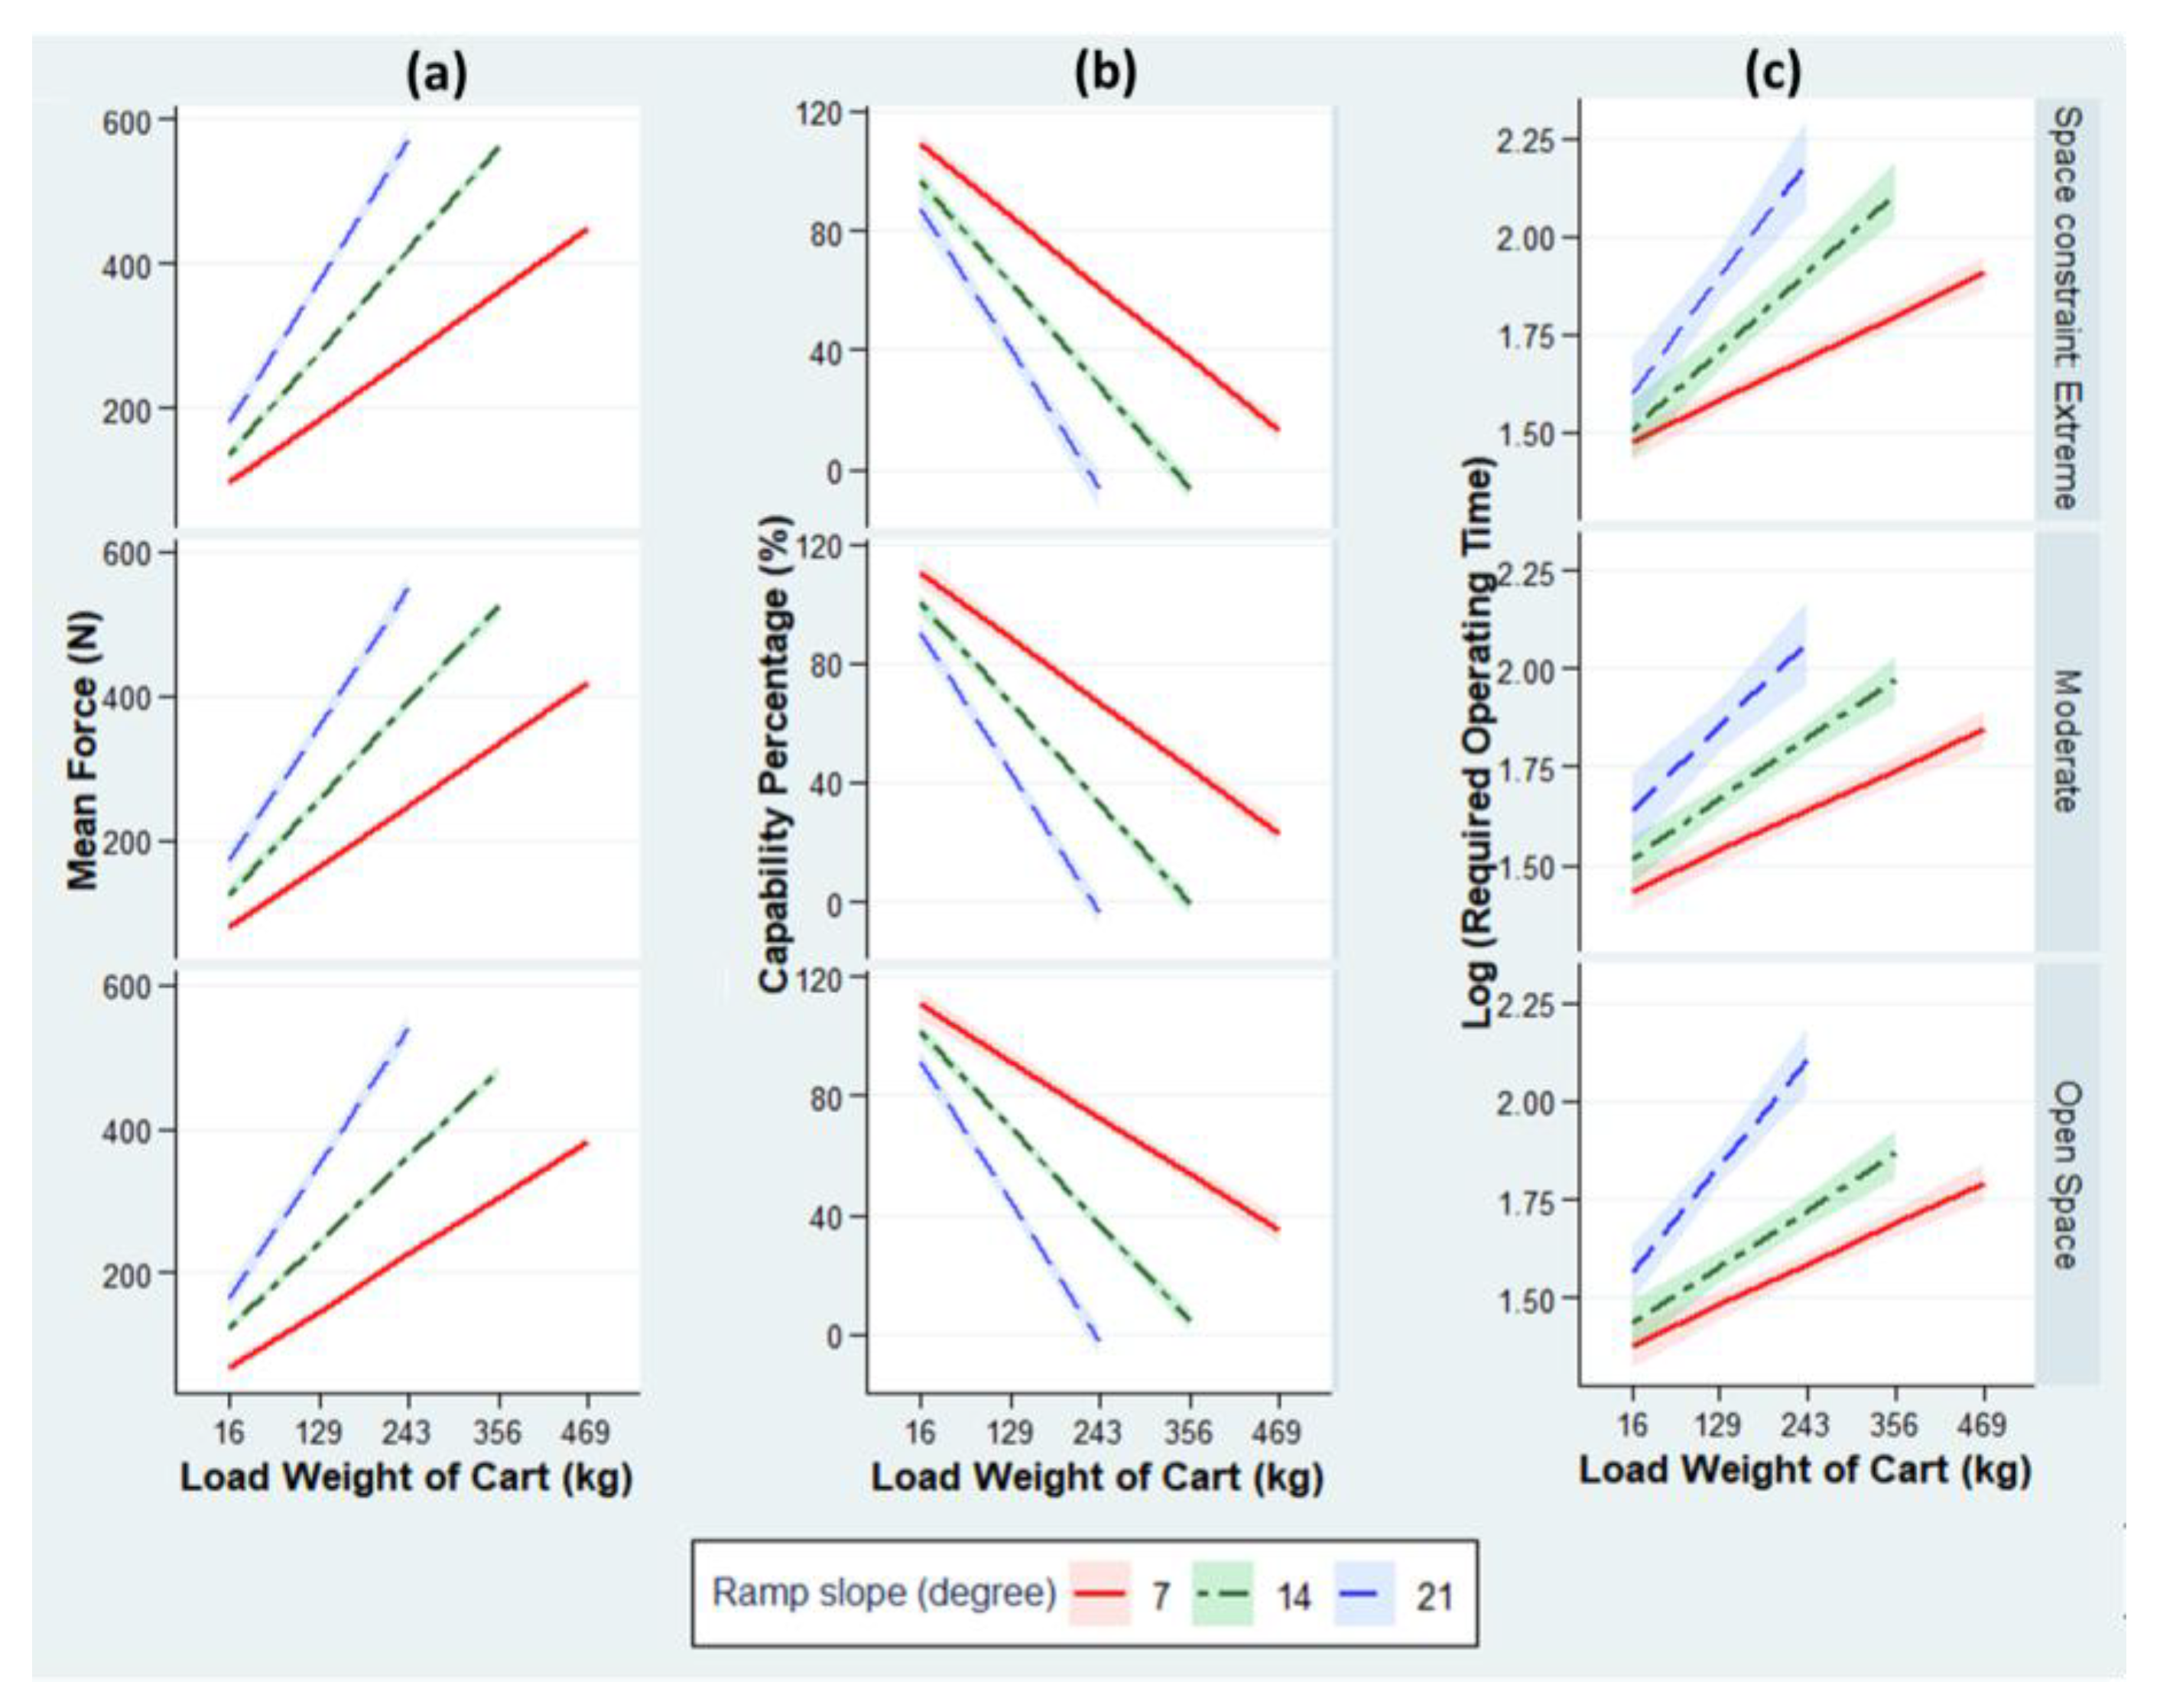
| Effect | Required Operating Force, ROF (N) | Capability Percentage, CP (%) | Percentage Change in Required Operating Time, ROT (%) | ||||||
|---|---|---|---|---|---|---|---|---|---|
| β | s.e. | p-Value | β | s.e. | p-Value | β | s.e. | p-Value | |
| Intercept | 37.5 | 2.54 | <0.001 | 119 | 1.46 | <0.001 | 275 | 1.95 | <0.001 |
| Tire type (solid vs. pneumatic) | 31.5 | 1.91 | <0.001 | −6.96 | 0.848 | <0.001 | 4.24 | 1.29 | 0.0013 |
| Ramp slope (°) | 10.3 | 0.385 | <0.001 | −2.29 | 0.217 | <0.001 | 2.19 | 0.335 | <0.001 |
| Space constraint | |||||||||
| Moderate vs. open space | 19.2 | 2.31 | <0.001 | −3.92 | 0.988 | <0.001 | 6.28 | 1.56 | <0.001 |
| Extreme vs. open space | 41.5 | 2.27 | <0.001 | −8.76 | 1.05 | <0.001 | 11.9 | 1.56 | <0.001 |
| Cart load (kg) | 0.756 | 0.009 | <0.001 | −0.196 | 0.004 | <0.001 | 0.098 | 0.006 | <0.001 |
| Ramp slope × cart load | 0.123 | 0.003 | <0.001 | −0.030 | 0.001 | <0.001 | 0.015 | 0.002 | <0.001 |
Publisher’s Note: MDPI stays neutral with regard to jurisdictional claims in published maps and institutional affiliations. |
© 2021 by the authors. Licensee MDPI, Basel, Switzerland. This article is an open access article distributed under the terms and conditions of the Creative Commons Attribution (CC BY) license (http://creativecommons.org/licenses/by/4.0/).
Share and Cite
Zhang, Z.; Lin, K.-Y.; Lin, J.-H. Factors Affecting Material-Cart Handling in the Roofing Industry: Evidence for Administrative Controls. Int. J. Environ. Res. Public Health 2021, 18, 1510. https://doi.org/10.3390/ijerph18041510
Zhang Z, Lin K-Y, Lin J-H. Factors Affecting Material-Cart Handling in the Roofing Industry: Evidence for Administrative Controls. International Journal of Environmental Research and Public Health. 2021; 18(4):1510. https://doi.org/10.3390/ijerph18041510
Chicago/Turabian StyleZhang, Zhenyu, Ken-Yu Lin, and Jia-Hua Lin. 2021. "Factors Affecting Material-Cart Handling in the Roofing Industry: Evidence for Administrative Controls" International Journal of Environmental Research and Public Health 18, no. 4: 1510. https://doi.org/10.3390/ijerph18041510