Investigating the Psychological Impact of COVID-19 among Healthcare Workers: A Meta-Analysis


Abstract
:1. Introduction
2. Materials and Methods
2.1. Protocol Registration
2.2. Databases and Search Strategy
2.3. Eligibility Criteria
2.4. Selection Process
2.5. Data Extraction
2.6. Assessment of Bias Risk
2.7. Statistical Analysis
3. Results
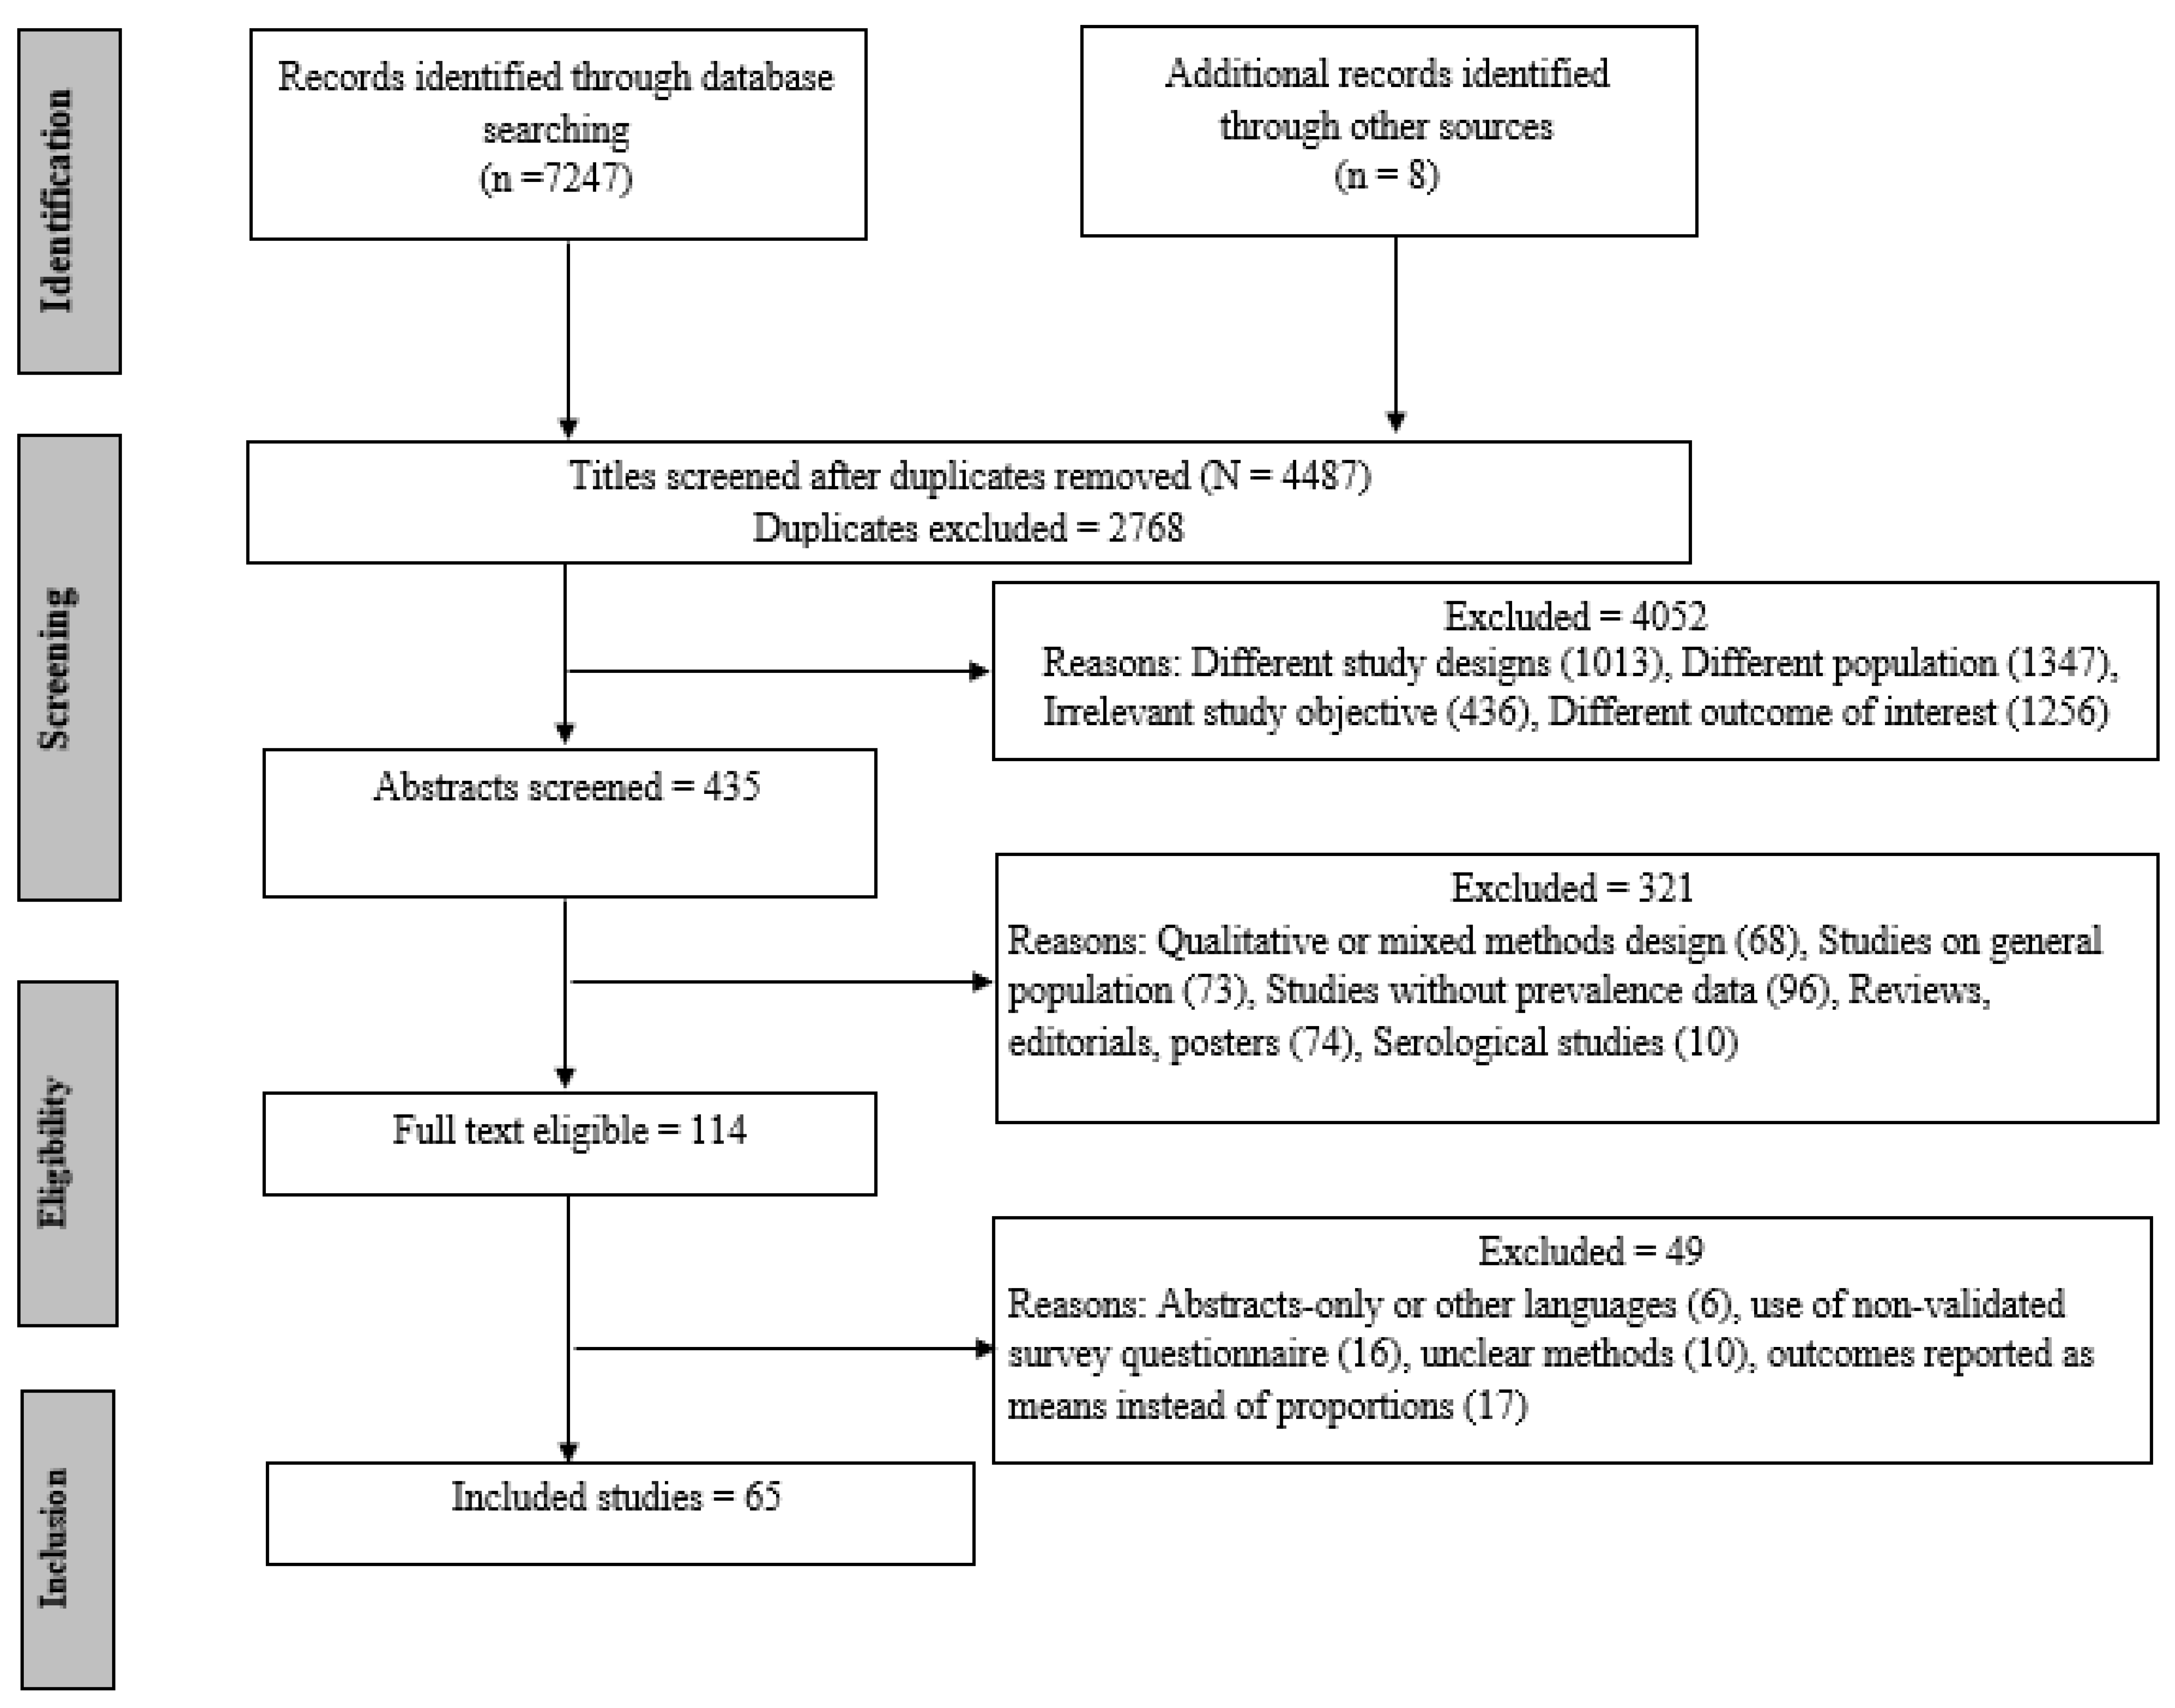
3.1. Study Screening
3.2. Study Quality
3.3. Study Characteristics
3.4. Meta-Analysis
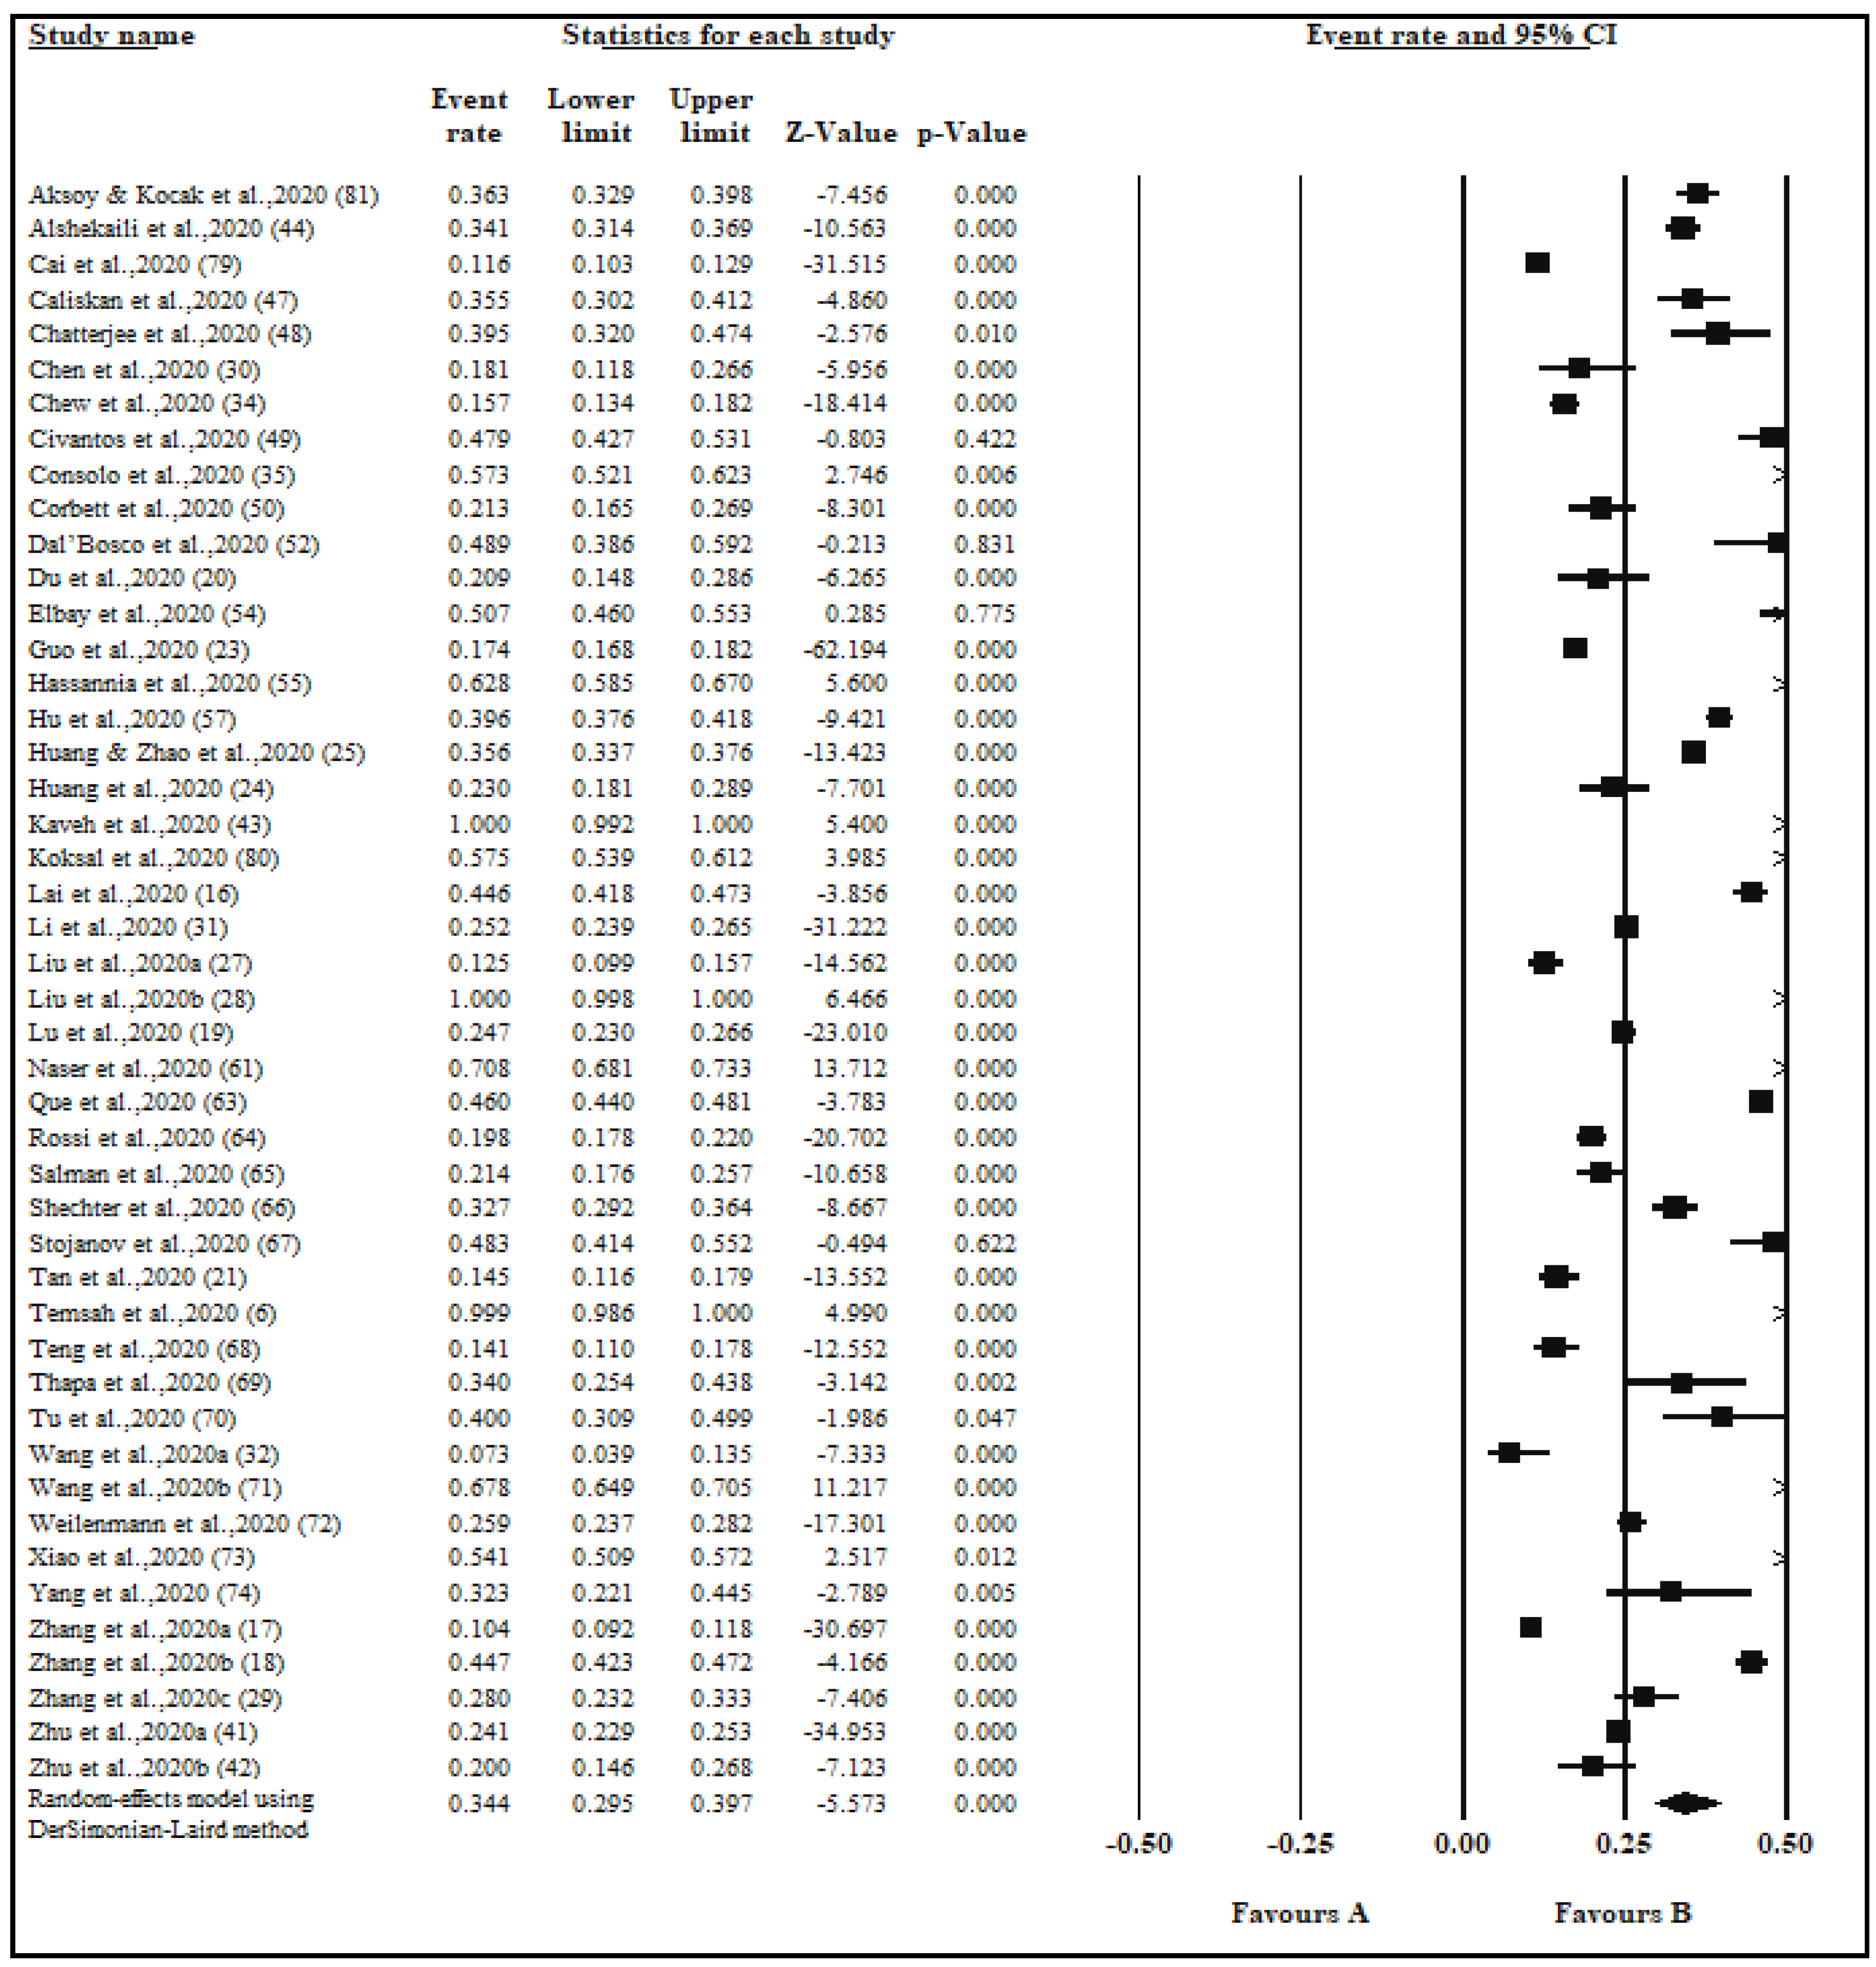
3.4.1. Anxiety Prevalence
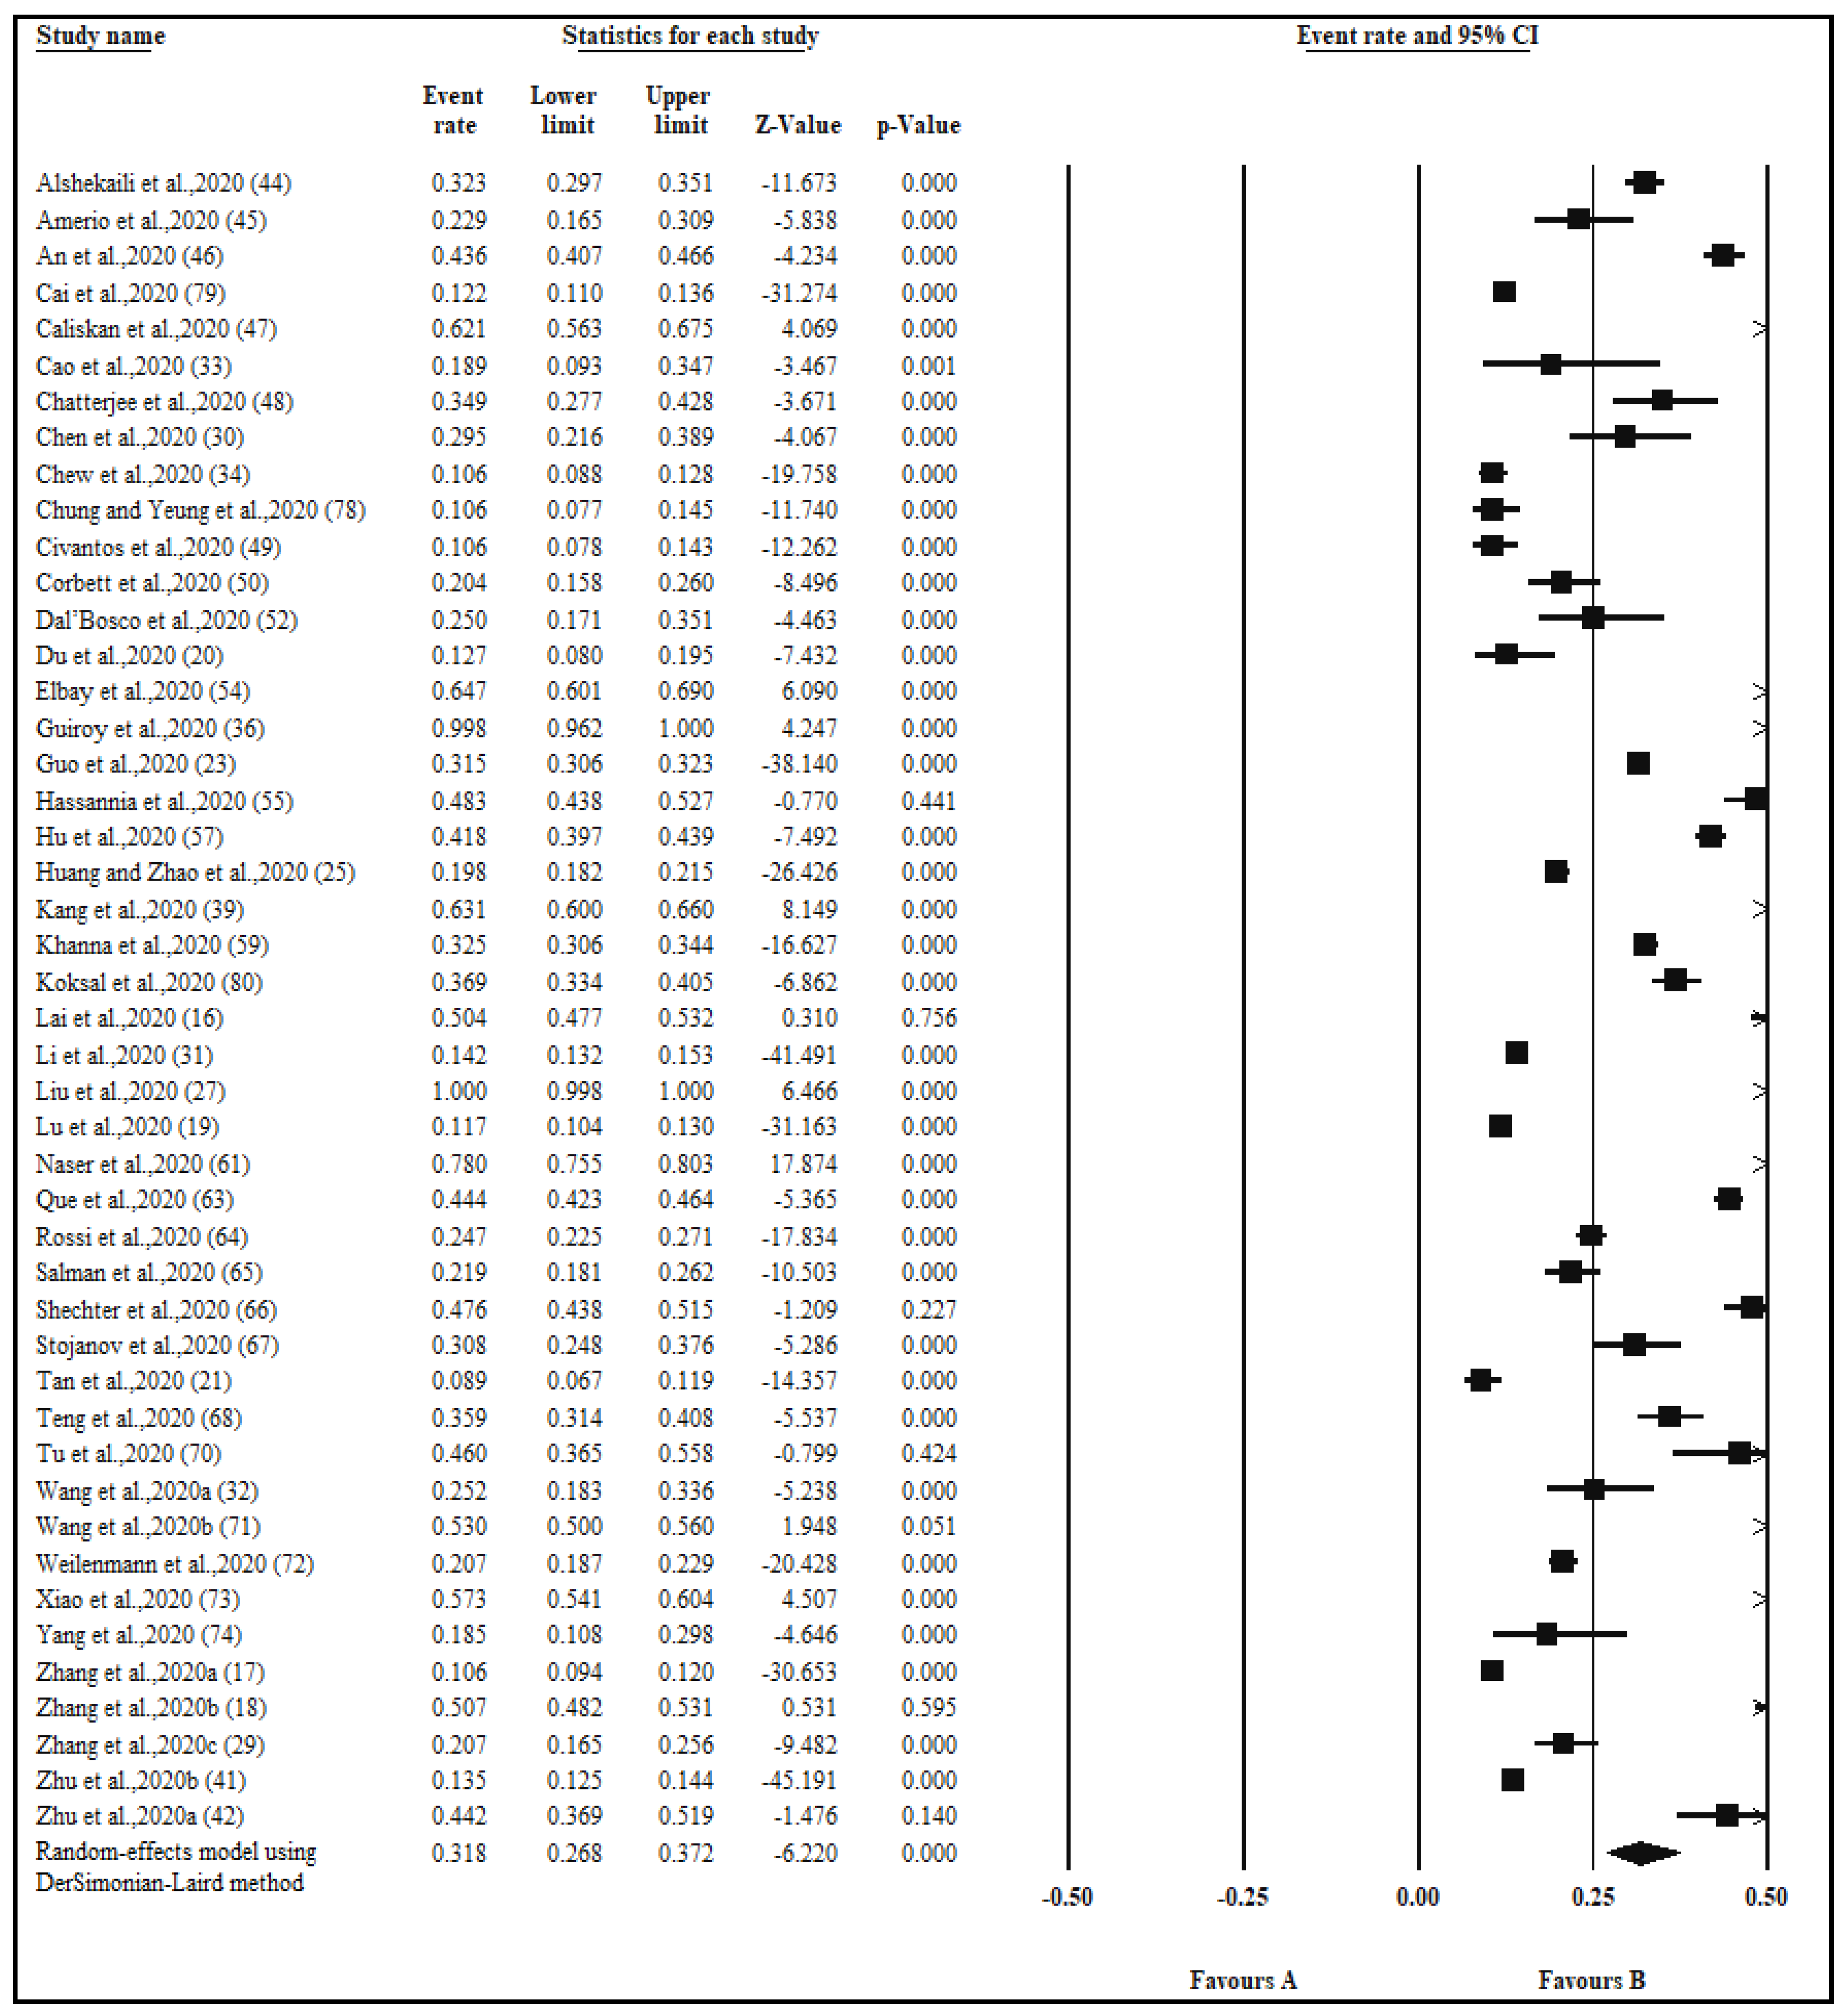
3.4.2. Depression Prevalence
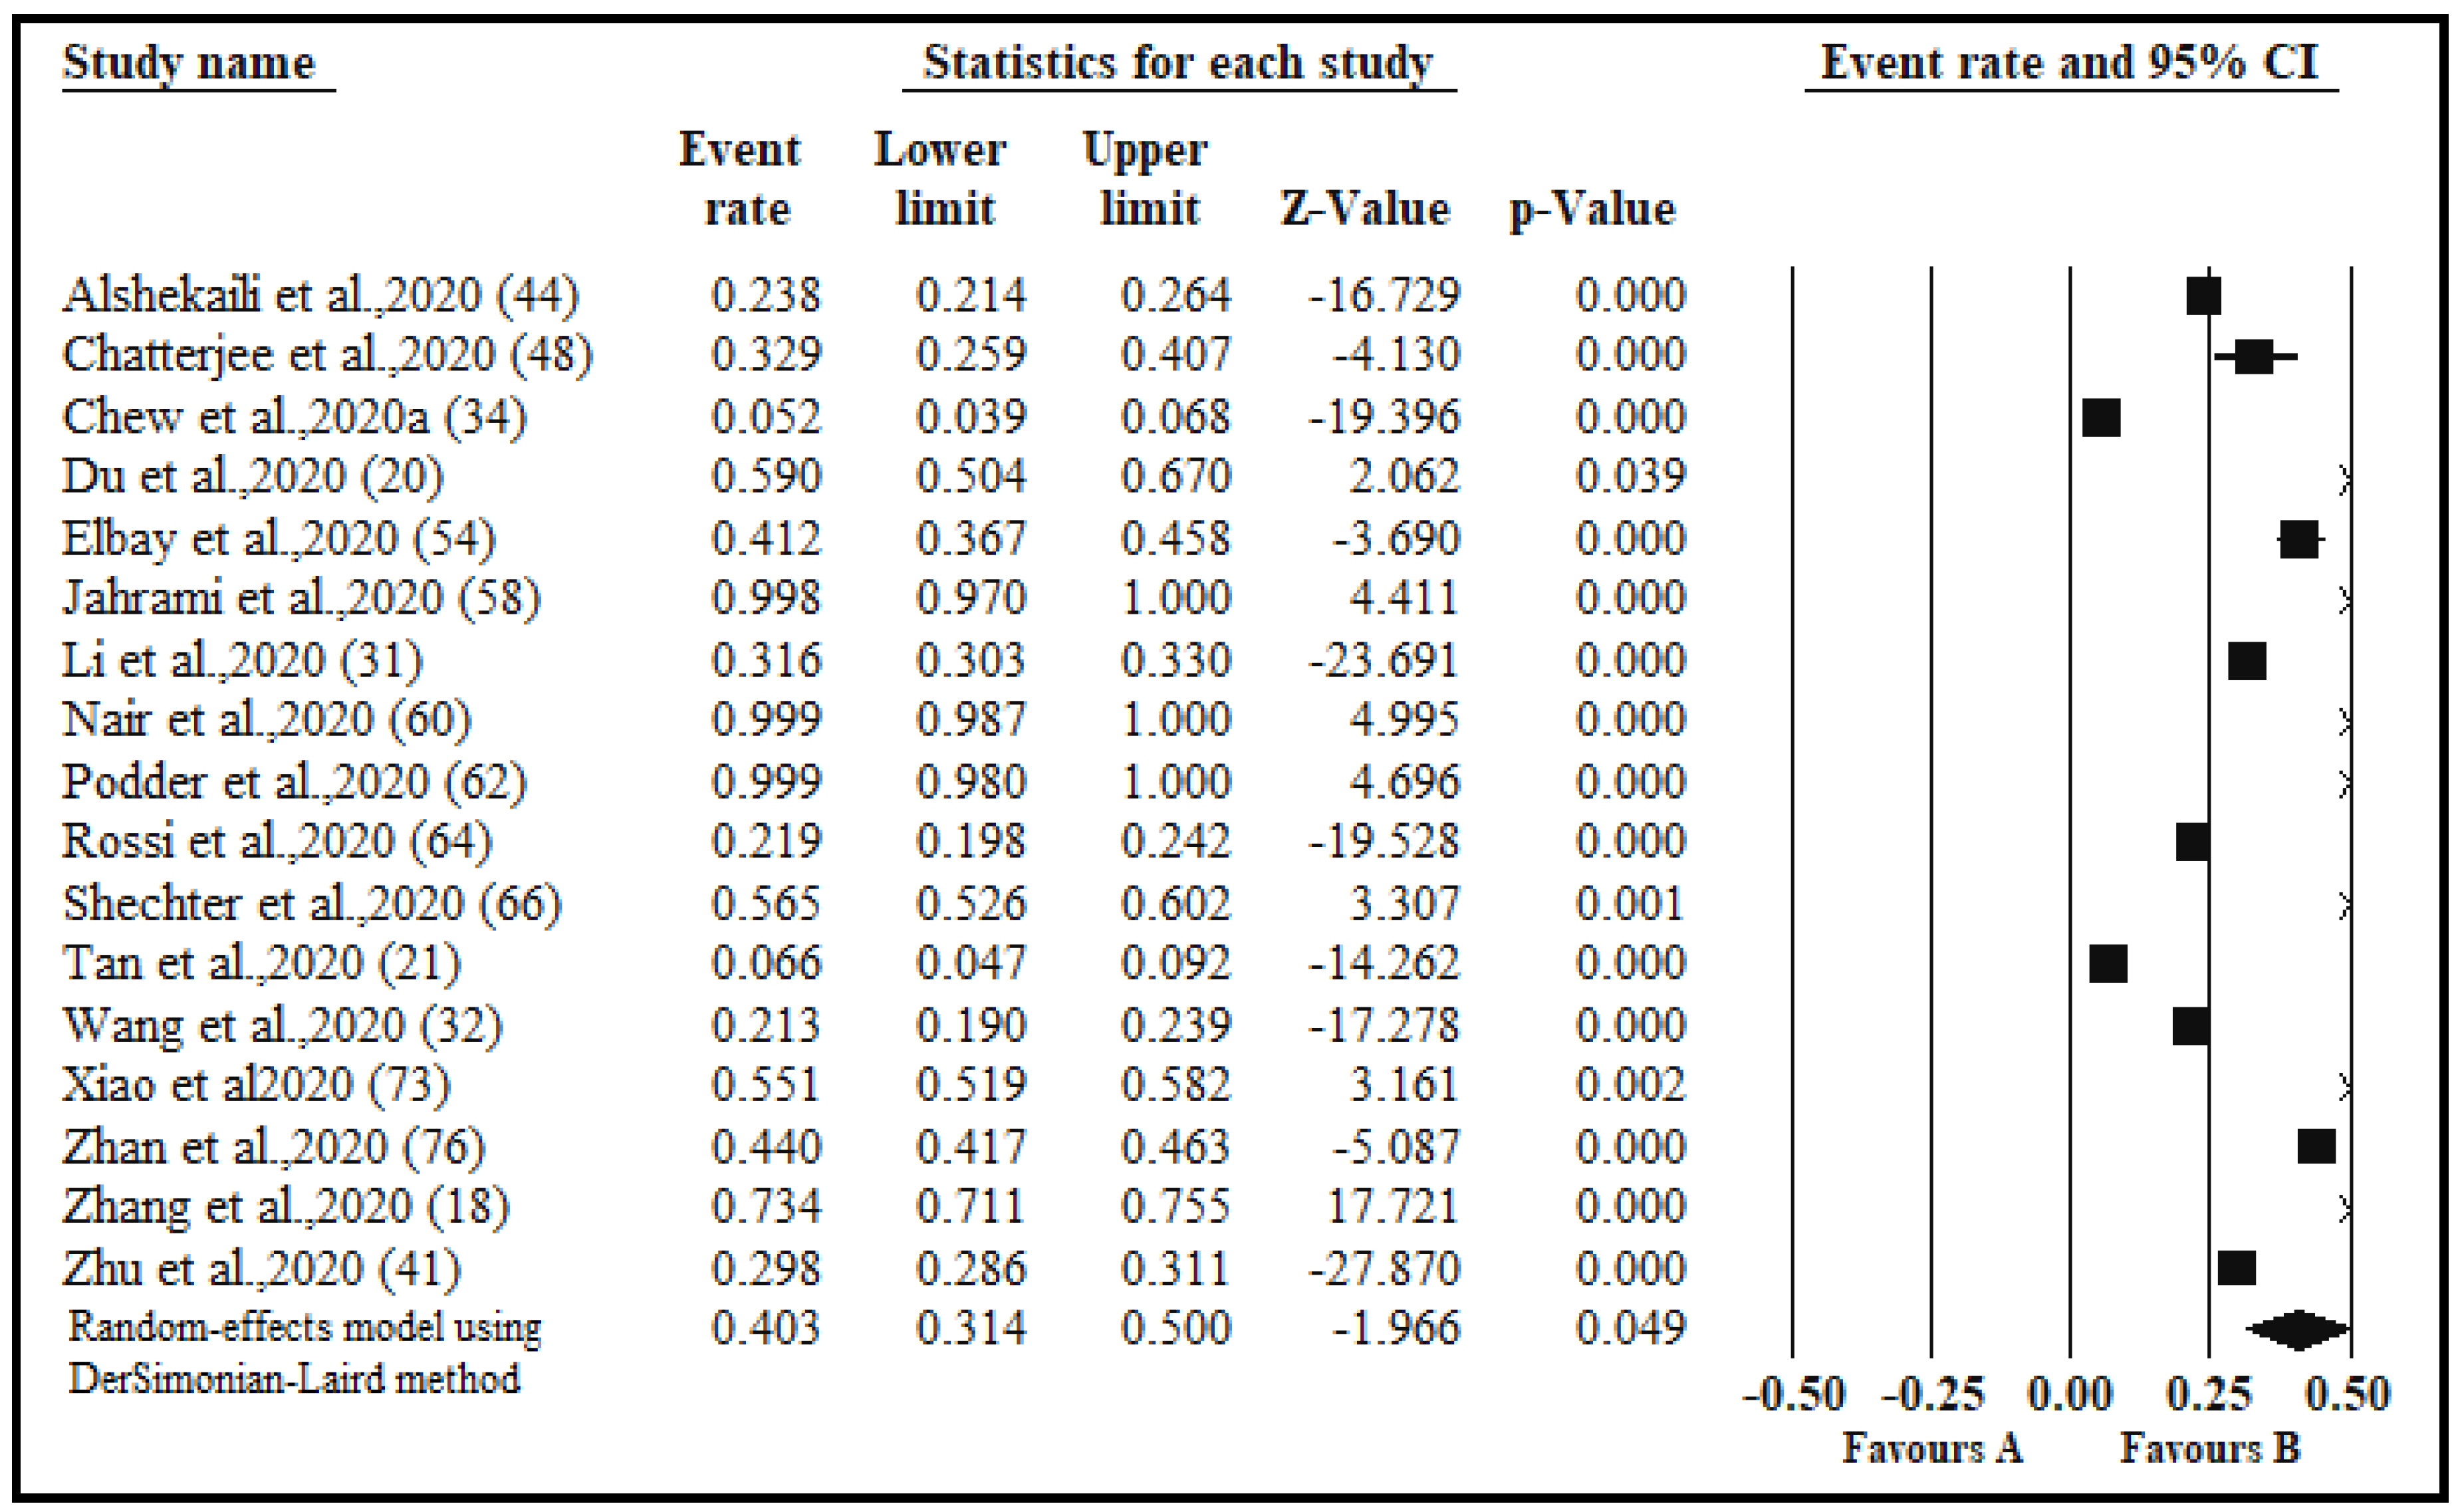
3.4.3. Stress Prevalence
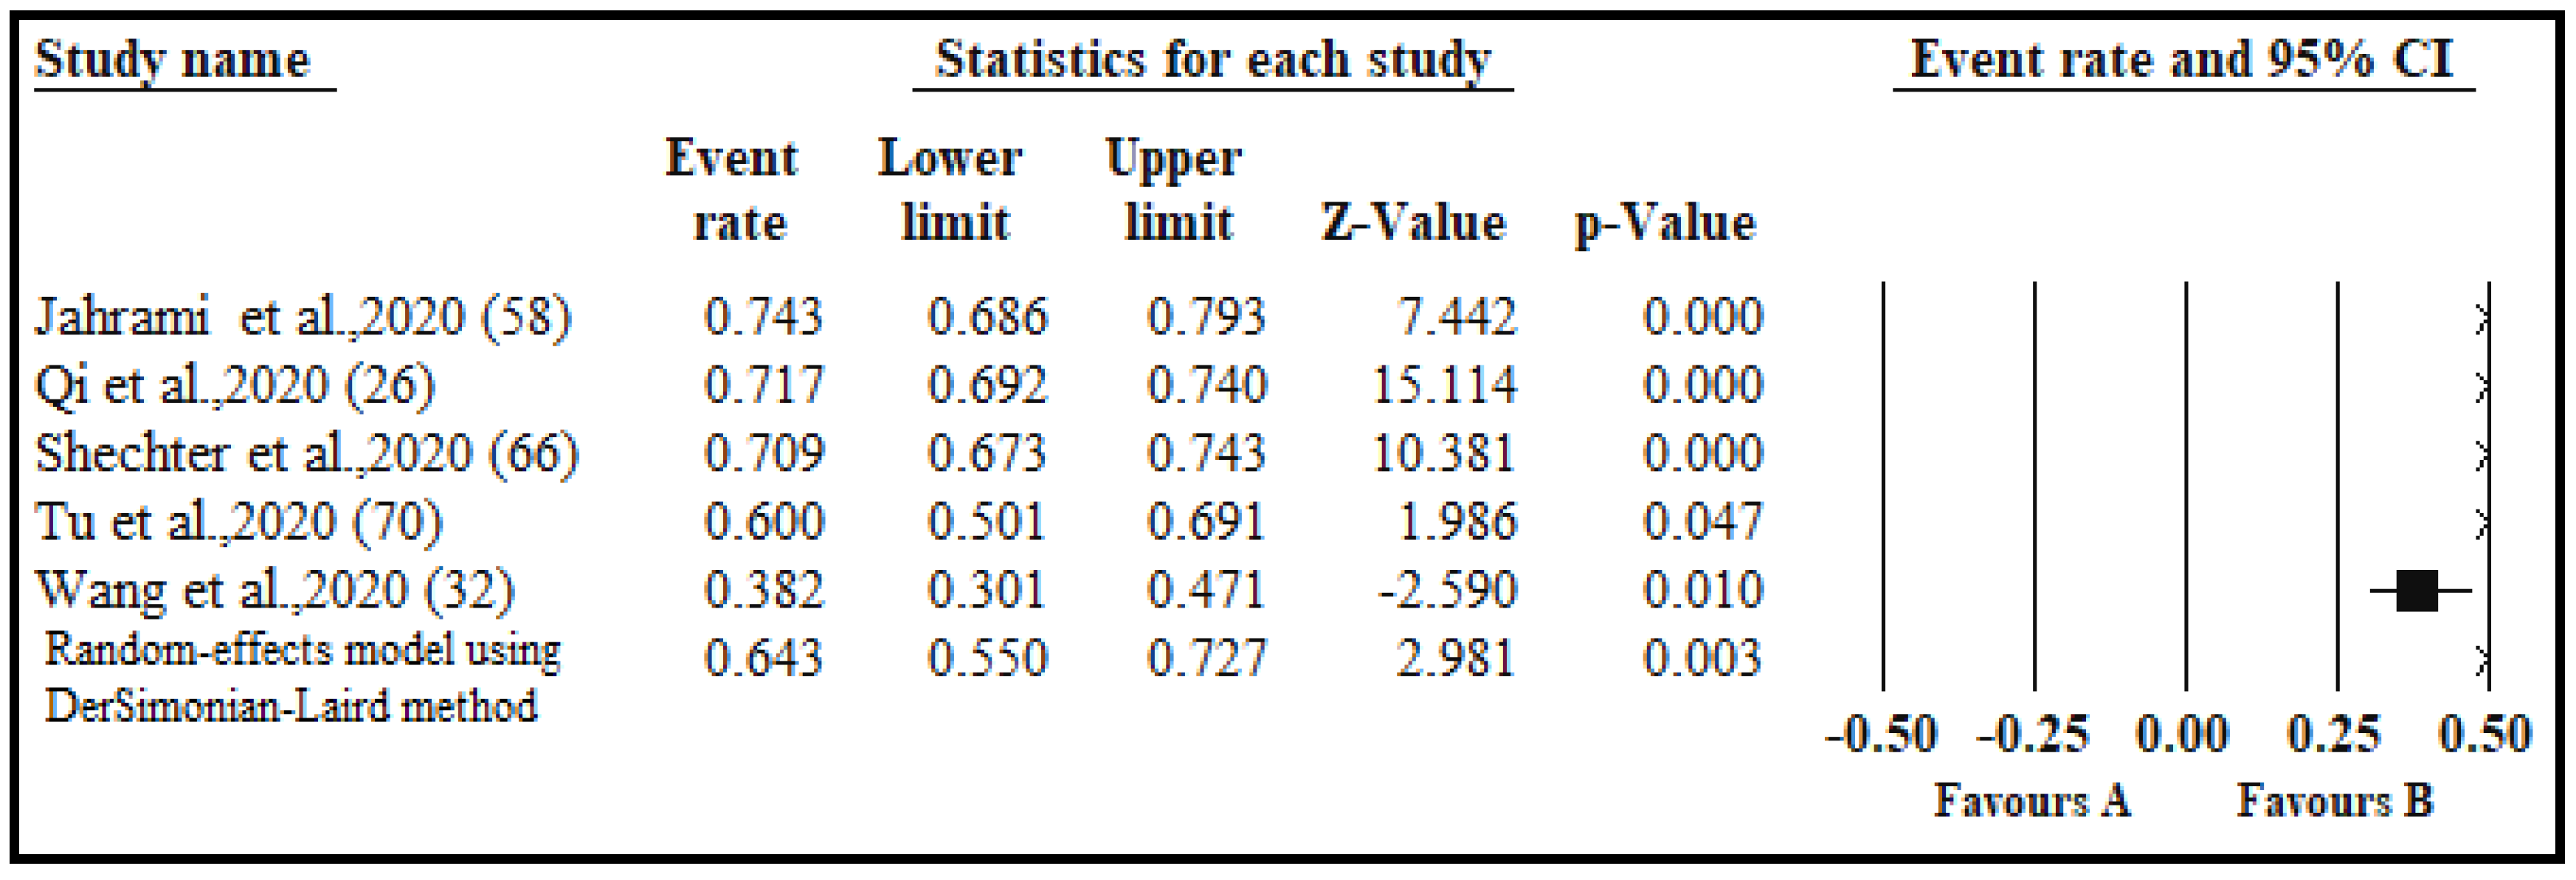
3.4.4. Prevalence of Insomnia and Impaired Sleep Quality
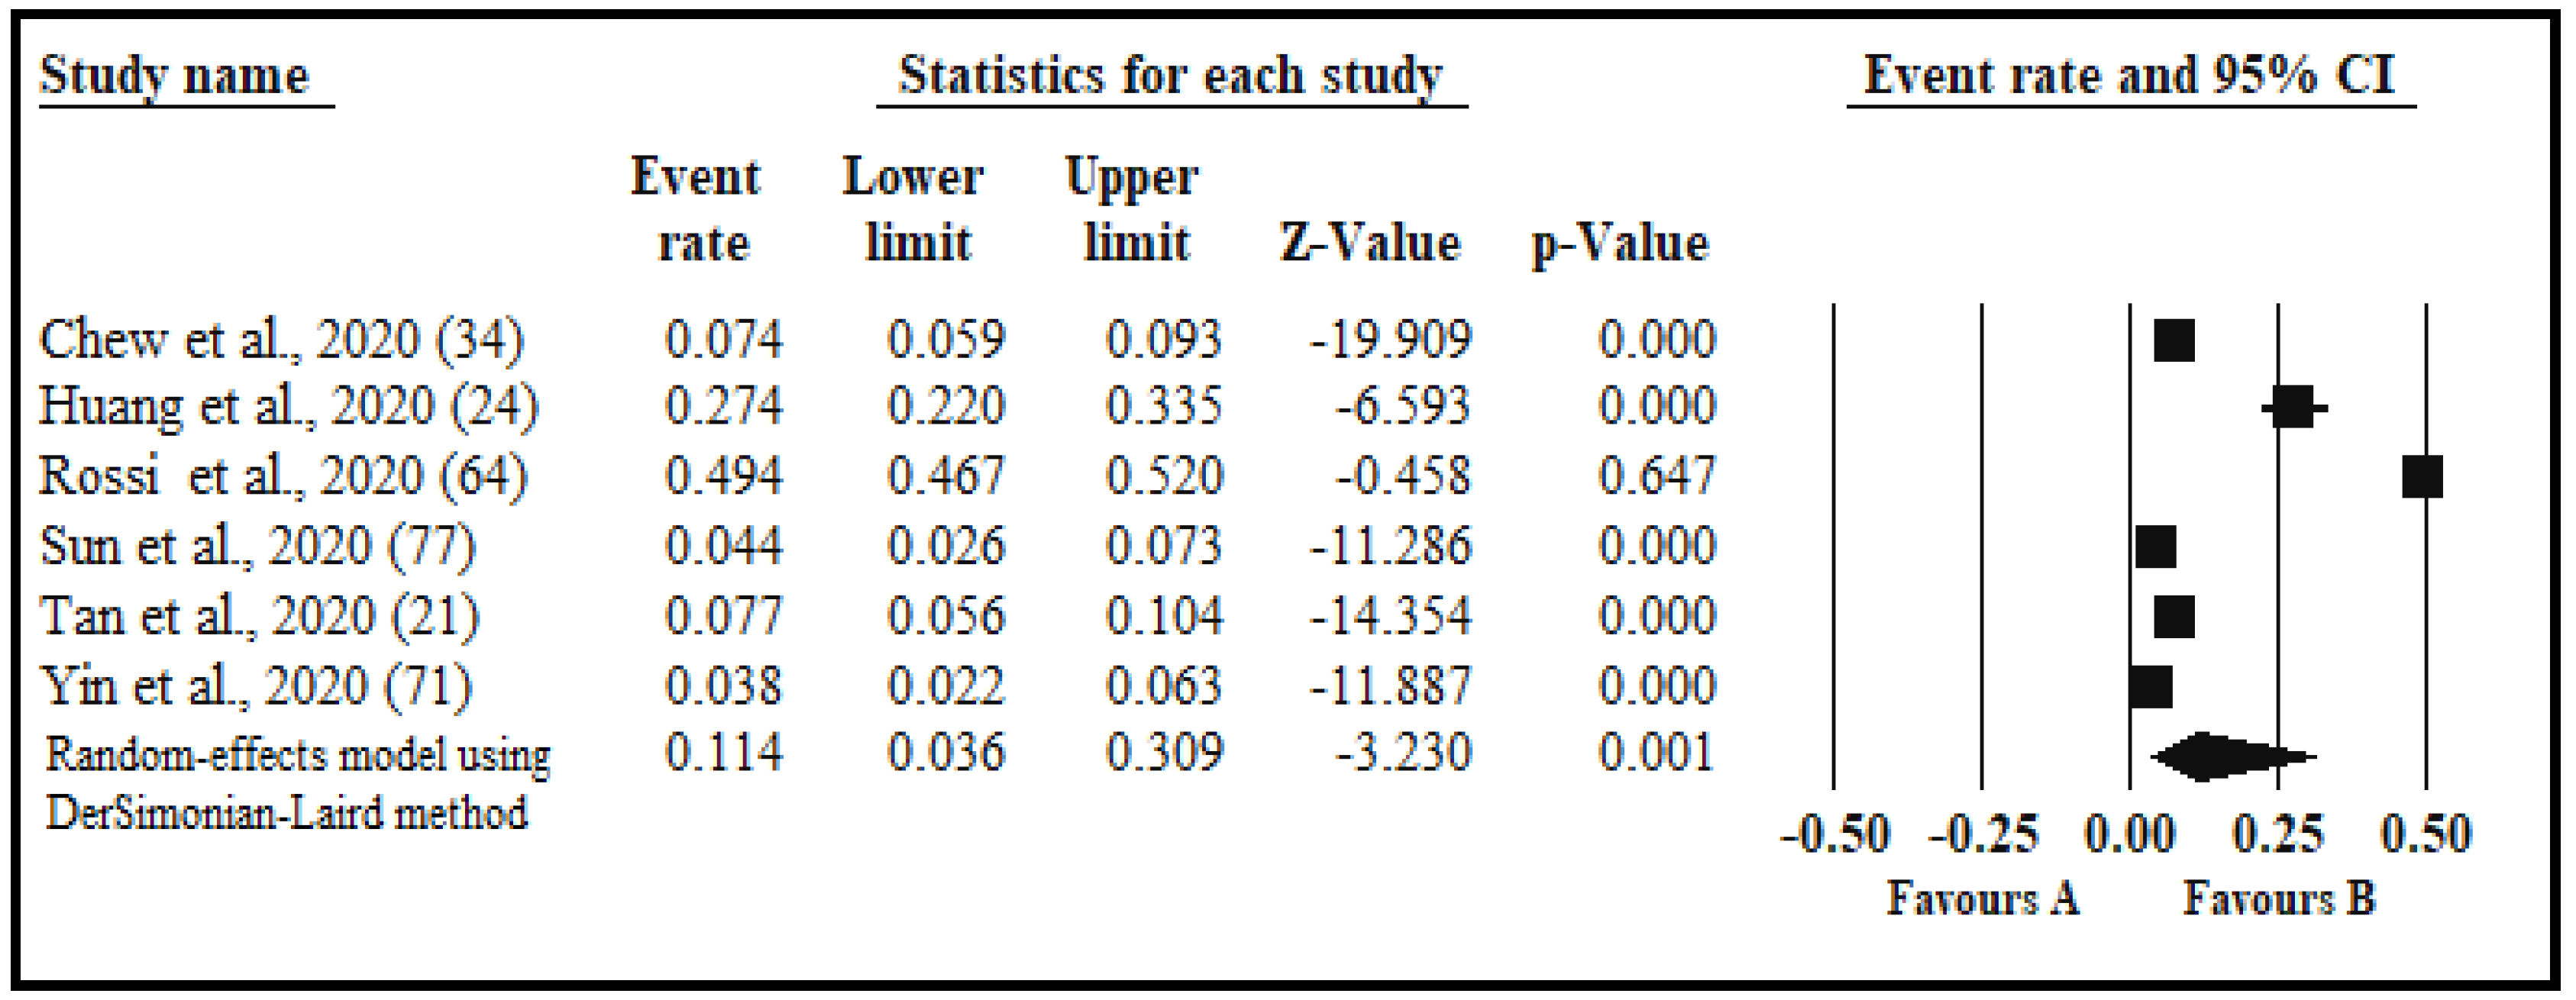
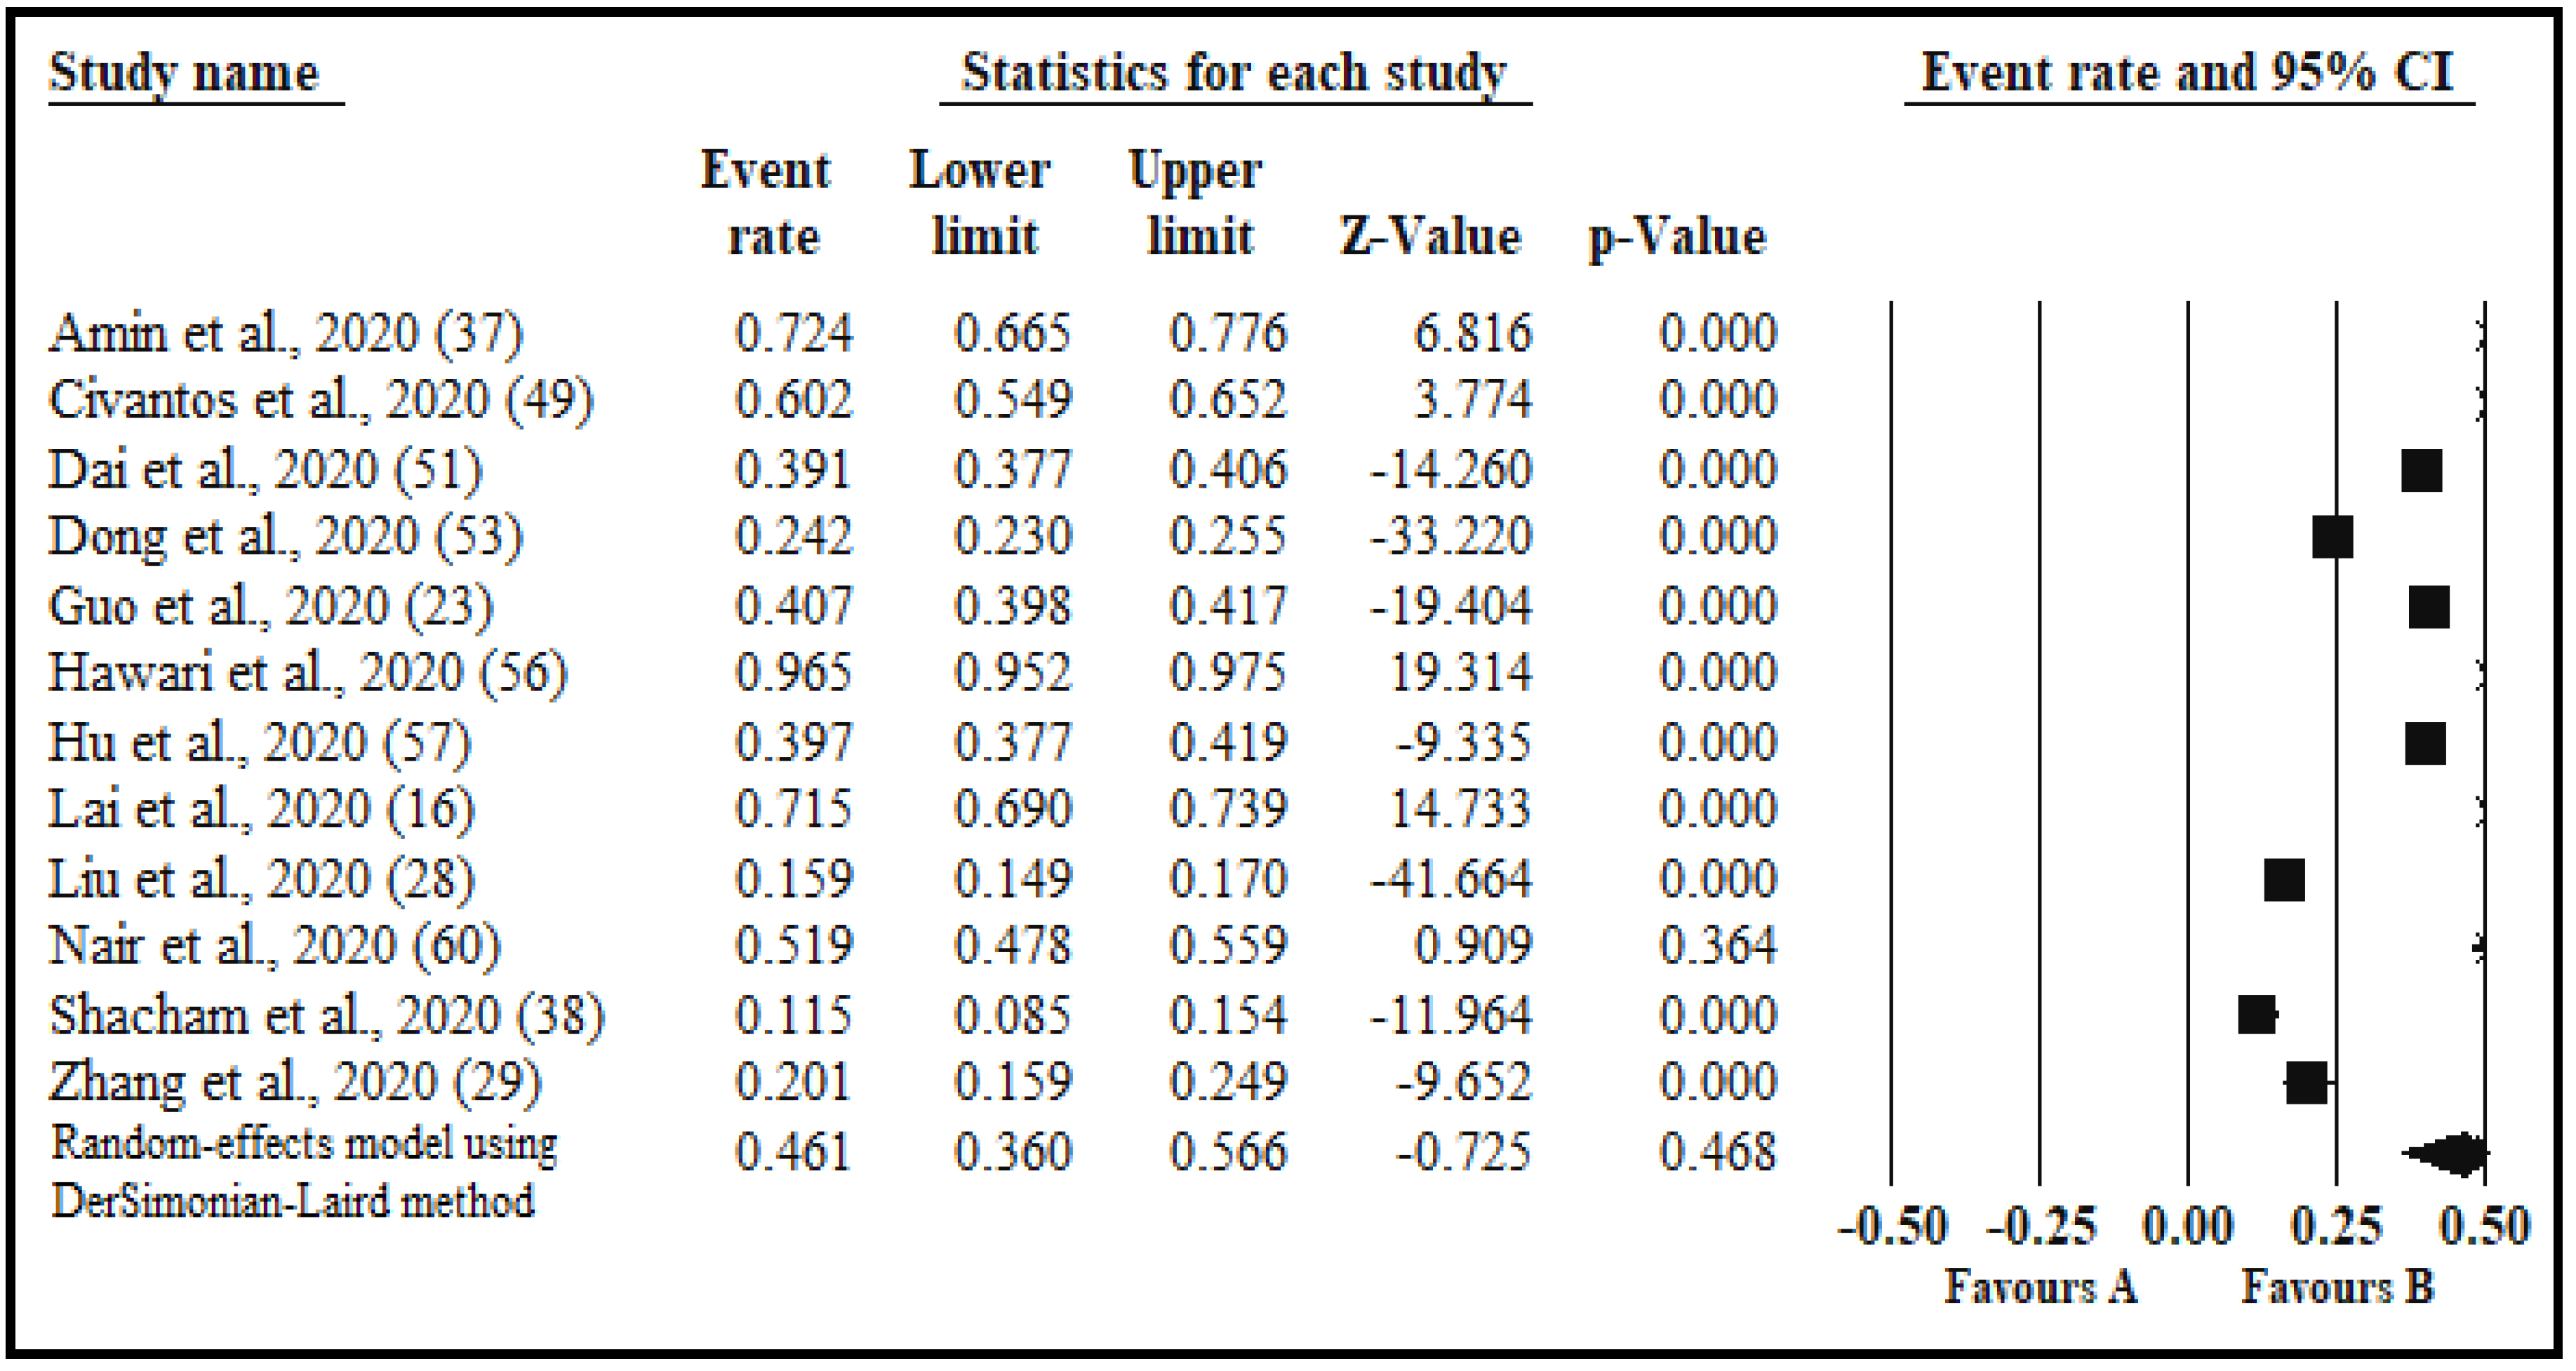
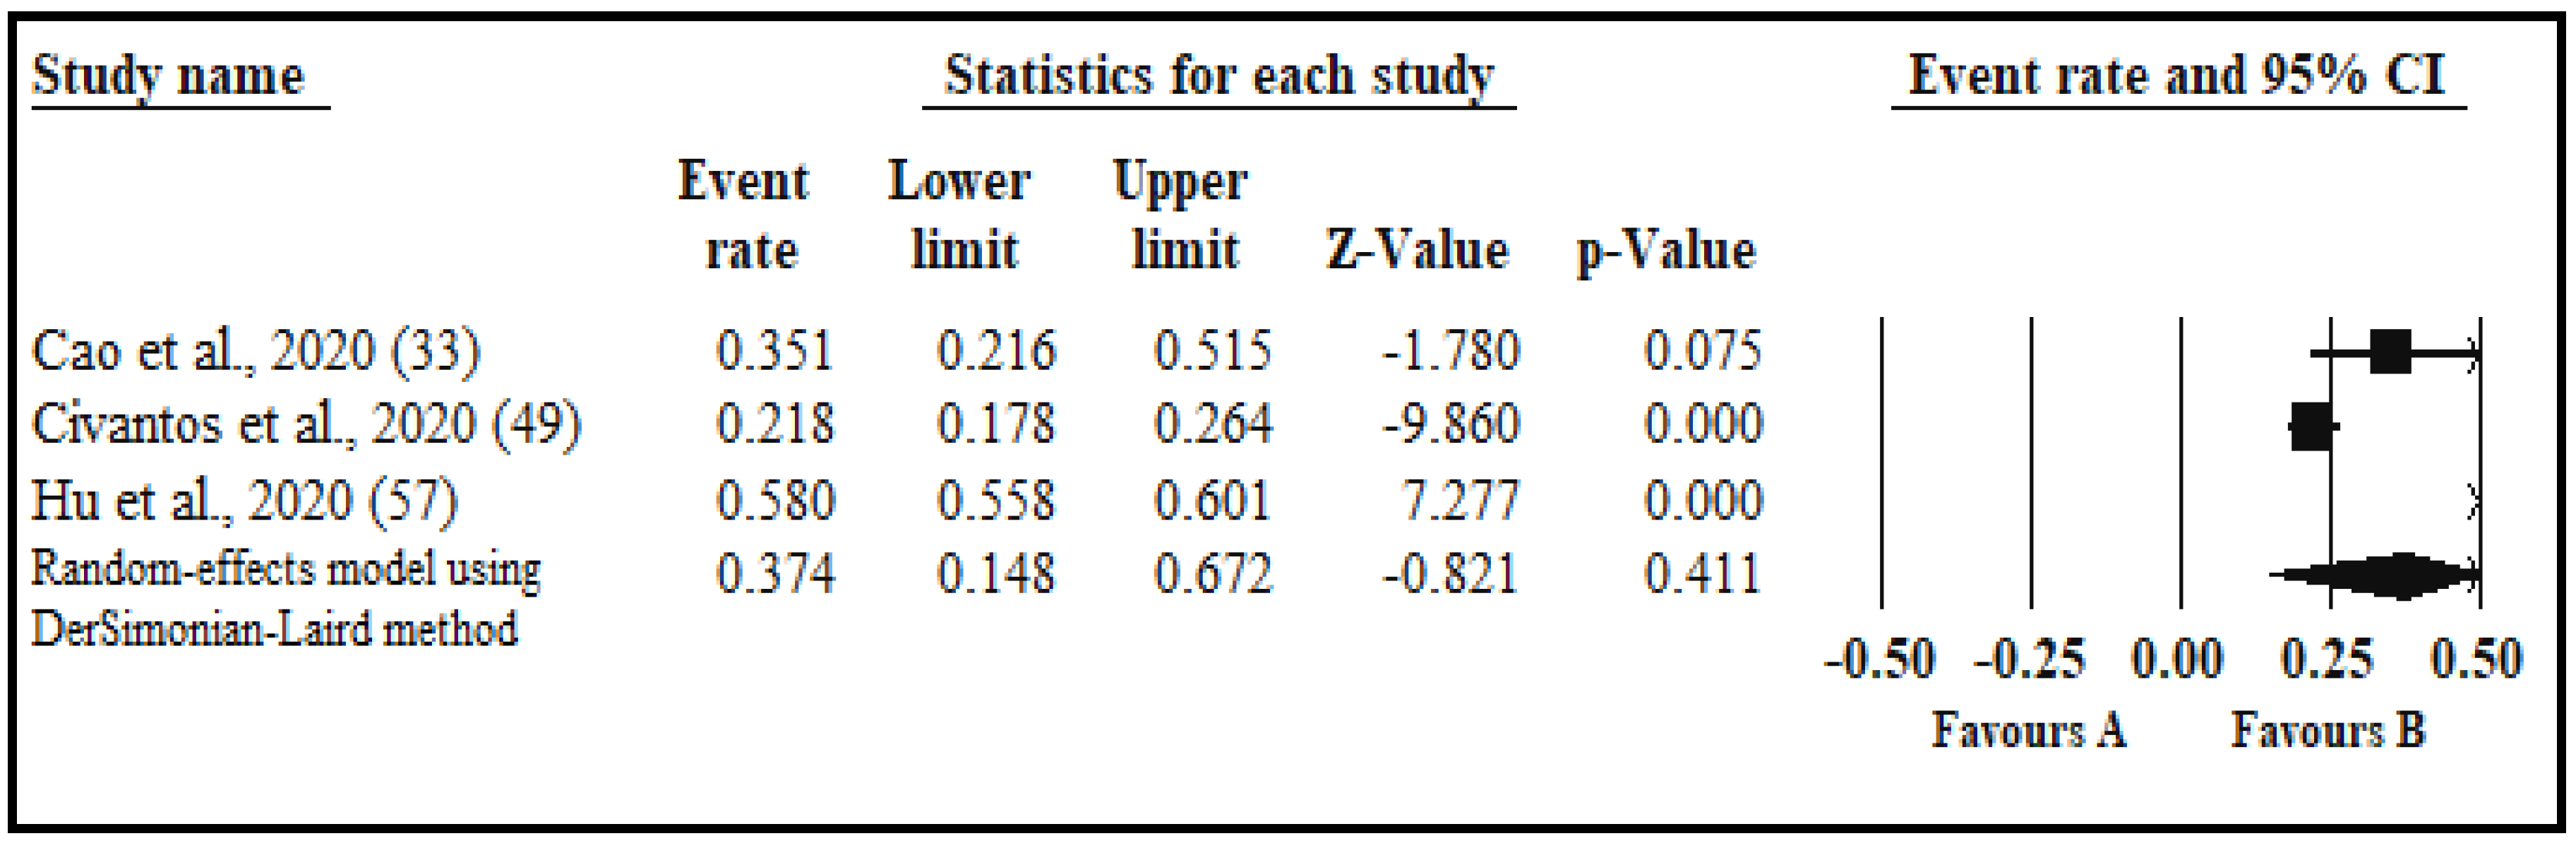
3.4.5. Other Psychological Indicators
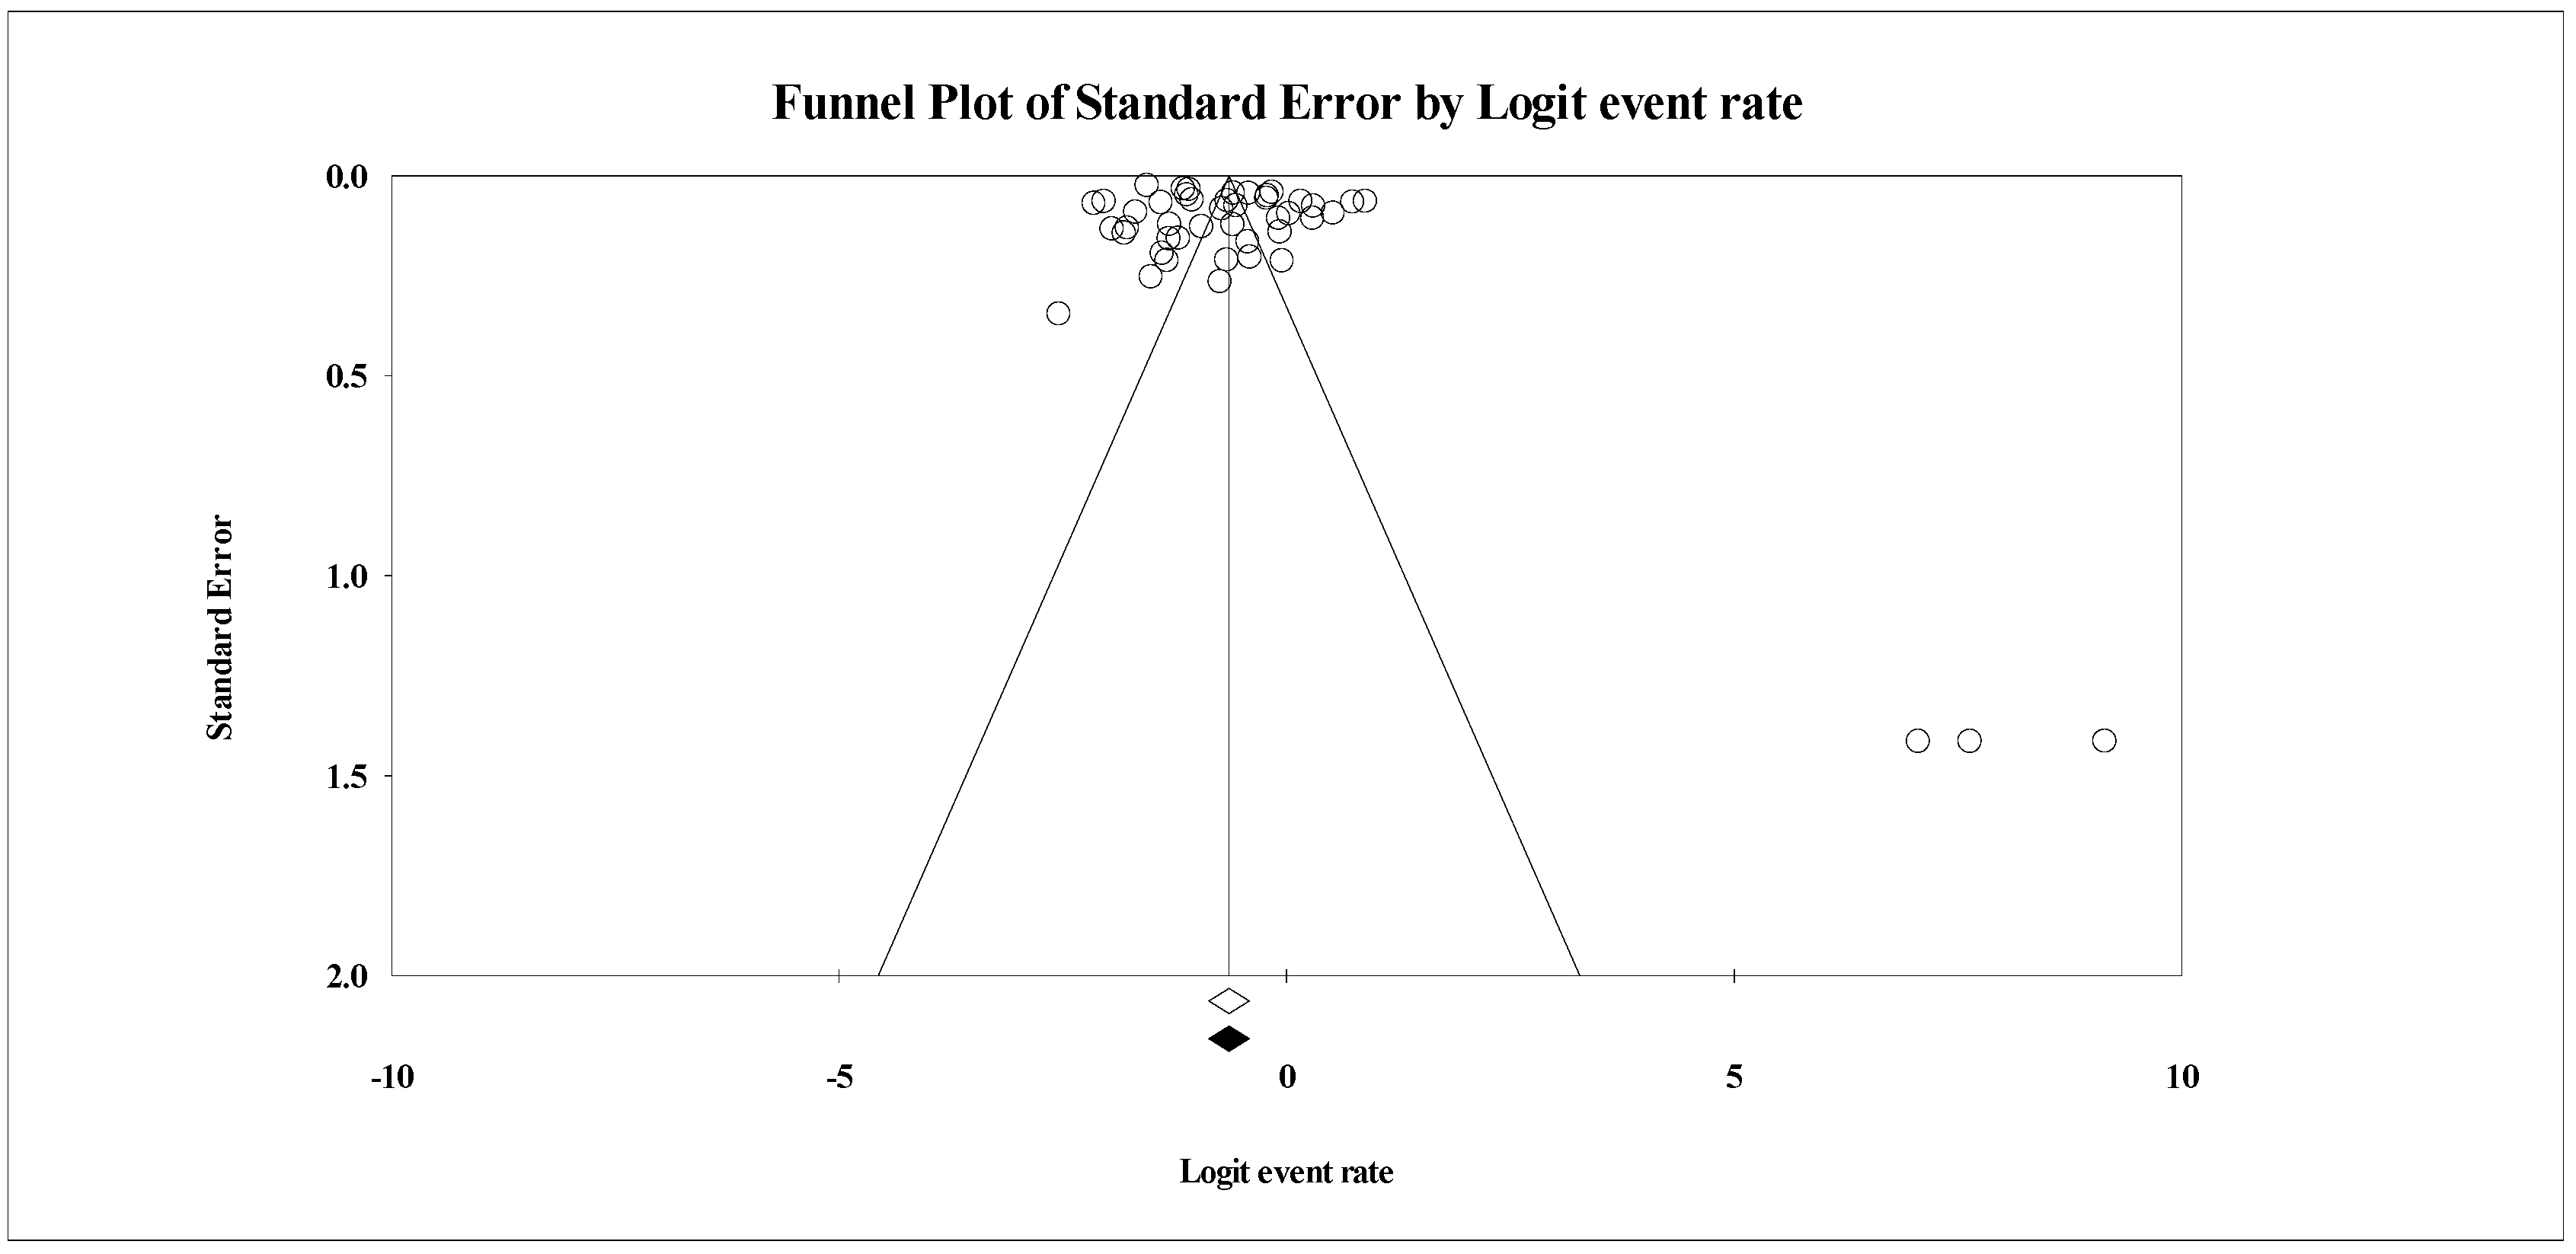
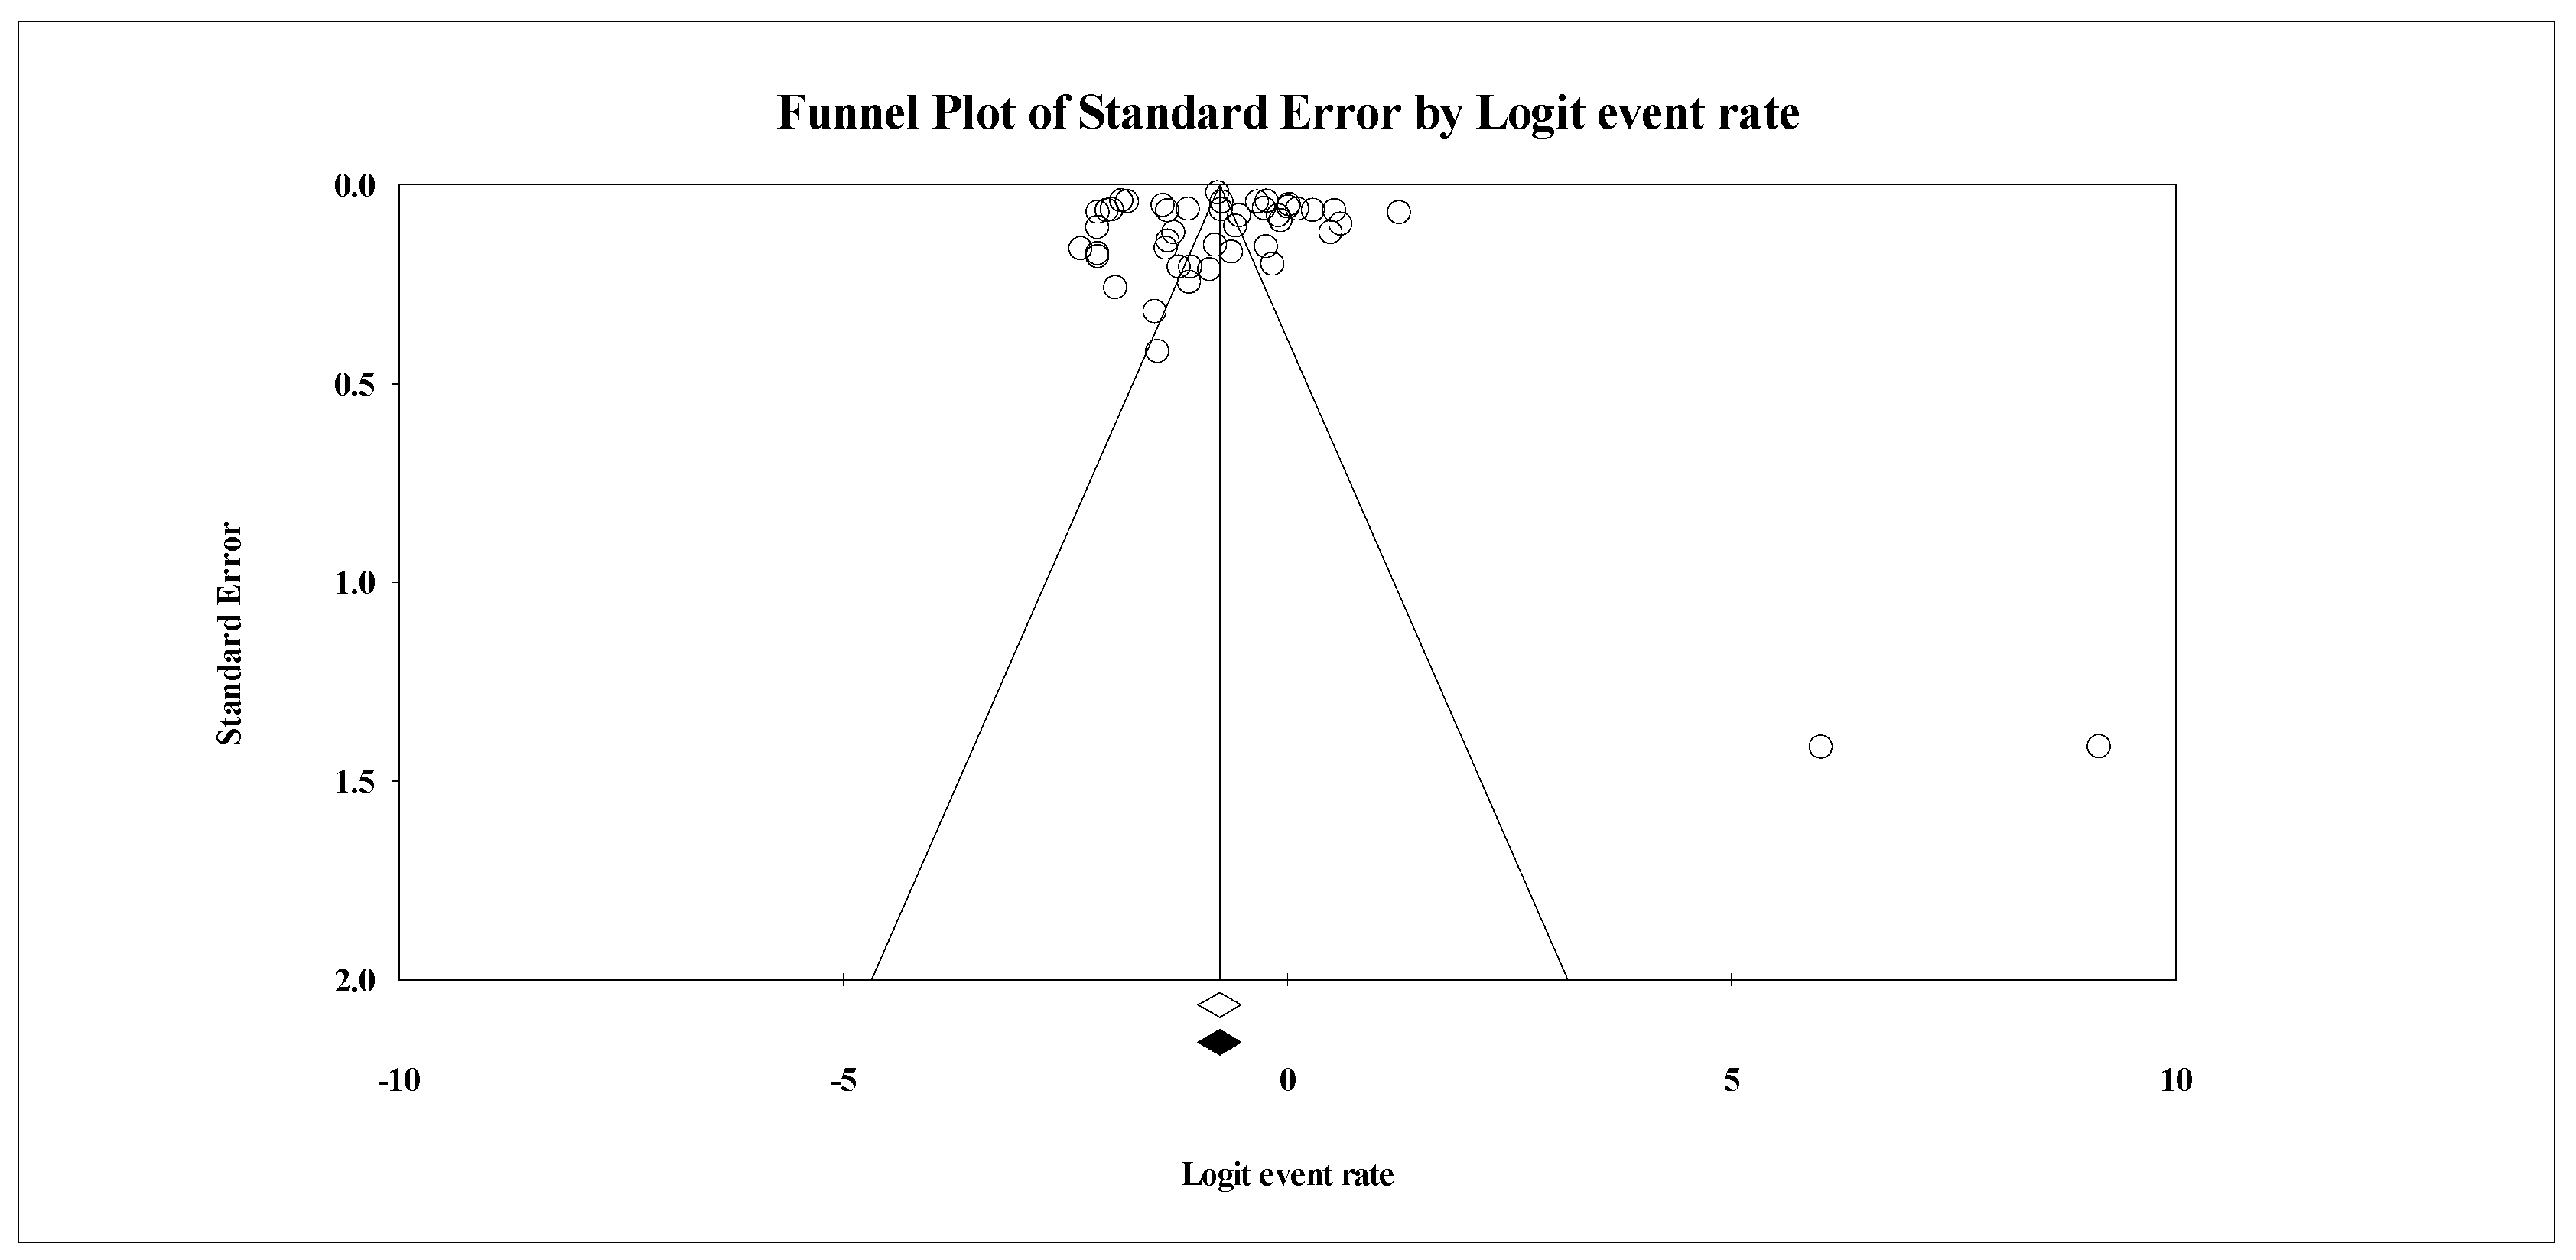
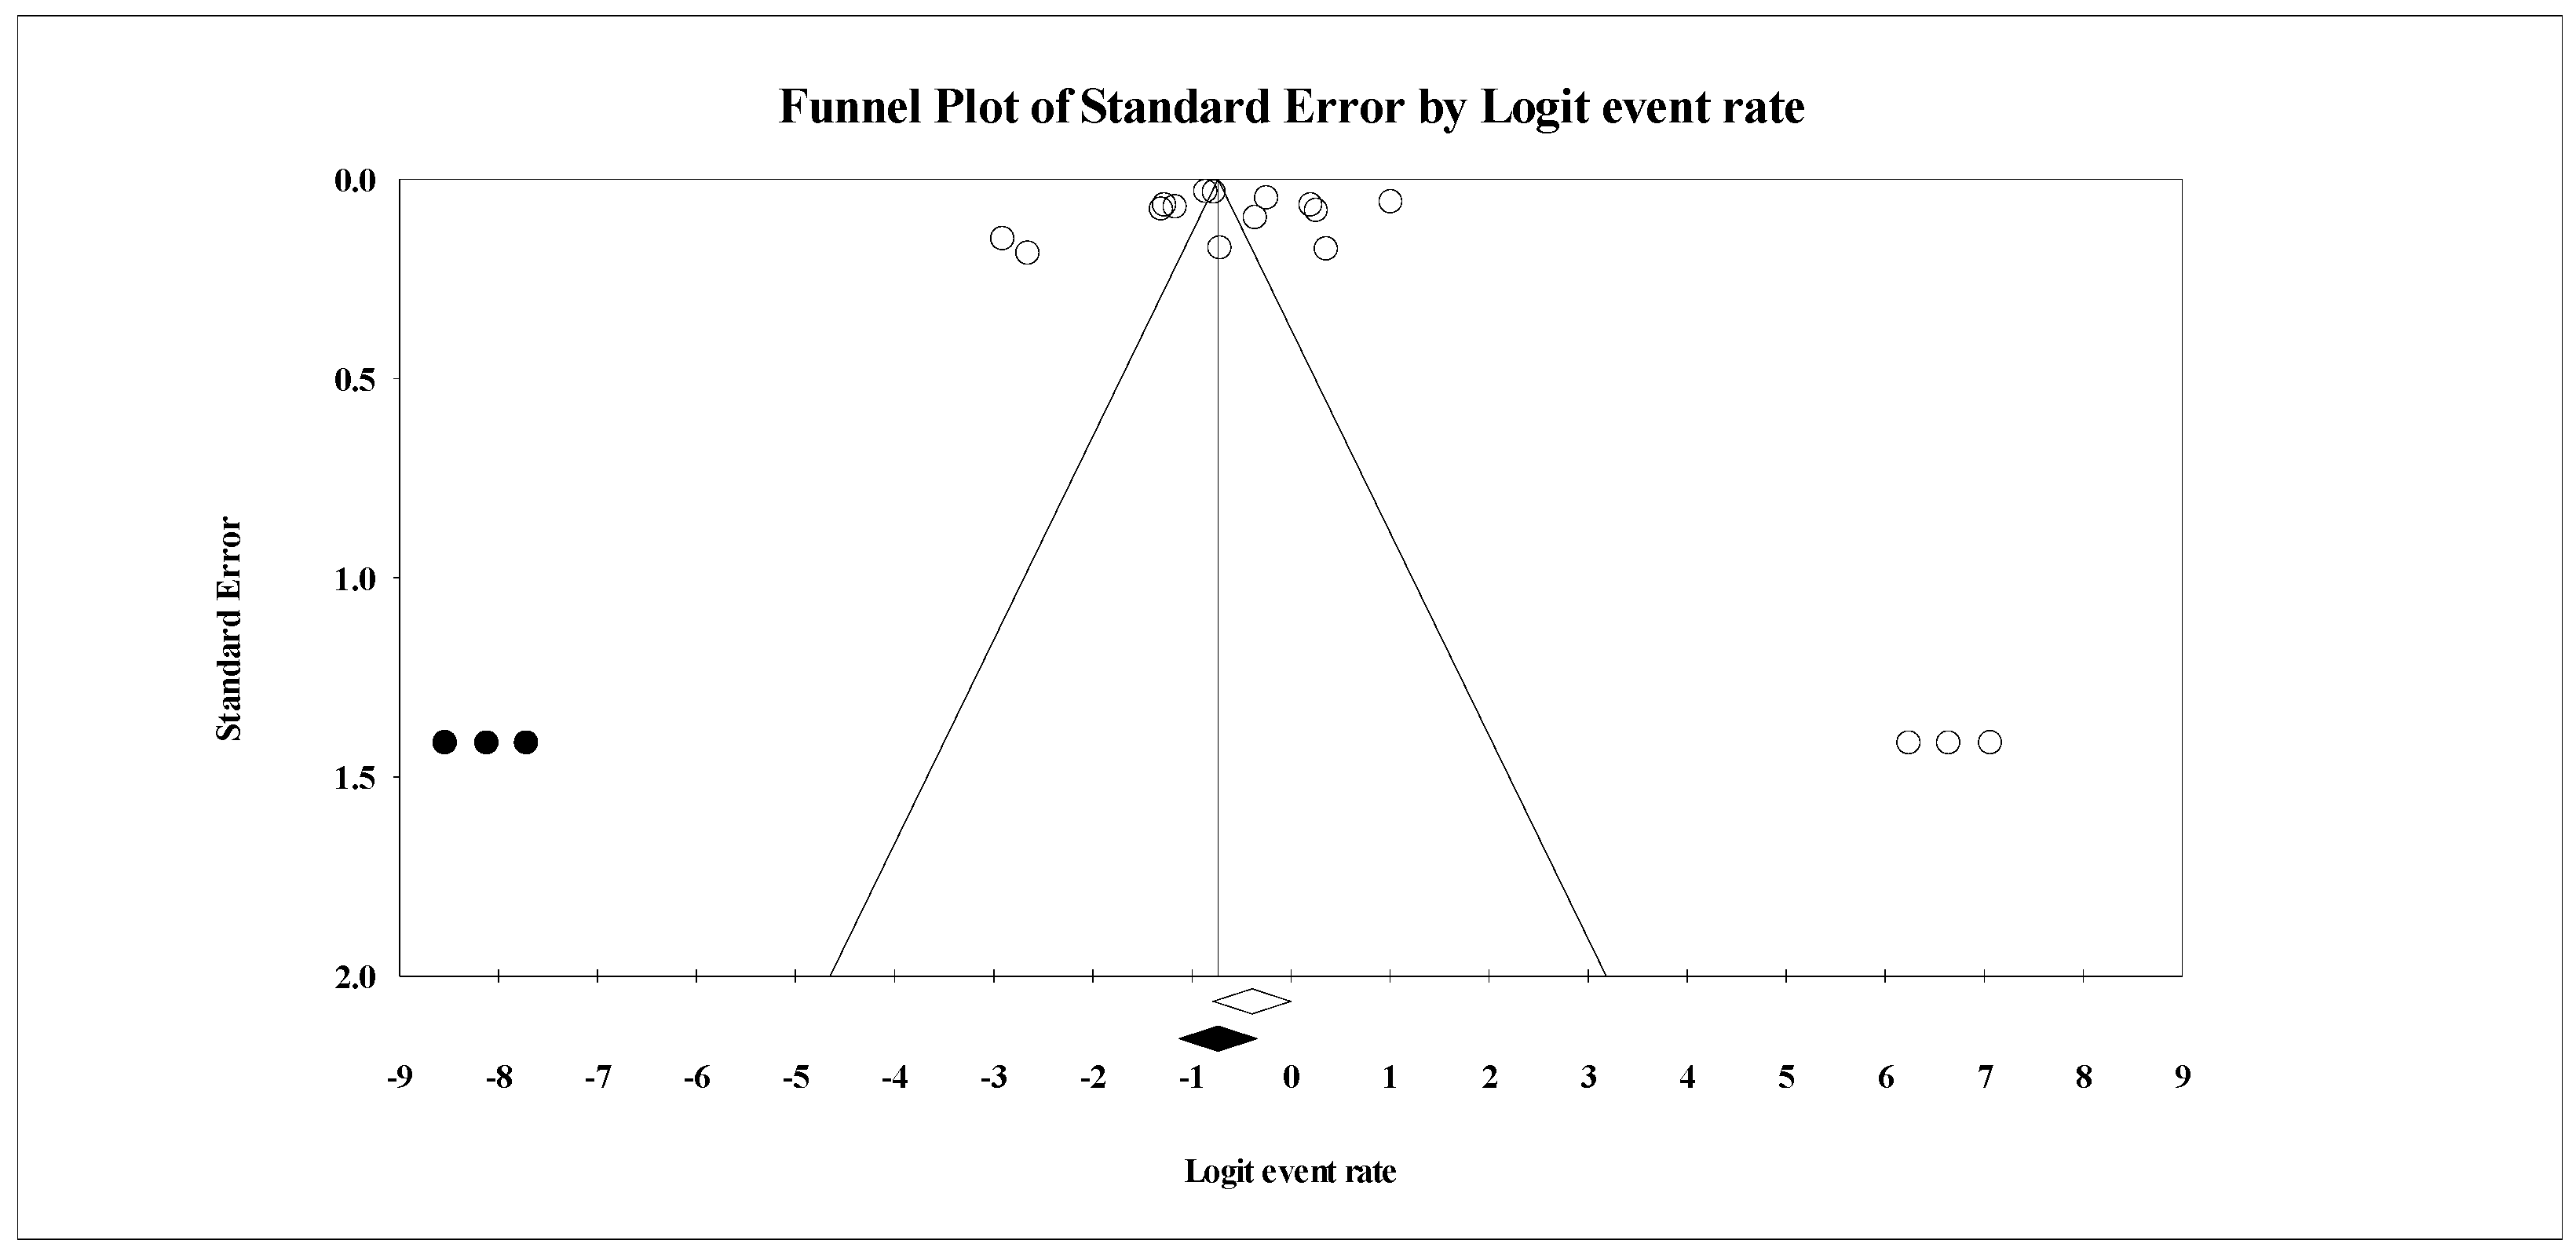
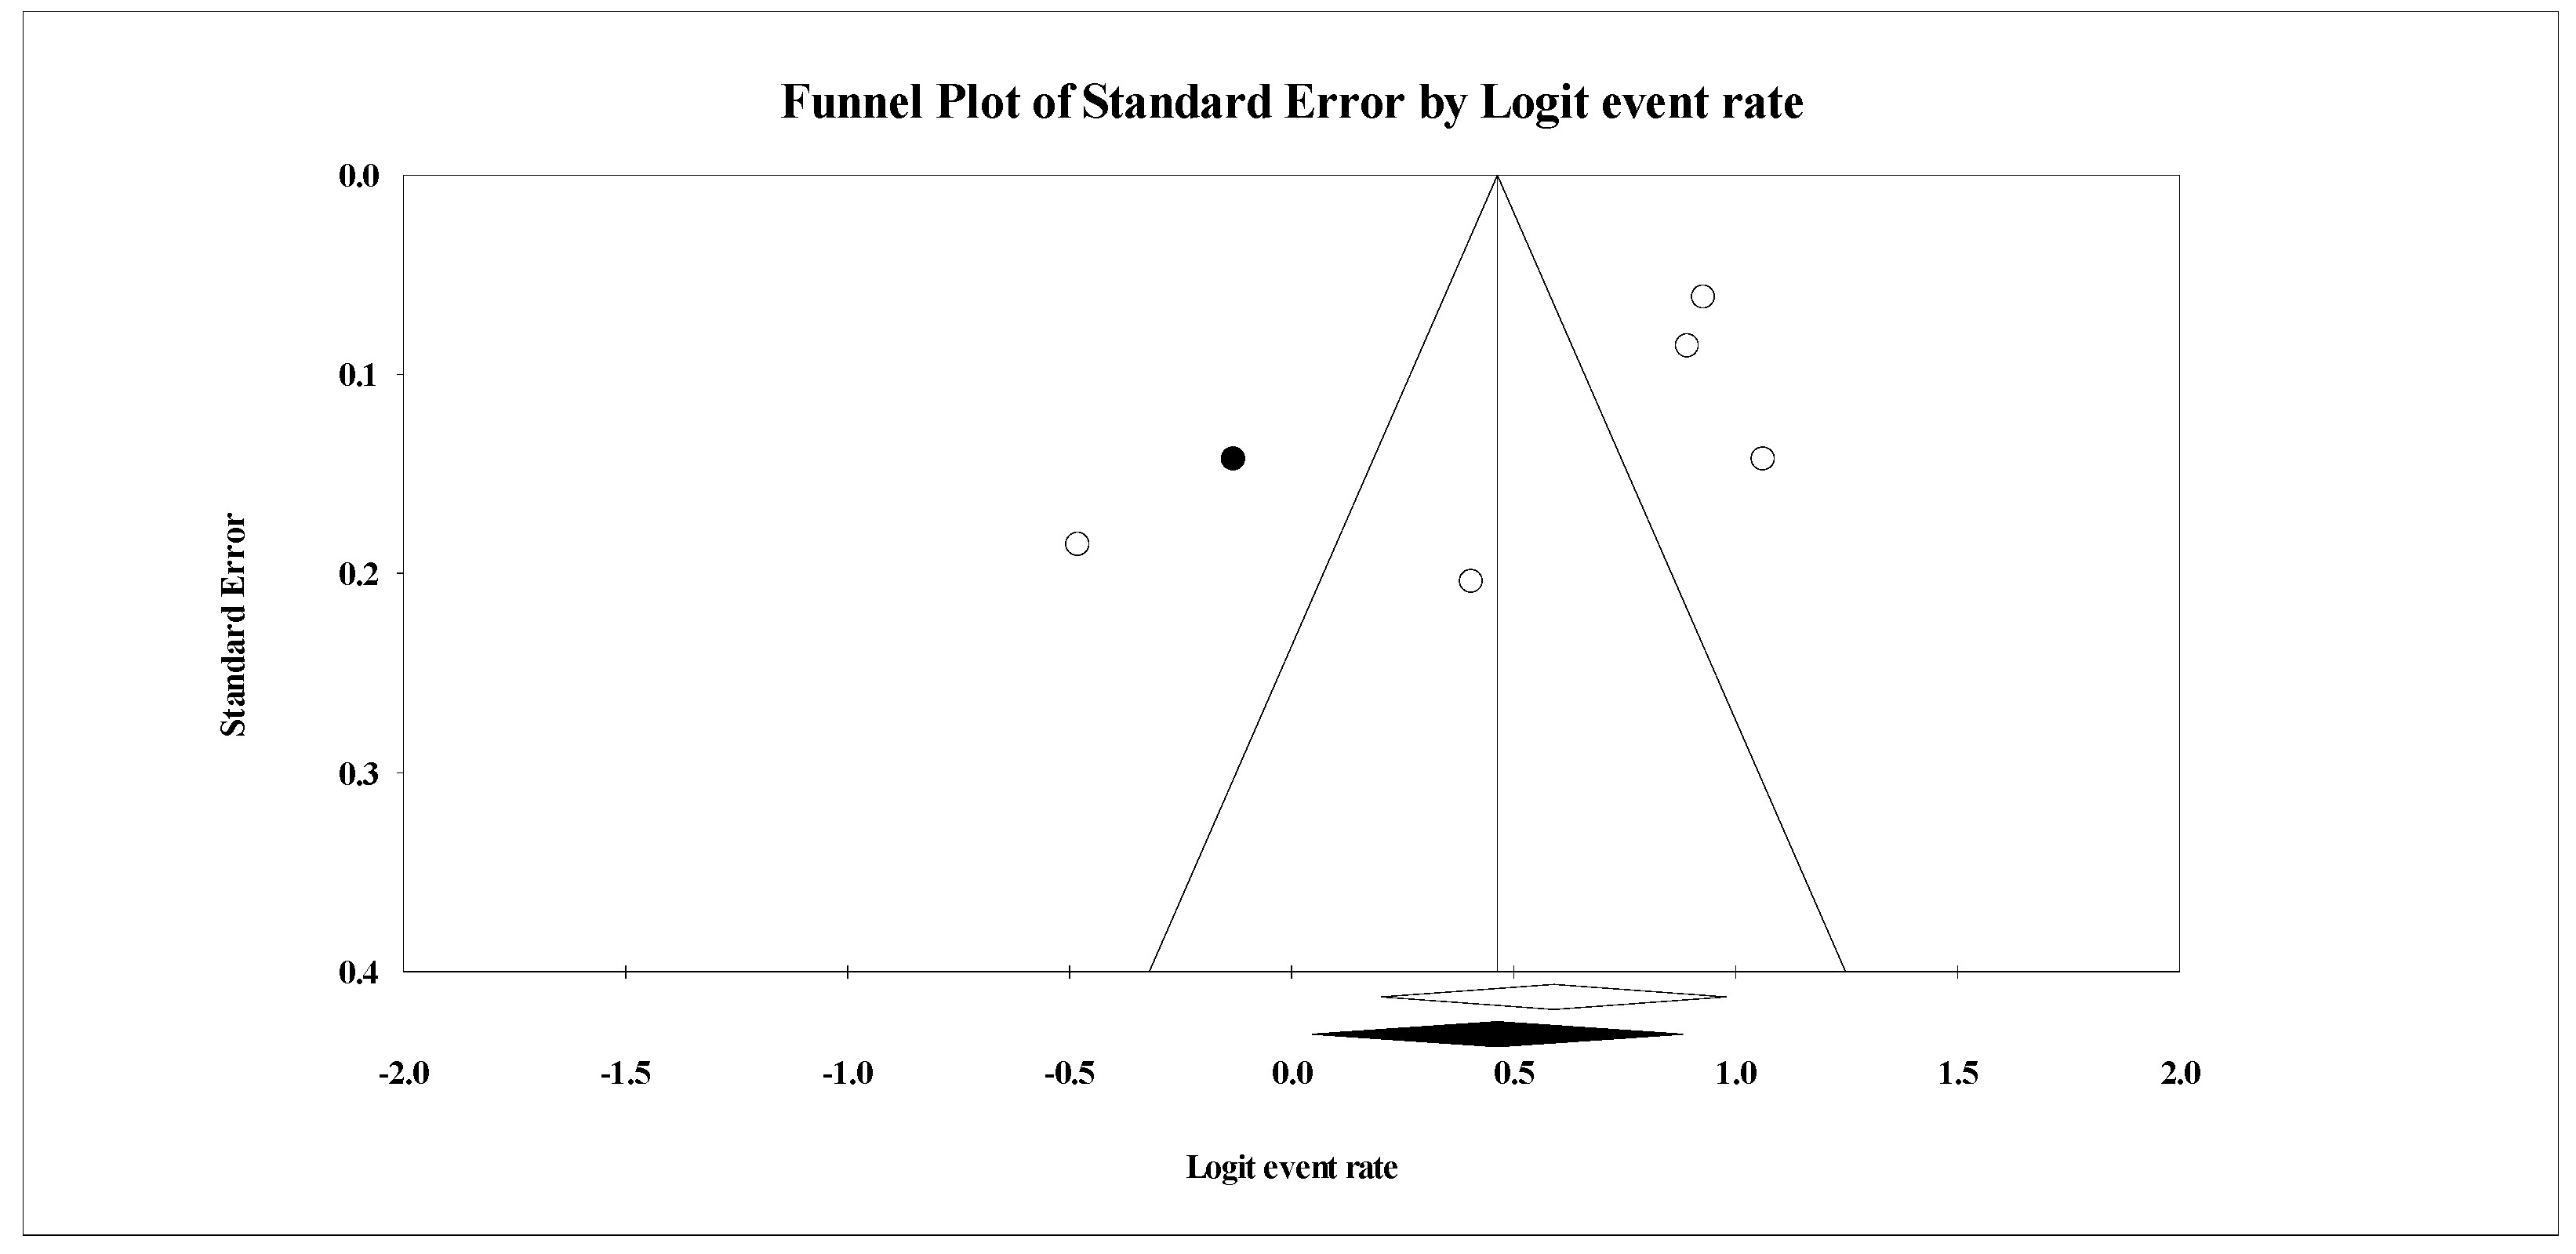
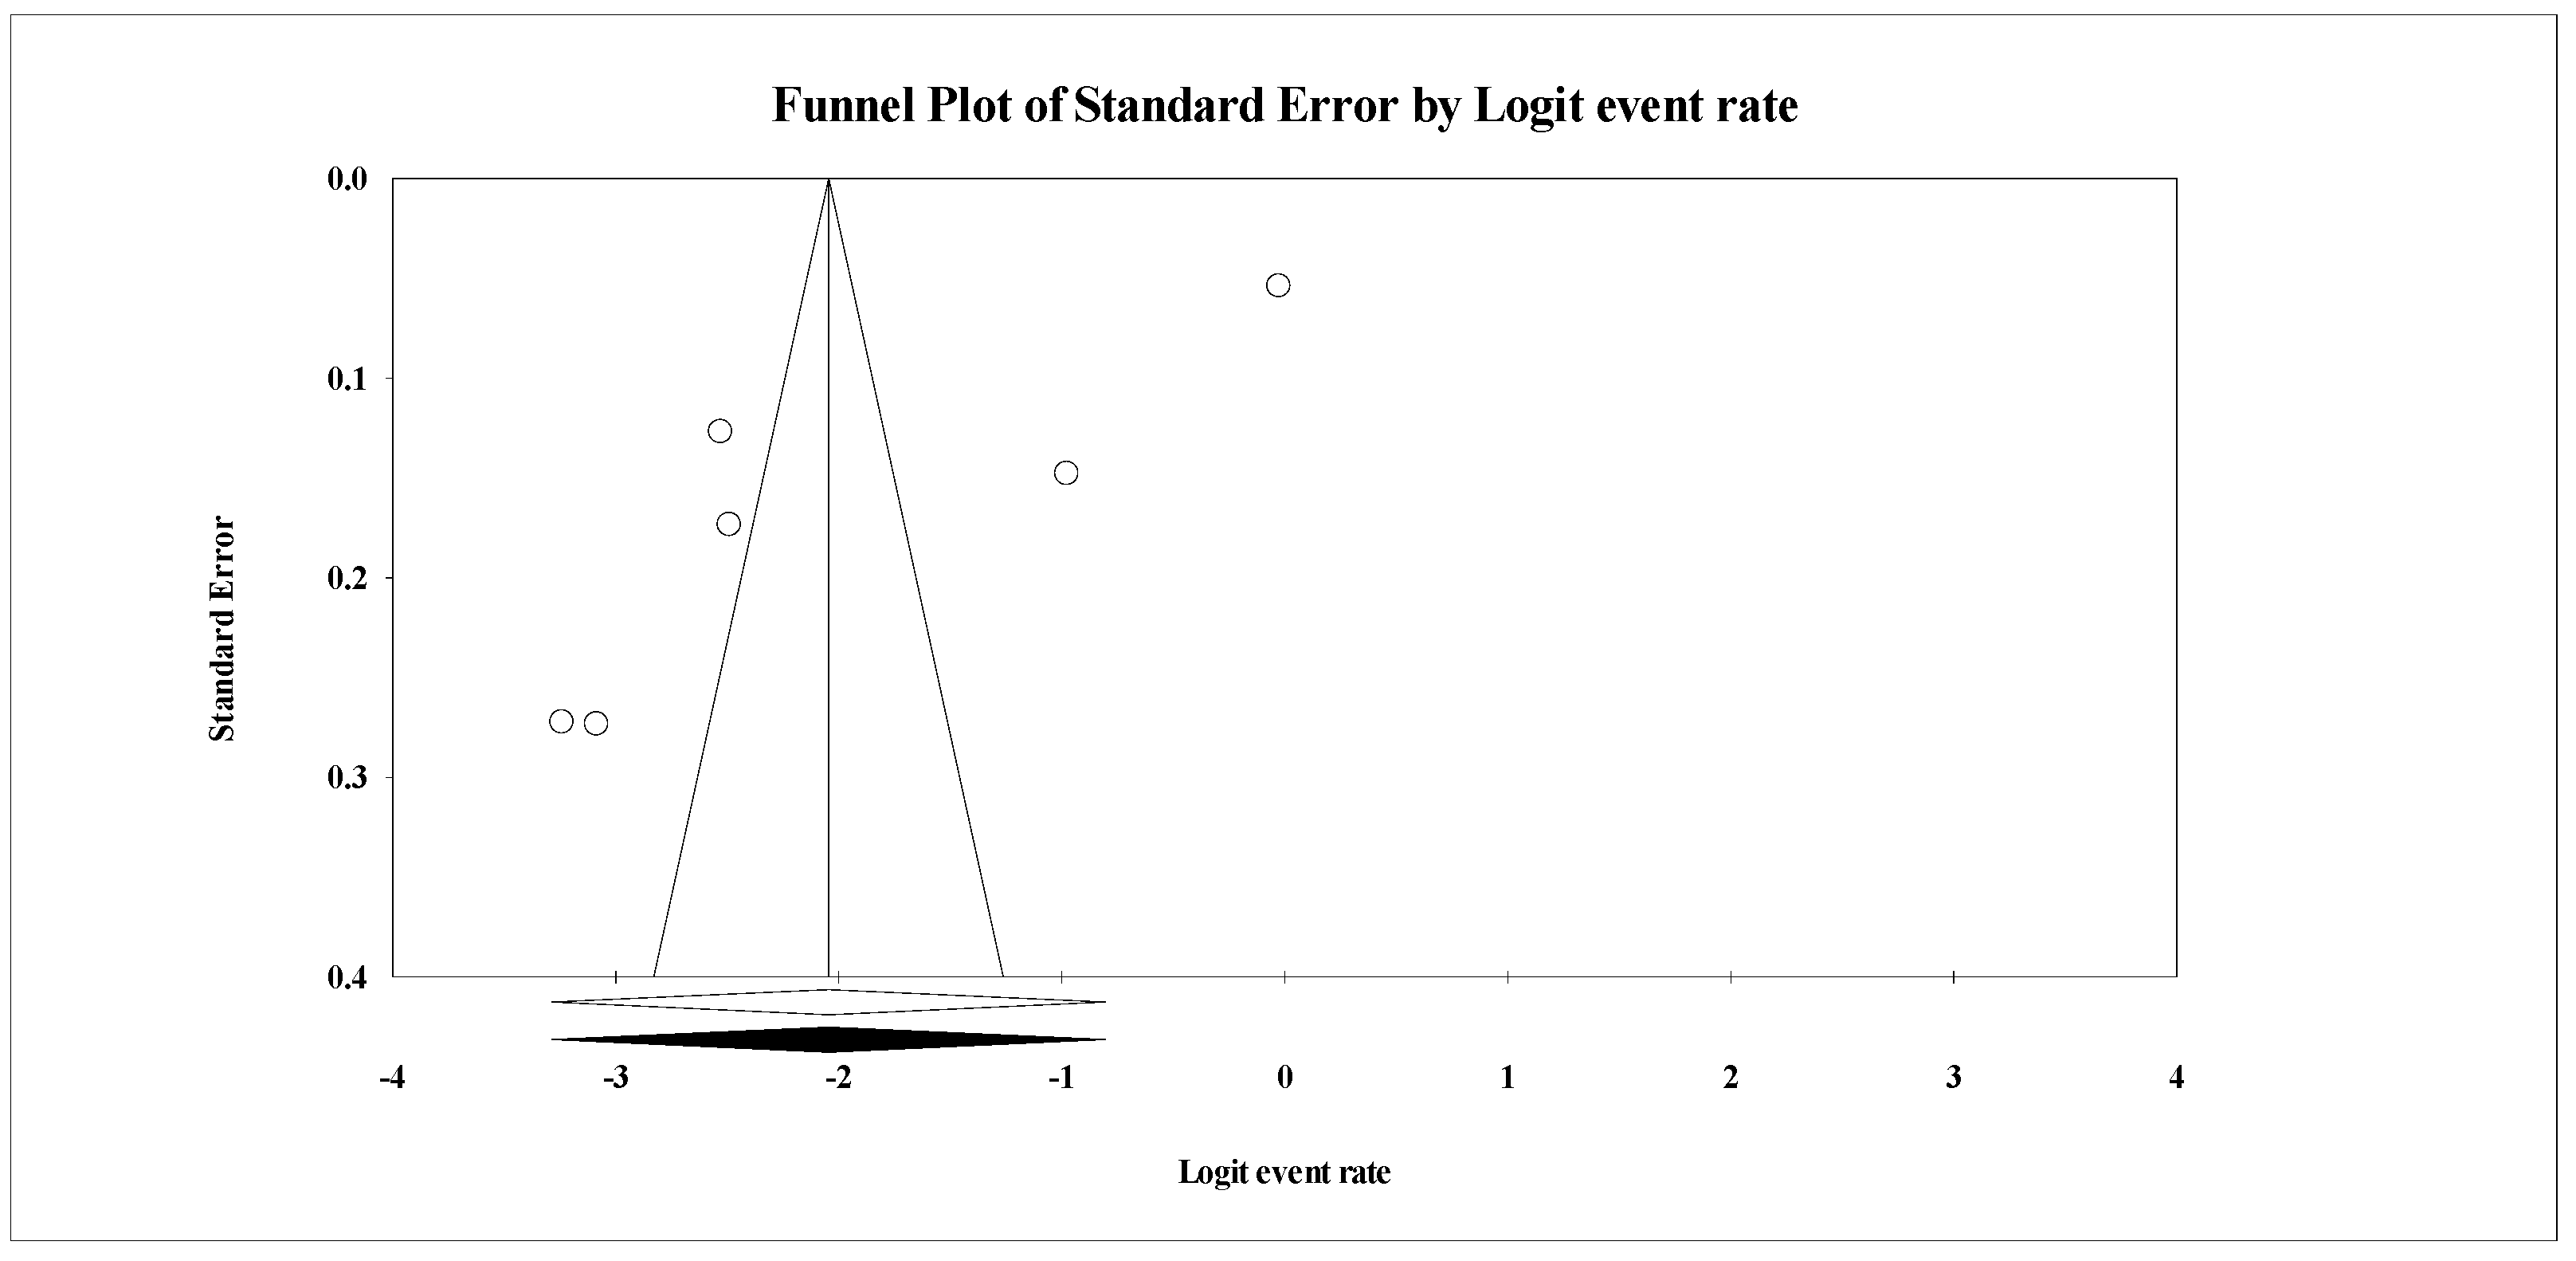
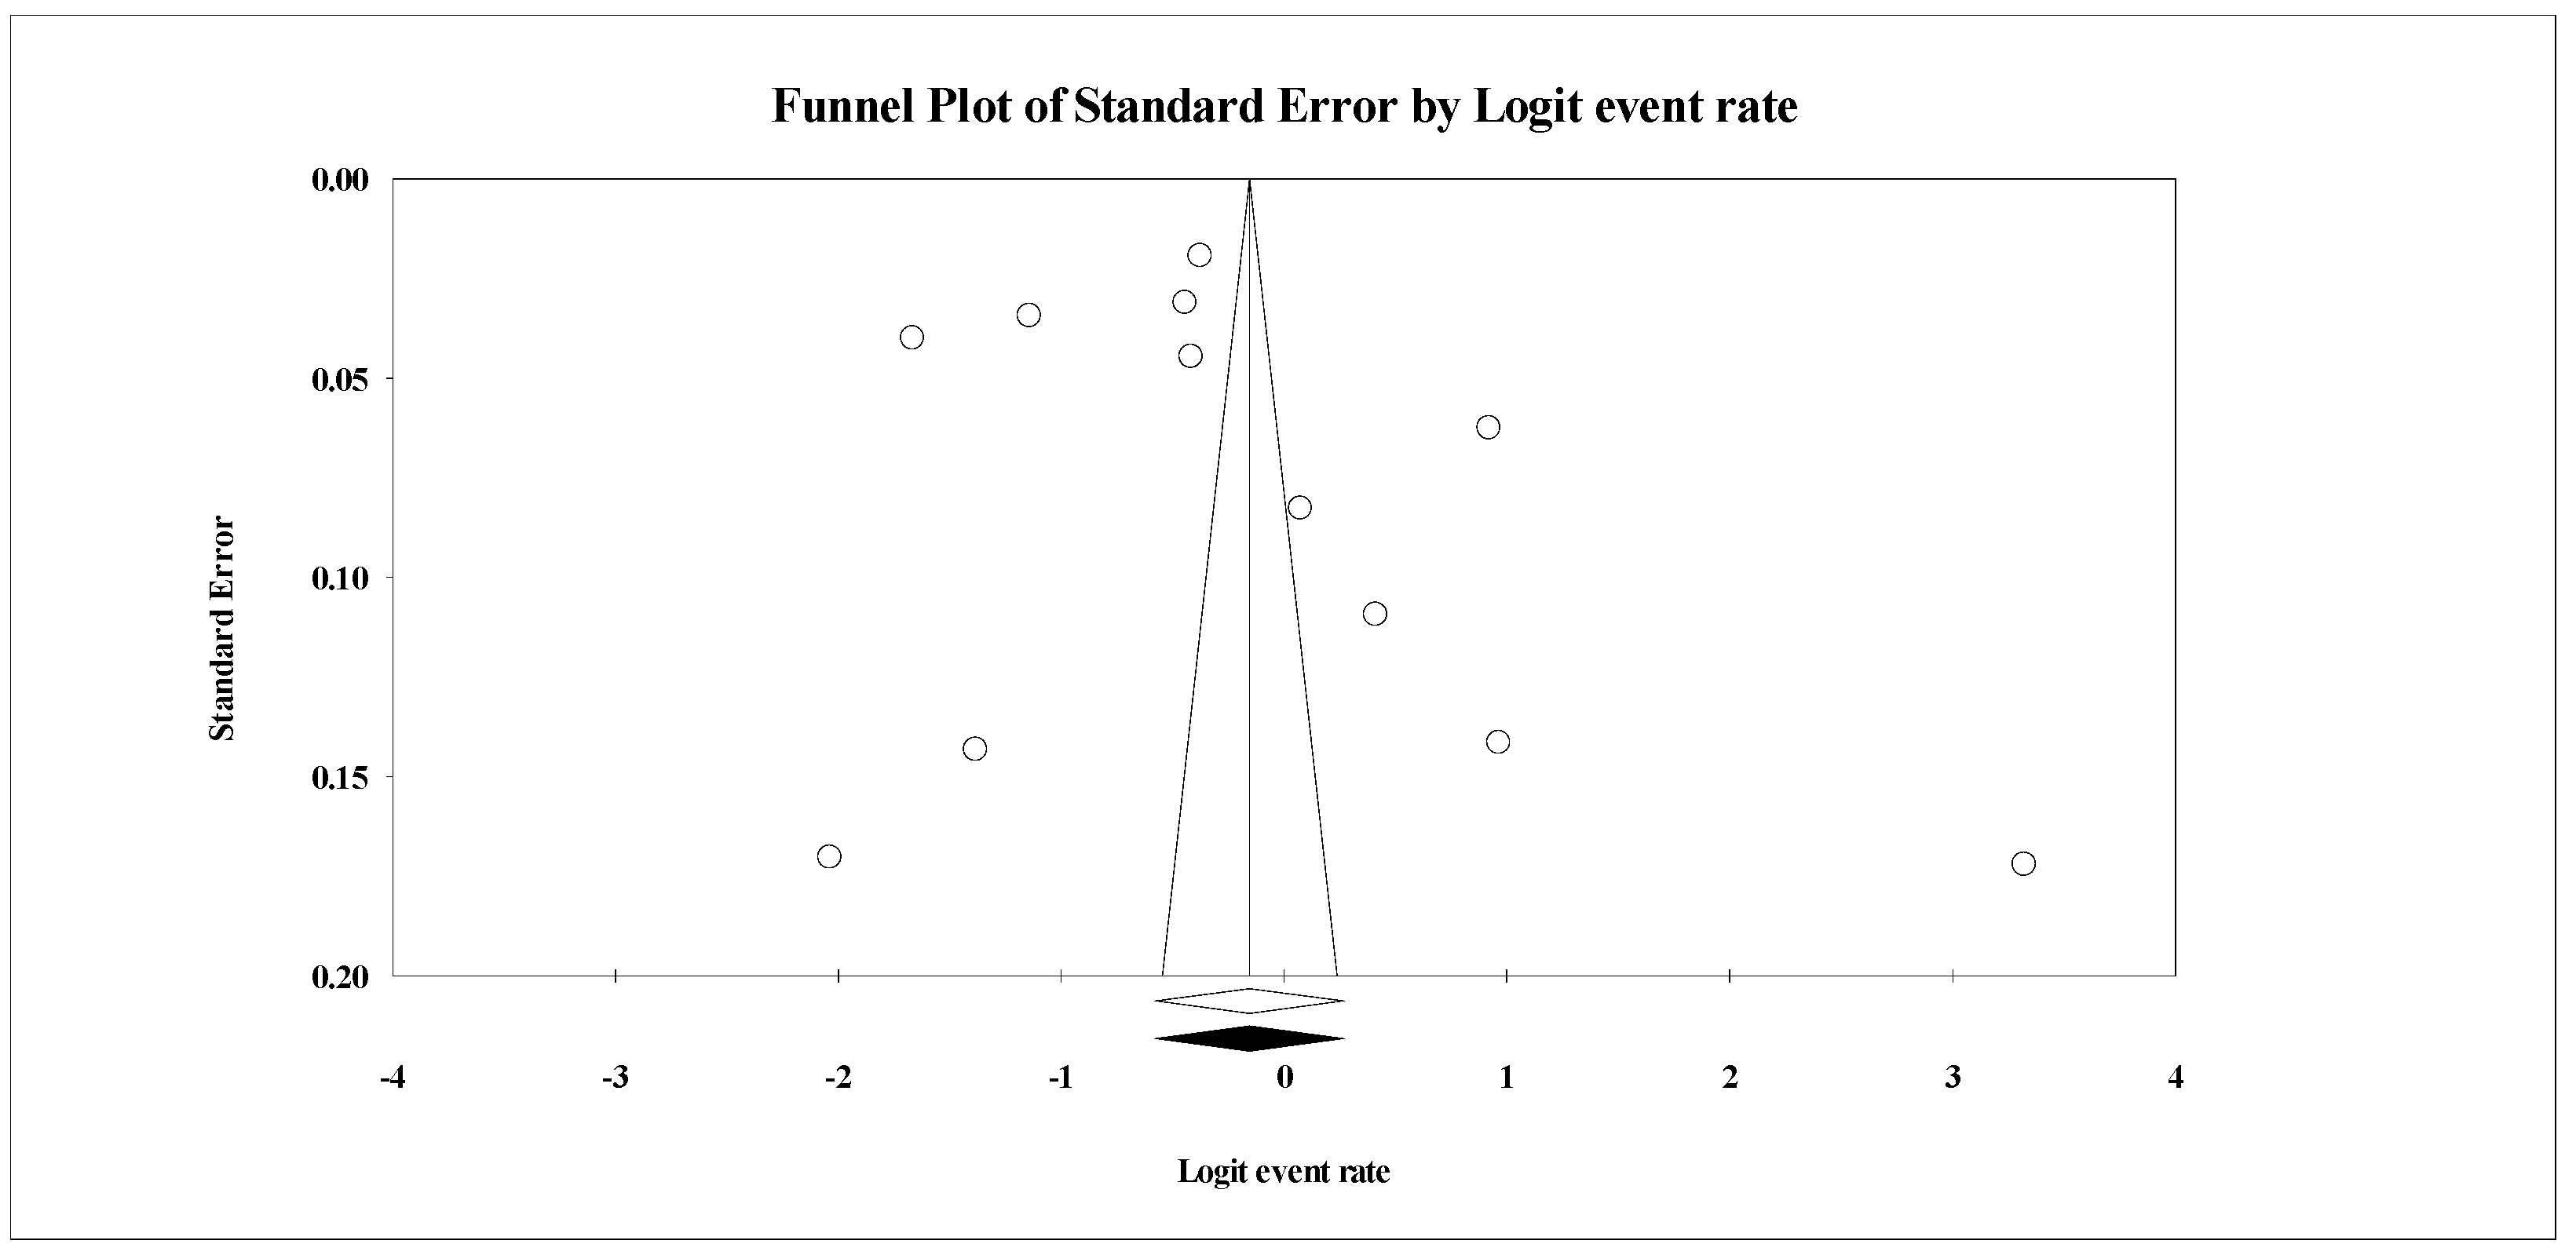
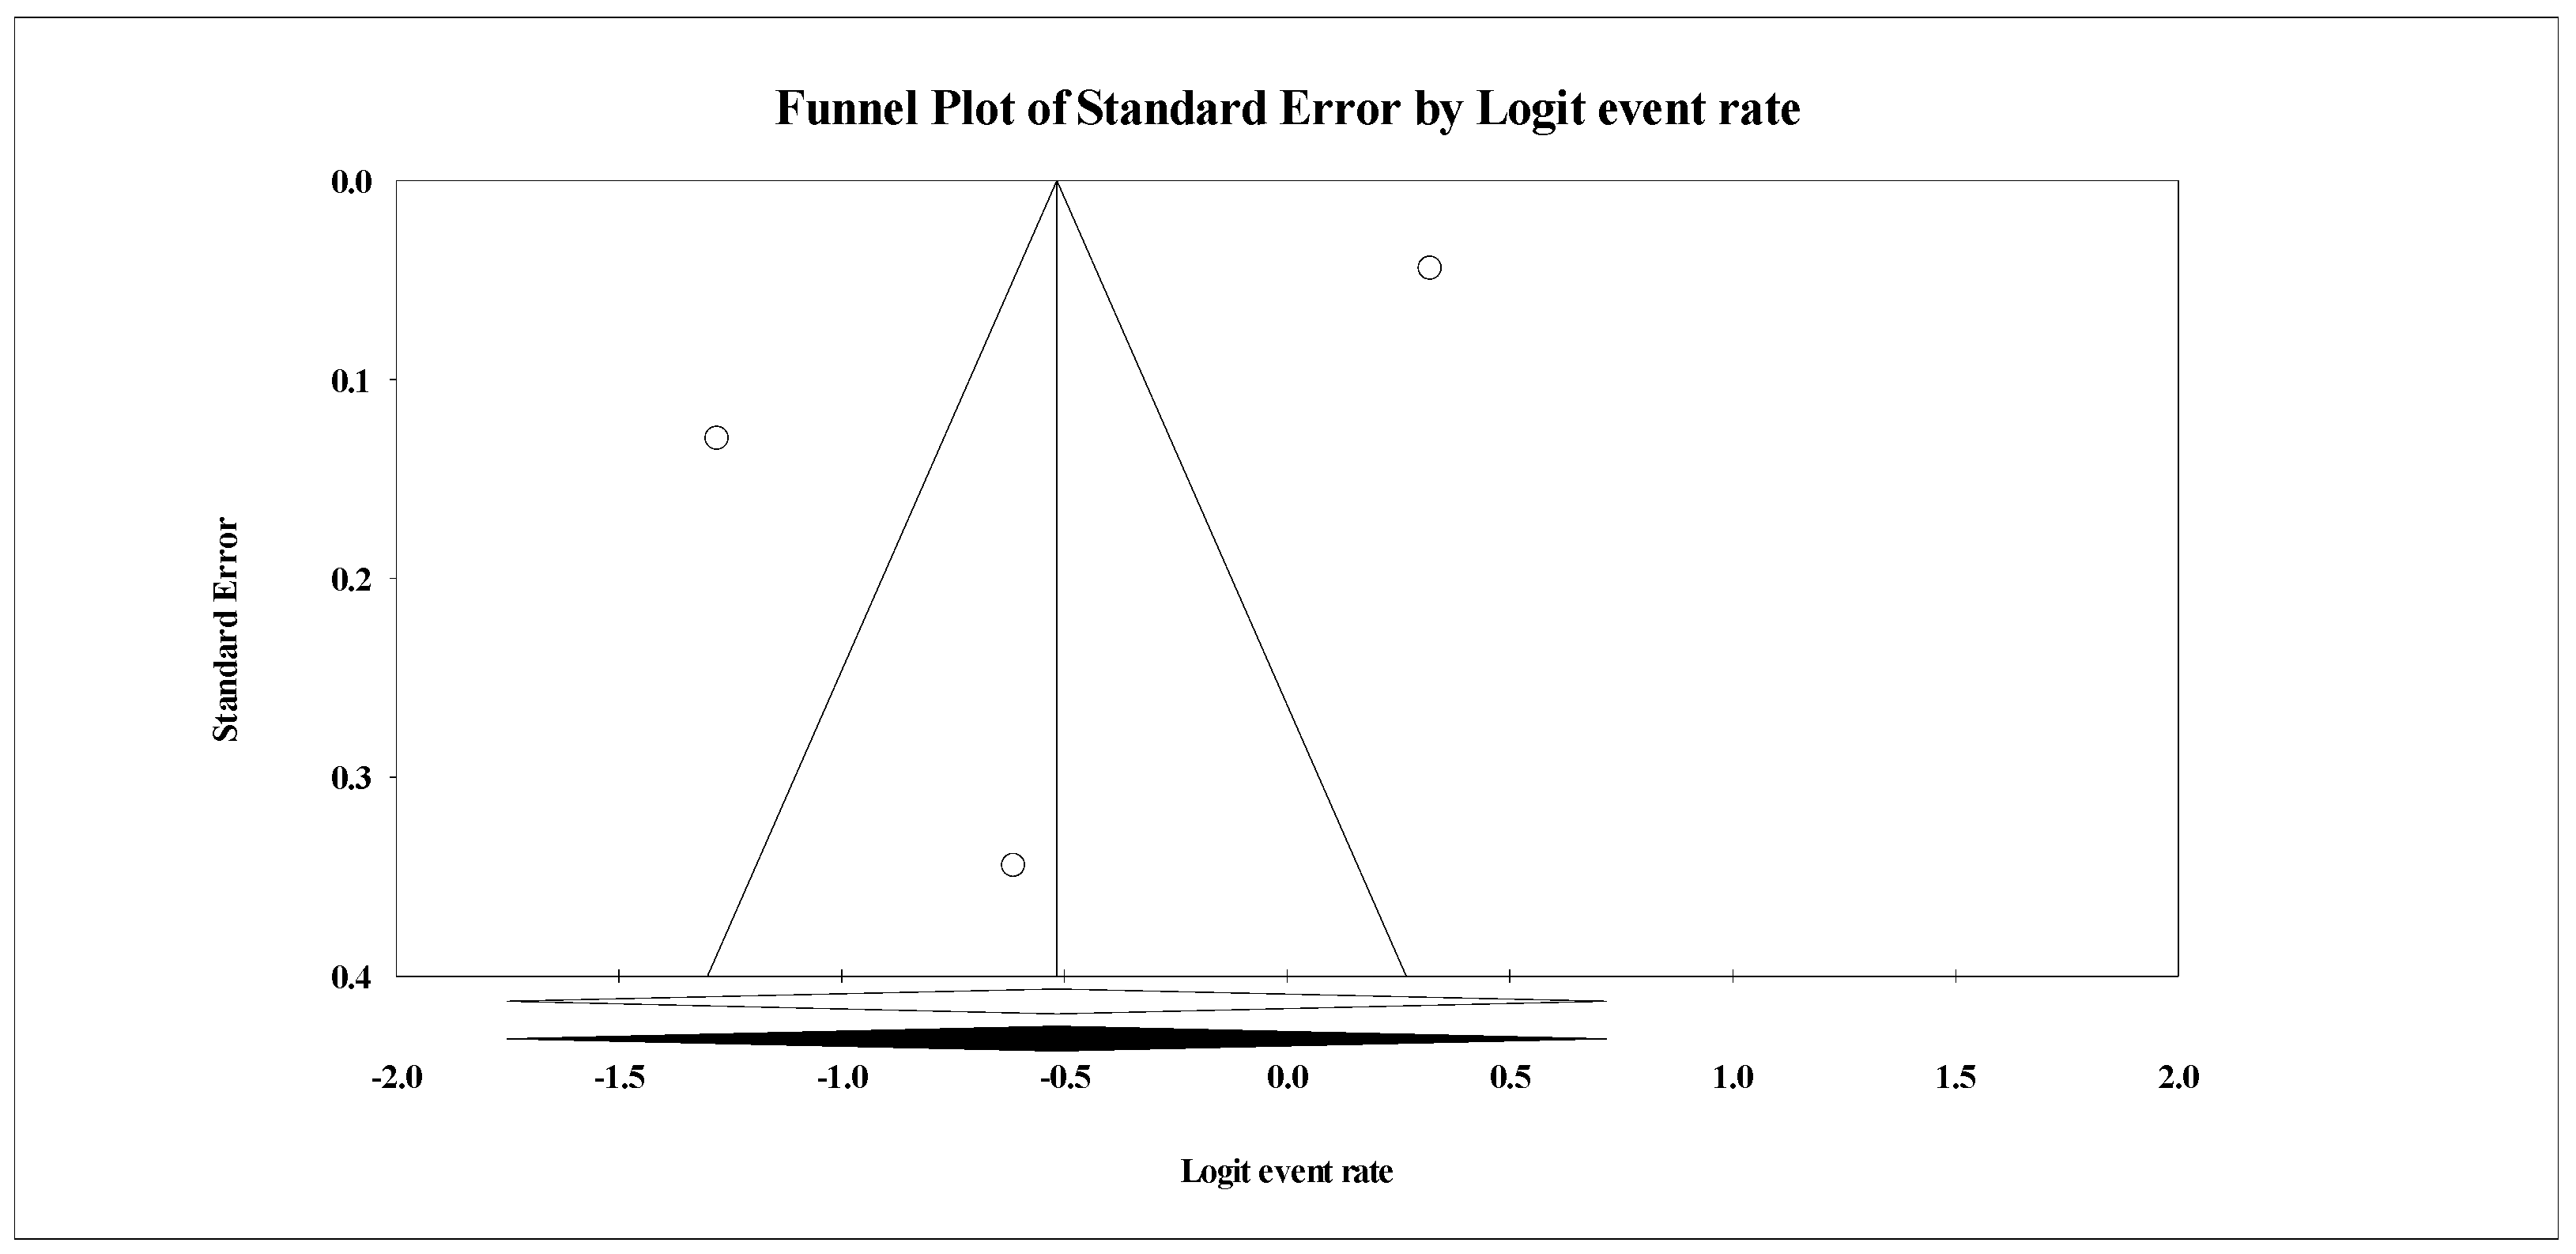
3.4.6. Publication Bias
4. Discussion
4.1. Quality of Evidence
4.2. Study Limitations
4.3. Research and Clinical Implications
5. Conclusions
Author Contributions
Funding
Conflicts of Interest
Appendix A

| Database: Ovid MEDLINE(R) and Epub Ahead of Print, In-Process and Other Non-Indexed Citations and Daily <1946 to 27 July 2020> Search Strategy: -------------------------------------------------------------------------------------------------------------------
|
Appendix B
| Author/Year | Q1 | Q2 | Q3 | Q4 | Q5 | Q6 | Q7 | Q8 | Q9 | Q10 | Q11 | Q12 | Q13 | Q14 | Final Quality Score | Rating |
|---|---|---|---|---|---|---|---|---|---|---|---|---|---|---|---|---|
| Aksoy and Kocak et al., 2020 [81] | Y | Y | NR | N | N | Y | N | N | Y | NA | Y | NA | NA | N | 5 | Medium |
| Alshekaili et al., 2020 [44] | Y | Y | Y | Y | N | Y | Y | Y | Y | NA | Y | NA | NA | Y | 8 | Good |
| Amerio et al., 2020 [45] | Y | Y | N | N | N | Y | Y | Y | Y | NA | N | NA | NA | N | 6 | Medium |
| Amin et al., 2020 [37] | Y | Y | Y | N | N | Y | N | N | Y | NA | Y | NA | NA | N | 5 | Medium |
| An et al., 2020 [46] | Y | Y | NR | Y | Y | Y | Y | Y | Y | NA | Y | NA | NA | N | 9 | Good |
| Cai et al., 2020 [79] | Y | Y | NR | Y | Y | Y | Y | Y | Y | NA | Y | NA | NA | N | 9 | Good |
| Caliskan et al., 2020 [47] | Y | Y | NR | N | N | Y | Y | N | Y | NA | Y | NA | NA | N | 6 | Medium |
| Cao et al., 2020 [33] | Y | Y | Y | N | N | Y | N | N | Y | NA | Y | NA | NA | N | 6 | Medium |
| Chatterjee et al., 2020 [48] | Y | Y | NR | N | N | Y | N | Y | Y | NA | Y | NA | NA | N | 6 | Medium |
| Chen et al., 2020 [30] | Y | Y | Y | N | N | Y | N | N | NR | NA | Y | NA | NA | N | 5 | Medium |
| Chew et al., 2020 [34] | Y | Y | Y | N | Y | Y | Y | N | Y | NA | Y | NA | NA | N | 8 | Good |
| Chung and Yeung et al., 2020 [78] | Y | Y | NR | N | N | Y | N | N | Y | NA | Y | NA | NA | N | 5 | Medium |
| Civantos et al., 2020 [49] | Y | Y | N | N | N | Y | Y | N | Y | NA | Y | NA | NA | N | 6 | Medium |
| Consolo et al., 2020 [35] | Y | Y | N | N | N | Y | Y | N | Y | NA | Y | NA | NA | N | 6 | Medium |
| Corbett et al., 2020 [50] | Y | Y | N | N | N | Y | Y | N | Y | NA | Y | NA | NA | N | 6 | Medium |
| Dai et al., 2020 [51] | Y | Y | Y | N | N | Y | Y | N | Y | NA | N | NA | NA | N | 6 | Medium |
| Dal’Bosco et al., 2020 [52] | Y | Y | N | N | N | Y | Y | N | Y | NA | Y | NA | NA | N | 6 | Medium |
| Dong et al., 2020 [53] | Y | Y | NR | Y | Y | Y | Y | N | Y | NA | Y | NA | NA | N | 8 | Good |
| Du et al., 2020 [20] | Y | Y | NR | N | N | Y | Y | N | Y | NA | Y | NA | NA | N | 6 | Medium |
| Elbay et al., 2020 [54] | Y | Y | NR | Y | Y | Y | Y | N | Y | NA | Y | NA | NA | N | 8 | Good |
| Guiroy et al., 2020 [36] | Y | Y | N | N | N | Y | Y | N | Y | NA | Y | NA | NA | N | 6 | Medium |
| Guo et al., 2020 [23] | Y | Y | NR | N | N | Y | Y | N | Y | NA | Y | NA | NA | N | 6 | Medium |
| Hassannia et al., 2020 [55] | Y | Y | Y | N | N | Y | Y | N | Y | NA | N | NA | NA | N | 6 | Medium |
| Hawari et al., 2020 [56] | Y | Y | NR | N | N | Y | Y | N | Y | NA | Y | NA | NA | N | 6 | Medium |
| Hu et al., 2020 [57] | Y | Y | Y | Y | Y | Y | Y | N | Y | NA | Y | NA | NA | N | 9 | Good |
| Huang and Zhao et al., 2020 [25] | Y | Y | Y | Y | Y | Y | Y | N | Y | NA | Y | NA | NA | N | 9 | Good |
| Huang et al., 2020 [24] | Y | Y | Y | Y | Y | Y | Y | N | Y | NA | Y | NA | NA | N | 9 | Good |
| Jahrami et al., 2020 [58] | Y | Y | Y | N | N | Y | N | N | Y | NA | Y | NA | NA | N | 6 | Medium |
| Kang et al., 2020 [39] | Y | Y | NR | Y | Y | Y | Y | Y | Y | NA | Y | NA | NA | N | 9 | Good |
| Kaveh et al., 2020 [43] | Y | Y | NR | N | N | Y | Y | N | Y | NA | Y | NA | NA | N | 6 | Medium |
| Khanna et al., 2020 [59] | Y | Y | NR | Y | Y | Y | Y | N | Y | NA | Y | NA | NA | N | 8 | Good |
| Koksal et al., 2020 [80] | Y | Y | NR | Y | Y | Y | Y | N | Y | NA | Y | NA | NA | N | 8 | Good |
| Lai et al., 2020 [16] | Y | Y | Y | Y | Y | Y | Y | N | Y | NA | Y | NA | NA | N | 9 | Good |
| Li et al., 2020 [31] | Y | Y | Y | Y | N | Y | Y | N | Y | NA | Y | NA | NA | N | 8 | Good |
| Liu et al., 2020 [27] | Y | Y | NR | N | N | Y | Y | N | Y | NA | Y | NA | NA | N | 6 | Medium |
| Liu et al., 2020 [28] | Y | Y | Y | Y | Y | Y | Y | N | Y | NA | Y | NA | NA | N | 9 | Good |
| Lu et al., 2020 [19] | Y | Y | Y | Y | Y | Y | Y | N | Y | NA | Y | NA | NA | N | 9 | Good |
| Nair et al., 2020 [60] | Y | Y | NR | Y | N | Y | Y | N | Y | NA | Y | NA | NA | N | 7 | Good |
| Naser et al., 2020 [61] | Y | Y | NR | Y | N | Y | Y | Y | Y | NA | Y | NA | NA | N | 8 | Good |
| Podder et al., 2020 [62] | Y | Y | NR | N | N | Y | Y | N | Y | NA | Y | NA | NA | N | 6 | Medium |
| Qi et al., 2020 [26] | Y | Y | Y | Y | Y | Y | N | N | Y | NA | Y | NA | NA | N | 8 | Good |
| Que et al., 2020 [63] | Y | Y | NR | Y | Y | Y | Y | Y | Y | NA | Y | NA | NA | N | 9 | Good |
| Rossi et al., 2020 [64] | Y | Y | NR | Y | N | Y | Y | Y | Y | NA | Y | NA | NA | Y | 9 | Good |
| Salman et al., 2020 [65] | Y | Y | NR | N | N | Y | Y | N | Y | NA | Y | NA | NA | N | 6 | Medium |
| Shacham et al., 2020 [38] | Y | Y | NR | N | N | Y | Y | N | Y | NA | Y | NA | NA | N | 6 | Medium |
| Shechter et al., 2020 [66] | Y | Y | Y | Y | Y | Y | Y | N | Y | NA | Y | NA | NA | N | 9 | Good |
| Stojanov et al., 2020 [67] | Y | Y | NR | N | N | Y | Y | N | Y | NA | Y | NA | NA | N | 6 | Medium |
| Sun et al., 2020 [77] | Y | Y | NR | N | N | Y | Y | N | Y | NA | Y | NA | NA | N | 6 | Medium |
| Tan et al., 2020 [21] | Y | Y | Y | N | N | Y | Y | N | Y | NA | Y | NA | NA | N | 6 | Medium |
| Temsah et al., 2020 [6] | Y | Y | Y | N | N | Y | Y | N | N | NA | Y | NA | NA | N | 6 | Medium |
| Teng et al., 2020 [68] | Y | Y | N | Y | Y | Y | N | Y | Y | NA | Y | NA | NA | Y | 9 | Good |
| Thapa et al., 2020 [69] | Y | Y | NR | N | N | Y | N | N | Y | NA | Y | NA | NA | N | 5 | Medium |
| Tu et al., 2020 [70] | Y | Y | Y | N | N | Y | Y | N | N | NA | Y | NA | NA | N | 6 | Medium |
| Wang et al., 2020 [32] | Y | Y | Y | Y | N | Y | Y | N | Y | NA | Y | NA | NA | N | 8 | Good |
| Wang et al., 2020 [71] | Y | Y | Y | N | N | Y | Y | N | N | NA | Y | NA | NA | N | 6 | Medium |
| Weilenmann et al., 2020 [72] | Y | Y | NR | N | N | Y | Y | N | Y | NA | Y | NA | NA | N | 6 | Medium |
| Xiao et al., 2020 [73] | Y | Y | NR | N | N | Y | N | Y | Y | NA | Y | NA | NA | N | 6 | Medium |
| Yang et al., 2020 [74] | Y | Y | Y | N | N | Y | N | N | Y | NA | Y | NA | NA | N | 6 | Medium |
| Yin et al., 2020 [75] | Y | Y | Y | Y | Y | Y | Y | N | Y | NA | Y | NA | NA | N | 9 | Good |
| Zhan et al., 2020 [76] | Y | Y | Y | N | N | Y | Y | N | N | NA | Y | NA | NA | N | 6 | Medium |
| Zhang et al., 2020 [17] | Y | Y | NR | Y | Y | Y | Y | Y | Y | NA | Y | NA | NA | N | 9 | Good |
| Zhang et al., 2020 [18] | Y | Y | Y | Y | Y | Y | Y | N | Y | NA | Y | NA | NA | N | 9 | Good |
| Zhang et al., 2020 [29] | Y | Y | NR | N | N | Y | Y | N | Y | NA | Y | NA | NA | N | 6 | Medium |
| Zhu et al., 2020 [41] | Y | Y | Y | Y | Y | Y | Y | N | Y | NA | Y | NA | NA | N | 9 | Good |
| Zhu et al., 2020 [42] | Y | Y | Y | Y | N | Y | Y | N | Y | NA | Y | NA | NA | N | 8 | Good |
Appendix C
| Author/Year | Sample Size | Country | Health Care Workers | Male (%) | Survey Tool | Cut-Off | Outcomes (%) (n) | ||||||
|---|---|---|---|---|---|---|---|---|---|---|---|---|---|
| Physician (%) | Nurses (%) | Depression | Anxiety | Insomnia | Stress | PTSD a | Distress | ||||||
| Aksoy and Kocak et al., 2020 [81] | 758 | Turkey | 0.0 | 100.0 | 7.0 | STAI y | NA ae | NA | 36.3 (275) | NA | NA | NA | NA |
| Alshekaili et al., 2020 [44] | 1139 | Oman | 33.7 | 39.4 | 20.0 | DASS t -21(D aa) DASS t -21(A ab) DASS t -21(S ac) ISI d | ≥10 ≥8 ≥16 ≥14 | 32.3 (368) | 34.1 (388) | 18.5 (211) | 23.8 (271) | NA | NA |
| Amerio et al., 2020 [45] | 131 | Italy | NA | NA | 51.9 | PHQ c -9 | ≥10 | 39.3 (30) | NA | NA | NA | NA | NA |
| Amin et al., 2020 [37] | 250 | Pakistan | 49.2 | 30.4 | 63.6 | PGWBI l | ≥30 | NA | NA | NA | NA | NA | 72.4 (181) |
| An et al., 2020 [46] | 1103 | China | 0.0 | 100.0 | 9.2 | PHQ c -9 | ≥5 | 43.6 (481) | NA | NA | NA | NA | NA |
| Cai et al., 2020 [79] | 2346 | China | NA | NA | 29.9 | PHQ c -9 BAI m ISI d | ≥10 ≥15 ≥9 | 12.23 (287) | 11.6 (271) | 38.4 (902) | NA | NA | NA |
| Caliskan et al., 2020 [47] | 290 | Turkey | 100.0 | NA | 61.7 | HADS k -D HADS k -A | ≥7 ≥10 | 62.1 (180) | 35.5 (103) | NA | NA | NA | NA |
| Cao et al., 2020 [33] | 37 | China | 16.0 | 19.0 | 21.6 | PHQ c -9 | ≥10 | 18.9 (7) | NA | NA | NA | NA | NA |
| Chatterjee et al., 2020 [48] | 152 | India | NA | NA | 78.3 | DASS t -21 | NA | 34.9 (53) | 39.5 (60) | NA | 32.9 (50) | NA | NA |
| Chen et al., 2020 [30] | 105 | China | NA | NA | 9.5 | SAS r SDS z | ≥50 ≥50 | 29.5 (31) | 18.1 (19) | NA | NA | NA | NA |
| Chew et al., 2020 [34] | 906 | Singapore and India | NA | NA | NA | DASS t -21(D aa) DASS t -21(A ab) DASS t -21(S ac) IES i -R | >9 >7 >14 ≥24 | 21.4 (96) | 31.5 (142) | NA | 10.3 (47) | 14.8 (67) | NA |
| Chung and Yeung et al., 2020 [78] | 69 | Hong Kong | 4.4 | 34.8 | NA | PHQ c -9 | ≥10 | 49.3 (34) | NA | NA | NA | NA | NA |
| Civantos et al., 2020 [49] | 349 | USA | 52.7 | NA | 60.7 | GAD b -7 PHQ c -2 IES i | ≥10 ≥3 ≥27 | 10.6 (37) | 47.9 (167) | NA | NA | NA | 60.2 (210) |
| Consolo et al., 2020 [35] | 356 | Italy | NA | NA | 60.4 | GAD b -7 | ≥5 | NA | 57.0 (204) | NA | NA | NA | NA |
| Corbett et al., 2020 [50] | 240 | Dublin Ireland | 15.0 | 36.25 | 9.2 | GAD b -7 PHQ c -9 | ≥10 ≥10 | 20.3 (49) | 21.0 (51) | NA | NA | NA | NA |
| Dai et al., 2020 [51] | 4357 | China | 32.6 | 53.8 | 23.5 | GHQ e -12 | ≥3 | NA | NA | NA | NA | NA | 39.1 (1704) |
| Dal’Bosco et al., 2020 [52] | 88 | South America | NA | NA | 10.2 | HAD k | ≥3 | 25.0 (22) | 48.9 (43) | NA | NA | NA | NA |
| Dong et al., 2020 [53] | 4618 | China | 24.6 | 62.7 | 16.3 | HEI q | ≥8 | NA | NA | NA | NA | NA | 24.2 (1118) |
| Du et al., 2020 [20] | 134 | China | 35.1 | 41.0 | 39.6 | BDI o -II BAI m PSS j | ≥14 ≥8 ≥14 | 12.7 (17) | 20.1 (28) | NA | 59.0 (79) | NA | NA |
| Elbay et al., 2020 [54] | 442 | Turkey | NA | NA | 43.2 | DASS t -21(D aa) DASS t -21(A ab) DASS t -21(S ac) | >9 >7 >14 | 64.7 (286) | 51.6 (224) | NA | 41.2 (182) | NA | NA |
| Guiroy et al., 2020 [36] | 204 | Latin America ad | 100.0 | NA | 96.6 | PHQ c -9 | ≥10 | 100 (204) | NA | NA | NA | NA | NA |
| Guo et al., 2020 [23] | 11,118 | China | 30.28 | 53.07 | 25.2 | SAS r SDS z | ≥50 ≥50 | 31.5 (3497) | 17.5 (1940) | NA | NA | NA | 40.7 (4530) |
| Hassannia et al., 2020 [55] | 487 | Iran | 26.08 | 21.56 | NA | HADS k -D aa HADS k -A ab | ≥8 ≥8 | 48.3 (235) | 62.8 (306) | NA | NA | NA | NA |
| Hawari et al., 2020 [56] | 1006 | Jordan | 13.02 | 63.02 | 44.7 | K6 ag | ≥11 | NA | NA | NA | NA | NA | 96.5 (971) |
| Hu et al., 2020 [57] | 2101 | China | NA | 100.00 | 12.4 | SAS r ZSDS v | ≥50 ≥60 | 42.0 (878) | 40.0 (833) | NA | NA | NA | 41.5 (835) |
| Huang and Zhao et al., 2020 [25] | 2250 | China | NA | NA | NA | GAD b -7 CES-D s PSQI p | ≥9 ≥28 ≥7 | 19.8 (446) | 35.6 (802) | 23.6 (531) | NA | NA | NA |
| Huang et al., 2020 [24] | 230 | China | 30.4 | 69.6 | 18.7 | SAS r PTSD-SS | ≥50 ≥50 | NA | 23.0 (53) | NA | NA | 27.4 (63) | NA |
| Jahrami et al., 2020 [58] | 257 | Bahrain | 31.1 | 46.3 | 30.0 | PSQI p PSS j | ≥5 ≥14 | NA | NA | NA | 100.0 (257) | NA | NA |
| Kang et al., 2020 [39] | 994 | China | 18.4 | 81.6 | 14.5 | PHQ c -9 GAD b -7 ISI d IES i -R | ≥5 ≥5 ≥8 ≥9 | 63.0 (627) | NA | NA | NA | NA | NA |
| Kaveh et al., 2020 [43] | 1038 | Iran | 20.6 | 63.3 | 12.4 | BAI m | ≥7 | NA | 100.0 (1038) | NA | NA | NA | NA |
| Khanna et al., 2020 [59] | 2355 | India | NA | NA | 56.6 | PHQ c -9 | ≥4 | 32.6 (765) | NA | NA | NA | NA | NA |
| Koksal et al., 2020 [80] | 702 | Turkey | NA | 48.3 | 30.0 | HADS k -D aa HADS k -A ab | ≥7 ≥10 | 36.9 (259) | 57.5 (404) | NA | NA | NA | NA |
| Lai et al., 2020 [16] | 1257 | China | 39.2 | 60.8 | 23.3 | PHQ c -9 GAD b -7 ISI d IES i -R | ≥5 ≥5 ≥8 ≥9 | 50.4 (634) | 44.6 (560) | 34 (427) | NA | NA | 71.5 (899) |
| Li et al., 2020 [31] | 4369 | China | 13.3 | 77.4 | 0.0 | IES i –R PHQ c -9 GAD b -7 | ≥33 ≥10 ≥8 | 14.2 (621) | 25.2 (1101) | NA | 31.6 (1382) | NA | NA |
| Liu et al., 2020 [27] | 512 | China | NA | NA | 15.4 | SAS r | ≥50 | NA | 12.5 (64) | NA | NA | NA | NA |
| Liu et al., 2020 [28] | 4679 | China | 39.6 | 60.4 | 17.7 | SAS r SDS z SRQ x -20 | ≥50 ≥50 ≥7 | 34.6 (1619) | 16.0 (749) | NA | NA | NA | 15.9 (744) |
| Lu et al., 2020 [19] | 2299 | China | 88.8 | NA | 22.4 | HADS k -D aa HADS k -A ab | ≥7 ≥7 | 11.7 (268) | 24.7 (569) | NA | NA | NA | NA |
| Nair et al., 2020 [60] | 586 | India | NA | NA | 53.1 | CPDI w PSS j | ≥28 ≥13 | NA | NA | NA | 100.0 (586) | NA | 52.0 (304) |
| Naser et al., 2020 [61] | 1163 | Jordan | 48.2 | 13.0 | 43.9 | GAD b -7 PHQ c -9 | ≥4 ≥5 | 78.0 (907) | 71.0 (823) | NA | NA | NA | NA |
| Podder et al., 2020 [62] | 384 | India | NA | NA | 55.5 | PSS j -10 | ≥13 | NA | NA | NA | 100 (384) | NA | NA |
| Qi et al., 2020 [26] | 1306 | China | NA | NA | 19.6 | PSQI p AIS f | >7 >6 | NA | NA | 45.5 (594) | NA | NA | NA |
| Que et al., 2020 [63] | 2285 | China | 37.6 | 9.1 | 30.9 | GAD b -7 PHQ c ISI d | ≥10 ≥10 ≥15 | 44.4 (1014) | 46.0 (1052) | 28.8 (657) | NA | NA | NA |
| Rossi et al., 2020 [64] | 1379 | Italy | 37.64 | 34.23 | 22.8 | GPS PHQ c -9 GAD b -7 ISI d -7 PSS j -10 | ≥3 ≥15 ≥15 ≥22 NA | 24.73 (341) | 19.8 (273) | 8.3 (114) | 21.9 (302) | 49.4 (681) | NA |
| Salman et al., 2020 [65] | 398 | Pakistan | 51.5 | 33.4 | 46.0 | GAD b -7 PHQ c -9 | ≥10 ≥10 | 21.9 (87) | 21.4 (85) | NA | NA | NA | NA |
| Shacham et al., 2020 [38] | 338 | Israel | NA | NA | 41.4 | K6 ag | ≥19 | NA | NA | NA | NA | NA | 11.5 (39) |
| Shechter et al., 2020 [66] | 657 | USA | 28.8 | 47.6 | 21.8 | PC-PTSD u PHQ c -2 GAD b -2 | ≥3 ≥3 ≥3 | 48.0 (313) | 33.0 (215) | NA | 57.0 (371) | NA | NA |
| Stojanov et al., 2020 [67] | 201 | Serbia | NA | 100.0 | 34.3 | GAD b -7 ZSDS v | ≥5 ≥50 | 30.8(62) | 48.2 (97) | NA | NA | NA | NA |
| Sun et al.,2020 [77] | 320 | China | NA | NA | NA | PCL af -5 | ≥33 | NA | NA | NA | NA | 4.4 (14) | NA |
| Tan et al., 2020 [21] | 470 | Singapore | 28.7 | 34.3 | 31.7 | DASS t -21(D aa) DASS t -21(A ab) DASS t -21(S ac) IES i -R | >9 >7 ≥14 ≥24 | 8.9 (42) | 14.5 (68) | NA | 6.6 (31) | 7.7 (36) | NA |
| Temsah et al., 2020 [6] | 582 | Saudi Arabian | 18.6 | 62.4 | 24.9 | GAD b -7 | ≥5 | NA | 100.0 (582) | NA | NA | NA | NA |
| Teng et al., 2020 [68] | 398 | China | NA | NA | 24.1 | PHQ c -9 SAS r | ≥5 ≥50 | 35.9 (143) | 14.1 (56) | NA | NA | NA | NA |
| Thapa et al., 2020 [69] | 100 | Nepal | 9.0 | 62.0 | 22.0 | SAS r | ≥45 | NA | 34.0 (34) | NA | NA | NA | NA |
| Tu et al., 2020 [70] | 100 | China | NA | 100.0 | 0.0 | GAD b -7 PHQ c -9 PSQI p | ≥4 ≥4 ≥7 | 46.0 (46) | 40.0 (40) | NA | NA | NA | NA |
| Wang et al., 2020 [71] | 1045 | China | 14.3 | 74.0 | 14.2 | HADS k -D aa HADS k -A ab PSS j -14 ISI d | ≥8 ≥8 ≥14 ≥14 | 53.0 (554) | 67.8 (708) | 10.4 (109) | 21.0 (223) | NA | NA |
| Weilenmann et al., 2020 [72] | 1410 | Switzerland | 60.8 | 39.2 | 33.8 | GAD b -7 PHQ c -9 | ≥10 ≥10 | 20.7 (292) | 25.9 (365) | NA | NA | NA | NA |
| Xiao et al., 2020 [73] | 958 | China | 39.5 | 37.5 | 32.8 | HADS k -D aa HADS k -A ab | ≥8 ≥8 | 57.3 (549) | 54.2 (518) | NA | NA | NA | NA |
| Yang et al., 2020 [74] | 65 | South Korea | NA | NA | 52.3 | GAD b -7 PHQ c -9 | ≥5 ≥10 | 18.5 (12) | 32.3 (21) | NA | NA | NA | NA |
| Yin et al., 2020 [75] | 371 | China | 18.1 | 71.2 | 38.5 | PCL af -5 | ≥33 | NA | NA | NA | NA | 3.8 (14) | NA |
| Zhan et al., 2020 [76] | 1794 | China | NA | 100.0 | 3.0 | AIS f FS g 14 CPSS h | ≥6 ≥7 ≥25 | NA | NA | 52.8 (948) | 44.0 (789) | NA | NA |
| Zhang et al., 2020 [17] | 2182 | China | 31.2 | 11.3 | 35.8 | ISI d SCL n -90-R PHQ c -2 GAD b -2 | >8 ≥2 ≥3 ≥3 | 10.6 (232) | 10.4 (228) | 33.9 (739) | NA | NA | NA |
| Zhang et al., 2020 [18] | 1563 | China | 29.0 | 62.9 | 17.3 | ISI d PHQ c -9 GAD b -7 IES i -R | ≥8 ≥5 ≥5 ≥9 | 50.7 (792) | 44.7 (699) | 36.1 (564) | 73.4 (1147) | NA | NA |
| Zhang et al., 2020 [29] | 304 | Iran | NA | NA | NA | PHQ c -4 K6 ag | NA NA | 20.6 (63) | 28.0 (85) | NA | NA | NA | 20.1 (61) |
| Zhu et al., 2020 [41] | 5062 | China | 19.8 | 67.5 | 15.0 | IES i -R PHQ c 9 GAD b -7 | ≥33 ≥10 ≥8 | 13.5 (681) | 24.1 (1218) | NA | 29.8 (1509) | NA | NA |
| Zhu et al., 2020 [42] | 165 | China | 47.9 | 52.1 | 17.0 | SAS r SDS z | ≥50 ≥50 | 44.2 (73) | 20.0 (33) | NA | NA | NA | NA |


References
- Shereen, M.A.; Khan, S.; Kazmi, A.; Bashir, N.; Siddique, R. COVID-19 infection: Origin, transmission, and characteristics of human coronaviruses. J. Adv. Res. 2020, 24, 91–98. [Google Scholar] [CrossRef] [PubMed]
- Huang, C.; Wang, Y.; Li, X.; Ren, L.; Zhao, J.; Hu, Y.; Zhang, L.; Fan, G.; Xu, J.; Gu, X.; et al. Clinical features of patients infected with 2019 novel coronavirus in Wuhan, China. Lancet 2020, 395, 497–506. [Google Scholar] [CrossRef] [Green Version]
- Liu, X.; Kakade, M.; Fuller, C.J.; Fan, B.; Fang, Y.; Kong, J.; Guan, Z.; Wu, P. Depression after exposure to stressful events: Lessons learned from the severe acute respiratory syndrome epidemic. Compr. Psychiatry 2012, 53, 15–23. [Google Scholar] [CrossRef] [PubMed]
- Bai, Y.-M.; Lin, C.-C.; Lin, C.-Y.; Chao-Cheng, L.; Chue, C.-M.; Chou, P. Survey of Stress Reactions Among Health Care Workers Involved With the SARS Outbreak. Psychiatr. Serv. 2004, 55, 1055–1057. [Google Scholar] [CrossRef] [PubMed]
- Nickell, L.A.; Crighton, E.J.; Tracy, C.S.; Al-Enazy, H.; Bolaji, Y.; Hanjrah, S.; Hussain, A.; Makhlouf, S.; Upshur, R.E.G. Psychosocial effects of SARS on hospital staff: Survey of a large tertiary care institution. Can. Med. Assoc. J. 2004, 170, 793–798. [Google Scholar] [CrossRef] [PubMed] [Green Version]
- Temsah, M.-H.; Alsohime, F.; AlAmro, N.; Al-Eyadhy, A.; Al-Hasan, K.; Jamal, A.; Al-Maglouth, I.; Aljamaan, F.; Al Amri, M.; Barry, M.A.; et al. The psychological impact of COVID-19 pandemic on health care workers in a MERS-CoV endemic country. J. Infect. Public Health 2020, 13, 877–882. [Google Scholar] [CrossRef] [PubMed]
- Maunder, R.; Hunter, J.; Vincent, L.; Bennett, J.; Peladeau, N.; Leszcz, M.; Sadavoy, J.; Verhaeghe, L.M.; Steinberg, R.; Mazzulli, T. The immediate psychological and occupational impact of the 2003 SARS outbreak in a teaching hospital. Can. Med. Assoc. J. 2003, 168, 1245–1251. [Google Scholar]
- Maunder, R.G.; Lancee, W.J.; Rourke, S.; Hunter, J.J.; Goldbloom, D.; Balderson, K.; Petryshen, P.; Steinberg, R.; Wasylenki, D.; Koh, D.; et al. Factors Associated With the Psychological Impact of Severe Acute Respiratory Syndrome on Nurses and Other Hospital Workers in Toronto. Psychosom. Med. 2004, 66, 938–942. [Google Scholar] [CrossRef] [PubMed]
- Talevi, D.; Socci, V.; Carai, M.; Carnaghi, G.; Faleri, S.; Trebbi, E.; Di Bernardo, A.; Capelli, F.; Pacitti, F. Mental health outcomes of the CoViD-19 pandemic. Riv Psichiatr. 2020, 55, 137–144. [Google Scholar]
- Stawicki, S.P.; Jeanmonod, R.; Miller, A.C.; Paladino, L.; Gaieski, D.F.; Yaffee, A.Q.; De Wulf, A.; Grover, J.; Papadimos, T.J.; Bloem, C.; et al. The 2019–2020 novel coronavirus (severe acute respiratory syndrome coronavirus 2) pandemic: A joint American college of academic international medicine-world academic council of emergency medicine multidisciplinary COVID-19 working group consensus paper. J. Glob. Infect. Dis. 2020, 12, 47–93. [Google Scholar] [CrossRef]
- Jimi, H.; Hashimoto, G. Challenges of COVID-19 outbreak on the cruise ship diamond princess docked at Yokohama, Japan: A real-world story. Glob. Health Med. 2020, 2, 63–65. [Google Scholar] [CrossRef]
- Asaoka, H.; Koido, Y.; Kawashima, Y.; Ikeda, M.; Miyamoto, Y.; Nishi, D. Post-traumatic stress symptoms among medical rescue workers exposed to COVID-19 in Japan. Psychiatry Clin. Neurosci. 2020, 74, 503–505. [Google Scholar] [CrossRef] [PubMed]
- Chong, M.-Y.; Wang, W.-C.; Hsieh, W.-C.; Lee, C.-Y.; Chiu, N.-M.; Yeh, W.-C.; Huang, O.-L.; Wen, J.-K.; Chen, C.-L. Psychological impact of severe acute respiratory syndrome on health workers in a tertiary hospital. Br. J. Psychiatry 2004, 185, 127–133. [Google Scholar] [CrossRef] [PubMed] [Green Version]
- Pappa, S.; Ntella, V.; Giannakas, T.; Giannakoulis, V.G.; Papoutsi, E.; Katsaounou, P. Prevalence of depression, anxiety, and insomnia among healthcare workers during the COVID-19 pandemic: A systematic review and meta-analysis. Brain Behav. Immun. 2020, 88, 901–907. [Google Scholar] [CrossRef] [PubMed]
- Luo, M.; Guo, L.; Yu, M.; Jiang, W.; Wang, H. The psychological and mental impact of coronavirus disease 2019 (COVID-19) on medical staff and general public—A systematic review and meta-analysis. Psychiatry Res. 2020, 291, 113190. [Google Scholar] [CrossRef] [PubMed]
- Lai, J.; Ma, S.; Wang, Y.; Cai, Z.; Hu, J.; Wei, N.; Wu, J.; Du, H.; Chen, T.; Li, R.; et al. Factors Associated With Mental Health Outcomes Among Health Care Workers Exposed to Coronavirus Disease 2019. JAMA Netw. Open 2020, 3, e203976. [Google Scholar] [CrossRef]
- Zhang, W.-R.; Wang, K.; Yin, L.; Zhao, W.-F.; Xue, Q.; Peng, M.; Min, B.-Q.; Tian, Q.; Leng, H.-X.; Du, J.-L.; et al. Mental Health and Psychosocial Problems of Medical Health Workers during the COVID-19 Epidemic in China. Psychother. Psychosom. 2020, 89, 242–250. [Google Scholar] [CrossRef]
- Zhang, C.; Yang, L.; Liu, S.; Ma, S.; Wang, Y.; Cai, Z.; Du, H.; Li, R.; Kang, L.; Su, M.; et al. Survey of Insomnia and Related Social Psychological Factors Among Medical Staff Involved in the 2019 Novel Coronavirus Disease Outbreak. Front. Psychiatry 2020, 11, 306. [Google Scholar] [CrossRef] [Green Version]
- Lu, W.; Wang, H.; Lin, Y.; Li, L. Psychological status of medical workforce during the COVID-19 pandemic: A cross-sectional study. Psychiatry Res. 2020, 288, 112936. [Google Scholar] [CrossRef]
- Du, J.; Dong, L.; Wang, T.; Yuan, C.; Fu, R.; Zhang, L.; Liu, B.; Zhang, M.; Yin, Y.; Qin, J.; et al. Psychological symptoms among frontline healthcare workers during COVID-19 outbreak in Wuhan. Gen. Hosp. Psychiatry 2020. [Google Scholar] [CrossRef]
- Tan, B.Y.; Chew, N.W.; Lee, G.K.; Jing, M.; Goh, Y.; Yeo, L.L.; Zhang, K.; Chin, H.-K.; Ahmad, A.; Khan, F.A.; et al. Psychological Impact of the COVID-19 Pandemic on Health Care Workers in Singapore. Ann. Intern. Med. 2020, 173, 317–320. [Google Scholar] [CrossRef] [PubMed] [Green Version]
- Du, J.; Dong, L.; Wang, T.; Yuan, C.; Fu, R.; Zhang, L.; Liu, B.; Zhang, M.; Yin, Y.; Qin, J.; et al. COVID-19 in Wuhan: Immediate psychological impact on 5062 health workers. MedRxiv 2020, 2, 20025338. [Google Scholar]
- Guo, J.; Liao, L.; Wang, B.; Li, X.; Guo, L.; Tong, Z.; Guan, Q.; Zhou, M.; Wu, Y.; Zhang, J.; et al. Psychological Effects of COVID-19 on Hospital Staff: A National Cross-Sectional Survey of China Mainland. SSRN Electron. J. 2020. [Google Scholar] [CrossRef]
- Huang, J.Z.; Han, M.F.; Luo, T.D.; Ren, A.K.; Zhou, X.P. Mental health survey of 230 medical staff in a tertiary infectious disease hospital for COVID-19. Zhonghua Lao Dong Wei Sheng Zhi Ye Bing Za Zhi 2020, 38, E001. [Google Scholar]
- Huang, Y.; Zhao, N. Generalized anxiety disorder, depressive symptoms and sleep quality during COVID-19 outbreak in China: A web-based cross-sectional survey. Psychiatry Res. 2020, 288, 112954. [Google Scholar] [CrossRef]
- Qi, J.; Xu, J.; Li, B.-Z.; Huang, J.-S.; Yang, Y.; Zhang, Z.-T.; Yao, D.-A.; Liu, Q.-H.; Jia, M.; Gong, D.-K.; et al. The evaluation of sleep disturbances for Chinese frontline medical workers under the outbreak of COVID-19. Sleep Med. 2020, 72. [Google Scholar] [CrossRef]
- Liu, C.-Y.; Yang, Y.-Z.; Deng, R.; Xu, X.; Dou, Q.-L.; Zhang, W.-W.; Cheng, A.S.K. The prevalence and influencing factors in anxiety in medical workers fighting COVID-19 in China: A cross-sectional survey. Epidemiol. Infect. 2020, 148, 1–17. [Google Scholar] [CrossRef]
- Liu, Z.; Han, B.; Jiang, R.; Huang, Y.; Ma, C.; Wen, J.; Zhang, T.; Wang, Y.; Chen, H.; Ma, Y. Mental health status of phisicians and nurses during COVID-19 epidemic in China. Lancet 2020. [Google Scholar] [CrossRef]
- Zhang, S.X.; Liu, J.; Jahanshahi, A.A.; Nawaser, K.; Yousefi, A.; Li, J.; Sun, S. At the height of the storm: Healthcare staff’s health conditions and job satisfaction and their associated predictors during the epidemic peak of COVID-19. Brain Behav. Immun. 2020, 87, 144–146. [Google Scholar] [CrossRef]
- Chen, Y.; Zhou, H.; Zhou, Y.; Zhou, F. Prevalence of self-reported depression and anxiety among pediatric medical staff members during the COVID-19 outbreak in Guiyang, China. Psychiatry Res. 2020, 288, 113005. [Google Scholar] [CrossRef]
- Li, G.; Miao, J.; Wang, H.; Xu, S.; Sun, W.; Fan, Y.; Zhang, C.; Zhu, S.; Zhu, Z.; Wang, W. Psychological impact on women health workers involved in COVID-19 outbreak in Wuhan: A cross-sectional study. J. Neurol. Neurosurg. Psychiatry 2020, 91, 895–897. [Google Scholar] [CrossRef] [PubMed]
- Wang, S.; Xie, L.; Xu, Y.; Yu, S.; Yao, B.; Xiang, D. Sleep disturbances among medical workers during the outbreak of COVID-2019. Occup. Med. 2020, 70, 364–369. [Google Scholar] [CrossRef] [PubMed]
- Cao, J.; Wei, J.; Zhu, H.; Duan, Y.; Geng, W.; Hong, X.; Jiang, J.; Zhao, X.; Zhu, B. A Study of Basic Needs and Psychological Wellbeing of Medical Workers in the Fever Clinic of a Tertiary General Hospital in Beijing during the COVID-19 Outbreak. Psychother. Psychosom. 2020, 89, 252–254. [Google Scholar] [CrossRef] [PubMed]
- Chew, N.W.; Lee, G.K.; Tan, B.Y.; Jing, M.; Goh, Y.; Ngiam, N.J.; Yeo, L.L.; Ahmad, A.; Khan, F.A.; Shanmugam, G.N.; et al. A multinational, multicentre study on the psychological outcomes and associated physical symptoms amongst healthcare workers during COVID-19 outbreak. Brain Behav. Immun. 2020, 88, 559–565. [Google Scholar] [CrossRef] [PubMed]
- Consolo, U.; Bellini, P.; Bencivenni, D.; Iani, C.; Checchi, V. Epidemiological Aspects and Psychological Reactions to COVID-19 of Dental Practitioners in the Northern Italy Districts of Modena and Reggio Emilia. Int. J. Environ. Res. Public Health 2020, 17, 3459. [Google Scholar] [CrossRef] [PubMed]
- Guiroy, A.; Gagliardi, M.; Coombes, N.; Landriel, F.; Zanardi, C.; Willhuber, G.C.; Guyot, J.P.; Valacco, M. COVID-19 Impact Among Spine Surgeons in Latin America. Glob. Spine J. 2020. [Google Scholar] [CrossRef]
- Amin, S. The psychology of coronavirus fear: Are healthcare professionals suffering from corona-phobia? Int. J. Health Manag. 2020, 13, 249–256. [Google Scholar] [CrossRef]
- Shacham, M.; Hamama-Raz, Y.; Kolerman, R.; Mijiritsky, O.; Ben-Ezra, M.; Mijiritsky, E. COVID-19 Factors and Psychological Factors Associated with Elevated Psychological Distress among Dentists and Dental Hygienists in Israel. Int. J. Environ. Res. Public Health 2020, 17, 2900. [Google Scholar] [CrossRef] [Green Version]
- Kang, L.; Ma, S.; Chen, M.; Yang, J.; Wang, Y.; Li, R.; Yao, L.; Bai, H.; Cai, Z.; Yang, B.X.; et al. Impact on mental health and perceptions of psychological care among medical and nursing staff in Wuhan during the 2019 novel coronavirus disease outbreak: A cross-sectional study. Brain Behav. Immun. 2020, 87, 11–17. [Google Scholar] [CrossRef]
- Cai, W.; Lian, B.; Song, X.; Hou, T.; Deng, G.; Li, H. A cross-sectional study on mental health among health care workers during the outbreak of Corona Virus Disease 2019. Asian J. Psychiatry 2020, 51, 102111. [Google Scholar] [CrossRef]
- Zhu, Z.; Xu, S.; Wang, H.; Liu, Z.; Wu, J.; Li, G.; Miao, J.; Zhang, C.; Yang, Y.; Sun, W.; et al. COVID-19 in Wuhan: Sociodemographic characteristics and hospital support measures associated with the immediate psychological impact on healthcare workers. EClinicalMedicine 2020, 24, 100443. [Google Scholar] [CrossRef] [PubMed]
- Zhu, J.; Sun, L.; Zhang, L.; Wang, H.; Fan, A.; Yang, B.; Li, W.; Xiao, S. Prevalence and influencing factors of anxiety and depression symptoms in the first-line medical staff fighting against COVID-19 in Gansu. Front. Psychiatry. 2020, 11, 1–6. [Google Scholar] [CrossRef] [PubMed]
- Kaveh, M.; Davari-Tanha, F.; Varaei, S.; Shirali, E.; Shokouhi, N.; Nazemi, P.; Ghajarzadeh, M.; Feizabad, E.; Ashraf, M.A. Anxiety levels among Iranian health care workers during the COVID-19 surge: A cross-sectional study. medRxiv 2020. [Google Scholar] [CrossRef]
- Alshekaili, M.; Hassan, W.; Al-Said, N.; Alsulimani, F.; Jayapal, S.K.; Al-Mawali, A.; Chan, M.F.; Mahadevan, S.; Al-Adawi, S. Factors Associated with Mental Health Outcomes in Oman During COVID-19: Frontline vs Non-Frontline Healthcare Workers. SSRN Electron. J. 2020. [Google Scholar] [CrossRef]
- Amerio, A.; Bianchi, D.; Santi, F.; Costantini, L.; Odone, A.; Signorelli, C.; Costanza, A.; Serafini, G.; Amore, M.; Aguglia, A. Covid-19 pandemic impact on mental health: A web-based cross-sectional survey on a sample of Italian general practitioners. Acta bio-Med. Atenei Parm. 2020, 91, 83–88. [Google Scholar]
- An, Y.; Yang, Y.; Wang, A.; Li, Y.; Zhang, Q.; Cheung, T.; Ungvari, G.S.; Qin, M.-Z.; An, F.-R.; Xiang, Y.-T. Prevalence of depression and its impact on quality of life among frontline nurses in emergency departments during the COVID-19 outbreak. J. Affect. Disord. 2020, 276, 312–315. [Google Scholar] [CrossRef]
- Çalişkan, F.; Dost, B. The Evaluation of Knowledge, Attitudes, Depression and Anxiety Levels among Emergency Physicians during the COVID-19 Pandemic. Signa Vitae A J. Intensiv. Care Emerg. Med. 2020, 16, 163. [Google Scholar] [CrossRef]
- Bhattacharyya, R.; Chatterjee, S.S.; Bhattacharyya, S.; Gupta, S.; Das, S.; Banerjee, B.B. Attitude, practice, behavior, and mental health impact of COVID-19 on doctors. Indian J. Psychiatry 2020, 62, 257–265. [Google Scholar] [CrossRef]
- Ba, A.M.C.; Ba, Y.B.; Chang, C.; Prasad, A.; Chorath, K.; Poonia, S.K.; Jenks, C.M.; Bur, A.M.; Thakkar, P.; Graboyes, E.M.; et al. Mental health among otolaryngology resident and attending physicians during the COVID -19 pandemic: National study. Head Neck 2020, 42, 1597–1609. [Google Scholar] [CrossRef]
- Corbett, G.A.; Milne, S.J.; Mohan, S.; Reagu, S.; Farrell, T.; Lindow, S.W.; Hehir, M.P.; O’Connell, M.P. Anxiety and depression scores in maternity healthcare workers during the Covid-19 pandemic. Int. J. Gynecol. Obstet. 2020, 151, 297–298. [Google Scholar] [CrossRef]
- Hakami, Z.; Khanagar, S.B.; Vishwanathaiah, S.; Hakami, A.; Bokhari, A.M.; Jabali, A.H.; Alasmari, D.; AlDrees, A.M. Psychological impact of the coronavirus disease 2019 (COVID-19) pandemic on dental students: A nationwide study. J. Dent. Educ. 2020. [Google Scholar] [CrossRef] [PubMed]
- Dal’Bosco, E.B.; Floriano, L.S.M.; Skupien, S.V.; Arcaro, G.; Martins, A.R.; Anselmo, A.C.C. Mental health of nursing in coping with COVID-19 at a regional university hospital. Rev. Bras. Enferm. 2020, 73, e20200434. [Google Scholar] [CrossRef] [PubMed]
- Dong, Z.-Q.; Ma, J.; Hao, Y.-N.; Shen, X.-L.; Liu, F.; Gao, Y.; Zhang, L. The social psychological impact of the COVID-19 pandemic on medical staff in China: A cross-sectional study. Eur. Psychiatry 2020, 63, 1–22. [Google Scholar] [CrossRef] [PubMed]
- Elbay, R.Y.; Kurtulmuş, A.; Arpacıoğlu, S.; Karadere, E. Depression, anxiety, stress levels of physicians and associated factors in Covid-19 pandemics. Psychiatry Res. 2020, 290, 113130. [Google Scholar] [CrossRef] [PubMed]
- Taghizadeh, F.; Hassannia, L.; Moosazedeh, M.; Zarghami, M.; Taghizadeh, H.; Dooki, A.F.; Navae, R.A.; Hedayatizadeh-Omran, A. Anxiety and Depression in Health Workers and General Population During COVID-19 Epidemic in IRAN: A Web-Based Cross-Sectional Study. medRxiv 2020. [Google Scholar] [CrossRef]
- Hawari, F.I.; Obeidat, N.A.; Dodin, Y.I.; Albtoosh, A.S.; Manasrah, R.M.; Alaqeel, I.O.; Mansour, A.H. The inevitability of Covid-19 related distress among healthcare workers: Findings from a low caseload country under lockdown. MedRxiv 2020. [Google Scholar] [CrossRef]
- Hu, D.; Kong, Y.; Li, W.; Han, Q.; Zhang, X.; Zhu, L.X.; Wan, S.W.; Liu, Z.; Shen, Q.; Yang, J.; et al. Frontline nurses’ burnout, anxiety, depression, and fear statuses and their associated factors during the COVID-19 outbreak in Wuhan, China: A large-scale cross-sectional study. EClinicalMedicine 2020, 24, 100424. [Google Scholar] [CrossRef]
- Jahrami, H.; Bahammam, A.S.; AlGahtani, H.; Ebrahim, A.; Faris, M.; Aleid, K.; Saif, Z.; Haji, E.; Dhahi, A.; Marzooq, H.; et al. The examination of sleep quality for frontline healthcare workers during the outbreak of COVID-19. Sleep Breath. 2020, 1–9. [Google Scholar] [CrossRef]
- Khanna, R.C.; Honavar, S.G.; Metla, A.L.; Bhattacharya, A.; Maulik, P.K. Psychological impact of COVID-19 on ophthalmologists-in-training and practising ophthalmologists in India. Indian J. Ophthalmol. 2020, 68, 994–998. [Google Scholar] [CrossRef]
- Nair, A.K.R.; Chellaswamy, K.S.; Kattula, D.; Thavarajah, R.; Mohandoss, A.A. Perceived stress and psychological distress among indian endodontists during COVID-19 pandemic lockdown. MedRxiv 2020. [Google Scholar] [CrossRef]
- Naser, A.Y.; Dahmash, E.Z.; Al-Rousan, R.; Alwafi, H.; Alrawashdeh, H.M.; Ghoul, I.; Abidine, A.; Bokhary, M.A.; Al-Hadithi, H.T.; Ali, D.; et al. Mental health status of the general population, healthcare professionals, and university students during 2019 coronavirus disease outbreak in Jordan: A cross-sectional study. Brain Behav. 2020, 10, e01730. [Google Scholar] [CrossRef] [PubMed]
- Podder, I.; Agarwal, K.; Datta, S. Comparative analysis of perceived stress in dermatologists and other physicians during national lock-down and COVID -19 pandemic with exploration of possible risk factors: A web-based cross-sectional study from Eastern India. Dermatol. Ther. 2020, 33. [Google Scholar] [CrossRef] [PubMed]
- Que, J.; Shi, L.; Deng, J.; Liu, J.; Zhang, L.; Wu, S.; Gong, Y.; Huang, W.; Yuan, K.; Yan, W.; et al. Psychological impact of the COVID-19 pandemic on healthcare workers: A cross-sectional study in China. Gen. Psychiatry 2020, 33, e100259. [Google Scholar] [CrossRef] [PubMed]
- Rossi, R.; Socci, V.; Pacitti, F.; Di Lorenzo, G.; Di Marco, A.; Siracusano, A.; Rossi, A. Mental Health Outcomes Among Frontline and Second-Line Health Care Workers During the Coronavirus Disease 2019 (COVID-19) Pandemic in Italy. JAMA Netw. Open 2020, 3, e2010185. [Google Scholar] [CrossRef] [PubMed]
- Salman, M.; Raza, M.H.; Mustafa, Z.U.; Khan, T.M.; Asif, N.; Tahir, H.; Shehzadi, N.; Hussain, K. The psychological effects of COVID-19 on frontline healthcare workers and how they are coping: A web-based, cross-sectional study from Pakistan. medRxiv 2020. [Google Scholar] [CrossRef]
- Shechter, A.; Diaz, F.; Moise, N.; Anstey, D.E.; Ye, S.; Agarwal, S.; Birk, J.L.; Brodie, D.; Cannone, D.E.; Chang, B.; et al. Psychological distress, coping behaviors, and preferences for support among New York healthcare workers during the COVID-19 pandemic. Gen. Hosp. Psychiatry 2020, 66, 1–8. [Google Scholar] [CrossRef]
- Stojanov, J.; Malobabic, M.; Stanojevic, G.; Stevic, M.; Milosevic, V.; Stojanov, A. Quality of sleep and health-related quality of life among health care professionals treating patients with coronavirus disease-19. Int. J. Soc. Psychiatry 2020, 1–7. [Google Scholar] [CrossRef]
- Teng, Z.; Wei, Z.; Qiu, Y.; Tan, Y.; Chen, J.; Tang, H.; Wu, H.; Wu, R.; Huang, J. Psychological status and fatigue of frontline staff two months after the COVID-19 pandemic outbreak in China: A cross-sectional study. J. Affect. Disord. 2020, 275, 247–252. [Google Scholar] [CrossRef]
- Thapa, L.; Ghimire, A.; Ghimire, S.; Sharma, N.; Shrestha, S.; Devkota, M.; Bhattarai, S.; Maharjan, A.; Lohani, S.; Phuyal, S.; et al. Predictors of Anxiety Regarding The COVID-19 Pandemic Among Health-care Workers in a Hospital Not Assigned to Manage COVID-19 Patients in Nepal. medRxiv 2020. [Google Scholar] [CrossRef]
- Tu, Z.-H.; He, J.-W.; Zhou, N. Sleep quality and mood symptoms in conscripted frontline nurse in Wuhan, China during COVID-19 outbreak. Medicine 2020, 99, e20769. [Google Scholar] [CrossRef]
- Wang, H.; Huang, D.; Huang, H.; Zhang, J.; Guo, L.; Liu, Y.; Ma, H.; Geng, Q. The psychological impact of COVID-19 pandemic on medical staff in Guangdong, China: A cross-sectional study. Psychol. Med. 2020, 1–9. [Google Scholar] [CrossRef] [PubMed]
- Weilenmann, S.; Ernst, J.; Petry, H.; Sazpinar, O.; Pfaltz, M.C.; Gehrke, S.; Paolercio, F.; von Kaenel, R.; Spiller, T.R. Health care workers mental health during the first weeks of the SARS-CoV-2 pandemic in Switzerland: A cross-sectional study. medRxiv 2020. [Google Scholar] [CrossRef]
- Xiao, X.; Zhu, X.; Fu, S.; Hu, Y.; Li, X.; Xiao, J. Psychological impact of healthcare workers in China during COVID-19 pneumonia epidemic: A multi-center cross-sectional survey investigation. J. Affect. Disord. 2020, 274, 405–410. [Google Scholar] [CrossRef] [PubMed]
- Yang, S.; Kwak, S.G.; Ko, E.J.; Chang, M.C. The Mental Health Burden of the COVID-19 Pandemic on Physical Therapists. Int. J. Environ. Res. Public Heal. 2020, 17, 3723. [Google Scholar] [CrossRef] [PubMed]
- Yin, Q.; Sun, Z.; Liu, T.; Ni, X.; Deng, X.; Jia, Y.; Shang, Z.; Zhou, Y.; Liu, W. Posttraumatic stress symptoms of health care workers during the corona virus disease 2019. Clin. Psychol. Psychother. 2020, 27, 384–395. [Google Scholar] [CrossRef] [PubMed]
- Zhan, Y.; Liu, Y.; Liu, H.; Li, M.; Shen, Y.; Gui, L.; Zhang, J.; Luo, Z.; Tao, X.; Yu, J. Factors associated with insomnia among Chinese front-line nurses fighting against COVID-19 in Wuhan: A cross-sectional survey. J. Nurs. Manag. 2020, 28, 1525–1535. [Google Scholar] [CrossRef]
- Sun, L.; Sun, Z.; Wu, L.; Zhu, Z.; Zhang, F.; Shang, Z.; Jia, Y.; Gu, J.; Zhou, Y.; Wang, Y.; et al. Prevalence and Risk Factors of Acute Posttraumatic Stress Symptoms during the COVID-19 Outbreak in Wuhan, China. medRxiv 2020. [Google Scholar] [CrossRef] [Green Version]
- Chung, J.P.; Yeung, W.-S. Staff Mental Health Self-Assessment During the COVID-19 Outbreak. East Asian Arch. Psychiatry 2020, 30, 34. [Google Scholar] [CrossRef] [Green Version]
- Cai, Q.; Feng, H.; Huang, J.; Wang, M.; Wang, Q.; Lu, X.; Xie, Y.; Wang, X.; Liu, Z.; Hou, B.; et al. The mental health of frontline and non-frontline medical workers during the coronavirus disease 2019 (COVID-19) outbreak in China: A case-control study. J. Affect. Disord. 2020, 275, 210–215. [Google Scholar] [CrossRef]
- Koksal, E.; Dost, B.; Terzi, Ö.; Ustun, Y.B.; Özdin, S.; Bilgin, S. Evaluation of Depression and Anxiety Levels and Related Factors Among Operating Theater Workers During the Novel Coronavirus (COVID-19) Pandemic. J. PeriAnesthesia Nurs. 2020. [Google Scholar] [CrossRef]
- Aksoy, Y.E.; Koçak, V. Psychological effects of nurses and midwives due to COVID-19 outbreak: The case of Turkey. Arch. Psychiatr. Nurs. 2020, 34, 427–433. [Google Scholar] [CrossRef]
- Liberati, A.; Altman, D.G.; Tetzlaff, J.; Mulrow, C.; Gøtzsche, P.C.; Ioannidis, J.P.A.; Clarke, M.; Devereaux, P.J.; Kleijnen, J.; Moher, D. The PRISMA statement for reporting systematic reviews and meta-analyses of studies that evaluate healthcare interventions: Explanation and elaboration. BMJ 2009, 339, b2700. [Google Scholar] [CrossRef] [PubMed] [Green Version]
- DerSimonian, R.; Laird, N. Meta-analysis in clinical trials. Control. Clin. Trials 1986, 7, 177–188. [Google Scholar] [CrossRef]
- Higgins, J.P.; Green, S. Cochrane Handbook for Systematic Reviews of Interventions; John Wiley & Sons: Hoboken, NJ, USA, 2011. [Google Scholar]
- Egger, M.; Smith, G.D.; Schneider, M.; Minder, C. Bias in meta-analysis detected by a simple, graphical test. BMJ 1997, 315, 629–634. [Google Scholar] [CrossRef] [PubMed] [Green Version]
- Adams, J.G.; Walls, R.M. Supporting the Health Care Workforce during the COVID-19 Global Epidemic. JAMA 2020, 323, 1439. [Google Scholar] [CrossRef] [Green Version]
- Bai, Y.; Yao, L.; Wei, T.; Tian, F.; Jin, D.-Y.; Chen, L.; Wang, M. Presumed Asymptomatic Carrier Transmission of COVID-19. JAMA 2020, 323, 1406–1407. [Google Scholar] [CrossRef] [Green Version]
- Song, X.; Fu, W.; Liu, X.; Luo, Z.; Wang, R.; Zhou, N.; Yan, S.; Lv, C. Mental health status of medical staff in emergency departments during the Coronavirus disease 2019 epidemic in China. Brain Behav. Immun. 2020, 88, 60–65. [Google Scholar] [CrossRef]
- Johnson, E.O.; Roth, T.; Breslau, N. The association of insomnia with anxiety disorders and depression: Exploration of the direction of risk. J. Psychiatr. Res. 2006, 40, 700–708. [Google Scholar] [CrossRef]
- Qiu, J.; Shen, B.; Zhao, M.; Wang, Z.; Xie, B.; Xu, Y. A nationwide survey of psychological distress among Chinese people in the COVID-19 epidemic: Implications and policy recommendations. Gen. Psychiatry 2020, 33, e100213. [Google Scholar] [CrossRef] [Green Version]
- Sriharan, A.; Ratnapalan, S.; Tricco, A.C.; Lupea, D.; Ayala, A.P.; Pang, H.; Lee, D. Stress, burnout and depression in women in health care during COVID-19 Pandemic: Rapid Scoping Review. medRxiv 2020. [Google Scholar] [CrossRef]
- Maeng, L.Y.; Milad, M.R. Sex differences in anxiety disorders: Interactions between fear, stress, and gonadal hormones. Horm. Behav. 2015, 76, 106–117. [Google Scholar] [CrossRef] [PubMed] [Green Version]
- Chan, S. Nurses Fighting Against Severe Acute Respiratory Syndrome (SARS) in Hong Kong. J. Nurs. Sch. 2003, 35, 209. [Google Scholar] [CrossRef] [PubMed]
- Wong, T.W.; Yau, J.K.; Chan, C.L.; Kwong, R.S.; Ho, S.M.; Lau, C.; Lau, F.L.; Lit, C.H. The psychological impact of severe acute respiratory syndrome outbreak on healthcare workers in emergency departments and how they cope. Eur. J. Emerg. Med. 2005, 12, 13–18. [Google Scholar] [CrossRef] [PubMed]
- Liu, Q.; Luo, D.; Haase, J.E.; Guo, Q.; Wang, X.Q.; Liu, S.; Xia, L.; Liu, Z.; Yang, J.; Yang, B.X. The experiences of health-care providers during the COVID-19 crisis in China: A qualitative study. Lancet Glob. Health 2020, 8, e790–e798. [Google Scholar] [CrossRef]
- Cui, P.P.; Wang, P.P.; Wang, K.; Ping, Z.; Wang, P.; Chen, C. Post-traumatic growth and influencing factors among frontline nurses fighting against COVID-19. Occup. Environ. Med. 2020. [Google Scholar] [CrossRef]
- Kanekar, A.; Sharma, M. COVID-19 and Mental Well-Being: Guidance on the Application of Behavioral and Positive Well-Being Strategies. Healthcare 2020, 8, 336. [Google Scholar] [CrossRef] [PubMed]
- Heath, C.; Sommerfield, A.; Von Ungern-Sternberg, B.S. Resilience strategies to manage psychological distress among healthcare workers during the COVID-19 pandemic: A narrative review. Anaesthesia 2020, 75, 1364–1371. [Google Scholar] [CrossRef] [PubMed]
- DePierro, J.; Katz, C.L.; Marin, D.; Feder, A.; Bevilacqua, L.; Sharma, V.; Hurtado, A.; Ripp, J.; Lim, S.; Charney, D. Mount Sinai’s Center for Stress, Resilience and Personal Growth as a model for responding to the impact of COVID-19 on health care workers. Psychiatry Res. 2020, 293, 113426. [Google Scholar] [CrossRef]
- Greenberg, N.; Cooke, J.; Sullivan, E.; Tracy, D.K. Mental health plan for workers of the London Nightingale Hospital: Following the evidence to support staff. BMJ Mil. Health 2020. [Google Scholar] [CrossRef]


| Overall | Number of Studies | Proportion (%) | 95% CI | I2 | p Value | References | |
| Anxiety prevalence | 46 | 34.4% | 29.5–39.7 | 99.1% | <0.0001 | [6,16,17,18,19,20,21,23,24,25,27,28,29,30,31,32,34,35,41,42,43,44,45,47,48,49,50,52,54,55,57,61,63,64,65,66,67,68,69,70,71,72,73,74,79,80,81] | |
| Subgroup Analysis | |||||||
| Categories | Subgroups | Number of Studies | Proportion (%) | 95% CI | I2 | p Value | References |
| Quality | Good | 22 | 31.2% | 24.5–38.7 | 99.2% | <0.0001 | [16,17,18,19,24,25,28,31,32,34,41,42,44,54,57,61,63,64,66,68,79,80] |
| Medium | 24 | 38.1% | 30.7–46.0 | 99.0% | <0.0001 | [6,20,21,23,27,29,30,35,43,47,48,49,50,52,55,65,67,69,70,71,72,73,74,81] | |
| Continents | Asia | 34 | 32.7% | 27.1–38.8 | 99.2% | <0.0001 | [6,16,17,18,19,20,21,23,24,25,27,28,29,30,31,32,34,41,42,43,44,48,55,57,61,63,65,68,69,70,71,73,74,79] |
| Other | 12 | 39.3% | 29.6–49.9 | 97.8% | <0.0001 | [35,47,49,50,52,54,64,66,67,72,80,81] | |
| Countries | China | 22 | 28.5% | 22.5–35.4 | 99.3% | <0.0001 | [16,17,18,19,20,23,24,25,27,28,30,31,32,41,42,57,63,68,70,71,73,79] |
| Other | 24 | 40.4% | 33.2–48.0 | 98.4% | <0.0001 | [6,21,29,34,35,43,44,47,48,49,50,52,54,55,61,64,65,66,67,69,72,74,80,81] | |
| Assessment | GAD | 19 | 36.8% | 29.1–45.2 | 99.1% | <0.0001 | [6,16,17,18,25,31,35,41,49,50,61,63,64,65,66,67,70,72,74] |
| SAS | 9 | 24.6% | 16.1–35.6 | 99.7% | <0.0001 | [23,24,27,28,32,42,57,68,69] | |
| Other | 18 | 37.1% | 29.1–45.9 | 99.0% | <0.0001 | [19,20,21,29,30,34,43,44,45,47,48,52,54,55,71,73,79,80,81] | |
| Gender | Female | 7 | 46.9% | 38.6–55.3 | 84.6% | <0.0001 | [16,47,48,49,73,74,80] |
| Male | 7 | 44.2% | 36.3–52.5 | 93.2% | <0.0001 | [16,47,48,49,73,74,80] | |
| Healthcare Professions | Nurses | 8 | 39.3% | 27.5–52.6 | 98.9% | <0.0001 | [16,23,41,42,55,63,66,73] |
| Doctors | 8 | 32.5% | 21.9–45.2 | 98.9% | <0.0001 | [16,23,41,42,55,63,66,73] | |
| Healthcare Workers | Frontline | 5 | 39.8% | 24.1–58.0 | 98.6% | <0.0001 | [16,23,43,44,79] |
| Second-line | 5 | 27.1% | 15.1–43.7 | 99.0% | <0.0001 | [16,23,43,44,79] | |
| Level of Anxiety | Mild | 18 | 60.3% | 53.8–66.4 | 94.8% | <0.0001 | [6,16,23,24,27,28,30,34,35,43,48,49,54,55,57,61,65,68] |
| Moderate | 18 | 26.0% | 21.4–31.3 | 95.4% | <0.0001 | [6,16,23,24,27,28,30,34,35,43,48,49,54,55,57,61,65,68] | |
| Severe | 18 | 14.3 | 11.2–18.1 | 97.1% | <0.0001 | [6,16,23,24,27,28,30,34,35,43,48,49,54,55,57,61,65,68] | |
| Overall | Number of Studies | Proportion (%) | 95% CI | I2 | p Value | References | |
| Depression prevalence | 46 | 31.8% | 26.8–37.2 | 99.2% | <0.001 | [16,17,18,19,20,21,23,25,27,29,30,31,32,33,34,36,39,41,42,44,45,46,47,48,49,50,52,54,55,57,59,61,63,64,65,66,67,68,70,71,72,73,74,78,79,80] | |
| Subgroup Analysis | |||||||
| Categories | Subgroups | Number of Studies | Proportion (%) | 95% CI | I2 | p Value | References |
| Quality | Good | 24 | 35.1% | 27.6–43.5 | 99.5% | <0.001 | [16,17,18,19,25,27,31,32,34,39,41,42,44,46,54,57,59,61,63,64,66,68,79,80] |
| Medium | 22 | 28.6% | 21.6–36.7 | 97.9% | <0.001 | [20,21,23,29,30,33,36,45,47,48,49,50,52,55,65,67,70,71,72,73,74,78] | |
| Continents | Asia | 34 | 30.8% | 25.1–37.1 | 99.4% | <0.001 | [16,17,18,19,20,21,23,25,27,29,30,31,32,33,34,39,41,42,44,46,48,55,57,59,61,63,65,68,70,71,73,74,78,79] |
| Other | 12 | 35.0% | 24.9–46.7 | 98.1% | <0.001 | [36,45,47,49,50,52,54,64,66,67,72,80] | |
| Countries | China | 23 | 33.2% | 26.0–41.3 | 99.4% | <0.001 | [16,17,18,19,20,23,25,27,30,31,32,33,39,41,42,46,57,63,70,71,73,79] |
| Other | 23 | 30.4% | 23.6–38.3 | 98.7% | <0.001 | [21,29,34,36,44,45,47,48,49,50,52,54,55,59,61,64,65,66,67,72,74,78,80] | |
| Assessment | PHQ | 25 | 29.7% | 23.1–37.2 | 99.4% | <0.001 | [16,17,18,29,31,33,36,39,41,45,46,49,50,59,61,63,64,65,66,68,70,72,74,78,79] |
| Other | 21 | 34.7% | 26.8–43.5 | 98.9% | <0.001 | [19,20,21,23,25,27,30,32,34,42,44,47,48,52,54,55,57,67,71,73,80] | |
| Gender | Female | 7 | 43.4% | 33.6–53.9 | 95.8% | <0.001 | [16,47,48,59,73,74,80] |
| Male | 7 | 40.9% | 31.4–51.5 | 95.5% | <0.001 | [16,47,48,59,73,74,80] | |
| Healthcare Professions | Nurses | 9 | 42.4% | 30.4–55.4 | 99.0% | <0.001 | [16,23,33,41,42,55,63,66,73] |
| Doctors | 9 | 39.1% | 27.3–52.2 | 98.4% | <0.001 | [16,23,33,41,42,55,63,66,73] | |
| Healthcare Workers | Frontline | 6 | 23.6% | 14.1–36.7 | 99.1% | <0.001 | [16,17,21,23,44,79] |
| Second-line | 6 | 19.6% | 11.5–31.5 | 98.8% | <0.001 | [16,17,21,23,44,79] | |
| Level of Depression | Mild | 17 | 57.6% | 50.0–64.8 | 97.8% | <0.001 | [16,23,27,30,34,36,39,46,48,54,57,59,61,68,70,71,78] |
| Moderate | 17 | 27.9% | 22.1–34.6 | 97.9% | <0.001 | [16,23,27,30,34,36,39,46,48,54,57,59,61,68,70,71,78] | |
| Severe | 17 | 10.4% | 7.0–14.0 | 97.8% | <0.001 | [16,23,27,30,34,36,39,46,48,54,57,59,61,68,70,71,78] | |
| Overall | Number of Studies | Proportion (%) | 95% CI | I2 | p Value | References | |
| Stress prevalence | 17 | 40.3% | 31.4–50.0 | 99.1% | <0.001 | [18,20,21,31,32,34,41,44,48,54,58,60,62,64,66,73,76] | |
| Subgroup Analysis | |||||||
| Categories | Subgroups | Number of Studies | Proportion (%) | 95% CI | I2 | p Value | References |
| Quality | Good | 9 | 37.3% | 25.6–50.7 | 99.4% | <0.001 | [18,31,34,41,44,54,60,64,66] |
| Medium | 8 | 45.7% | 31.2–61.1 | 98.4% | <0.001 | [20,21,32,48,58,62,73,76] | |
| Continents | Asia | 14 | 41.3% | 30.9–52.6 | 99.2% | <0.001 | [18,20,21,31,32,34,41,44,48,58,60,62,73,76] |
| Other | 3 | 38.8% | 20.6–60.8 | 99.1% | <0.001 | [54,64,66] | |
| Countries | China | 7 | 44.2% | 30.9–58.4 | 99.5% | <0.001 | [18,20,31,32,41,73,76] |
| Other | 10 | 37.1% | 25.4–50.5 | 98.6% | <0.001 | [21,34,44,48,54,58,60,62,64,66] | |
| Survey Instrument | PSS | 8 | 61.4% | 45.1–75.6 | 98.6% | <0.001 | [20,32,58,60,62,64,73,76] |
| DASS | 5 | 17.5% | 9.4–30.3 | 98.5% | <0.001 | [21,34,44,48,54] | |
| Other | 4 | 47.8% | 29.3–66.8 | 99.7% | <0.001 | [18,31,41,66] | |
| Level of Stress | Mild | 6 | 25.8% | 16.8–37.6 | 91.2% | <0.001 | [34,48,54,58,60,62] |
| Moderate | 6 | 52.3% | 38.7–65.5 | 95.8% | <0.001 | [34,48,54,58,60,62] | |
| Severe | 6 | 18.9% | 11.9–28.9 | 93.4% | <0.001 | [34,48,54,58,60,62] | |
Publisher’s Note: MDPI stays neutral with regard to jurisdictional claims in published maps and institutional affiliations. |
© 2020 by the authors. Licensee MDPI, Basel, Switzerland. This article is an open access article distributed under the terms and conditions of the Creative Commons Attribution (CC BY) license (http://creativecommons.org/licenses/by/4.0/).
Share and Cite
Batra, K.; Singh, T.P.; Sharma, M.; Batra, R.; Schvaneveldt, N. Investigating the Psychological Impact of COVID-19 among Healthcare Workers: A Meta-Analysis. Int. J. Environ. Res. Public Health 2020, 17, 9096. https://doi.org/10.3390/ijerph17239096
Batra K, Singh TP, Sharma M, Batra R, Schvaneveldt N. Investigating the Psychological Impact of COVID-19 among Healthcare Workers: A Meta-Analysis. International Journal of Environmental Research and Public Health. 2020; 17(23):9096. https://doi.org/10.3390/ijerph17239096
Chicago/Turabian StyleBatra, Kavita, Tejinder Pal Singh, Manoj Sharma, Ravi Batra, and Nena Schvaneveldt. 2020. "Investigating the Psychological Impact of COVID-19 among Healthcare Workers: A Meta-Analysis" International Journal of Environmental Research and Public Health 17, no. 23: 9096. https://doi.org/10.3390/ijerph17239096