Is Sitting Always Inactive and Standing Always Active? A Simultaneous Free-Living activPal and ActiGraph Analysis

 , and
, and
Abstract
:1. Introduction
2. Materials and Methods
2.1. Participants
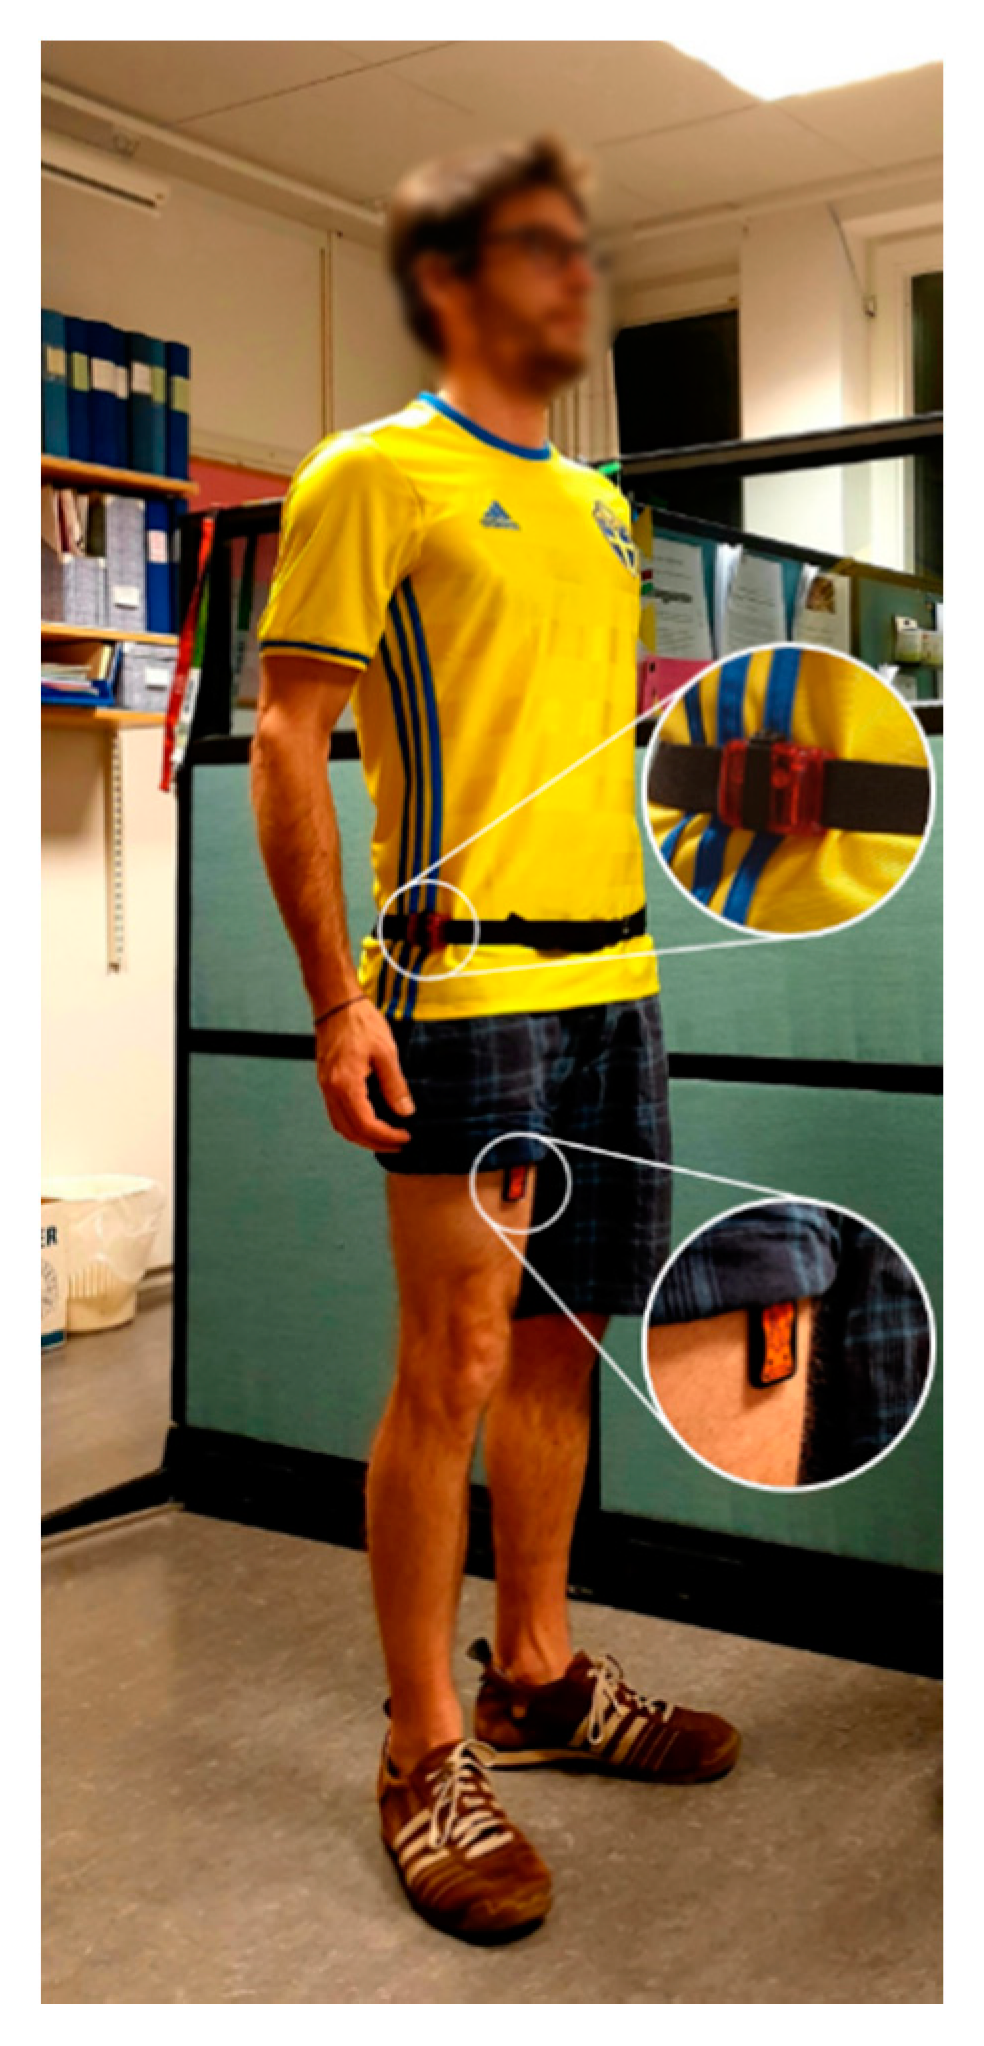
2.2. Data Recording
2.3. Valid Time Detection
2.4. Behavior Classification
2.4.1. activPal
2.4.2. ActiGraph
2.4.3. POPAI
2.5. Data Analysis and Statistics
3. Results
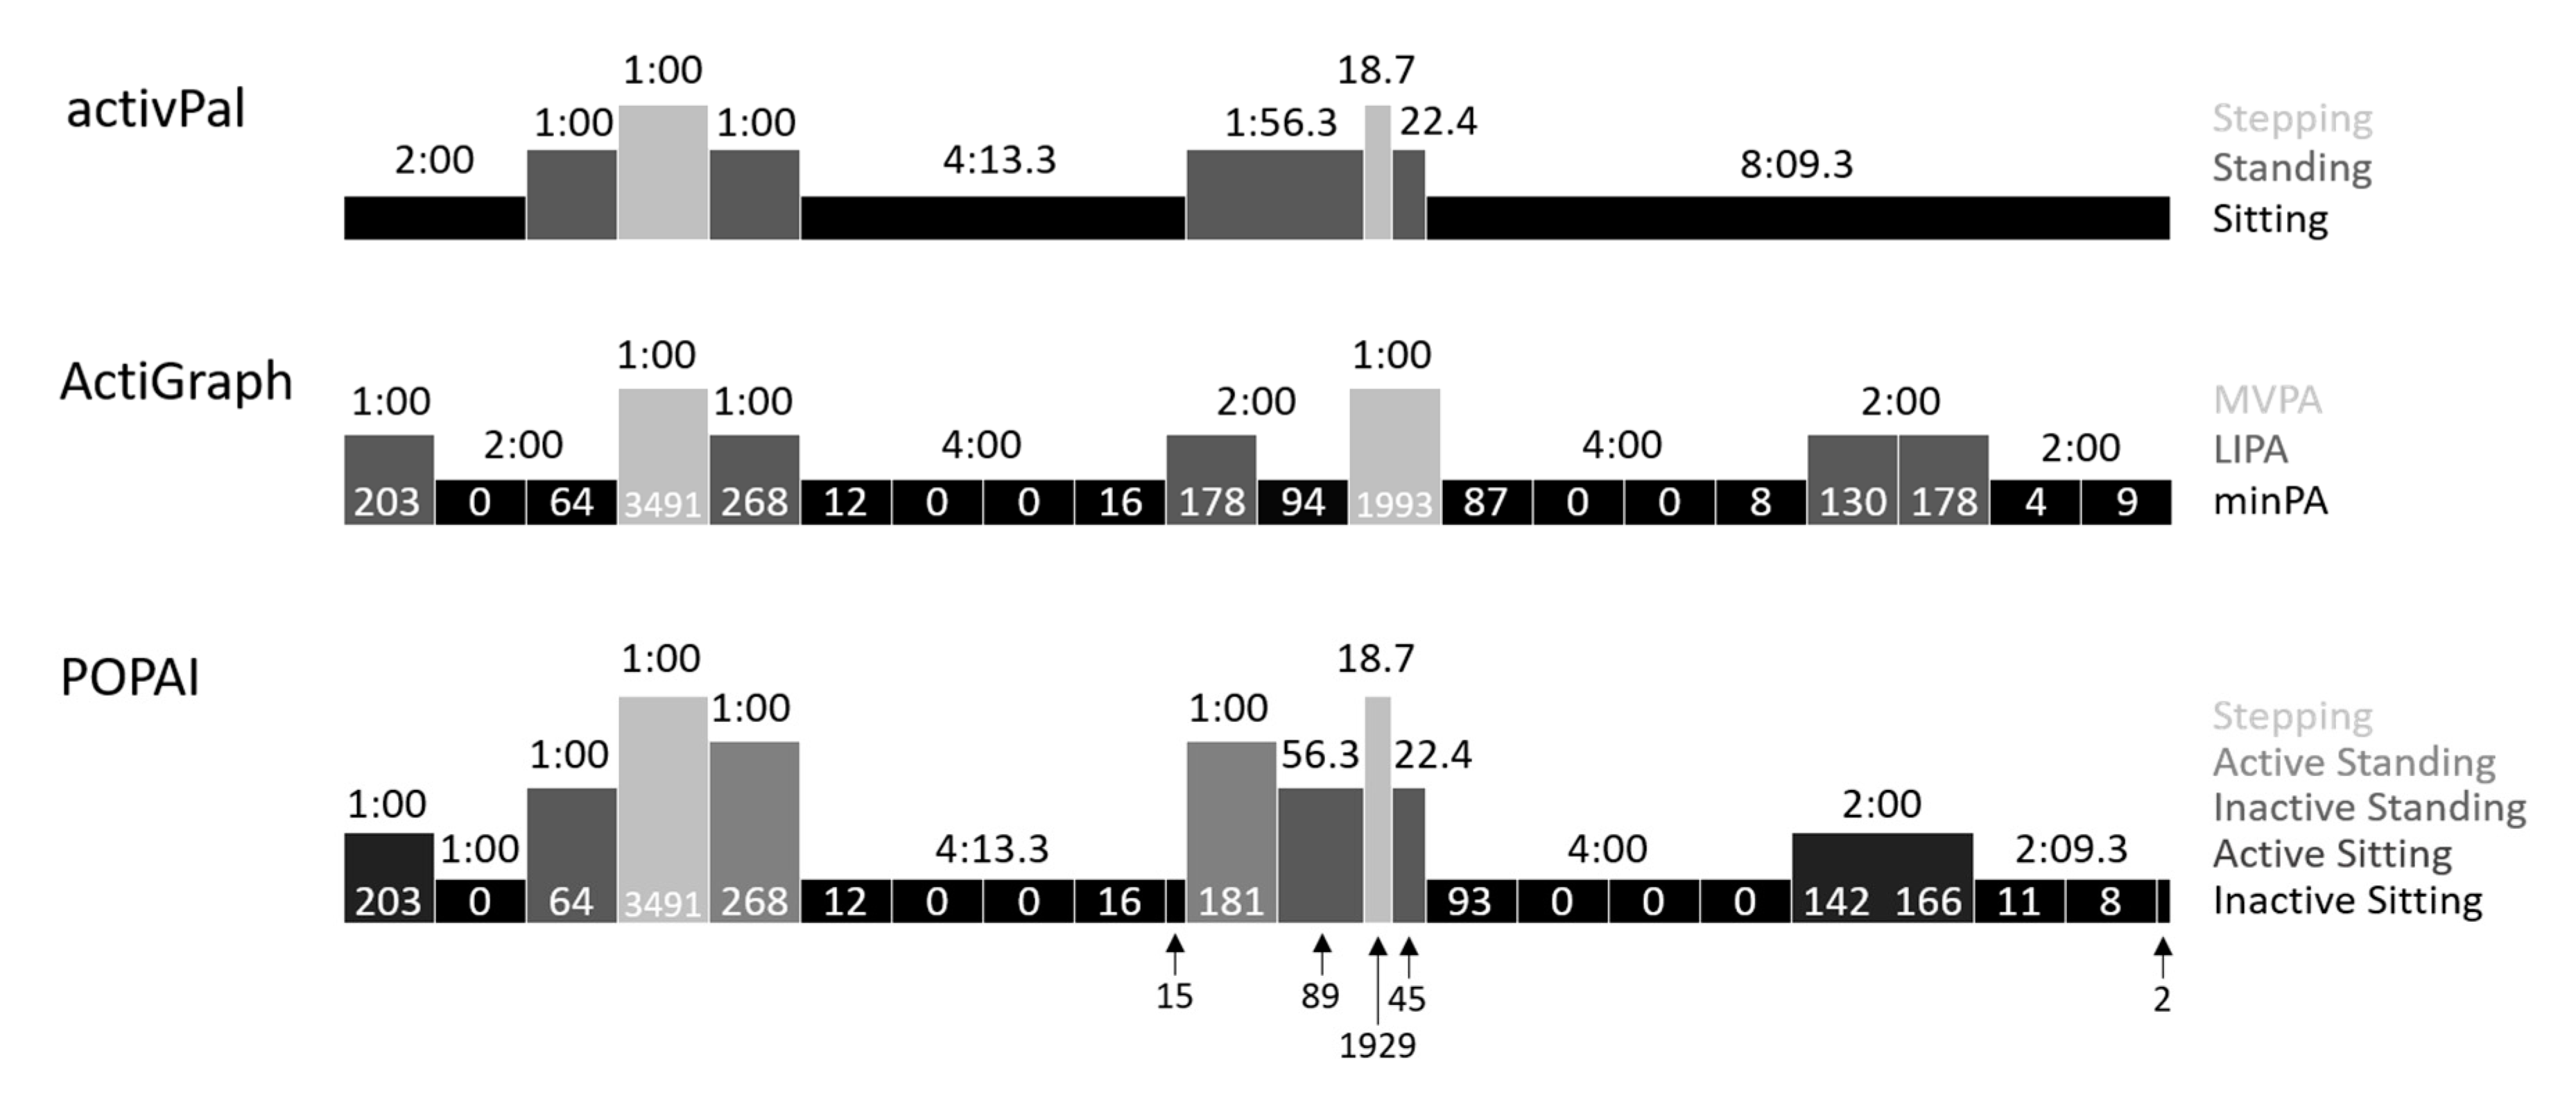
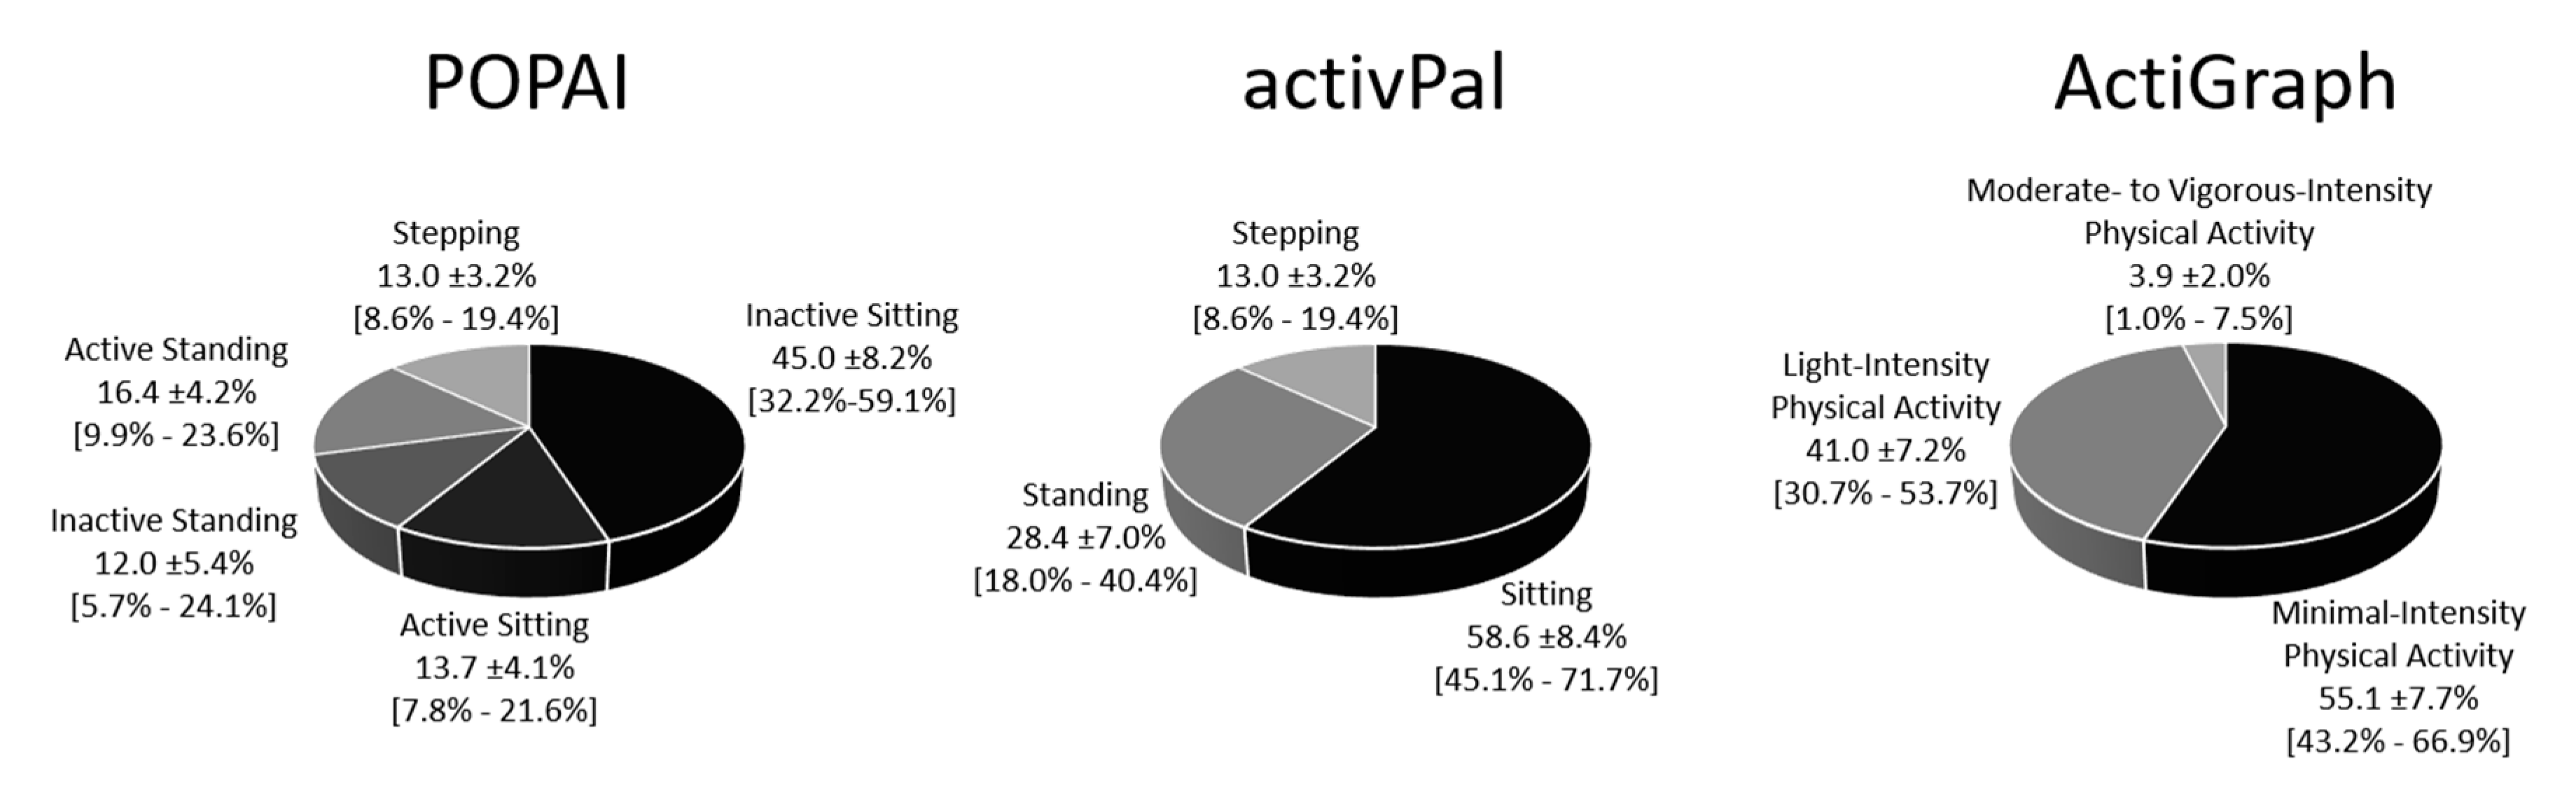
3.1. Descriptive Time Use
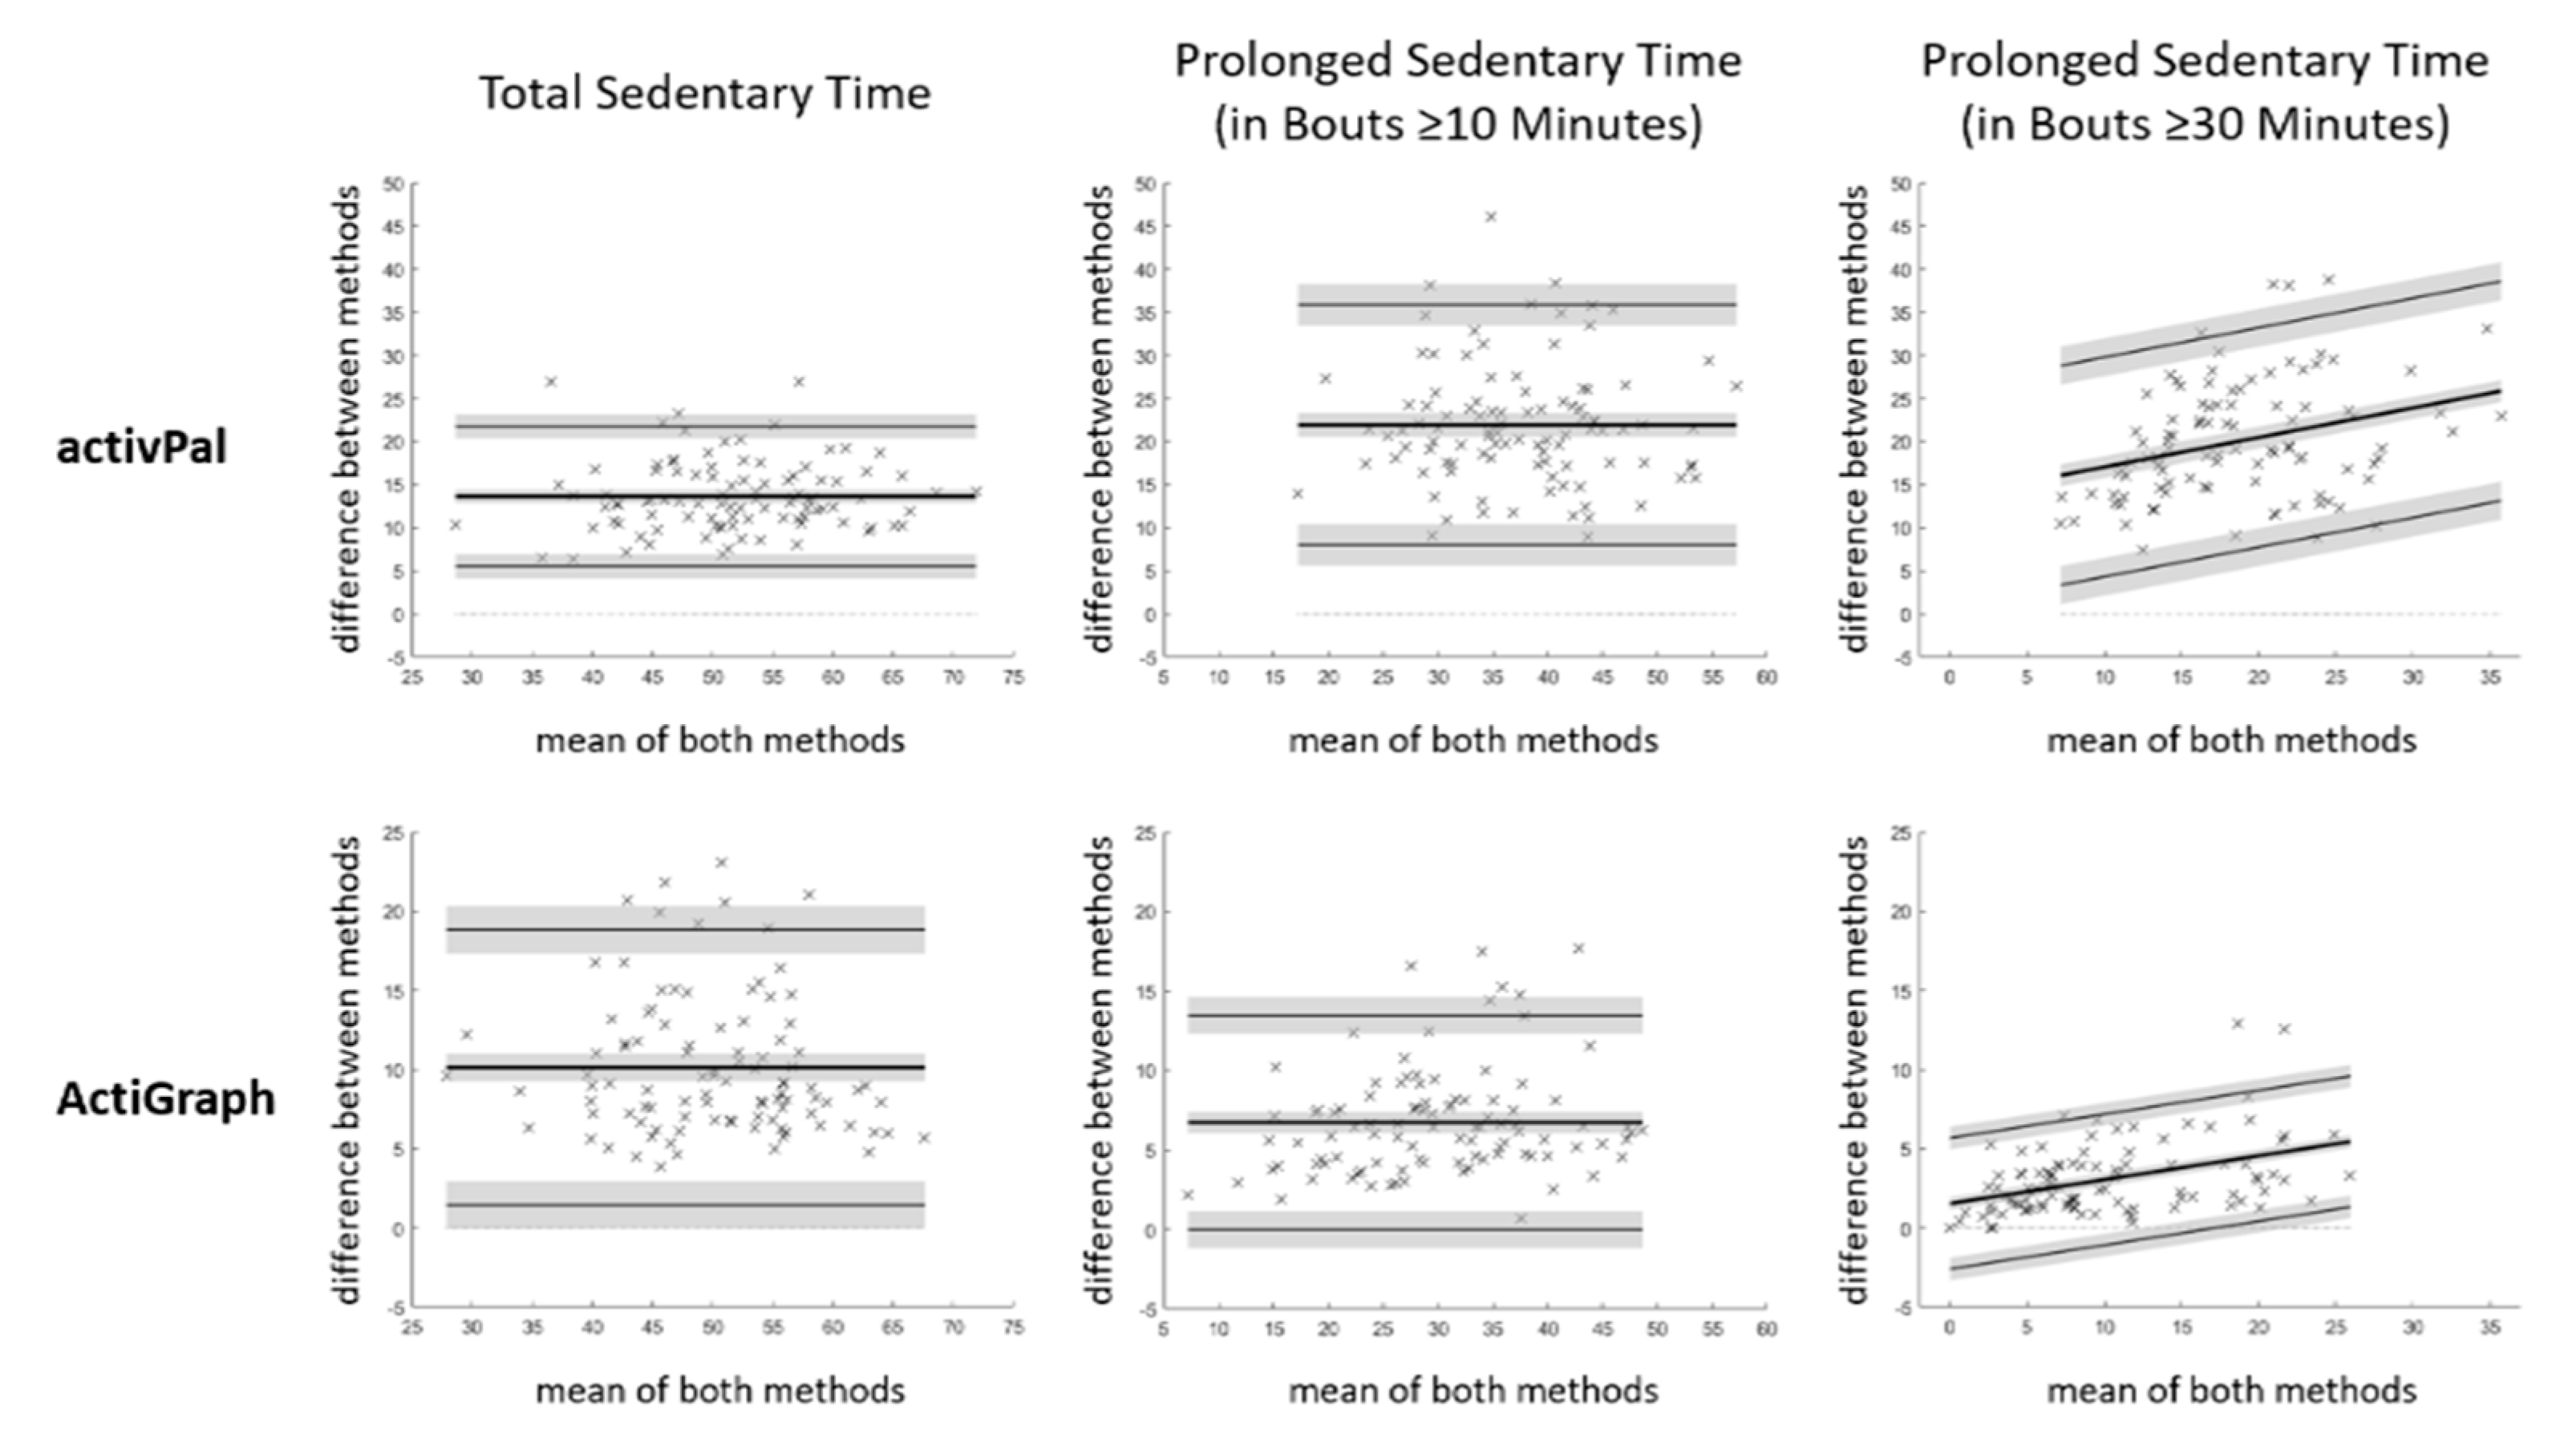
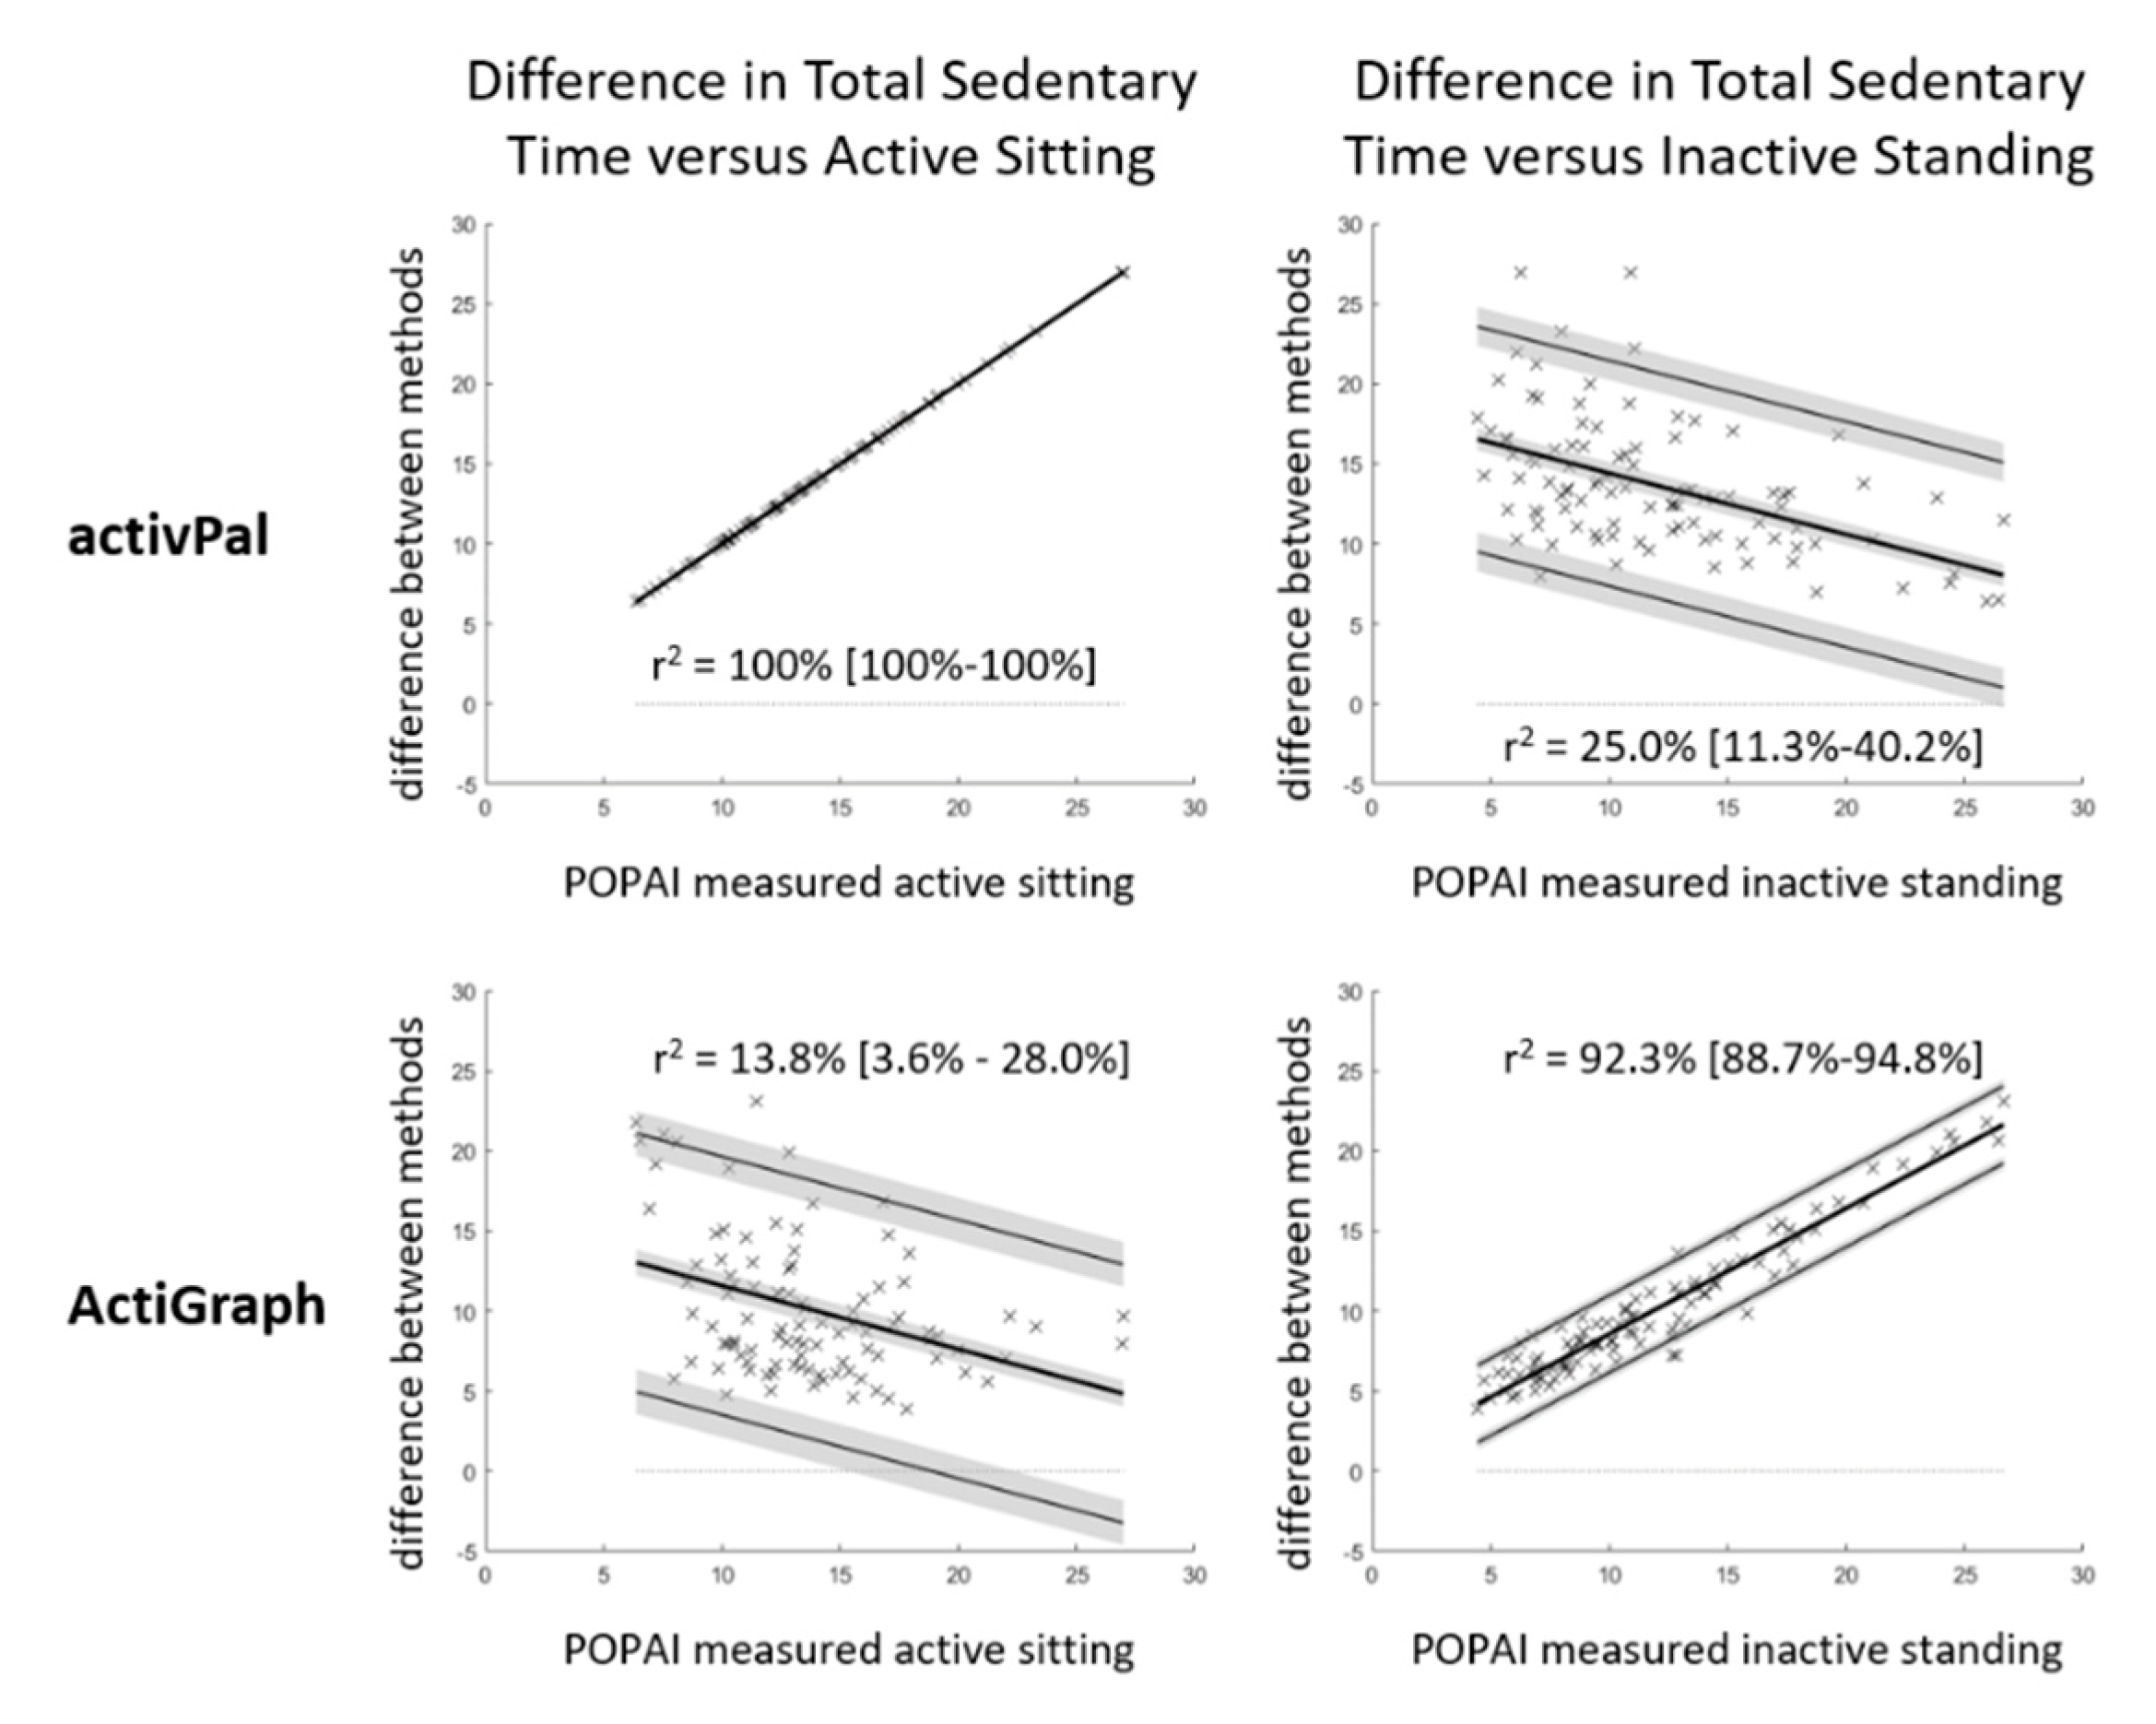
3.2. Sedentary Time
3.3. Sedentary Accumulation Pattern
4. Discussion
4.1. Sedentary Time
4.2. Sedentary Accumulation Pattern
4.3. Critical POPAI Appraisal
4.4. Critical Study Appraisal
4.5. Practical Implication
5. Conclusions
Supplementary Materials
Author Contributions
Funding
Conflicts of Interest
References
- Amirfaiz, S.; Shahril, M.R. Objectively Measured Physical Activity, Sedentary Behavior, and Metabolic Syndrome in Adults: Systematic Review of Observational Evidence. Metab. Syndr. Relat. Disord. 2019, 17, 1–21. [Google Scholar] [CrossRef]
- de Rezende, L.F.M.; Sa, T.H.; Mielke, G.I.; Viscondi, J.Y.K.; Rey-Lopez, J.P.; Garcia, L.M.T. All-Cause Mortality Attributable to Sitting Time: Analysis of 54 Countries Worldwide. Am. J. Prev. Med. 2016, 51, 253–263. [Google Scholar] [CrossRef] [PubMed] [Green Version]
- Ekelund, U.; Tarp, J.; Steene-Johannessen, J.; Hansen, B.H.; Jefferis, B.; Fagerland, M.W.; Whincup, P.; Diaz, K.M.; Hooker, S.P.; Chernofsky, A.; et al. Dose-response associations between accelerometry measured physical activity and sedentary time and all cause mortality: Systematic review and harmonised meta-analysis. BMJ 2019, 366, l4570. [Google Scholar] [CrossRef] [PubMed] [Green Version]
- von Rosen, P.; Dohrn, I.M.; Hagstromer, M. Latent profile analysis of physical activity and sedentary behavior with mortality risk: A 15-year follow-up. Scand. J. Med. Sci. Sports 2020, 30, 1949–1956. [Google Scholar] [CrossRef] [PubMed]
- Dunstan, D.W.; Kingwell, B.A.; Larsen, R.; Healy, G.N.; Cerin, E.; Hamilton, M.T.; Shaw, J.E.; Bertovic, D.A.; Zimmet, P.Z.; Salmon, J.; et al. Breaking up prolonged sitting reduces postprandial glucose and insulin responses. Diabetes Care 2012, 35, 976–983. [Google Scholar] [CrossRef] [PubMed] [Green Version]
- Larsen, R.; Ali, H.; Dempsey, P.C.; Grace, M.; Dillon, F.; Kingwell, B.A.; Cohen, N.; Owen, N.; Green, D.J.; Dunstan, D.W. Interrupting Sitting Time with Simple Resistance Activities Lowers Postprandial Insulinemia in Adults with Overweight or Obesity. Obesity 2019, 27, 1428–1433. [Google Scholar] [CrossRef] [PubMed]
- Holtermann, A.; Schellewald, V.; Mathiassen, S.E.; Gupta, N.; Pinder, A.; Punakallio, A.; Veiersted, K.B.; Weber, B.; Takala, E.P.; Draicchio, F.; et al. A practical guidance for assessments of sedentary behavior at work: A PEROSH initiative. Appl. Ergon. 2017, 63, 41–52. [Google Scholar] [CrossRef]
- Prince, S.A.; Cardilli, L.; Reed, J.L.; Saunders, T.J.; Kite, C.; Douillette, K.; Fournier, K.; Buckley, J.P. A comparison of self-reported and device measured sedentary behaviour in adults: A systematic review and meta-analysis. Int. J. Behav. Nutr. Phys. Act. 2020, 17, 31. [Google Scholar] [CrossRef]
- Stemland, I.; Ingebrigtsen, J.; Christiansen, C.S.; Jensen, B.R.; Hanisch, C.; Skotte, J.; Holtermann, A. Validity of the Acti4 method for detection of physical activity types in free-living settings: Comparison with video analysis. Ergonomics 2015, 58, 953–965. [Google Scholar] [CrossRef]
- Kim, Y.; Barry, V.W.; Kang, M. Validation of the ActiGraph GT3X and activPAL Accelerometers for the Assessment of Sedentary Behavior. Meas. Phys. Educ. Exerc. Sci. 2015, 19, 125–137. [Google Scholar] [CrossRef]
- Kozey-Keadle, S.; Libertine, A.; Lyden, K.; Staudenmayer, J.; Freedson, P.S. Validation of Wearable Monitors for Assessing Sedentary Behavior. Med. Sci. Sports Exerc. 2011, 43, 1561–1567. [Google Scholar] [CrossRef] [PubMed] [Green Version]
- Freedson, P.S.; Melanson, E.; Sirard, J. Calibration of the Computer Science and Applications, Inc. accelerometer. Med. Sci. Sports Exerc. 1998, 30, 777–781. [Google Scholar] [CrossRef] [PubMed]
- Matthews, C.E.; Kozey-Keadle, S.; Moore, S.C.; Schoeller, D.S.; Carroll, R.J.; Troiano, R.P.; Sampson, J.N. Measurement of Active and Sedentary Behavior in Context of Large Epidemiologic Studies. Med. Sci. Sports Exerc. 2018, 50, 266–276. [Google Scholar] [CrossRef] [PubMed]
- Migueles, J.H.; Cadenas-Sanchez, C.; Ekelund, U.; Delisle Nystrom, C.; Mora-Gonzalez, J.; Lof, M.; Labayen, I.; Ruiz, J.R.; Ortega, F.B. Accelerometer Data Collection and Processing Criteria to Assess Physical Activity and Other Outcomes: A Systematic Review and Practical Considerations. Sports Med. 2017, 47, 1821–1845. [Google Scholar] [CrossRef]
- SBRN. Letter to the editor: Standardized use of the terms “sedentary” and “sedentary behaviours”. Appl. Physiol. Nutr. Metab. 2012, 37, 540–542. [Google Scholar] [CrossRef] [Green Version]
- Edwardson, C.L.; Henson, J.; Biddle, S.J.H.; Davies, M.J.; Khunti, K.; Maylor, B.; Yates, T. activPAL and ActiGraph Assessed Sedentary Behavior and Cardiometabolic Health Markers. Med. Sci. Sports Exerc. 2020, 52, 391–397. [Google Scholar] [CrossRef]
- Kuster, R.P.; Grooten, W.J.A.; Baumgartner, D.; Blom, V.; Hagstromer, M.; Ekblom, O. Detecting Prolonged Sitting Bouts with the ActiGraph GT3X. Scand. J. Med. Sci. Sports 2020, 30, 572–582. [Google Scholar] [CrossRef]
- Bland, J.M. How Can I Decide the Sample Size for a Study of Agreement between Two Methods of Measurement? Available online: https://www-users.york.ac.uk/~mb55/meas/sizemeth.htm (accessed on 21 September 2020).
- Nooijen, C.F.J.; Blom, V.; Ekblom, O.; Ekblom, M.M.; Kallings, L.V. Improving office workers’ mental health and cognition: A 3-arm cluster randomized controlled trial targeting physical activity and sedentary behavior in multi-component interventions. BMC Public Health 2019, 19, 266. [Google Scholar] [CrossRef] [Green Version]
- Winkler, E.A.; Bodicoat, D.H.; Healy, G.N.; Bakrania, K.; Yates, T.; Owen, N.; Dunstan, D.W.; Edwardson, C.L. Identifying adults’ valid waking wear time by automated estimation in activPAL data collected with a 24 h wear protocol. Physiol. Meas. 2016, 37, 1653–1668. [Google Scholar] [CrossRef] [Green Version]
- Kuster, R.P.; Hagstromer, M.; Baumgartner, D.; Grooten, W.J.A. Concurrent and discriminant validity of ActiGraph waist and wrist cut-points to measure sedentary behaviour, activity level, and posture in office work. BMC Public Health 2020. in review. [Google Scholar]
- Bland, J.; Altman, D. Measuring agreement in method comparison studies. Stat. Methods Med. Res. 1999, 8, 135–160. [Google Scholar] [CrossRef] [PubMed]
- Boerema, S.T.; van Velsen, L.; Vollenbroek, M.M.; Hermens, H.J. Pattern measures of sedentary behaviour in adults: A literature review. Digit Health 2020, 6, 2055207620905418. [Google Scholar] [CrossRef] [PubMed]
- Chastin, S.F.M.; Winkler, E.A.H.; Eakin, E.G.; Gardiner, P.A.; Dunstan, D.W.; Owen, N.; Healy, G.N. Sensitivity to Change of Objectively-Derived Measures of Sedentary Behavior. Meas. Phys. Educ. Exerc. Sci. 2015, 19, 138–147. [Google Scholar] [CrossRef]
- Lengwiler, Y. Gini Coefficient and the Lorentz Curve, 1.0.0.0; MATLAB Central File Exchange. Available online: https://www.mathworks.com/matlabcentral/fileexchange/28080-gini-coefficient-and-the-lorentz-curve (accessed on 21 September 2020).
- Chastin, S.F.; Granat, M.H. Methods for objective measure, quantification and analysis of sedentary behaviour and inactivity. Gait Posture 2010, 31, 82–86. [Google Scholar] [CrossRef]
- Ellingson, L.D.; Schwabacher, I.J.; Kim, Y.; Welk, G.J.; Cook, D.B. Validity of an Integrative Method for Processing Physical Activity Data. Med. Sci. Sports Exerc. 2016, 48, 1629–1638. [Google Scholar] [CrossRef]
- Myers, A.; Gibbons, C.; Butler, E.; Dalton, M.; Buckland, N.; Blundell, J.; Finlayson, G. A novel integrative procedure for identifying and integrating three-dimensions of objectively measured free-living sedentary behaviour. BMC Public Health 2017, 17, 979. [Google Scholar] [CrossRef]
- Fanchamps, M.H.J.; van den Berg-Emons, H.J.G.; Stam, H.J.; Bussmann, J.B.J. Sedentary behavior: Different types of operationalization influence outcome measures. Gait Posture 2017, 54, 188–193. [Google Scholar] [CrossRef]
- Crouter, S.E.; DellaValle, D.M.; Haas, J.D.; Frongillo, E.A.; Bassett, D.R. Validity of ActiGraph 2-Regression Model and Matthews and NHANES and Cut-Points for Assessing Free-Living Physical Activity. J. Phys. Act. Health 2013, 10, 504–514. [Google Scholar] [CrossRef]
- Tremblay, M.S.; Aubert, S.; Barnes, J.D.; Saunders, T.J.; Carson, V.; Latimer-Cheung, A.E.; Chastin, S.F.M.; Altenburg, T.M.; Chinapaw, M.J.M.; Participants, S.T.C.P. Sedentary Behavior Research Network (SBRN)—Terminology Consensus Project process and outcome. Int. J. Behav. Nutr. Phys. Act. 2017, 14, 75. [Google Scholar] [CrossRef] [Green Version]
- Kerr, J.; Carlson, J.; Godbole, S.; Cadmus-Bertram, L.; Bellettiere, J.; Hartman, S. Improving Hip-Worn Accelerometer Estimates of Sitting Using Machine Learning Methods. Med. Sci. Sports Exerc. 2018, 50, 1518–1524. [Google Scholar] [CrossRef]
- Bergman, F.; Wahlström, V.; Stomby, A.; Otten, J.; Lanthén, E.; Renklint, R.; Waling, M.; Sörlin, A.; Boraxbekk, C.-J.; Wennberg, P.; et al. Treadmill workstations in office workers who are overweight or obese: A randomised controlled trial. Lancet Public Health 2018, 3, e523–e535. [Google Scholar] [CrossRef] [Green Version]


| POPAI | activPal | ActiGraph | |||||
|---|---|---|---|---|---|---|---|
| Sedentary Time | Mean [95% CI] | Mean [95% CI] | Bias [95% CI] | [95% LoA] | Mean [95% CI] | Bias [95% CI] | [95% LoA] |
| total | 45.0 [43.4–46.6] | 58.6 [57.0–60.3] | 13.6 * [12.8–14.5] | [5.5–21.8] | 55.1 [53.6–56.7] | 10.1 * [9.3–11.0] | [1.4–18.8] |
| in bouts ≥10 min | 26.5 [24.8–28.3] | 48.5 [46.7–50.2] | 21.9 * [20.5–23.3] | [8.0–35.8] | 33.3 [31.4–35.2] | 6.7 * [6.1–7.4] | [−0.0–13.5] |
| in bouts ≥30 min | 8.6 [7.4–9.8] | 28.6 [27.0–30.1] | 20.0 *, # [18.7–21.3] | [7.3–32.7] | 11.6 [10.3–13.0] | 3.1 *,# [2.7–3.5] | [−1.1–7.2] |
| POPAI | activPal | ActiGraph | |||||
|---|---|---|---|---|---|---|---|
| Mean [95% CI] | Mean [95% CI] | Bias [95% CI] | [95% LoA] | Mean [95% CI] | Bias [95% CI] | [95% LoA] | |
| Number of Sedentary Bouts | |||||||
| total [number per day] | 66.4 [63.3–69.4] | 49.5 [47.3–51.7] | −16.9 *,# [−19.5–−14.2] | [−43.2–9.5] | 83.1 [80.5–85.8] | 16.8 *,# [15.1–18.5] | [−0.1–33.6] |
| bouts ≥10 min [number per day] | 12.0 [11.4–12.6] | 14.9 [14.4–15.5] | 2.9 *,# [2.4–3.5] | [−2.4–8.2] | 14.6 [14.0–15.3] | 2.6 * [2.3–2.9] | [−0.3–5.6] |
| bouts ≥30 min [number per day] | 1.7 (np) [1.5–1.9] | 4.8 (np) [4.6–5.0] | 3.1 * [2.9–3.3] | [0.7–5.5] | 2.3 (np) [2.1–2.6] | 0.6 *,# [0.5–0.7] | [−0.3–1.5] |
| Further Accumulation Pattern Variables | |||||||
| median bout length [minute] | 3.0 (np) [3.0–3.0] | 3.8 (np) [3.5–4.5] | 0.9 *,# [0.6–1.1] | [−1.7–3.4] | 3.0 (np) [3.0–3.0] | −0.5 *,# [−0.6–−0.4] | [−1.8–0.8] |
| % of time spent ≥ median bout length [%] | 89.2 [88.8–89.6] | 94.0 [93.6–94.3] | 4.8 * [4.2–5.3] | [−0.6–10.1] | 91.0 [90.5–91.4] | 1.7 * [1.2–2.2] | [−3.3–6.8] |
| half-life bout duration [minute] | 12.0 (np) [11.0–12.8] | 28.3 (np) [26.9–30.0] | 17.0 *,# [16.0–18.0] | [7.0–27.0] | 12.0 (np) [11.0–13.0] | 0.5 * [0.1–0.8] | [−3.1–4.0] |
| Gini-Coefficient [unit less] | 0.17 [0.16–0.18] | 0.22 [0.20–0.23] | 0.05 *,# [0.04–0.05] | [−0.05–0.14] | 0.17 [0.17–0.18] | 0.00 [−0.00–0.01] | [−0.05–0.06] |
Publisher’s Note: MDPI stays neutral with regard to jurisdictional claims in published maps and institutional affiliations. |
© 2020 by the authors. Licensee MDPI, Basel, Switzerland. This article is an open access article distributed under the terms and conditions of the Creative Commons Attribution (CC BY) license (http://creativecommons.org/licenses/by/4.0/).
Share and Cite
Kuster, R.P.; Grooten, W.J.A.; Blom, V.; Baumgartner, D.; Hagströmer, M.; Ekblom, Ö. Is Sitting Always Inactive and Standing Always Active? A Simultaneous Free-Living activPal and ActiGraph Analysis. Int. J. Environ. Res. Public Health 2020, 17, 8864. https://doi.org/10.3390/ijerph17238864
Kuster RP, Grooten WJA, Blom V, Baumgartner D, Hagströmer M, Ekblom Ö. Is Sitting Always Inactive and Standing Always Active? A Simultaneous Free-Living activPal and ActiGraph Analysis. International Journal of Environmental Research and Public Health. 2020; 17(23):8864. https://doi.org/10.3390/ijerph17238864
Chicago/Turabian StyleKuster, Roman P., Wilhelmus J. A. Grooten, Victoria Blom, Daniel Baumgartner, Maria Hagströmer, and Örjan Ekblom. 2020. "Is Sitting Always Inactive and Standing Always Active? A Simultaneous Free-Living activPal and ActiGraph Analysis" International Journal of Environmental Research and Public Health 17, no. 23: 8864. https://doi.org/10.3390/ijerph17238864