Learning Abilities in a Population of Italian Healthy Preterm Children at the End of Primary School

 , ,
, ,
Abstract
:1. Introduction
2. Methods
2.1. Participants
2.2. Procedures
2.3. Statistical Analysis
3. Results
3.1. Learning Abilities
3.2. Neurocognitive Abilities
3.3. Correlations between Learning Abilities and Neurocognitive Profiles
3.4. Learning Profiles and Comorbidities
4. Discussion
4.1. Learning Abilities
4.2. Cognitive Profile and Neurocognitive Abilities
4.3. Correlations between Learning Abilities and Neurocognitive Abilities
4.4. Proportion of Impaired Children
5. Conclusions
Author Contributions
Funding
Acknowledgments
Conflicts of Interest
Appendix A
Appendix A.1. Learning Abilities
Appendix A.1.1. Reading
Battery for Dyslexia and Developmental Dysorthography
Cornoldi MT Battery
Appendix A.1.2. Writing
Battery for Dyslexia and Developmental Dysorthography
Appendix A.1.3. Mathematics
AC-MT Test
BDE Test
Appendix A.2. Cognitive Area
Appendix A.2.1. Wechsler Intelligence Scale for Children III
Appendix A.2.2. Raven’s Colored Progressive Matrices
Appendix A.3. Neurocognitive Area
Appendix A.3.1. Spatial Abilities
Visual-Motor Integration Test
Appendix A.3.2. Attention and Visual Processing
Bell Test
Appendix A.3.3. Short-Term Memory
Digit Span
Corsi’s Block Tapping
Appendix B

| Learning Skill | Sub-Skill | Raw Score (Mean ±SD) | ||
|---|---|---|---|---|
| Extremely Preterm | Very Preterm | Normative Sample | ||
| Reading | Text speed (Sill/sec) | |||
| Entrance Test | 3.13 ± 0.46 | 2.85 ± 0.93 | 2.90 ± 1.10 | |
| Intermediate Test | 1.75 | 2.10 ± 1.41 | 2.99 ± 1.10 | |
| Final Test | 2.86 ± 0.17 | 2.34 ± 0.10 | 3.35 ± 1.10 | |
| Text accuracy (Errors) | ||||
| Entrance Test | 1.00 ± 1.00 | 2.28 ± 2.21 | 4.90 ± 5.10 | |
| Intermediate Test | 4.00 | 2.17 ± 2.64 | 4.90 ± 5.00 | |
| Final Test | 4 ± 0.00 | 2.33 ± 3.21 | 4.10 ± 4.20 | |
| Text comprehension (Correct answers) | ||||
| Entrance Test | 6.3 ± 2.08 | 8.5 ± 2.07 | 6.40 ± 2.70 | |
| Intermediate Test | 8.00 | 7.75 ± 2.06 | 7.30 ± 2.00 | |
| Final Test | 9.00 ± 0.00 | 9.33 ± 1.15 | 7.70 ± 4.80 | |
| Word speed (Sill/s) | 2.32 ± 0.71 | 2.13 ± 0.54 | 2.20 ± 0.70 | |
| Word accuracy (Errors) | 4.80 ± 3.27 | 3.90 ± 1.71 | 5.00 ± 4.00 | |
| Non-word speed (Sill/sec) | 1.42 ± 0.38 | 1.31 ± 0.34 | 1.40 ± 0.40 | |
| Non-word accuracy (Errors) | 8.67 ± 1.15 | 4.75 ± 3.20 | 6.00 ± 5.00 | |
| Spelling | Word accuracy (Errors) | 3.66 ± 4.04 | 2.50 ± 1.24 | 2.00 ± 2.00 |
| Non-word accuracy (Errors) | 3.00 ± 2.83 | 1.40 ± 1.14 | 4.00 ± 3.00 | |
| Mathematics | Final Test | |||
| AC-MT written calculation (Correct answers) | --- | 5.60 ± 2.07 | 6.51 ± 1.79 | |
| AC-MT numerical knowledge (Correct answers) | --- | 20.80 ± 1.30 | 19.36 ± 4.00 | |
| AC-MT accuracy (Errors) | --- | 3.80 ± 2.59 | 5.80 ± 5.60 | |
| AC-MT speed (Sec) | --- | 124.00 ± 41.25 | 151.08 ± 90.33 | |
| Battery for Developmental Dyscalculia | 81.20 ± 17.20 | 88.50 ± 18.88 | 100.00 ± 15.00 | |
| Learning Skill | Sub-Skill | Raw Score (Mean ±SD) | ||
|---|---|---|---|---|
| Extremely Preterm | Very Preterm | Normative SAMPLE | ||
| Reading | Text speed (Sill/sec) | |||
| Entrance Test | 3.07 ± 1.67 | 3.12 ± 0.88 | 2.50 ± 0.66 | |
| Final Test | 2.10 ± 0.00 | 3.43 ± 2.02 | 2.10 ± 0.00 | |
| Text accuracy (Errors) | ||||
| Entrance Test | 3.12 ± 1.75 | 3.50 ± 2.54 | 5.00 ± 5.10 | |
| Final Test | 9.00 ± 0.00 | 2.75 ± 2.68 | 3.60 ± 4.00 | |
| Text comprehension (Correct answers) | ||||
| Entrance Test | 7.00 ± 2.16 | 8.20 ± 1.14 | 7.20 ± 2.40 | |
| Final Test | --- | 9.17 ± 1.17 | 8.40 ± 5.70 | |
| Word speed (Sill/sec) | 2.49 ± 1.40 | 2.60 ± 1.23 | 2.70 ± 0.70 | |
| Word accuracy (Errors) | 5.40 ± 5.41 | 3.36 ± 2.79 | 3.00 ± 3.00 | |
| Non-word speed (Sill/sec) | 1.27 ± 0.45 | 1.61 ± 0.45 | 1.70 ± 5.00 | |
| Non-word accuracy (Errors) | 10.40 ± 8.45 | 6.21 ± 4.65 | 5.00 ± 4.00 | |
| Spelling | Word accuracy (Errors) | 3.00 ± 2.00 | 1.74 ± 2.07 | 1.00 ± 2.00 |
| Non-word accuracy (Errors) | 4.00 ± 2.00 | 3.50 ± 2.87 | 3.00 ± 2.00 | |
| Mathematics | AC-MT written calculation (Correct answers) | |||
| Entrance Test | 4.00 ± 4.24 | 5 ± 1.55 | 6.34 ± 1.60 | |
| Final Test | --- | 7.00 | 6.62 ± 1.47 | |
| AC-MT numerical knowledge (Correct answers) | ||||
| Entrance Test | 17.50 ± 3.53 | 17.33 ± 2.06 | 18.25 ± 3.44 | |
| Final Test | --- | 18.00 | 18.09 ± 3.63 | |
| AC-MT accuracy (Errors) | ||||
| Entrance Test | 13.00 ± 7.07 | 7.50 ± 3.45 | 6.38 ± 4.94 | |
| Final Test | --- | 15.00 | 5.69 ± 4.43 | |
| AC-MT speed (Sec) | ||||
| Entrance Test | 84 | 130.50 ± 38.10 | 117.54 ± 32.68 | |
| Final Test | --- | 189.00 | 130.77 ± 53.52 | |
| Battery for Developmental Dyscalculia | 88 | 105.78 ± 12.97 | 100.00 ± 15.00 | |
| Learning Skill | Sub-Skill | Raw Score (Mean ±SD) | ||
|---|---|---|---|---|
| Extremely Preterm | Very Preterm | Normative Sample | ||
| Reading | Text speed (Sill/sec) | |||
| Entrance Test | 2.43 ± 2.11 | 3.73 ± 1.11 | 3.77 ± 1.25 | |
| Final Test | 3.06 ± 1.55 | 3.20 ± 0.76 | 3.69 ± 1.12 | |
| Text accuracy (Errors) | ||||
| Entrance Test | 5.00 ± 1.41 | 3.44 ± 2.88 | 5.9 ± 6.2 | |
| Final Test | 6.17 ± 5.74 | 5.57 ± 4.55 | 5.7 ± 5.9 | |
| Text comprehension (Correct answers) | ||||
| Entrance Test | 9.00 ± 0.00 | 9.00 ± 1.51 | 7.6 ± 2.2 | |
| Final Test | 8.00 ± 1.09 | 6.14 ± 1.95 | 7.9 ± 1.8 | |
| Word speed (Sill/sec) | 3.13 ± 1.39 | 2.62 ± 1.31 | 3.20 ± 0.80 | |
| Word accuracy (Errors) | 3.22 ± 4.10 | 2.29 ± 2.33 | 3.00 ± 3.00 | |
| Non-word speed (Sill/sec) | 1.92 ± 1.00 | 1.78 ± 0.44 | 2.00 ± 0.60 | |
| Non-word accuracy (Errors) | 5.90 ± 7.92 | 3.09 ± 3.62 | 5.00 ± 4.00 | |
| Spelling | Word accuracy (Errors) | 2.89 ± 3.29 | 2.66 ± 3.79 | 1.00 ± 1.00 |
| Non-word accuracy (Errors) | 2.33 ± 1.15 | 3.10 ± 2.18 | 3.00 ± 3.00 | |
| Mathematics | Entrance Test | |||
| AC-MT written calculation (Correct answers) | 6.42 | 7.40 ± 0.89 | 6.45 ± 1.49 | |
| AC-MT numerical knowledge (Correct answers) | 17.7 | 20.40 ± 2.07 | 18.38 ± 3.66 | |
| AC-MT accuracy (Errors) | 5.8 | 5.00 ± 5.66 | 5.75 ± 4.29 | |
| AC-MT speed (Sec) | 140 | 106.20 ± 43.37 | 120.7 ± 46.50 | |
| Battery for Developmental Dyscalculia | 85.33 ± 28.84 | 94.22 ± 23.63 | 100.00 ± 15.00 | |
| Neurocognitive Skill | Sub-Skill | Mean ±SD | |||
|---|---|---|---|---|---|
| Extremely Preterm | Very Preterm | Normative Sample | |||
| Visual-motor integration (Standard Score) | Total | Years | |||
| 8.00-8.11 | 93.20 ± 13.14 | 97.56 ± 13.52 | 100.00 ± 15.00 | ||
| 9.00-9.11 | 100.75 ± 6.50 | 99.17 ± 14.62 | 100.00 ± 15.00 | ||
| 10.00-10.11 | 101.30 ± 10.91 | 98.00 ± 11.79 | 100.00 ± 15.00 | ||
| Visual processing | |||||
| 8.00-8.11 | 110.17 ± 18.71 | 100.08 ± 17.19 | 100.00 ± 15.00 | ||
| 9.00-9.11 | 92.00 ± 10.55 | 95.39 ± 15.80 | 100.00 ± 15.00 | ||
| 10.00-10.11 | 104.00 ± 18.32 | 98.63 ± 15.06 | 100.00 ± 15.00 | ||
| Motor coordination | |||||
| 8.00-8.11 | 96.40 ± 5.41 | 105.45 ± 19.35 | 100.00 ± 15.00 | ||
| 9.00-9.11 | 100.50 ± 17.60 | 101.26 ± 17.13 | 100.00 ± 15.00 | ||
| 10.00-10.11 | 98.50 ± 14.45 | 104.00 ± 11.01 | 100.00 ± 15.00 | ||
| Attention and visual processing (Raw score) | Selective | ||||
| 8.00-8.11 | 48.80 ± 11.77 | 49.57 ± 9.76 | 49.30 ± 9.80 | ||
| 9.00-9.11 | 47.33 ± 14.29 | 54.95 ± 7.87 | 54.00 ± 10.00 | ||
| 10.00-10.11 | 58.37 ± 10.36 | 59.42 ± 16.06 | 59.30 ± 14.70 | ||
| Sustained | |||||
| 8.00-8.11 | 116.00 ± 9.22 | 117.57 ± 10.11 | 119.20 ± 10.2 | ||
| 9.00-9.11 | 117.66 ± 10.70 | 119.95 ± 1.07 | 124.30 ± 8.60 | ||
| 10.00-10.11 | 121.75 ± 11.23 | 125.83 ± 10.82 | 128.10 ± 9.10 | ||
| Short-term memory (Span) | Verbal | ||||
| 8.00-8.11 | 4.17 ± 0.75 | 4.33 ± 0.65 | 4.50 ± 1.10 | ||
| 9.00-9.11 | 5.25 ± 1.26 | 4.91 ± 1.23 | 4.80 ± 1.10 | ||
| 10.00-10.11 | 4.70 ± 0.67 | 4.88 ± 0.88 | 5.40 ± 2.10 | ||
| Visuospatial | |||||
| 8.00-8.11 | 4.00 ± 0.00 | 4.00 ± 0.43 | 4.30 ± 0.90 | ||
| 9.00-9.11 | 4.50 ± 1.00 | 4.60 ± 1.14 | 4.60 ± 0.80 | ||
| 10.00-10.11 | 4.80 ± 0.79 | 5.31 ± 0.95 | 4.80 ± 0.80 | ||
References
- Brydges, C.R.; Landes, J.K.; Reid, C.L.; Campbell, C.; French, N.; Anderson, M. Cognitive outcomes in children and adolescents born very preterm: A meta-analysis. Dev. Med. Child. Neurol. 2018, 60, 452–468. [Google Scholar] [CrossRef] [PubMed]
- Johnson, S.; Marlow, N. Early and long-term outcome of infants born extremely preterm. Arch. Dis. Child. 2017, 102, 97–102. [Google Scholar] [CrossRef] [PubMed] [Green Version]
- Allen, M.C. Neurodevelopmental outcomes of preterm infants. Curr. Opin. Neurol. 2008, 21, 123–128. [Google Scholar] [CrossRef] [PubMed]
- Bhutta, A.T.; Cleves, M.A.; Casey, P.H.; Cradock, M.M.; Anand, K.J. Cognitive and Behavioral Outcomes of School-Aged Children Who Were Born Preterm. JAMA 2002, 288, 728–737. [Google Scholar] [CrossRef]
- Pietz, J.; Peter, J.; Graf, R.; Rauterberg-Ruland, I.; Rupp, A.; Sontheimer, D.; Linderkamp, O. Physical growth and neurodevelopmental outcome of non-handicapped low-risk children born preterm. Early Hum. Dev. 2004, 79, 131–143. [Google Scholar] [CrossRef]
- Salt, A.; Redshaw, M. Neurodevelopmental follow-up after preterm birth: Follow up after two years. Early Hum. Dev. 2006, 82, 185–197. [Google Scholar] [CrossRef]
- Sansavini, A.; Guarini, A. Nascita pretermine e sviluppo cognitivo e linguistico. In Neuropsicologia Dello Sviluppo, 1st ed.; Vicari, S., Caselli, M.C., Eds.; Il Mulino: Bologna, Italy, 2010; pp. 281–292. [Google Scholar]
- Sansavini, A.; Guarini, A.; Alessandroni, R.; Faldella, G.; Giovanelli, G.; Salvioli, G. Early relations between lexical and grammatical development in very immature Italian preterms. J. Child. Lang. 2006, 33, 199–216. [Google Scholar] [CrossRef]
- Sansavini, A.; Guarini, A.; Alessandroni, R.; Faldella, G.; Giovanelli, G.; Salvioli, G. Are early grammatical and phonological working memory abilities affected by preterm birth? Int. J. Lang. Comm. Dis. 2007, 40, 239–256. [Google Scholar] [CrossRef]
- Sansavini, A.; Guarini, A.; Justice, L.M.; Savini, S.; Broccoli, S.; Alessandroni, R.; Faldella, G. Does preterm birth increase a child’s risk for language impairment? Early Hum. Dev. 2010, 86, 765–772. [Google Scholar] [CrossRef]
- Dall’Oglio, A.M.; Rossiello, B.; Coletti, M.F.; Bultrini, M.; De Marchis, C.; Ravà, L.; Caselli, M.C.; Paris, S.; Cuttini, M. Do Healthy Preterm Children Need Neuropsychological Follow-up? Preschool Outcomes Compared with Term Peers. Dev. Med. Child Neurol. 2010, 52, 955–996. [Google Scholar] [CrossRef]
- Johnson, S.; Wolke, D.; Hennessy, E.; Marlow, N. Educational Outcomes in Extremely Preterm Children: Neuropsychological Correlates and Predictors of Attainment. Dev. Neuropsychol. 2011, 36, 74–95. [Google Scholar] [CrossRef] [PubMed]
- Sansavini, A.; Guarini, A.; Caselli, M.C. Preterm birth: Neuropsychological profiles and atypical developmental pathways. Dev. Disabil. Res. Rev. 2011, 17, 102–113. [Google Scholar] [CrossRef] [PubMed]
- Kovachy, V.N.; Adams, J.N.; Tamaresis, J.S.; Feldman, H.M. Reading abilities in school-aged preterm children: A review and meta-analysis. Dev. Med. Child Neurol. 2015, 57, 410–419. [Google Scholar] [CrossRef] [Green Version]
- Guarini, A.; Sansavini, A.; Fabbri, C.; Faldella, G.; Karmiloff-Smith, A. Reconsidering the impact of preterm birth on language outcome. Early Hum. Dev. 2009, 85, 639–645. [Google Scholar] [CrossRef] [PubMed]
- Guarini, A.; Sansavini, A.; Fabbri, C.; Savini, S.; Alessandroni, R.; Faldella, G.; Karmiloff-Smith, A. Long-term effects of preterm birth on language and literacy at eight years. J. Child Lang. 2010, 37, 865–885. [Google Scholar] [CrossRef] [PubMed]
- Alamiri, B.; Nelson, C.; Fitzmaurice, G.M.; Murphy, J.M.; Gilman, S.E. Neurological soft signs and cognitive performance in early childhood. Dev. Psychol. 2018, 54, 2043–2052. [Google Scholar] [CrossRef] [PubMed]
- Johnson, S.; Strauss, V.; Gilmore, C.; Jaekel, J.; Marlow, N.; Wolke, D. Learning disabilities among extremely preterm children without neurosensory impairment: Comorbidity, neuropsychological profiles and scholastic outcomes. Early Hum. Dev. 2016, 103, 69–75. [Google Scholar] [CrossRef] [Green Version]
- Karmiloff-Smith, A. Development itself is the key to understanding developmental disorders. Trends Cogn. Sci. 1998, 10, 389–398. [Google Scholar] [CrossRef]
- Karmiloff-Smith, A. Nativism vs. neuroconstructivism: Rethinking the study of developmental disorders. Dev. Psychol. 2009, 45, 56–63. [Google Scholar] [CrossRef]
- Grunau, R.E.; Whitfield, M.F.; Davis, C. Pattern of learning disabilities in children with extremely low birth weight and broadly average intelligence. Arch. Pediatr. Adolesc. Med. 2002, 156, 615–620. [Google Scholar] [CrossRef] [Green Version]
- Aarnoudse-Moens, C.S.H.; Weisglas-Kuperus, N.; van Goudoever, J.B.; Oosterlaan, J. Meta-analysis of neurobehavioral outcomes in very preterm and/or very low birth weight children. Pediatrics 2009, 124, 717–728. [Google Scholar] [CrossRef] [PubMed]
- Mento, G.; Bisiacchi, P.S. Sviluppo neuro-cognitivo in nati pretermine: La prospettiva delle Neuroscienze cognitive dello sviluppo. Psicol. Clin. Dello Svilupp. 2013, 17, 27–44. [Google Scholar] [CrossRef]
- Guarini, A.; Sansavini, A.; Fabbri, M.; Alessandroni, R.; Faldella, G.; Karmiloff-Smith, A. Basic numerical processes in very preterm children: A critical transition from preschool to school age. Early Hum. Dev. 2014, 90, 103–111. [Google Scholar] [CrossRef] [PubMed]
- Simms, V.; Cragg, L.; Gilmore, C.; Marlow, N.; Johnson, S. Mathematics difficulties in children born very preterm: Current research and future directions. Arch. Dis. Child. Fetal Neonatal 2013, 98, 457–463. [Google Scholar] [CrossRef] [Green Version]
- Guarini, A.; Bonifacci, P.; Tobia, V.; Alessandroni, R.; Faldella, G.; Sansavini, A. The profile of very preterm children on academic achievement. A cross-population comparison with children with specific learning disorders. Res. Dev. Disabil. 2019, 87, 54–63. [Google Scholar] [CrossRef]
- Consensus Conference, Italia. Legge 8 ottobre 2010, n. 170. Nuove Norme in Materia di Disturbi Specifici di Apprendimento in Ambito Scolastico; Gazzetta Ufficiale Serie Generale, n. 244; Le Monnier: Rome, Italy 18 October 2010. Available online: https://sostegnobes.com/wp-content/uploads/2013/06/dsa_annalidellapubblicaistruzione.pdf#page=87 (accessed on 18 October 2020).
- Istituto Superiore di Sanità. Disturbi Specifici dell’Apprendimento, Sistema Nazionale per le Linee Guida. Ministero Della Salute. 2011. Available online: http://www.aidtalia.org/Media/Documents/consensus/Cc_Disturbi_Apprendimento.pdf (accessed on 12 July 2011).
- Barbiero, C.; Montico, M.; Lonciari, I.; Monasta, L.; Penge, R.; Vio, C.; Tressoldi, P.E.; Carrozzi, M.; De Petris, A.; Crescenzi, F.; et al. The lost children: The underdiagnosis of dyslexia in Italy. A cross-sectional national study. PLoS ONE 2019, 14, e0210448. [Google Scholar] [CrossRef] [Green Version]
- Menghini, D.; Finzi, A.; Benassi, M.; Bolzani, R.; Facoetti, A.; Giovagnoli, S.; Ruffino, M.; Vicari, S. Different underlying neurocognitive deficits in developmental dyslexia: A comparative study. Neuropsychologia 2010, 48, 863–872. [Google Scholar] [CrossRef]
- Giovagnoli, G.; Vicari, S.; Tomassetti, S.; Menghini, D. The Role of Visual-Spatial Abilities in Dyslexia: Age Differences in Children’s Reading? Front. Psychol. 2016. [Google Scholar] [CrossRef] [Green Version]
- American Psychiatric Association. DSM-5 Diagnostic and Statistical Manual of Mental Disorders Fifth Edition (DSM-5®); Trad. it. DSM-5. Manuale Diagnostico e Statistico dei Disturbi Mentali; American Psychiatric Pub: Washington, WA, USA, 2013; Raffaello Cortina: Milano, Italy, 2014. [Google Scholar]
- Alloway, T.P.; Horton, J. Gestational age and learning disabilities. Dev. Med. Child Neurol. 2015, 57, 401. [Google Scholar] [CrossRef] [Green Version]
- Wocadlo, C.; Rieger, I. Educational and therapeutic resource dependency at early school-age in children who were born very preterm. Early Hum. Dev. 2006, 82, 29–37. [Google Scholar] [CrossRef]
- Rodrigues, M.C.; Mello, R.R.; Fonseca, S.C. Learning difficulties in schoolchildren born with very low birth weight. J. Pediatr. (Rio J.) 2006, 82, 6–14. [Google Scholar] [CrossRef] [PubMed] [Green Version]
- Saigal, S.; Hoult, L.; Streiner, D.L.; Stoskopf, B.L.; Rosenbaum, P. School difficulties at adolescence in a regional cohort of children who were extremely low birth weight. Pediatrics 2000, 105, 325–331. [Google Scholar] [CrossRef] [PubMed]
- Chyi, L.J.; Lee, H.C.; Hintz, S.R.; Gould, J.B.; Sutcliffe, T.L. School outcome of late preterm infants: Special needs and challenges for infants born at 32 to 36 weeks gestation. J. Pediatr. 2008, 153, 25–31. [Google Scholar] [CrossRef] [PubMed]
- Sullivan, M.C.; McGrath, M.M. Perinatal morbidity, mild motor delay, and later school outcomes. Dev. Med. Child Neurol. 2003, 45, 104–112. [Google Scholar] [CrossRef] [PubMed]
- Rose, S.A.; Feldman, J.F.; Jankowski, J.J. Modeling a cascade of effects: The role of speed and executive functioning in preterm/full-term differences in academic achievement. Dev. Sci. 2011, 14, 1161–1175. [Google Scholar] [CrossRef] [PubMed]
- Orsolini, M.; Fanari, R.; Tosi, V.; De Nigris, B.; Carrieri, R. From phonological recoding to lexical reading: A longitudinal study on reading development in Italian. Lang. Cogn. Proc. 2006, 21, 576–607. [Google Scholar] [CrossRef]
- Sartori, G.; Job, R.; Tressoldi, P.E. Batteria per la Valutazione della Dislessia e della Disortografia Evolutiva; Organizzazioni Speciali: Firenze, Italy, 1995. [Google Scholar]
- Lorusso, M.L.; Vernice, M.; Dieterich, M.; Brizzolara, D.; Mariani, E.; De Masi, S.; D’Angelo, F.; Lacorte, E.; Mele, A. The process and criteria for diagnosing specific learning disorders: Indications from the Consensus Conference promoted by the Italian National Institute of Health. Ann. Ist. Super. Sanita 2014, 50, 77–89. [Google Scholar] [CrossRef]
- Spencer, L.; Hanley, J.R. Effects of orthographic transparency on reading and phoneme awareness in children learning to read in Wales. Br. J. Psychol. 2003, 94, 1–28. [Google Scholar] [CrossRef]
- Sansavini, A.; Guarini, A. Nascita pretermine e sviluppo neuropsicologico. In Neuropsicologia dell’età Evolutiva; Vicari, S., Caselli, M.C., Eds.; Il Mulino: Bologna, Italy, 2017; pp. 243–255. [Google Scholar]
- Papile, L.A.; Burstein, J.; Burstein, R.; Koffler, H. Incidence and evolu-tion of subependymal and intraventricular hemorrhage: A study of infants with birthweights less than 1500 gm. J. Pediatr. 1978, 92, 529–534. [Google Scholar] [CrossRef]
- Saavalainen, M.P.; Luoma, L.; Laukkanen, E.; Bowler, D.E.; Maatta, S.; Kiviniemi, H.V. School performance of adolescents born preterm: Neuropsychological and background correlates. Eur. J. Paediatr. Neurol. 2008, 12, 246–252. [Google Scholar] [CrossRef]
- Twilhaar, E.S.; de Kieviet, J.F.; van Elburg, R.M.; Oosterlaan, J. Academic trajectories of very preterm born children at school age. Arch. Dis. Child. Fetal Neonatal Ed. 2019, 104, F419–F423. [Google Scholar] [CrossRef] [PubMed]
- American Psychiatric Association. Diagnostic and Statistical Manual of Mental Disorders DSM-IV-TR, 4th ed.; American Psychiatric Association: Washington, DC, USA, 2000. [Google Scholar]
- World Health Organisation. ICD-10: International Statistical Classification of Diseases and Related Health Problems, 10th ed.; World Health Organisation: Geneva, Switzerland, 2008. [Google Scholar]
- Cornoldi, C.; Tressoldi, P. Linee guida per la diagnosi dei profili di dislessia e disortografia previsti dalla legge 170: Invito a un dibattito. Psicol. Clin. Dello Svilupp. 2014, 1, 75–142. [Google Scholar]
- Sansavini, A.; Simion, F. Aumento delle diagnosi di Disturbi Specifici dell’Apprendimento in Italia: Quali fattori concorrono nel determinare tale aumento? Proposta di discussione. Psicol. Clin. Dello Svilupp. 2019, 23, 265–282. [Google Scholar] [CrossRef]
- Twilhaar, E.S.; de Kieviet, J.F.; Aarnoudse-Moens, C.S.; van Elburg, R.M.; Oosterlaan, J. Academic performance of children born preterm: A meta-analysis and meta-regression. Arch. Dis. Child Fetal Neonatal Ed. 2018, 103, 322–330. [Google Scholar] [CrossRef] [Green Version]
- Aylward, G.P. Neurodevelopmental outcomes of infants born prematurely. J. Dev. Behav. Pediatr. 2005, 26, 427–440. [Google Scholar] [CrossRef] [PubMed]
- Pérez-Pereira, M.; Fernández, M.P.; Gómez-Taibo, M.L.; Martínez-López, Z.; Arce, C. A Follow-Up Study of Cognitive Development in Low Risk Preterm Children. Int. J. Environ. Res. Public Health 2020, 17, 2380. [Google Scholar] [CrossRef] [PubMed] [Green Version]
- Mürner-Lavanchy, I.; Ritter, B.C.; Spencer-Smith, M.M.; Perrig, W.J.; Schroth, G.; Steinlin, M.; Everts, R. Visuospatial working memory in very preterm and term born children--impact of age and performance. Dev. Cogn. Neurosci. 2014, 9, 106–116. [Google Scholar] [CrossRef] [Green Version]
- Menghini, D.; Facoetti, A.; Costanzo, F.; Franceschini, S.; Gori, S.; Vicari, S. I disturbi specifici di apprendimento. In Neuropsicologia dell’età Evolutiva; Vicari, S., Caselli, M.C., Eds.; Il Mulino: Bologna, Italy, 2017; pp. 123–133. [Google Scholar]
- National Guideline Alliance, hosted by the Royal College of Obstetricians and Gynaecologists. Developmental follow-up of children and young people born preterm. Information, support and developmental surveillance. Full Guideline. In NICE Guideline Methods, Evidence and Recommendations; National Instiutue for Health and Care Excellence: London, UK, 2017. [Google Scholar]
- Arpi, E.; D’Amico, R.; Lucaccioni, L.; Bedetti, L.; Berardi, A.; Ferrari, F. Worse global intellectual and worse neuropsychological functioning in preterm-born children at preschool age: A meta-analysis. Acta Paediatr. 2019, 108, 1567–1579. [Google Scholar] [CrossRef]
- Zoccolotti, P.; Di Filippo, G.; Trenta, M. Quanti bambini con DSA? E’ possibile identificarli in modo attendibile? Psicol. Clin. Dello Svilupp. 2020, 24, 113–116. [Google Scholar] [CrossRef]
- Bevilacqua, F.; Giannantoni, P.; Pasqualetti, P.; di Ciommo, V.; Coletti, M.F.; Ravà, L.; Caselli, M.C.; Dall’Oglio, A.M. Predictive validity of the Italian parental questionnaire for developmental evaluation at age 4 (QS4-G). J. Paediatr. Child. Health 2015, 51, 600–607. [Google Scholar] [CrossRef]
- Dall’Oglio, A.M.; Rossiello, B.; Coletti, M.F.; Caselli, M.C.; Ravà, L.; di Ciommo, V.; Orzalesi, M.; Giannantoni, P.; Pasqualetti, P. Developmental evaluation at age 4: Validity of an Italian parental questionnaire. J. Paediatr. Child. Health 2010, 46, 419–426. [Google Scholar] [CrossRef] [PubMed]
- Pritchard, V.E.; Clark, C.A.; Liberty, K.; Champion, P.R.; Wilson, K.; Woodward, L.J. Early school-based learning difficulties in children born very preterm. Early Hum. Dev. 2009, 85, 215–224. [Google Scholar] [CrossRef] [PubMed]
- Cornoldi, C.; Russo, M.R.; Tucci, R.; Tressoldi, P.E.; Vio, C.; Bilancia, G.; Di Brina, C.; Borean, M.; Bravar, L.; Zoia, S.; et al. Criteri per la diagnosi di disgrafia: Una proposta del gruppo di lavoro AIRIPA. In Diagnosi dei Disturbi dell’Apprendimento Scolastico; Vio, C., Tressoldi, P.E., Lo Presti, G., Eds.; Erickson: Trento, Italy, 2012; pp. 211–215. [Google Scholar]
- De-Kievet, J.F.; Piek, J.P.; Aarnoudse-Moens, C.S.; Oosterlaan, J. Motor development in very pre- term and very low-birth-weight children from birth to adolescence. A meta-analysis. JAMA 2009, 302, 2235–2242. [Google Scholar] [CrossRef] [PubMed]
- Jaekel, J.; Wolke, D. Preterm birth and dyscalculia. J. Pediatr. 2014, 164, 1327–1332. [Google Scholar] [CrossRef]
- Tucci, R.; Cendron, M.; Vio, C. Il problema delle diagnosi dimensionali tra clinica ed esigenze scolastiche. Psicol. Clin. Dello Svilupp. 2020, 24, 107–112. [Google Scholar]
- Johnson, S.; Hennessy, E.; Smith, R.; Trikic, R.; Wolke, D.; Marlow, N. Academic attainment and special educational needs in extremely preterm children at 11 years. The EPICure Study. Arch. Dis. Child. Fetal Neonatal Ed. 2009, 94, 283–289. [Google Scholar] [CrossRef]
- Bonnie, E.S.; Vohr, B.R. Neurodevelopmental Outcome of the premature Infant. Pediatric Clin. N. Am. 2009, 56, 631–646. [Google Scholar] [CrossRef]
- Marret, S.; Marchand-Martin, L.; Picaud, J.C.; Hascoët, J.-M.; Arnaud, C.; Rozé, J.-C.; Truffert, P.; Larroque, B.; Kaminski, M.; Ancel, P.-Y.; et al. EPIPAGE Study Group. Brain injury in very preterm children and neurosensory and cognitive disabilities during childhood: The EPIPAGE cohort study. PLoS ONE 2013, 8, e62683. [Google Scholar] [CrossRef] [Green Version]
- Flynn, J.R. Searching for justice: The discovery of IQ gains over time. Am. Psychol. 1999, 54, 5–20. [Google Scholar] [CrossRef]
- Lindström, K.; Lindblad, F.; Hjern, A. Psychiatric morbidity in adolescents and young adults born preterm: A Swedish national cohort study. Pediatrics 2009, 123, 47–53. [Google Scholar] [CrossRef]


| Clinical Characteristic | Extremely Preterm | Very Preterm | p |
|---|---|---|---|
| N = 22 | N = 60 | ||
| Gender (males) [n (%)] | 11 (50.0) | 36 (60.0) | NS |
| Gestational age (week) (mean ± SD) | 26.4 ± 1.06 | 30.3 ± 1.36 | 0.00 |
| Birth weight (g) (mean ± SD) | 955.4 ± 208.8 | 1387 ± 371.87 | 0.00 |
| Age (mean ± SD) | 9.43 ± 1.26 | 9.44 ± 0.82 | NS |
| Mother’s education level (mean ± SD) | 13.71±3.01 | 13.47 ± 3.81 | NS |
| Father’s education level (mean ± SD) | 13.24 ± 4.06 | 12.7 ± 3.76 | NS |
| Mother’s Age (mean ± SD) | 41.3±6.1 | 40.2 ± 7.4 | NS |
| Father’s Age (mean ± SD) | 44.2±5.2 | 43.8 ± 4.4 | NS |
| School support [n (%)] | 6 (27.3) | 18 (30.0) | NS |
| Therapeutic interventions [n (%)] | 10 (45.5) | 27 (45.0) | NS |
| Target | Test | Reference |
|---|---|---|
| Learning abilities | ||
| Reading (speed, accuracy, comprehension) | Cornoldi Memory and Training (MT) | Cornoldi and Colpo, 2010 |
| Battery for Dyslexia and Developmental Dysorthography | Sartori et al., 1995 | |
| Writing (dictation of words and non-words) | Battery for Dyslexia and Developmental Dysorthography | Sartori et al., 1995 |
| Maths | Cornoldi Calculation Ability (AC-MT) | Cornoldi et al., 2002 |
| Battery for Developmental Dyscalculia (BDE) | Biancardi and Nicoletti, 2004 | |
| Cognitive development | Wechsler Intelligence Scale for Children (WISC) III | Weschsler, 2006 |
| Raven’s Coloured Progressive Matrices (CPM) | Raven, J. C., 2006 | |
| Neurocognitive abilities | ||
| Spatial abilities | Visual-Motor Integration Test | Beery et al., 2000 |
| Attention and visual processing | Bell Test | Biancardi, 1997 |
| Short-term memory | Verbal—Digit | Orsini et al., 1987 |
| Spatial—Corsi’s Block Tapping | Orsini et al., 1987 | |
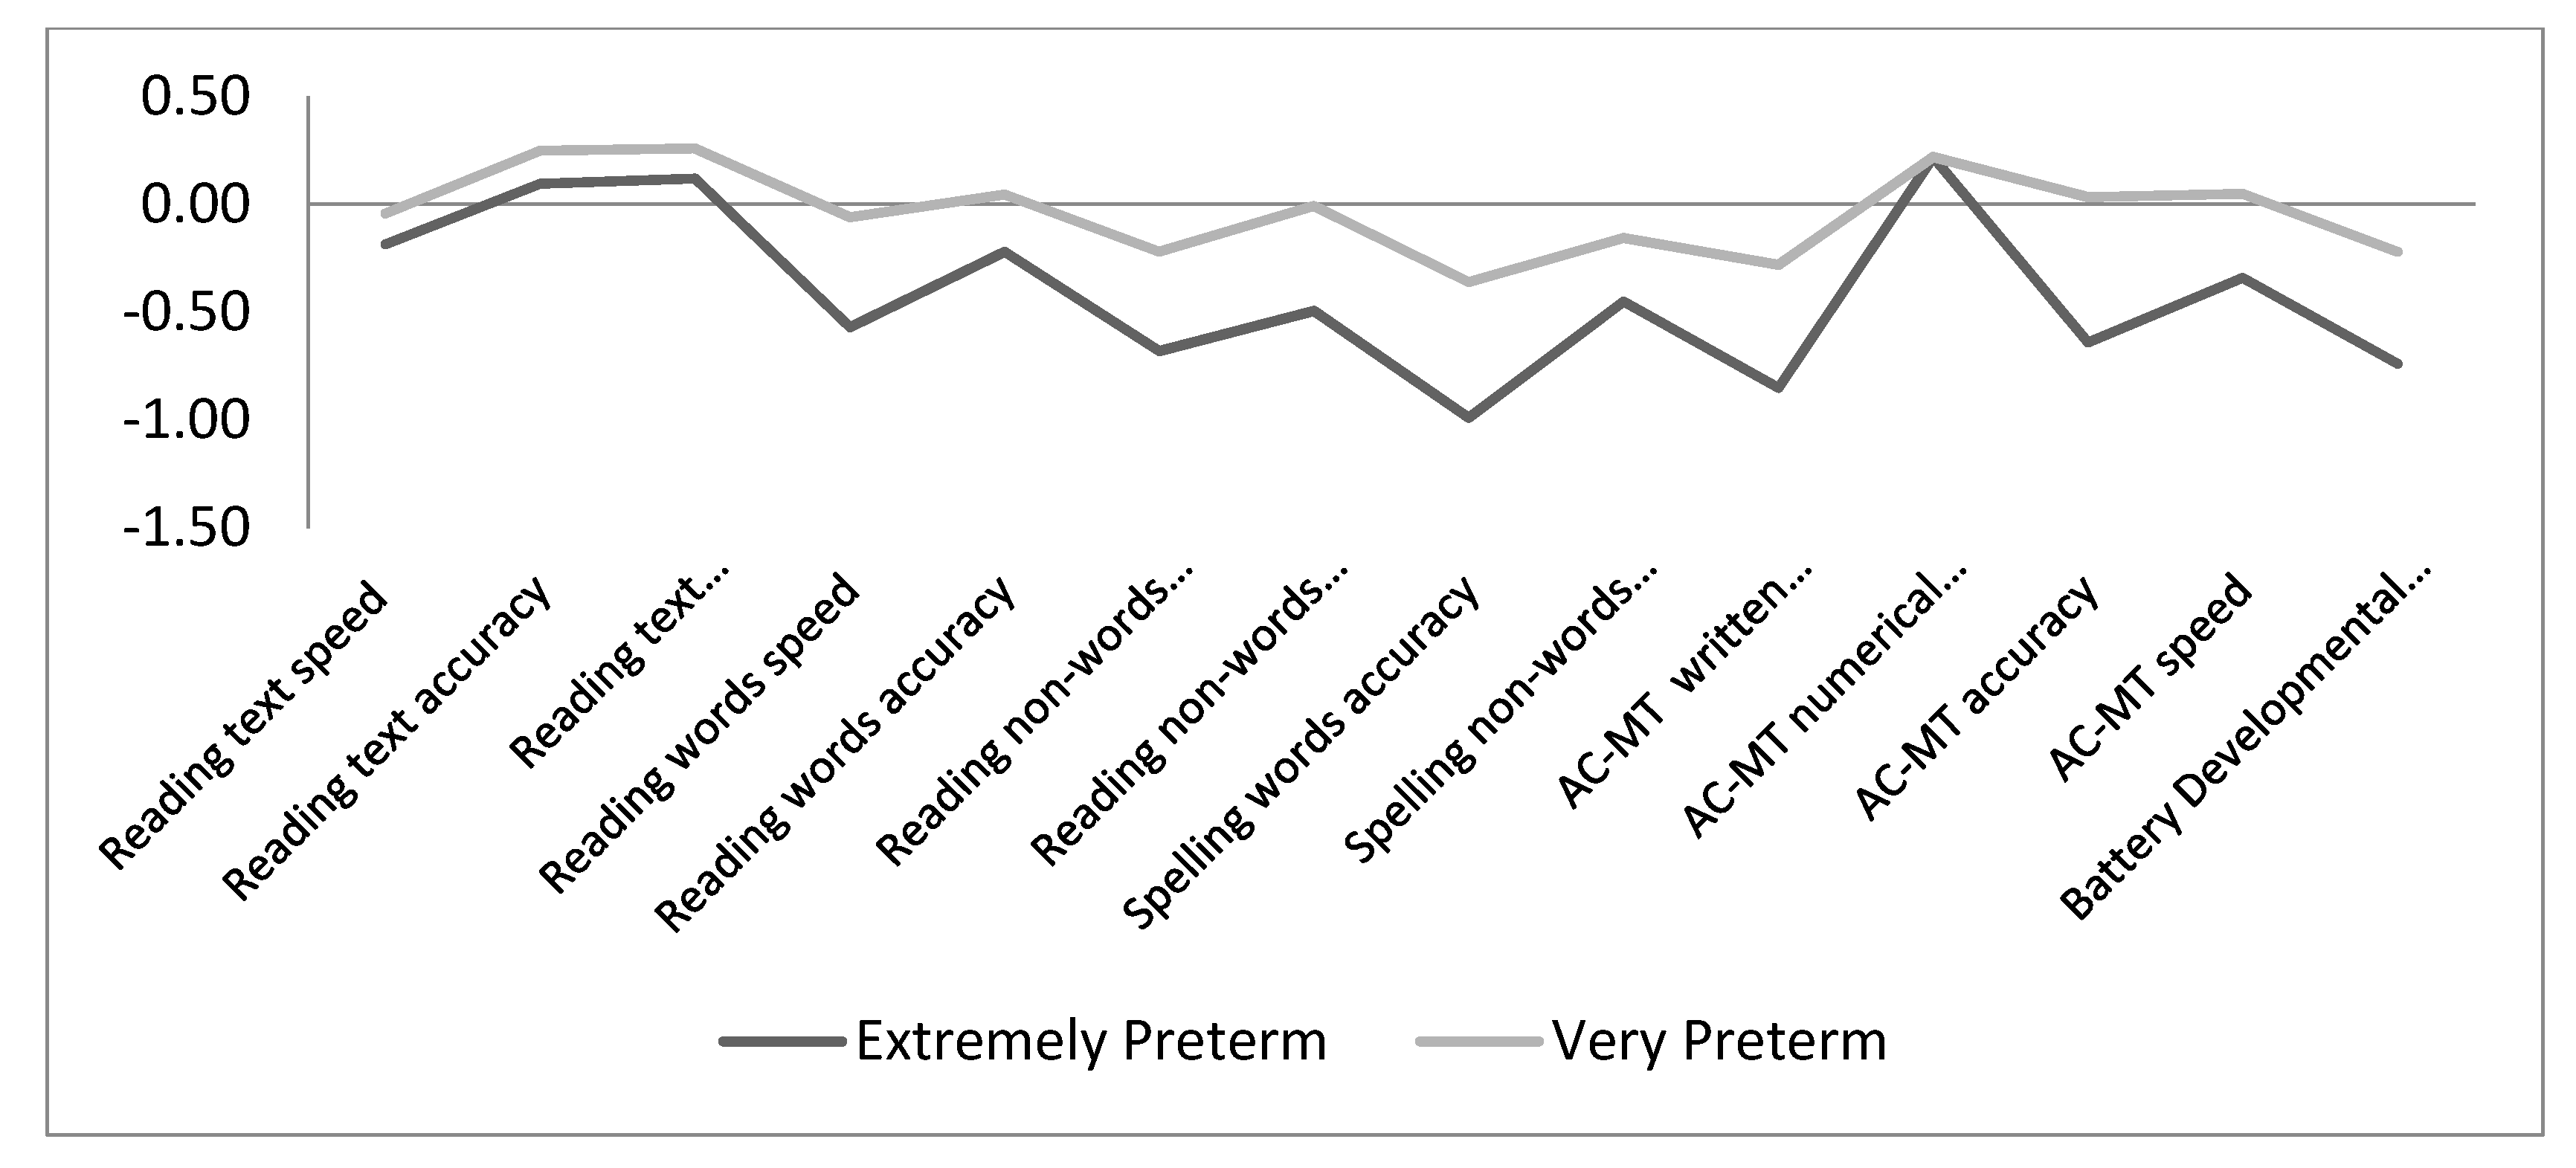
| Learning Skill | Sub-Skill | Z-Test Score (Mean ±SD) | |||
|---|---|---|---|---|---|
| Extremely Preterm | Very Preterm | Normative Sample | p | ||
| Reading | Text speed | −0.18 ± 0.92 | −0.04 ± 0.86 | 0.00 ± 1.00 | 0.66 |
| Text accuracy | 0.09 ± 0.75 | 0.25 ± 0.67 | 0.00 ± 1.00 | 0.14 | |
| Text comprehension | 0.12 ± 0.73 | 0.26 ± 0.68 | 0.00 ± 1.00 | 0.12 | |
| Word speed | −0.57 ± 2.40 | −0.06 ± 0.98 | 0.00 ± 1.00 | 0.08 | |
| Word accuracy | −0.22 ± 1.33 | 0.046 ± 0.87 | 0.00 ± 1.00 | 0.55 | |
| Non-word speed | −0.68 ± 2.08 | −0.22 ± 0.96 | 0.00 ± 1.00 | 0.01 | |
| Non-word accuracy | −0.49 ± 1.73 | −0.07 ± 0.98 | 0.00 ± 1.00 | 0.11 | |
| Spelling | Word accuracy | −0.99 ± 1.66 | −0.36 ± 1.21 | 0.00 ± 1.00 | 0.00 |
| Non-word accuracy | −0.45 ± 1.41 | −0.15 ± 1.06 | 0.00 ± 1.00 | 0.10 | |
| Mathematics | AC-MT written calculation | −0.85 ± 1.60 | −0.28 ± 1.09 | 0.00 ± 1.00 | 0.00 |
| AC-MT numerical knowledge | 0.22 ± 0.61 | 0.22 ± 0.59 | 0.00 ± 1.00 | 0.14 | |
| AC-MT accuracy | −0.64 ± 1.06 | 0.03 ± 1.06 | 0.00 ± 1.00 | 0.01 | |
| AC-MT speed | −0.34 ± 1.43 | 0.05 ± 0.81 | 0.00 ± 1.00 | 0.55 | |
| Battery for Developmental Dyscalculia | −0.74 ± 0.97 | −0.22 ± 0.89 | 0.00 ± 1.00 | 0.00 | |
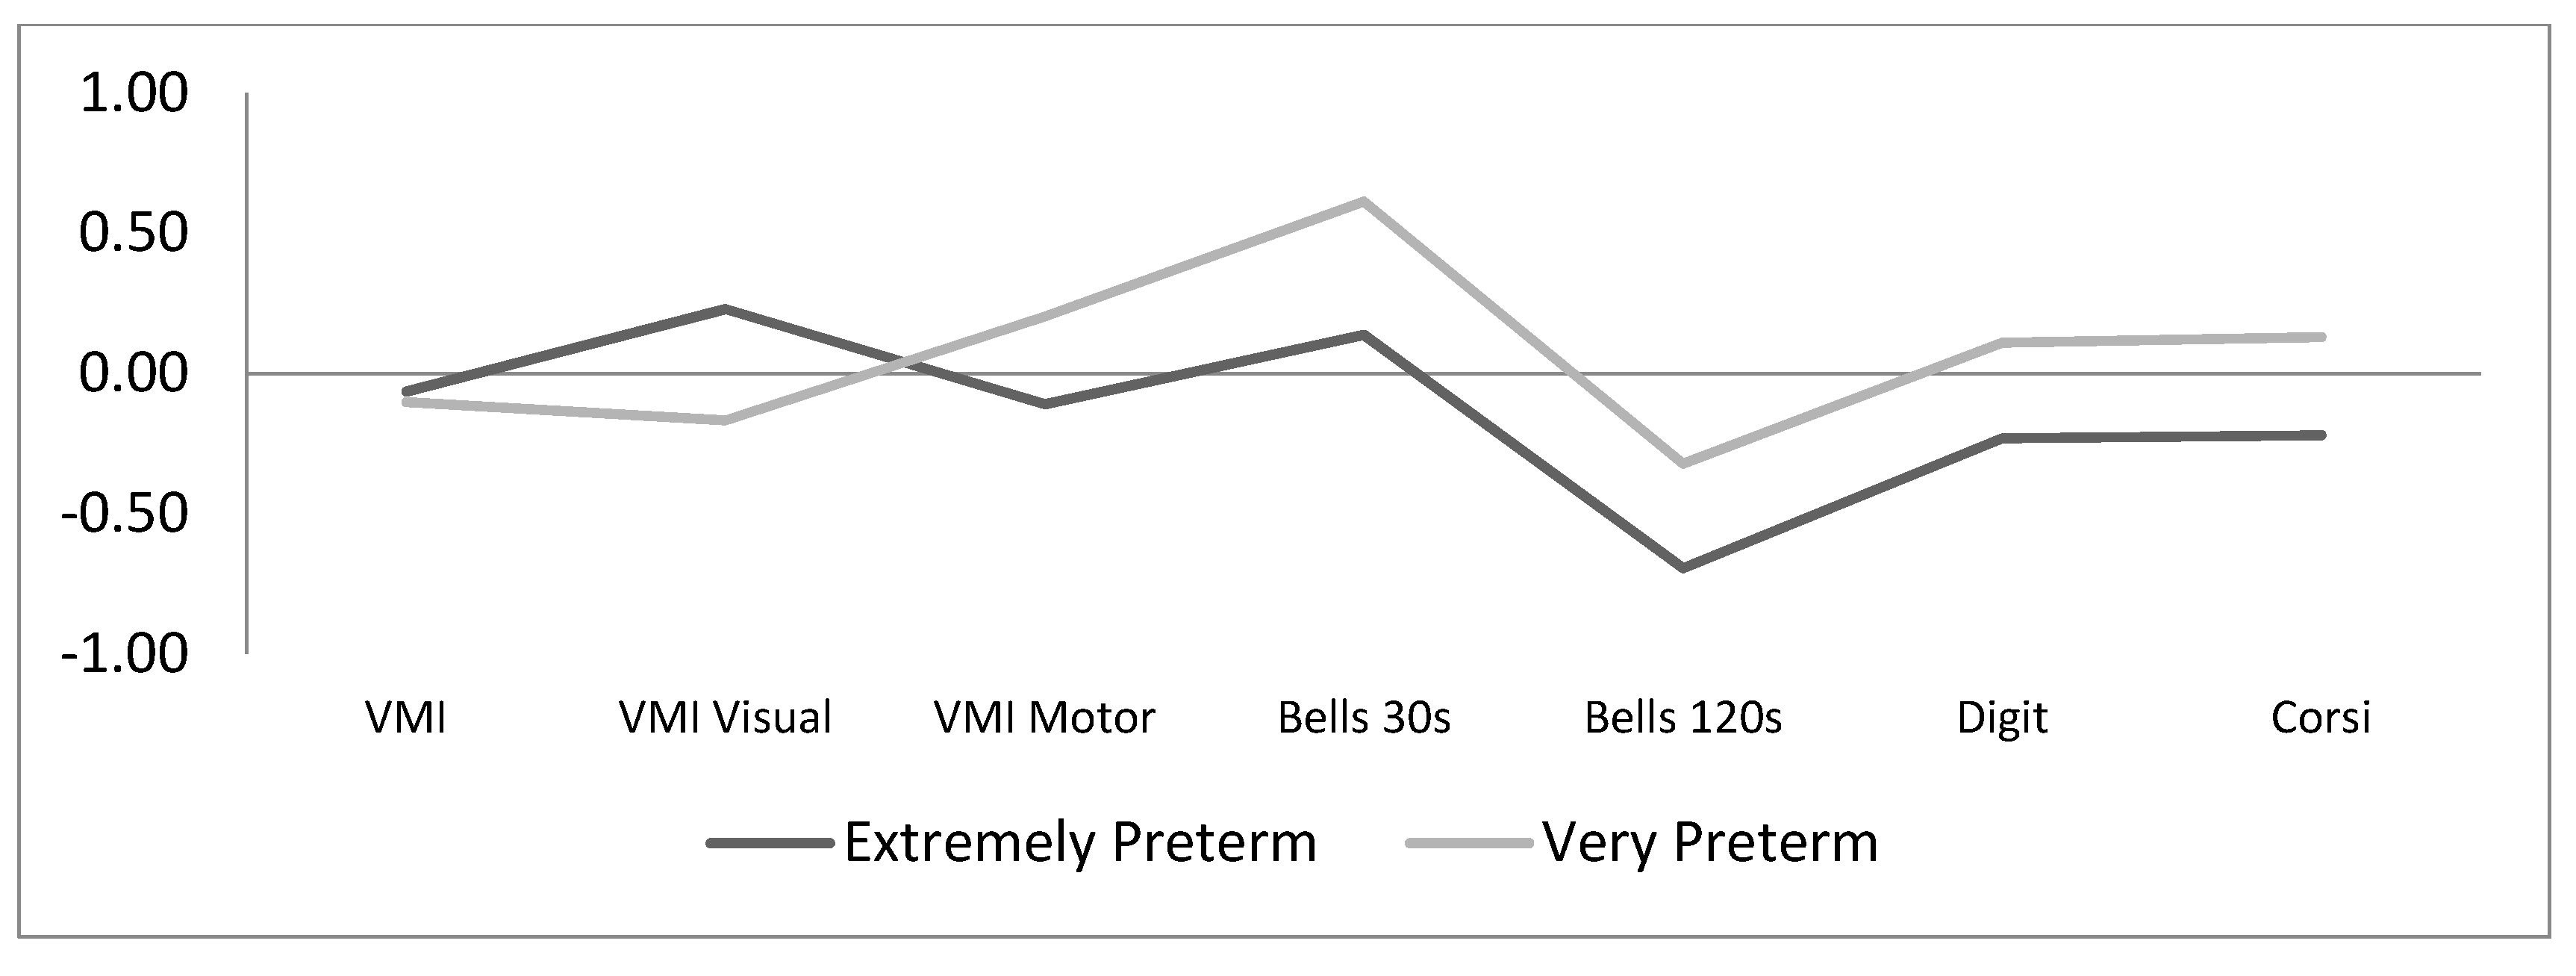
| Neurocognitive Skill | Sub-Skill | Z-Test Score (Mean ± SD) | |||
|---|---|---|---|---|---|
| Extremely Preterm | Very Preterm | Normative SAMPLE | p | ||
| Intelligence quotient (IQ) | - | 101.8 ±11.05 | 100.1 ± 11.69 | 100.00 ± 15.00 | |
| Visual-motor integration | Total | −0.06 ±0.72 | −0.10 ± 0.88 | 0.00 ± 1.00 | 0.78 |
| Visual processing | 0.23 ±1.17 | −0.17 ± 1.04 | 0.00 ± 1.00 | 0.42 | |
| Motor coordination | −0.11 ±0.85 | 0.20 ± 1.05 | 0.00 ± 1.00 | 0.33 | |
| Attention and visual processing | Selective | 0.14 ±1.61 | 0.61 ± 1.43 | 0.00 ± 1.00 | 0.01 |
| Sustained | −0.69 ±0.88 | −0.32 ± 0.62 | 0.00 ± 1.00 | 0.00 | |
| Short-term memory | Verbal | −0.23 ±0.81 | −0.11 ± 0.80 | 0.00 ± 1.00 | 0.40 |
| Visuospatial | −0.22 ±0.92 | 0.13 ± 1.14 | 0.00 ± 1.00 | 0.40 | |
| 1 | 2 | 3 | 4 | 5 | 6 | 7 | 8 | 9 | 10 | 11 | 12 | 13 | 14 | 15 | 16 | 17 | 18 | 19 | 20 | 21 | 22 | |
|---|---|---|---|---|---|---|---|---|---|---|---|---|---|---|---|---|---|---|---|---|---|---|
| 1. Gestation age | --- | |||||||||||||||||||||
| 2. IQ | −0.06 | --- | ||||||||||||||||||||
| 3. Reading text speed | 0.04 | −0.09 | --- | |||||||||||||||||||
| 4. Reading text accuracy | 0 | 0.13 | 0.30 ** | --- | ||||||||||||||||||
| 5. Reading text comprehension | 0.04 | 0.28 * | 0.29 * | 0.30 ** | --- | |||||||||||||||||
| 6. Reading words speed | −0.04 | −0.22 | 0.66 ** | 0.45 ** | 0.2 | --- | ||||||||||||||||
| 7. Reading words accuracy | −0.01 | −0.09 | 0.34 ** | 0.45 ** | 0.13 | 0.67 ** | --- | |||||||||||||||
| 8. Reading non-words speed | −0.02 | −0.30 * | 0.59 ** | 0.43 ** | 0.14 | 0.88 ** | 0.57 ** | --- | ||||||||||||||
| 9. Reading non-words accuracy | 0.03 | 0.12 | 0.26 * | 0.38 ** | 0.19 | 0.62 ** | 0.76 ** | 0.53 ** | --- | |||||||||||||
| 10. Spelling words accuracy | 0.08 | −0.01 | 0.32 ** | 0.36 ** | 0.18 | 0.47 ** | 0.49 ** | 0.38 ** | 0.42 ** | --- | ||||||||||||
| 11. Spelling non-words accuracy | −0.02 | 0.07 | 0.27 * | 0.30 * | 0.14 | 0.57 ** | 0.44 ** | 0.54 ** | 0.52 ** | 0.51 ** | --- | |||||||||||
| 12. AC-MT written calculation | 0.04 | 0.22 | −0.18 | 0.14 | 0.06 | −0.2 | 0.05 | −0.29 | 0.23 | 0.37 | 0.11 | --- | ||||||||||
| 13. AC-MT number knowledge | −0.31 | 0.24 | 0.03 | 0.32 | 0.1 | 0.14 | 0.41 * | 0.04 | 0.41 | 0.52 * | 0.02 | 0.45 * | --- | |||||||||
| 14. AC-MT accuracy | −0.22 | 0.22 | −0.06 | 0.53 ** | 0.06 | 0.31 | 0.44 * | 0.33 | 0.52 * | 0.52 * | 0.42 * | 0.28 | 0.69 ** | --- | ||||||||
| 15. AC-MT speed | −0.02 | 0.23 | −0.21 | 0.26 | −0.11 | 0.02 | −0.02 | −0.03 | 0.45 * | 0.24 | 0.2 | 0.49 * | 0.36 | 0.42 * | --- | |||||||
| 16. BDE | 0.2 | 0.13 | 0.39 ** | 0.24 | 0.43 ** | 0.46 ** | 0.43 ** | 0.48 ** | 0.51 ** | 0.49 ** | 0.24 | −- | −- | −- | −- | --- | ||||||
| 17. Visual-motor integration tot | 0.04 | 0.25 * | 0.02 | 0.37 ** | 0.13 | 0.11 | 0.19 | −0.02 | 0.22 | 0.12 | 0.16 | 0.2 | 0.05 | 0.17 | 0.12 | 0.01 | --- | |||||
| 18. Visual processing skills | −0.15 | 0.26 * | 0.09 | 0.19 | 0.19 | 0.09 | 0.09 | 0.07 | 0.2 | 0.13 | 0.06 | 0 | 0.07 | 0.13 | −0.25 | 0.2 | 0.44 ** | --- | ||||
| 19. Motor coordination | 0.16 | 0.36 ** | −0.07 | 0.13 | 0.03 | −0.01 | 0.1 | −0.06 | 0.30 * | 0.18 | 0.22 | 0.31 | 0.08 | 0.25 | 0.17 | 0.09 | 0.30 * | 0.34 ** | --- | |||
| 20. Selective attention | 0 | 0.22 | 0.08 | 0.24 | 0.07 | 0.07 | 0.03 | 0.12 | −0.02 | 0.30 * | 0.25 | 0.19 | 0.19 | 0.27 | 0.24 | 0.07 | −0.30 * | 0.11 | 0.22 | --- | ||
| 21. Sustained attention | 0.21 | 0.14 | 0.07 | −0.05 | 0 | 0.01 | 0.03 | −0.02 | 0.01 | 0.19 | 0.06 | 0.22 | 0.05 | 0.09 | 0.15 | 0.09 | 0.12 | −0.07 | 0.25 | 0.46 ** | --- | |
| 22. Visuospatial short-term memory | 0.24 * | −0.05 | 0.02 | −0.03 | −0.05 | −0.01 | 0.07 | −0.05 | 0.21 | 0.03 | −0.08 | 0.46 * | 0.48 * | 0.17 | 0.40 * | 0.25 | 0.1 | 0.18 | 0.07 | −0.24 | −0.08 | --- |
| 23. Verbal short-term memory | 0.06 | 0.16 | 0.26 * | 0.29 ** | 0.23 * | 0.14 | 0.01 | 0.1 | 0.15 | 0.32 ** | 0.16 | 0.37 | 0.47 * | 0.36 | 0.47 * | 0.35 * | 0.18 | 0.18 | 0.07 | 0.08 | 0.03 | 0.31 ** |
| Skill | Children at Risk [n (%)] | |||||
|---|---|---|---|---|---|---|
| Extremely Preterm | Very Preterm | |||||
| Impaired | At Risk | Average | Impaired | At Risk | Average | |
| Reading | 3 (13.6) | 2 (9.1) | 17 (77.3) | 1 (1.7) | 4 (6.7) | 55 (91.7) |
| Spelling | 2 (10.5) | 5 (26.3) | 12 (63.2) | 3 (5.9) | 6 (11.8) | 42 (82.4) |
| Mathematics | 4 (19.0) | 2 (9.5) | 15 (71.4) | 3 (5.7) | 4 (7.5) | 46 (86.8) |
| Learning Impairment | Children with Impairment [(n (%)] | ||
|---|---|---|---|
| Extremely Preterm | Very Preterm | Total | |
| No deficit | 17 (77.3) | 53 (88.3) | 70 (85.4) |
| Reading only | 0 (0) | 1 (1.7) | 1 (1.2) |
| Spelling only | 1 (4.5) | 4 (6.7) | 5 (6.1) |
| Mathematics only | 1 (4.5) | 2 (3.3) | 3 (3.7) |
| Reading and Spelling | 0 (0) | 0 (0) | 0 (0) |
| Reading, Mathematics | 2 (9.1) | 0 (0) | 2 (2.4) |
| Spelling, Mathematics | 0 (0) | 0 (0) | 0 (0) |
| Reading, Spelling, Mathematics | 1 (4.5) | 0 (0) | 1 (1.2) |
| Total Learning deficit | 5 (22.7) | 7 (11.7) | 12 (14.6) |
Publisher’s Note: MDPI stays neutral with regard to jurisdictional claims in published maps and institutional affiliations. |
© 2020 by the authors. Licensee MDPI, Basel, Switzerland. This article is an open access article distributed under the terms and conditions of the Creative Commons Attribution (CC BY) license (http://creativecommons.org/licenses/by/4.0/).
Share and Cite
Bucci, S.; Bevilacqua, F.; De Marchis, C.; Coletti, M.F.; Gentile, S.; Dall’Oglio, A.M. Learning Abilities in a Population of Italian Healthy Preterm Children at the End of Primary School. Int. J. Environ. Res. Public Health 2020, 17, 7599. https://doi.org/10.3390/ijerph17207599
Bucci S, Bevilacqua F, De Marchis C, Coletti MF, Gentile S, Dall’Oglio AM. Learning Abilities in a Population of Italian Healthy Preterm Children at the End of Primary School. International Journal of Environmental Research and Public Health. 2020; 17(20):7599. https://doi.org/10.3390/ijerph17207599
Chicago/Turabian StyleBucci, Silvia, Francesca Bevilacqua, Chiara De Marchis, Maria Franca Coletti, Simonetta Gentile, and Anna Maria Dall’Oglio. 2020. "Learning Abilities in a Population of Italian Healthy Preterm Children at the End of Primary School" International Journal of Environmental Research and Public Health 17, no. 20: 7599. https://doi.org/10.3390/ijerph17207599