Quality Assessment of Three Types of Drinking Water Sources in Guinea-Bissau

 ,
,  ,
, 
Abstract
:
1. Introduction
2. Materials and Methods
2.1. Study Area
2.2. Location of the Sampling Points and Sample Collection
2.3. Analytical Procedures
2.3.1. Physical and Chemical Parameters
2.3.2. Bacteriological Analysis
2.4. Statistical Analysis
3. Results
3.1. Physicochemical Parameters
3.2. Microbiological Assessment
3.2.1. Microbiological Quality of the Three Sources of Drinking Water: Piped Water, Tubewells and Shallow Wells
3.2.2. Piped Water Distribution Systems
3.2.3. Comparison between Piped Water Distribution Areas in Bissau
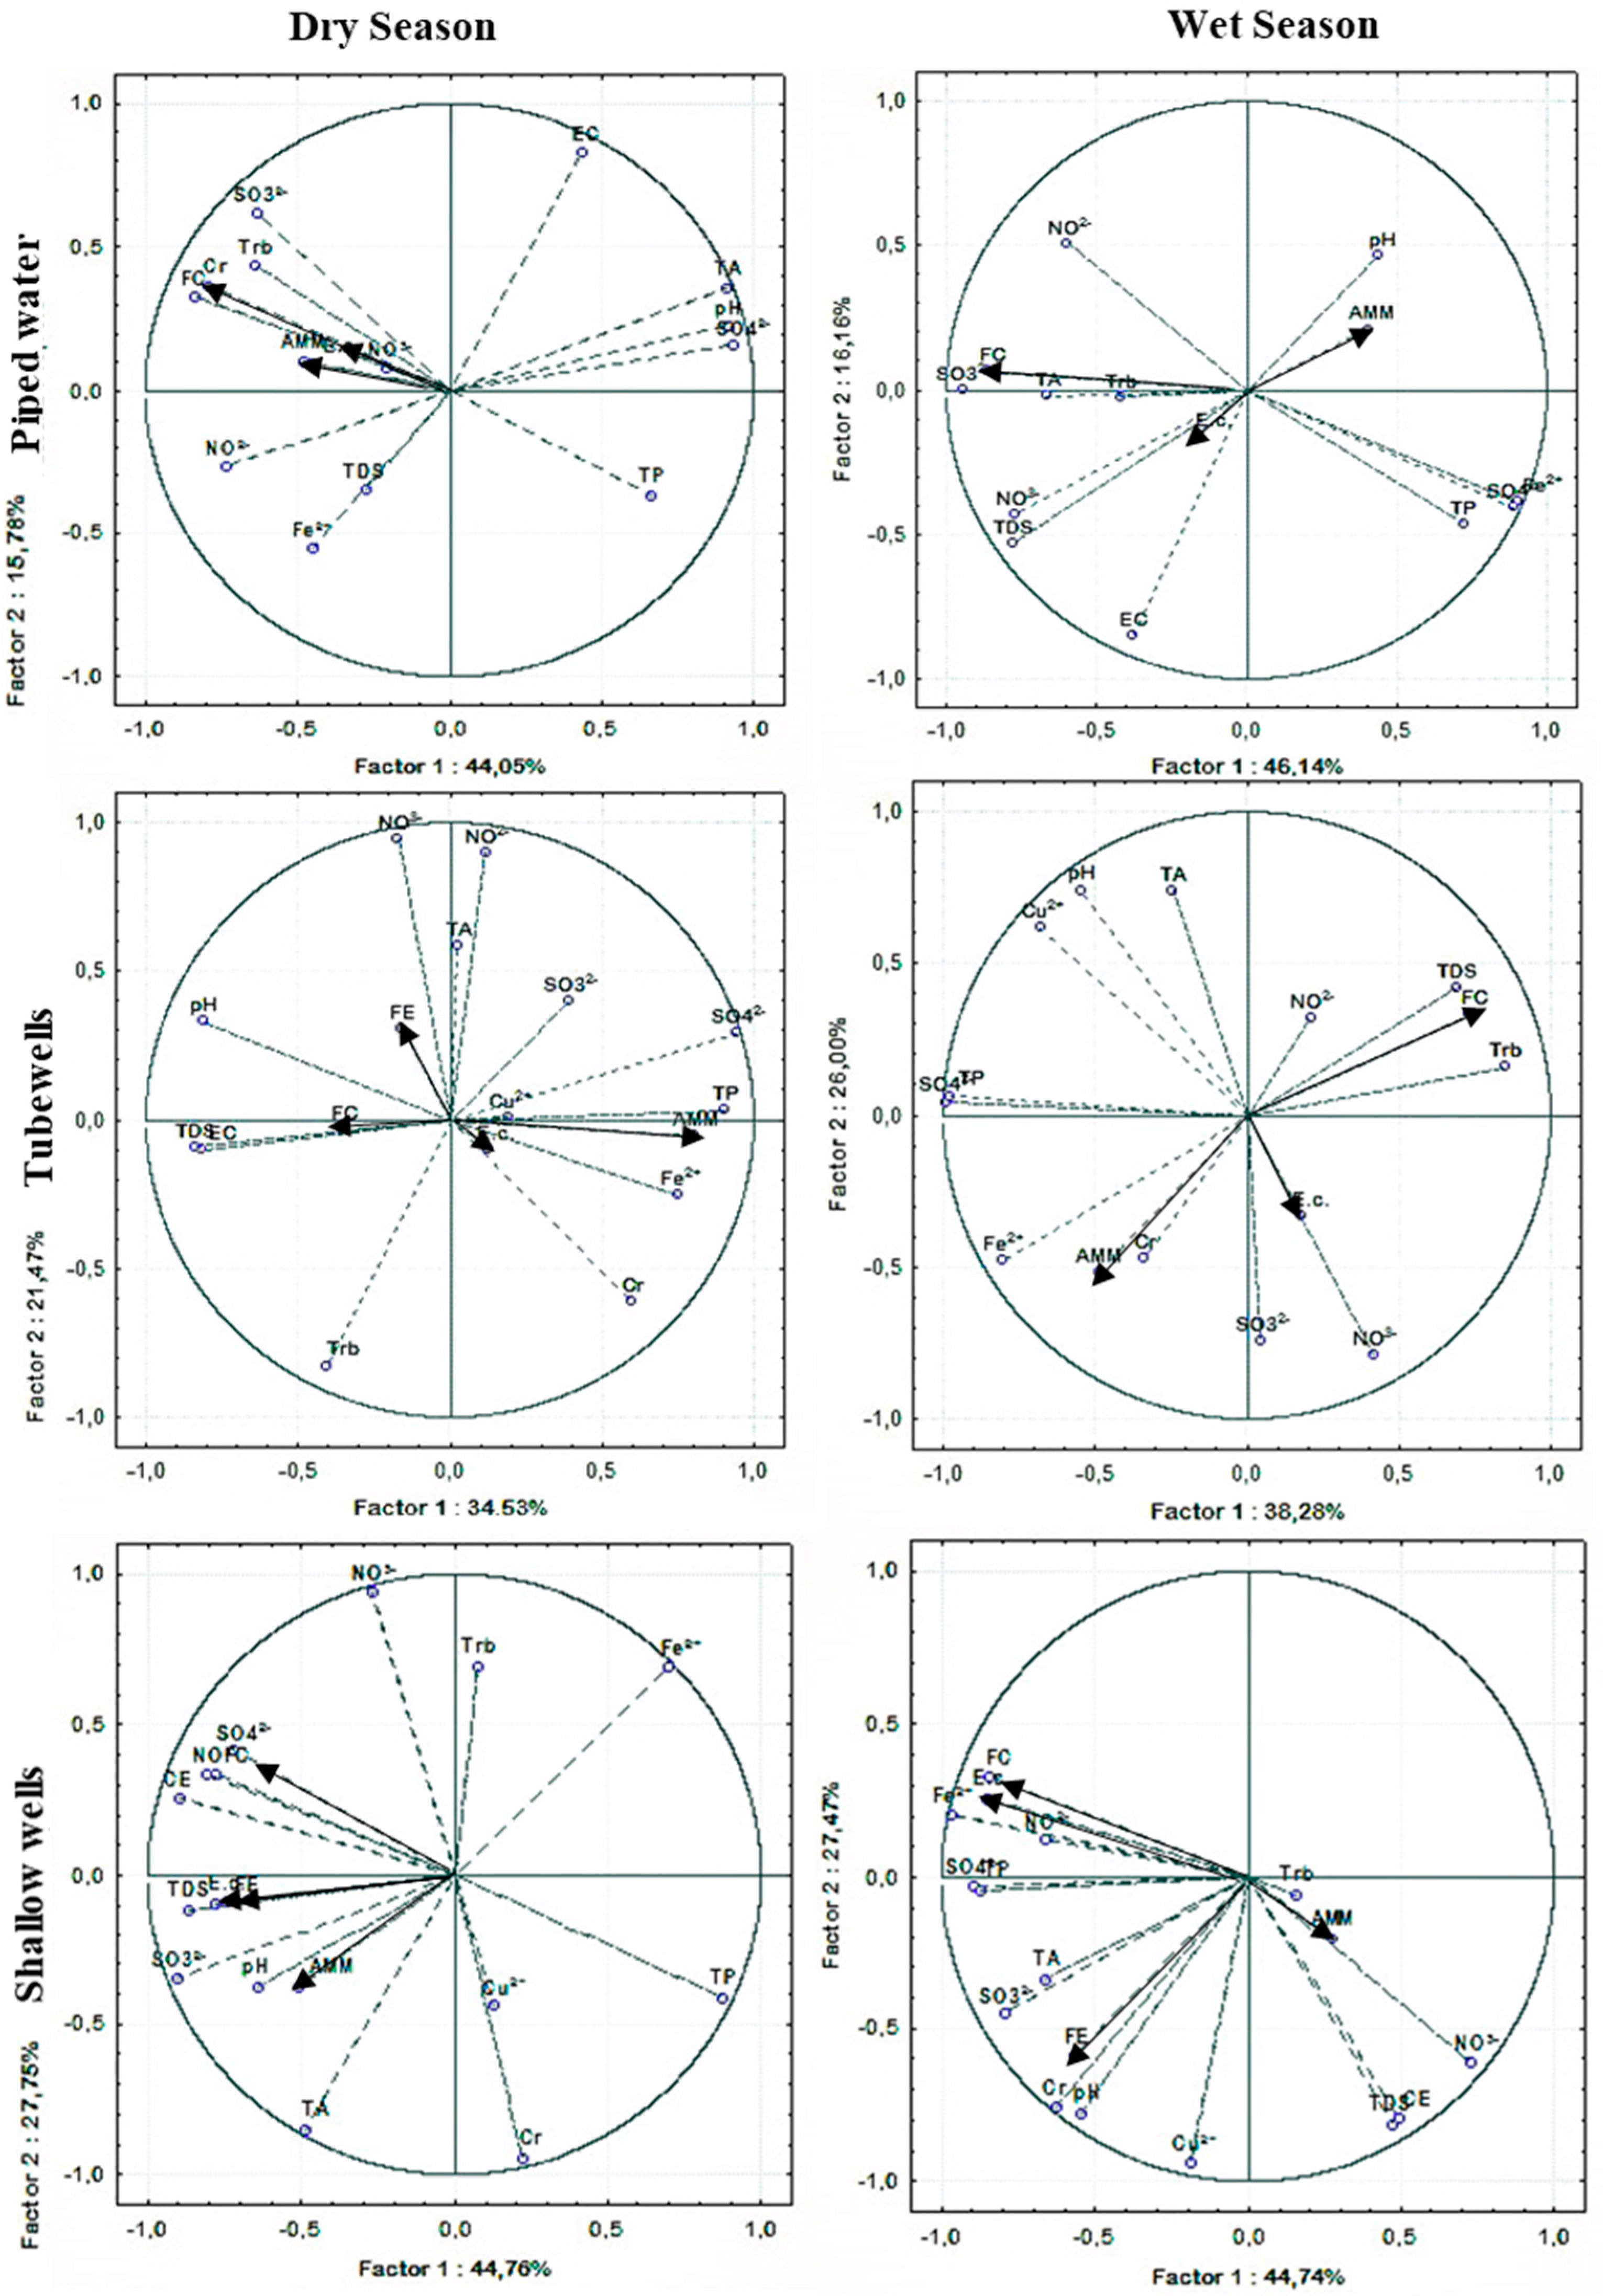
3.2.4. Correlation/Relationship between Physicochemical Parameters and Microorganism Abundance
4. Discussion
5. Conclusions
Supplementary Materials
Author Contributions
Funding
Acknowledgments
Conflicts of Interest
References
- UN. African Water Development Report 2006; UN-Water/Africa Economic Commission for Africa: Addis Ababa, Ethiopia, 2006. [Google Scholar]
- WWDR4. Global Water Resources under Increasing Pressure from Rapidly Growing Demands and Climate Change, According to New UN World Water Development Report; Division of Water Sciences, UNESCO: Colombella Alta, Italy, 2019. [Google Scholar]
- Pl, A.A.; Savva-Bordalo, J. The quest for safe drinking water: An example from Guinea-Bissau (West Africa). Water Res. 2007, 41, 2978–2986. [Google Scholar]
- Molinos-Senante, M.; Muñoz, S.; Chamorro, A. Assessing the quality of service for drinking water supplies in rural settings: A synthetic index approach. J. Environ. Manag. 2019, 247, 613–623. [Google Scholar] [CrossRef] [PubMed]
- Brandt, M.J.; Johnson, K.M.; Elphinston, A.J.; Ratnayaka, D.D. Twort’s Water Supply, 7th ed.; Elsevier Inc.: Amsterdam, The Netherlands, 2016. [Google Scholar]
- Gleick, P.H. Dirty Water: Estimated Deaths from Water-Related Diseases 2000–2020 Pacific Institute Research Report; Pacific Institute for Studies in Development, Environment, and Security: Oakland, CA, USA, 2002. [Google Scholar]
- Hall, R.P.; Van Koppen, B.; Van Houweling, E. The Human Right to Water: The Importance of Domestic and Productive Water Rights. Sci. Eng. Ethics 2014, 20, 849–868. [Google Scholar] [CrossRef] [PubMed] [Green Version]
- Goonetilleke, A.; Vithanage, M. Water Resources Management: Innovation and Challenges in a Changing World. Water 2017, 9, 281. [Google Scholar] [CrossRef]
- World Health Organization. Progress on Household Drinking Water, Sanitation and Hygiene 2000–2017: Special Focus on Inequalities. Available online: https://www.who.int/water_sanitation_health/publications/jmp-report-2019/en/ (accessed on 21 September 2019).
- Van Der Pol, T.D.; Van Ierland, E.C.; Gabbert, S.; Weikard, H.P.; Hendrix, E.M.T. Impacts of rainfall variability and expected rainfall changes on cost-effective adaptation of water systems to climate change. J. Environ. Manag. 2015, 154, 40–47. [Google Scholar] [CrossRef]
- Serdeczny, O.; Adams, S.; Baarsch, F.; Coumou, D.; Robinson, A.; Hare, W.; Schaeffer, M.; Perrette, M.; Reinhardt, J. Climate change impacts in Sub-Saharan Africa: From physical changes to their social repercussions. Reg. Environ. Chang. 2017, 17, 1585–1600. [Google Scholar] [CrossRef]
- Institute for Health Metrics and Evaluation. Healthdata, Guinea-Bissau Country Profile. Available online: http://www.healthdata.org/guinea-bissau (accessed on 23 September 2019).
- United Nations Integrated Peace Building Office in Guinea-Bissau. Report on the Right to Health in Guinea-Bissau, Bissau. Available online: https://uniogbis.unmissions.org/sites/default/files/report_on_the_right_to_health_-guinea-bissau_portuguese_.pdf (accessed on 27 December 2019).
- United Nations Development Programme. Human Development Indices and Indicators. 2018 Statistical Update; United Nations Development Programme: New York, NY, USA, 2018; p. 10017. [Google Scholar]
- Prüss-Ustün, A.; Bartram, J.; Ciasen, T.; Colford, J.M., Jr.; Cumming, O.; Curtis, V.; Bonjour, S.; Dangour, A.D.; De France, J.; Fewtrell, L.; et al. Burden of disease from inadequate water, sanitation and hygiene in low- and middle-income settings: A retrospective analysis of data from 145 countries. Trop. Med. Int. Health 2014, 19, 894–905. [Google Scholar]
- Gleick, P.H. Water in crisis: Paths to sustainable water use. Ecol. Appl. 1998, 8, 571–579. [Google Scholar] [CrossRef]
- National Institute of Public Health (INASA). Relatório Nacional Sobre Casos de Diarreias em 2018 e 2019; Ministry of Health: Bissau, Guinea, 2019.
- The United Nations Children’s Fund and United Nations Development Programme, Ministry of Public Health, World Health Organization. Plano Estratégico de Intervenção e Resposta Contra a Cólera na Guiné-Bissau 2009–2013; Ministry of Health: Bissau, Guinea, 2013.
- Mamjuba, S.B.; Da Silva, L.; Bettunde, A.; Mané, D.; Moore, S.; Rossi, M.D.; Lucaccioni, H.; Green, H. Cholera Factsheet Guinea-Bissau. Available online: https://plateformecholera.info/attachments/article/231/Cholera Factsheet_Guinea-Bissau_2017_SAM.pdf (accessed on 7 July 2020).
- World Bank. Guinea-Bissau Overview. Available online: https://www.worldbank.org/en/country/guineabissau/overview (accessed on 27 July 2019).
- Catarino, L.; Martins, E.S.; Pinto Basto, M.F.; Diniz, M.A. An annotated checklist of the vascular flora of Guinea-Bissau (West Africa). Blumea 2008, 53, 1–222. [Google Scholar] [CrossRef] [Green Version]
- Bancessi, A.; Bancessi, Q.; Baldé, A.; Catarino, L. Present and potential uses of Moringa oleifera as a multipurpose plant in Guinea-Bissau. S. Afr. J. Bot. 2020, 129, 206–208. [Google Scholar] [CrossRef]
- Manafá, B.; Vieira, R.; Cristo, O.; Mendes, J. Boletim Estatístico da Guiné-Bissau-Guiné-Bissau em Números; Instituto Nacional de Estatistica: Bissau, Guinea, 2017; Available online: http://www.stat-guinebissau.com/publicacao/GB_Numerofinal_Publica%C3%A7%C3%A3o1.pdf (accessed on 20 July 2019).
- European Communities. Section 4: Guidance on Sampling (Drinking Water Handbook on Implementation for Water Services Authorities for Private Water Supplies); European Communities: Dublin, Irland, 2010. [Google Scholar]
- Standard Organization of Nigeria. Nigerian Standard for Drinking Water Quality; Standard Organization of Nigeria: Abuja, Nigeria, 2015. [Google Scholar]
- European Union. Council Directive 98/83/EC of 3 November 1998 on the Quality of Water Intended for Human Consumption; European Communities: Brussels, Belgium, 1998. [Google Scholar]
- World Health Organization. Guidelines for Drinking-Water Quality Fourth Edition WHO Library Cataloguing-in-Publication Data Guidelines for Drinking-Water Quality, 4th ed.; WHO: Geneva, Switzerland, 2011. [Google Scholar]
- World Health Organization. Guidelines for Drinking-Water Quality Fourth Edition Incorporating the First Addendum; World Health Organization: Geneva, Switzerland, 2017. [Google Scholar]
- Machado, A.; Bordalo, A.A. Analysis of the bacterial community composition in acidic well water used for drinking in Guinea-Bissau, West Africa. J. Environ. Sci. 2014, 26, 1605–1614. [Google Scholar] [CrossRef] [PubMed]
- Ibrahim, K.O.; Gomo, M.; Oke, S.A. Groundwater quality assessment of shallow aquifer hand dug wells in rural localities of Ilorin northcentral Nigeria: Implications for domestic and irrigation uses. Groundw. Sustain. Dev. 2019, 9, 100226. [Google Scholar] [CrossRef]
- De Pauw, E.F. The Management of Acid Soils in Africa. Outlook Agric. 1994, 23, 11–16. [Google Scholar] [CrossRef]
- Buzalaf, M.A.R.; Hannas, A.R.; Kato, M.T. Saliva and dental erosion. J. Appl. Oral Sci. 2012, 20, 493–502. [Google Scholar] [CrossRef] [PubMed] [Green Version]
- O’Sullivan, E.; Milosevic, A. UK National Clinical Guidelines in Paediatric Dentistry: Diagnosis, prevention and management of dental erosion. Int. J. Paediatr. Dent. 2008, 18, 29–38. [Google Scholar] [CrossRef]
- West, N.X.; Hughes, J.A.; Addy, M. The effect of pH on the erosion of dentine and enamel by dietary acids in vitro. J. Oral Rehabil. 2008, 28, 860–864. [Google Scholar] [CrossRef]
- Egamberdiyeva, D.; Höflich, G. Influence of growth-promoting bacteria on the growth of wheat in different soils and temperatures. Soil Biol. Biochem. 2003, 35, 973–978. [Google Scholar] [CrossRef]
- Shiah, F.; Ducklow, H. Bacterioplankton growth responses to temperature and chlorophyll variations in estuaries measured by thymidine: Leucine incorporation ratio. Aquat. Microb. Ecol. 1997, 13, 151–159. [Google Scholar] [CrossRef] [Green Version]
- Zhitkovich, A. Chromium in drinking water: Sources, metabolism, and cancer risks. Chem. Res. Toxicol. 2011, 24, 1617–1629. [Google Scholar] [CrossRef]
- Levallois, P.; Phaneuf, D. Contamination of drinking water by nitrates: Analysis of health risks. Can. J. Public Health 1994, 85, 192–196. [Google Scholar]
- Shuval, H.I.; Gruener, N. Infant methemoglobinemia and other health effects of nitrates in drinking water. In Proceedings of the Conference on Nitrogen as a Water Pollutant; Jenkins, S.H., Ed.; Pergamon: Oxford, UK, 2013; pp. 183–193. [Google Scholar]
- Sadeq, M.; Moe, C.L.; Attarassi, B.; Cherkaoui, I.; ElAouad, R.; Idrissi, L. Drinking water nitrate and prevalence of methemoglobinemia among infants and children aged 1–7 years in Moroccan areas. Int. J. Hyg. Environ. Health 2008, 211, 546–554. [Google Scholar] [CrossRef] [PubMed]
- Ndoye, S.; Fontaine, C.; Gaye, C.; Razack, M. Groundwater Quality and Suitability for Different Uses in the Saloum Area of Senegal. Water 2018, 10, 1837. [Google Scholar] [CrossRef] [Green Version]
- Muoio, R.; Caretti, C.; Rossi, L.; Santianni, D.; Lubello, C. Water safety plans and risk assessment: A novel procedure applied to treated water turbidity and gastrointestinal diseases. Int. J. Hyg. Environ. Health 2020, 223, 281–288. [Google Scholar] [CrossRef] [PubMed]
- Abdelrahman, A.A.; Eltahir, Y.M. Bacteriological quality of drinking water in Nyala, South Darfur, Sudan. Environ. Monit. Assess. 2011, 175, 37–43. [Google Scholar] [CrossRef] [PubMed]
- Dey, N.C.; Mahmood, P.; Dey, D.; Saha, R.; Ghose, L.; Barua, M.K.; Islam, A.; Chowdhury, M.R. Microbial contamination of drinking water from risky tubewells situated in different hydrological regions of Bangladesh. Int. J. Hyg. Environ. Health 2017, 220, 621–636. [Google Scholar] [CrossRef]
- Islam, M.S.; Mahmud, Z.H.; Islam, M.S.; Saha, G.C.; Zahid, A.; Ali, A.Z.; Hassan, M.Q.; Islam, K.; Jahan, H.; Hossain, Y.; et al. Safe distances between groundwater-based water wells and pit latrines at different hydrogeological conditions in the Ganges Atrai floodplains of Bangladesh. J. Health Popul. Nutr. 2016, 35, 26. [Google Scholar] [CrossRef] [Green Version]
- Kiptum, C.K.; Ndambuki, J.M. Well water contamination by pit latrines: A case study of Langas. Int. J. Water Resour. Environ. Eng. 2012, 4, 35–43. [Google Scholar]
- Nawab, B.; Esser, K.B.; Baig, S.A. Impact of pit latrines on drinking water contaminations in Khyber Pakhtunkhwa, Pakistan. Environ. Forensics 2017, 18, 296–306. [Google Scholar] [CrossRef]
- Colombatti, R.; Vieira, C.S.; Bassani, F.; Cristofoli, R.; Coin, A.; Bertinato, L.; Riccardi, F. Contamination of drinking water sources during the rainy season in an urban post-conflict community in Guinea Bissau: Implications for sanitation priority. Afr. J. Med. Med. Sci. 2009, 38, 155–161. [Google Scholar]
- Abit, S.M.; Bolster, C.H.; Cantrell, K.B.; Flores, J.Q.; Walker, S.L. Transport of Escherichia coli, Salmonella typhimurium, and microspheres in biochar-amended soils with different textures. J. Environ. Qual. 2014, 43, 371–388. [Google Scholar] [CrossRef]
- Cabral, J.P.S. Water microbiology. Bacterial pathogens and water. Int. J. Environ. Res. Public Health 2010, 7, 3657–3703. [Google Scholar] [CrossRef] [PubMed]
- Dalsgaard, A.; Forslund, A.; Petersen, A.; Brown, D.J.; Dias, F.; Monteiro, S.; Mølbak, K.; Aaby, P.; Rodrigues, A.; Sandström, A. Class 1 integron-borne, multiple-antibiotic resistance encoded by a 150-kilobase conjugative plasmid in epidemic Vibrio cholerae O1 strains isolated in Guinea-Bissau. J. Clin. Microbiol. 2000, 38, 3774–3779. [Google Scholar] [CrossRef] [PubMed] [Green Version]
- Luquero, F.J.; Banga, C.N.; Remartínez, D.; Palma, P.P.; Baron, E.; Grais, R.F. Cholera Epidemic in Guinea-Bissau (2008): The Importance of ‘Place’. PLoS ONE 2011, 6, e19005. [Google Scholar] [CrossRef] [PubMed] [Green Version]


| Name | Distribution Area | Sampled Segment | |||
|---|---|---|---|---|---|
| Hole | Reservoir Outlet | Tap | Fountain | ||
| DA1 | Hospital 3 de Agosto |  | - | | |
| DA2 | Bandim | | | | |
| DA3 | Hospital Central Simão Mendes | - | | - | |
| DA4 | Queije | - | - | | - |
| DA5 | Hospital S. Egidio | | | - | |
—sampled; - not sampled.| ANOVA Univariate Tests of Significance Effective Hypothesis Decomposition | |||||
|---|---|---|---|---|---|
| DF | FC | E. coli | FE | AMM | |
| Intercept | 1 | 0.000 *** | 0.000 *** | 0.000 *** | 0.000 *** |
| Season | 1 | 0.000 *** | 0.091 *** | 0.091 ns | 0.000 *** |
| Distribution Area | 4 | 0.000 *** | 0.000 *** | 0.000 *** | 0.000 *** |
| Season × Distribution Area | 4 | 0.901 ns | 0.401 ns | 0.401 ns | 0.002 ** |
| Error | 146 | ||||
| ANOVA Univariate Tests of Significance Effective Hypothesis Decomposition | |||||
|---|---|---|---|---|---|
| DF | FC | E. coli | FE | AMM | |
| Intercept | 1 | 0.000 *** | 0.000 *** | 0.000 *** | 0.000 *** |
| Season | 1 | 0.000 *** | 0.024 * | 0.024 * | 0.000 *** |
| System/segment | 3 | 0.000 *** | 0.000 *** | 0.000 *** | 0.000 *** |
| Season × System/segment | 3 | 0.091 ns | 0.422 ns | 0.422 ns | 0.000 *** |
| Error | 148 | ||||
| Parameter | Unit | Dry | Wet | WHO/EU | NSDWQ | ||||
|---|---|---|---|---|---|---|---|---|---|
| Water Sources | |||||||||
| Piped Water | Tubewell | Shallow Wells | Piped Water | Tubewell | Shallow Wells | ||||
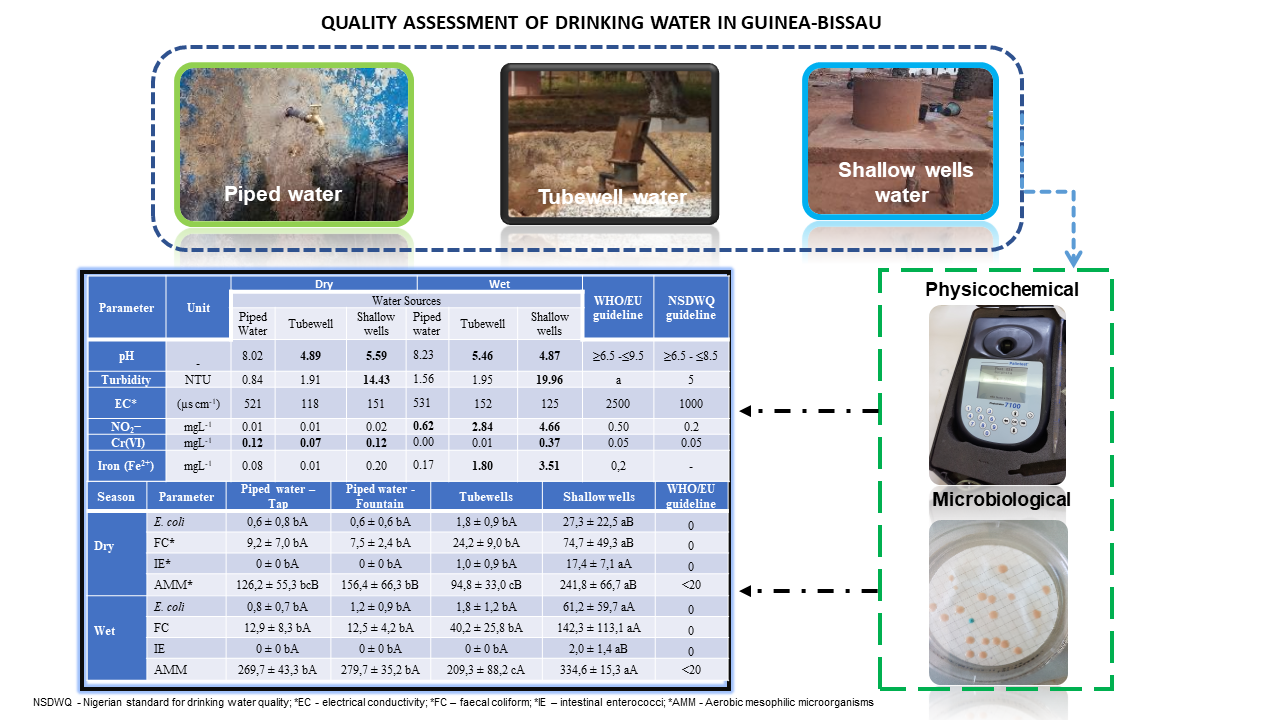
| pH | - | 8.02 | 4.89 | 5.59 | 8.23 | 5.46 | 4.87 | ≥6.5–≤9.5 | ≥6.5–≤8.5 |
| T | °C | 29.9 | 28.2 | 27.5 | 30.5 | 28.0 | 27.7 | - | b |
| Salinity | ppm | 0.25 | 0.07 | 0.04 | 0.25 | 0.07 | 0.06 | - | - |
| Turbidity | NTU | 0.84 | 1.91 | 14.43 | 1.56 | 1.95 | 19.96 | a | <5 |
| EC | (µs cm−1) | 521 | 118 | 151 | 531 | 152 | 125 | <2500 | <1000 |
| DO | mgL−1 | 3.91 | 4.65 | 5.21 | 0.00 | 0.00 | 1.06 | - | - |
| ORP | mV | 121.24 | 225.90 | 187.87 | 24.98 | 43.20 | 42.47 | - | - |
| TDS | mgL−1 | 224.1 | 61.1 | 73.7 | 269.7 | 76.4 | 9 | - | <500 |
| Nitrite (NO2−) | mgL−1 | 0.01 | 0.01 | 0.02 | 0.62 | 2.84 | 4.66 | <0.5 | <0.2 |
| Nitrate (NO3−) | mgL−1 | 0.89 | 0.95 | 4.40 | 0.00 | 0.04 | 0.14 | <50 | <50 |
| Chromium (CrVI) | mgL−1 | 0.12 | 0.07 | 0.12 | 0.00 | 0.01 | 0.37 | <0.05 | <0.05 |
| Iron (Fe2+) | mgL−1 | 0.08 | 0.01 | 0.20 | 0.17 | 1.80 | 3.51 | <0.2 | <0.3 |
| Sulphate (SO42−) | mgL−1 | 1.07 | 1.81 | 3.03 | 0.61 | 0.21 | 0.18 | - | <100 |
| Sulphite (SO32−) | mgL−1 | 15 | 14 | 13 | 17 | 15 | 15 | <250 | - |
| P (TP) | mgL−1 | 13.34 | 0.18 | 0.11 | 0.61 | 0.21 | 0.18 | - | - |
| Alkalinity (TA) | mgL−1 | 208.9 | 6.2 | 22.6 | 234.3 | 8.5 | 28.0 | - | - |
| Copper (Cu2+) | mgL−1 | 0.04 | 0.01 | 0.10 | 0.04 | 0.01 | 0.09 | <2 | <1 |
| Hardness | mgL−1 | 8.58 | 26.49 | 18.08 | 5.19 | 27.96 | 18.49 | - | <150 |
| RC | mgL−1 | 0.16 | 0.10 | 0.13 | 0.14 | 0.08 | 0.15 | 0.2–1 | 0.2–0.25 |
| Season | Parameter | Hole | Reservoir Outlet | Tap | Fountain | WHO/EU |
|---|---|---|---|---|---|---|
| Dry | E. coli | 0 ± 0 bA | 0.7 ± 0.8 aA | 0.6 ± 0.8 aA | 0.6 ± 0.6 aA | 0 |
| FC | 0 ± 0 bA | 6.3 ± 4.2 aA | 9.2 ± 6.8 aA | 7.5 ± 2.6 aB | 0 | |
| IE | 0 | 0 | 0 | 0 | 0 | |
| AMM | 52.9 ± 38.9 bA | 138.8 ± 46.0 aB | 126.2 ± 53.7 aB | 156.4 ± 79.2 aB | <20 | |
| Vibrio spp. | 0 | 0 | 0 | 0 | 0 | |
| Wet | E. coli | 0 ± 0 bA | 1.0 ± 0.7 aA | 0.8 ± 0.7 aA | 1.1 ± 0.8 aA | 0 |
| FC | 0 ± 0 bA | 9.0 ± 4.3 aA | 12.9 ± 8.1 aA | 12.7 ± 4.0 aA | 0 | |
| IE | 0 | 0 | 0 | 0 | 0 | |
| AMM | 96.3 ± 63.9 bA | 269.7 ± 42.0 aA | 282.3 ± 35.7 aA | 240.0 ± 39.7 aA | <20 | |
| Vibrio spp. | 0 | 0 | 0 | 0 | 0 |
| Piped Water Distribution Areas | |||||||
|---|---|---|---|---|---|---|---|
| Parameter | Season | DA1 | DA2 | DA3 | DA4 | DA5 | WHO/EU |
| FC | Dry | 3.5 cA | 8.5 bcA | 10.3 bA | 17.5 bA | 5.7 aA | 0 |
| Wet | 6.4 cA | 13.6 bA | 16.2 bA | 22.3 aA | 11.7 bA | ||
| E. coli | Dry | 0.0 cA | 0.6 bcA | 0.8 abA | 1.3 aA | 1.0 aA | 0 |
| Wet | 0.8 aA | 1.1 aA | 0.6 aA | 1.3 aA | 1.5 aA | ||
| AMM | Dry | 70.6 cB | 105.8 bcB | 259.0 aA | 197.7 aA | 195.5 aA | <20 |
| Wet | 298.4 aA | 289.2 aA | 292.8 aA | 232.2 aA | 240.2 aA | ||
| Vibrio spp. | Dry | 0 | 0 | 0 | 0 | 0 | 0 0 |
| Wet | 0 | 0 | 0 | 0 | 0 | ||
© 2020 by the authors. Licensee MDPI, Basel, Switzerland. This article is an open access article distributed under the terms and conditions of the Creative Commons Attribution (CC BY) license (http://creativecommons.org/licenses/by/4.0/).
Share and Cite
Bancessi, A.; Catarino, L.; José Silva, M.; Ferreira, A.; Duarte, E.; Nazareth, T. Quality Assessment of Three Types of Drinking Water Sources in Guinea-Bissau. Int. J. Environ. Res. Public Health 2020, 17, 7254. https://doi.org/10.3390/ijerph17197254
Bancessi A, Catarino L, José Silva M, Ferreira A, Duarte E, Nazareth T. Quality Assessment of Three Types of Drinking Water Sources in Guinea-Bissau. International Journal of Environmental Research and Public Health. 2020; 17(19):7254. https://doi.org/10.3390/ijerph17197254
Chicago/Turabian StyleBancessi, Aducabe, Luís Catarino, Maria José Silva, Armindo Ferreira, Elizabeth Duarte, and Teresa Nazareth. 2020. "Quality Assessment of Three Types of Drinking Water Sources in Guinea-Bissau" International Journal of Environmental Research and Public Health 17, no. 19: 7254. https://doi.org/10.3390/ijerph17197254