Frailty Status Typologies in Spanish Older Population: Associations with Successful Aging


Abstract
:1. Introduction
2. Materials and Methods
2.1. Sample and Procedure
2.2. Instruments and Measures
- Unintentional weight loss was operationalized using the question “What has your appetite been like”. It scored positive when the participants reported “a diminution in desire for food”. In the case of an uninterpretable response to the question, the participant was asked whether they had been eating more or less than usual. Answering “less” was also considered a positive indicator of unintentional weight loss.
- Fatigue, resulting from a positive response to the question, “In the last month, have you had too little energy to do things you wanted to do?”
- Slowness was defined as a positive answer to any of the following two mobility questions strongly associated with low speed: “Because of a health problem, do you have difficulty walking 100 m?’ or “Because of a health problem, do you have difficulty climbing one flight of stairs without resting?”. Both questions referred to difficulties lasting more than three months.
- Weakness was assessed by handgrip strength measurements (twice for each hand) using a dynamometer. The maximum grip strength measure was analyzed according to the cut-off points stratified by gender and body max index, as proposed by Fried et al. [5].
- Physical activity was measured using the question “How often do you engage in activities that require a moderate level of energy such as gardening, cleaning the car, or going for a walk?” The criterion was fulfilled for participants answering either “one to three times a month” or “hardly ever or never.”
2.3. Ethical Clearance
2.4. Statistical Analyses
3. Results
3.1. Descriptive Statistics
3.2. Frailty Classes
3.3. Relations with the Latent Classes
4. Discussion
5. Conclusions
Author Contributions
Funding
Acknowledgments
Conflicts of Interest
References
- Machón, M.; Mateo-Abad, M.; Vrotsou, K.; Zupiria, X.; Güell, C.; Rico, L.; Vergara, I. Dietary patterns and their relationship with frailty in functionally independent older adults. Nutrients 2018, 10, 406. [Google Scholar] [CrossRef] [PubMed] [Green Version]
- Bowling, A.; Iliffe, S. Psychological approach to successful ageing predicts future quality of life in older adults. Health Qual. Life Outcomes 2011, 9, 13. [Google Scholar] [CrossRef] [PubMed] [Green Version]
- Looman, W.M.; Fabbricotti, I.N.; Blom, J.W.; Jansen, A.P.D.; Lutomski, J.E.; Metzelthin, S.F.; Huijsman, R.; TOPICS-MDS Research Consortium. The frail older person does not exist: Development of frailty profiles with latent class analysis. BMC Geriatr. 2018, 18, 84. [Google Scholar] [CrossRef] [PubMed] [Green Version]
- Morley, J.E.; Vellas, B.; van Kan, G.A.; Anker, S.D.; Bauer, J.M.; Bernabei, R.; Cesari, M.; Chumlea, W.C.; Doehner, W.; Evans, J.; et al. Frailty consensus: A call to action. J. Am. Med. Dir. Assoc. 2013, 14, 392–397. [Google Scholar] [CrossRef] [Green Version]
- Fried, L.P.; Tangen, C.M.; Walston, J.; Newman, A.B.; Hirsch, C.; Gottdiener, J.; Seeman, T.; Tracy, R.; Kop, W.J.; Burke, G.; et al. Cardiovascular Health Study Collaborative Research Group. Frailty in older adults: Evidence for a phenotype. J. Gerontol. A Biol. Sci. Med. Sci. 2001, 56, M146–M156. [Google Scholar] [CrossRef]
- Clegg, A.; Rogers, L.; Young, J. Diagnostic test accuracy of simple instruments for identifying frailty in community-dwelling older people: A systematic review. Age Ageing 2015, 44, 148–152. [Google Scholar] [CrossRef] [Green Version]
- Santos-Eggimann, B.; Cuénoud, P.; Spagnoli, J.; Junod, J. Prevalence of frailty in middle-aged and older community-dwelling Europeans living in 10 countries. J. Gerontol. A Biol. Sci. Med. Sci. 2009, 64, 675–681. [Google Scholar] [CrossRef] [Green Version]
- Romero-Ortuno, R.; Walsh, C.D.; Lawlor, B.A.; Kenny, R.A. A frailty instrument for primary care: Findings from the Survey of Health, Ageing and Retirement in Europe (SHARE). BMC Geriatr. 2010, 10, 57. [Google Scholar] [CrossRef] [Green Version]
- Jürschik, P.; Nunin, C.; Botigué, T.; Escobar, M.A.; Lavedán, A.; Viladrosa, M. Prevalence of frailty and factors associated with frailty in the elderly population of Lleida, Spain: The FRALLE survey. Arch. Gerontol. Geriatr. 2012, 55, 625–631. [Google Scholar] [CrossRef]
- Ensrud, K.E.; Ewing, S.K.; Taylor, B.C.; Fink, H.A.; Cawthon, P.M.; Stone, K.L.; Hillier, T.A.; Cauley, J.A.; Hochberg, M.C.; Rodondi, N.; et al. Comparison of 2 frailty indexes for prediction of falls, disability, fractures, and death in older women. Arch. Intern. Med. 2008, 168, 382–389. [Google Scholar] [CrossRef] [Green Version]
- Nguyen, Q.D.; Wu, C.; Odden, M.C.; Kim, D.H. Multimorbidity Patterns, Frailty, and Survival in Community-Dwelling Older Adults. J. Gerontol. A Biol. Sci. Med. Sci. 2019, 74, 1265–1270. [Google Scholar] [CrossRef] [PubMed] [Green Version]
- Marcucci, M.; Franchi, C.; Nobili, A.; Mannucci, P.M.; Ardoino, I.; REPOSI Investigators. Defining aging phenotypes and related outcomes: Clues to recognize frailty in hospitalized older patients. J. Gerontol. A Biol. Sci. Med. Sci. 2017, 72, 395–402. [Google Scholar] [CrossRef] [PubMed]
- Chen, S.; Honda, T.; Chen, T.; Narazaki, K.; Haeuchi, Y.; Supartini, A.; Kumagai, S. Screening for frailty phenotype with objectively-measured physical activity in a west Japanese suburban community: Evidence from the Sasaguri Genkimon Study. BMC Geriatr. 2015, 15, 36. [Google Scholar] [CrossRef] [PubMed] [Green Version]
- Liu, L.K.; Guo, C.Y.; Lee, W.J.; Chen, L.Y.; Hwang, A.C.; Lin, M.H.; Peng, L.N.; Chen, L.K.; Liang, K.Y. Subtypes of physical frailty: Latent class analysis and associations with clinical characteristics and outcomes. Sci. Rep. 2017, 7, 46417. [Google Scholar] [CrossRef]
- Lohman, M.C.; Whiteman, K.L.; Greenberg, R.L.; Bruce, M.L. Incorporating persistent pain in phenotypic frailty measurement and prediction of adverse health outcomes. J. Gerontol. A Biol. Sci. Med. Sci. 2017, 72, 216–222. [Google Scholar] [CrossRef] [Green Version]
- Bandeen-Roche, K.; Xue, Q.L.; Ferrucci, L.; Walston, J.; Guralnik, J.M.; Chaves, P.; Zeger, S.L.; Fried, L.P. Phenotype of frailty: Characterization in the women’s health and aging studies. J. Gerontol. A Biol. Sci. Med. Sci. 2006, 61, 262–266. [Google Scholar] [CrossRef] [Green Version]
- Sadiq, F.; Kronzer, V.L.; Wildes, T.S.; McKinnon, S.L.; Sharma, A.; Helsten, D.L.; Scheier, L.M.; Avidan, M.S.; Ben Abdallah, A. Frailty Phenotypes and Relations with surgical outcomes: A latent class analysis. Anesth. Analg. 2018, 127, 1017–1027. [Google Scholar] [CrossRef]
- Romero-Ortuno, R.; Soraghan, C. A Frailty Instrument for primary care for those aged 75 years or more: Findings from the Survey of Health, Ageing and Retirement in Europe, a longitudinal population based cohort study (SHARE-FI75+). BMJ Open 2014, 4, e006645. [Google Scholar] [CrossRef] [Green Version]
- Segaux, L.; Oubaya, N.; Broussier, A.; Baude, M.; Canouï-Poitrine, F.; Naga, H.; Laurent, M.; Leissing-Desprez, C.; Audureau, E.; Ferrat, E.; et al. Identification of five frailty profiles in community-dwelling individuals aged 50–75: A latent class analysis of the SUCCEED survey data. Maturitas 2019, 127, 1–11. [Google Scholar] [CrossRef]
- Ingrand, I.; Paccalin, M.; Liuu, E.; Gil, R.; Ingrand, P. Positive perception of aging is a key predictor of quality-of-life in aging people. PLoS ONE 2018, 13, e0204044. [Google Scholar] [CrossRef]
- Sentandreu-Mañó, T.; Badenes-Ribera, L.; Fernández, I.; Oliver, A.; Burks, D.J.; Tomás, J.M. Frailty in the old age as a direct marker of quality of life and health: Gender differences. Soc. Indic. Res. 2019. [Google Scholar] [CrossRef]
- Chang, S.F.; Wen, G.M. Association of frail index and quality of life among community-dwelling older adults. J. Clin. Nurs. 2016, 25, 2305–2316. [Google Scholar] [CrossRef] [PubMed]
- Pinto, J.M.; Fontaine, A.M.; Neri, A.L. The influence of physical and mental health on life satisfaction is mediated by self-rated health: A study with Brazilian elderly. Arch. Gerontol. Geriatr. 2016, 65, 104–110. [Google Scholar] [CrossRef] [PubMed]
- Gale, C.R.; Cooper, C.; Deary, I.J.; Aihie Sayer, A. Psychological well-being and incident frailty in men and women: The English Longitudinal Study of Ageing. Psychol. Med. 2014, 44, 697–706. [Google Scholar] [CrossRef] [Green Version]
- Mulasso, A.; Roppolo, M.; Rabaglietti, E. The role of individual characteristics and physical frailty on health related quality of life (HRQOL): A cross sectional study of Italian community-dwelling older adults. Arch. Gerontol. Geriatr. 2014, 59, 542–548. [Google Scholar] [CrossRef] [PubMed]
- Bilotta, C.; Bowling, A.; Casè, A.; Nicolini, P.; Mauri, S.; Castelli, M.; Vergani, C. Dimensions and correlates of quality of life according to frailty status: A cross-sectional study on community-dwelling older adults referred to an outpatient geriatric service in Italy. Health Qual. Life Outcomes 2010, 8, 56. [Google Scholar] [CrossRef] [Green Version]
- Lenardt, M.H.; Carneiro, N.H.; Binotto, M.A.; Willig, M.H.; Lourenço, T.M.; Albino, J. Frailty and quality of life in elderly primary health care users. Rev. Bras. Enferm 2016, 69, 478–483. [Google Scholar] [CrossRef] [Green Version]
- Ferrer, A.; Formiga, F.; Cunillera, O.; Megido, M.J.; Corbella, X.; Almeda, J. Predicting factors of health-related quality of life in octogenarians: A 3-year follow-up longitudinal study. Qual. Life Res. 2015, 24, 2701–2711. [Google Scholar] [CrossRef]
- Chang, Y.W.; Chen, W.L.; Lin, F.G.; Fang, W.H.; Yen, M.Y.; Hsieh, C.C.; Kao, T.W. Frailty and its impact on health-related quality of life: A cross-sectional study on elder community-dwelling preventive health service users. PLoS ONE 2012, 7, e38079. [Google Scholar] [CrossRef] [Green Version]
- Lin, C.C.; Li, C.I.; Chang, C.K.; Liu, C.S.; Lin, C.H.; Meng, N.H.; Lee, Y.D.; Chen, F.N.; Li, T.C. Reduced health-related quality of life in elders with frailty: A cross-sectional study of community-dwelling elders in Taiwan. PLoS ONE 2011, 6, e21841. [Google Scholar] [CrossRef]
- Masel, M.C.; Graham, J.E.; Reistetter, T.A.; Markides, K.S.; Ottenbacher, K.J. Frailty and health related quality of life in older Mexican Americans. Health Qual. Life Outcomes 2009, 7, 70. [Google Scholar] [CrossRef] [PubMed] [Green Version]
- Börsch-Supan, A. Survey of Health, Ageing and Retirement in Europe (SHARE) Wave 6. Release version: 6.1.1 SHARE-ERIC. Data Set. 2018. Available online: http://www.share-project.org/home0.html (accessed on 16 September 2020).
- Börsch-Supan, A.; Brandt, M.; Hunkler, C.; Kneip, T.; Korbmacher, J.; Malter, F.; Schaan, B.; Stuck, S.; Zuber, S.; SHARE Central Coordination Team. Data Resource Profile: The Survey of Health, Ageing and Retirement in Europe (SHARE). Int. J. Epidemiol. 2013, 42, 992–1001. [Google Scholar] [CrossRef] [PubMed]
- Malter, F.; Börsch-Supan, A. SHARE Wave 6: Panel innovations and collecting Dried Blood Spots; MEA, Max Planck Institute for Social Law and Social Policy: Munich, Germany, 2017. [Google Scholar]
- Romero-Ortuno, R. The Frailty Instrument of the Survey of Health, Ageing and Retirement in Europe (SHARE-FI) predicts mortality beyond age, comorbidities, disability, self-rated health, education and depression. Eur. Geriatr. Med. 2011, 2, 323–326. [Google Scholar] [CrossRef] [Green Version]
- Macklai, N.S.; Spagnoli, J.; Junod, J.; Santos-Eggimann, B. Prospective association of the SHARE-operationalized frailty phenotype with adverse health outcomes: Evidence from 60+ community-dwelling Europeans living in 11 countries. BMC Geriatr. 2013, 13, 3. [Google Scholar] [CrossRef] [PubMed] [Green Version]
- Hyde, M.; Wiggins, R.D.; Higgs, P.; Blane, D.B. A measure of quality of life in early old age: The theory, development and properties of a needs satisfaction model (CASP-19). Aging Ment. Health 2003, 7, 186–194. [Google Scholar] [CrossRef]
- Von dem Knesebeck, O.; Hyde, M.; Higgs, P.; Kupfer, A.; Siegrist, J. Quality of life and wellbeing. In Health, Ageing and Retirement in Europe—First Results from the Survey of Health, Ageing and Retirement in Europe; Börsch-Supan, A., Brugiavini, A., Jürges, H., Mackenbach, J., Siegrist, J., Weber, G., Eds.; Mannheim Research Institute for the Economics of Aging (MEA): Mannheim, Germany, 2005; pp. 199–203. [Google Scholar]
- Ware, J.E., Jr.; Gandek, B. Overview of the SF-36 Health Survey and the International Quality of Life Assessment (IQOLA) Project. J. Clin. Epidemiol. 1998, 51, 903–912. [Google Scholar] [CrossRef]
- Muthén, L.K.; Muthén, B.O. Mplus User’s Guide, 7th ed.; Muthén & Muthén: Los Angeles, CA, USA, 2012. [Google Scholar]
- Muthén, B. Latent variable hybrids: Overview of old and new models. In Advances in Latent Variable Mixture Models; Hancock, G.R., Samuelsen, K.M., Eds.; Information Age Publishing, Inc.: Charlotte, NC, USA, 2008; pp. 1–24. [Google Scholar]
- Lo, Y.; Mendell, N.; Rubin, D. Testing the number of components in a normal mixture. Biometrika 2001, 88, 767–778. [Google Scholar] [CrossRef]
- McLachlan, G.; Peel, D. Finite Mixture Models; Wiley: New York, NY, USA, 2000. [Google Scholar]
- Lukočienė, O.; Varriale, R.; Vermunt, J.K. The simultaneous decision(s) about the number of lower- and higher-level classes in multilevel latent class analysis. Sociol. Methodol. 2010, 40, 247–283. [Google Scholar] [CrossRef]
- Janssen, J.H.M.; van Laar, S.; de Rooij, M.J.; Kuha, J.; Bakk, Z. The Detection and modeling of direct effects in latent class analysis. Struct. Equ. Model. 2018, 26, 280–290. [Google Scholar] [CrossRef] [Green Version]
- Nylund, K.L.; Asparouhov, T.; Muthén, B.O. Deciding on the number of classes in latent class analysis and growth mixture modeling: A Monte Carlo simulation study. Struct. Equ. Model. 2007, 14, 535–569. [Google Scholar] [CrossRef]
- García-García, F.J.; Larrión Zugasti, J.L.; Rodríguez Mañas, L. Frailty: A phenotype under review. Gac. Sanit. 2011, 25, 51–58. [Google Scholar] [CrossRef] [PubMed] [Green Version]
- Xue, Q.L. The frailty syndrome: Definition and natural history. Clin. Geriatr. Med. 2011, 27, 1–15. [Google Scholar] [CrossRef] [PubMed] [Green Version]
- Satake, S.; Arai, H. Chapter 1 Frailty: Definition, diagnosis, epidemiology. Geriatr. Gerontol. Int. 2020, 20, 7–13. [Google Scholar] [CrossRef] [PubMed]
- Collard, R.M.; Boter, H.; Schoevers, R.A. Oude Voshaar RC. Prevalence of frailty in community-dwelling older persons: A systematic review. J. Am. Geriatr. Soc. 2012, 60, 1487–1492. [Google Scholar] [CrossRef] [PubMed]
- Romero-Ortuno, R.; Fouweather, T.; Jagger, C. Cross-national disparities in sex differences in life expectancy with and without frailty. Age Ageing 2014, 43, 222–228. [Google Scholar] [CrossRef] [PubMed] [Green Version]
- Hubbard, R.E.; Rockwood, K. Frailty in older women. Maturitas 2011, 69, 203–207. [Google Scholar] [CrossRef] [PubMed]


| Variable | Mean ± SD or n (%) |
|---|---|
| Gender | |
| Female | 1044 (59.2%) |
| Male | 721 (40.8) |
| Frailty condition | |
| Pre-frail | 1285 (72.8%) |
| Frail | 480 (27.2%) |
| Age | 75.22 (8.86) |
| Appetite (Loss) | 321 (20.5) |
| Fatigue (Yes) | 1002 (63.9) |
| Slowness (Yes) | 731 (41.4) |
| Strength (Lack) | 767 (57.1) |
| Activity (Inactive) | 728 (41.2) |
| Perceived Health | |
| Poor | 451 (25.6) |
| Fair | 672 (38.1) |
| Good | 508 (28.8) |
| Very good | 114 (6.5) |
| Excellent | 20 (1.1) |
| Quality of Life | 33.40 ± 6.32 |
| #Classes | AIC | BIC | ABIC | Entropy | LMR Test | p | BLR Test | p |
|---|---|---|---|---|---|---|---|---|
| 1 | 10,271.1 | 10,298.5 | 10,282.6 | NA | NA | NA | NA | NA |
| 2 | 9993.4 | 10,053.7 | 10,018.7 | 0.717 | 283.3 | <0.001 | 289.6 | <0.001 |
| 3 | 9828.1 | 9921.2 | 9867.2 | 0.787 | 173.4 | <0.001 | 177.3 | <0.001 |
| 4 | 9737.3 | 9863.2 | 9790.2 | 0.680 | 100.5 | <0.001 | 102.8 | <0.001 |
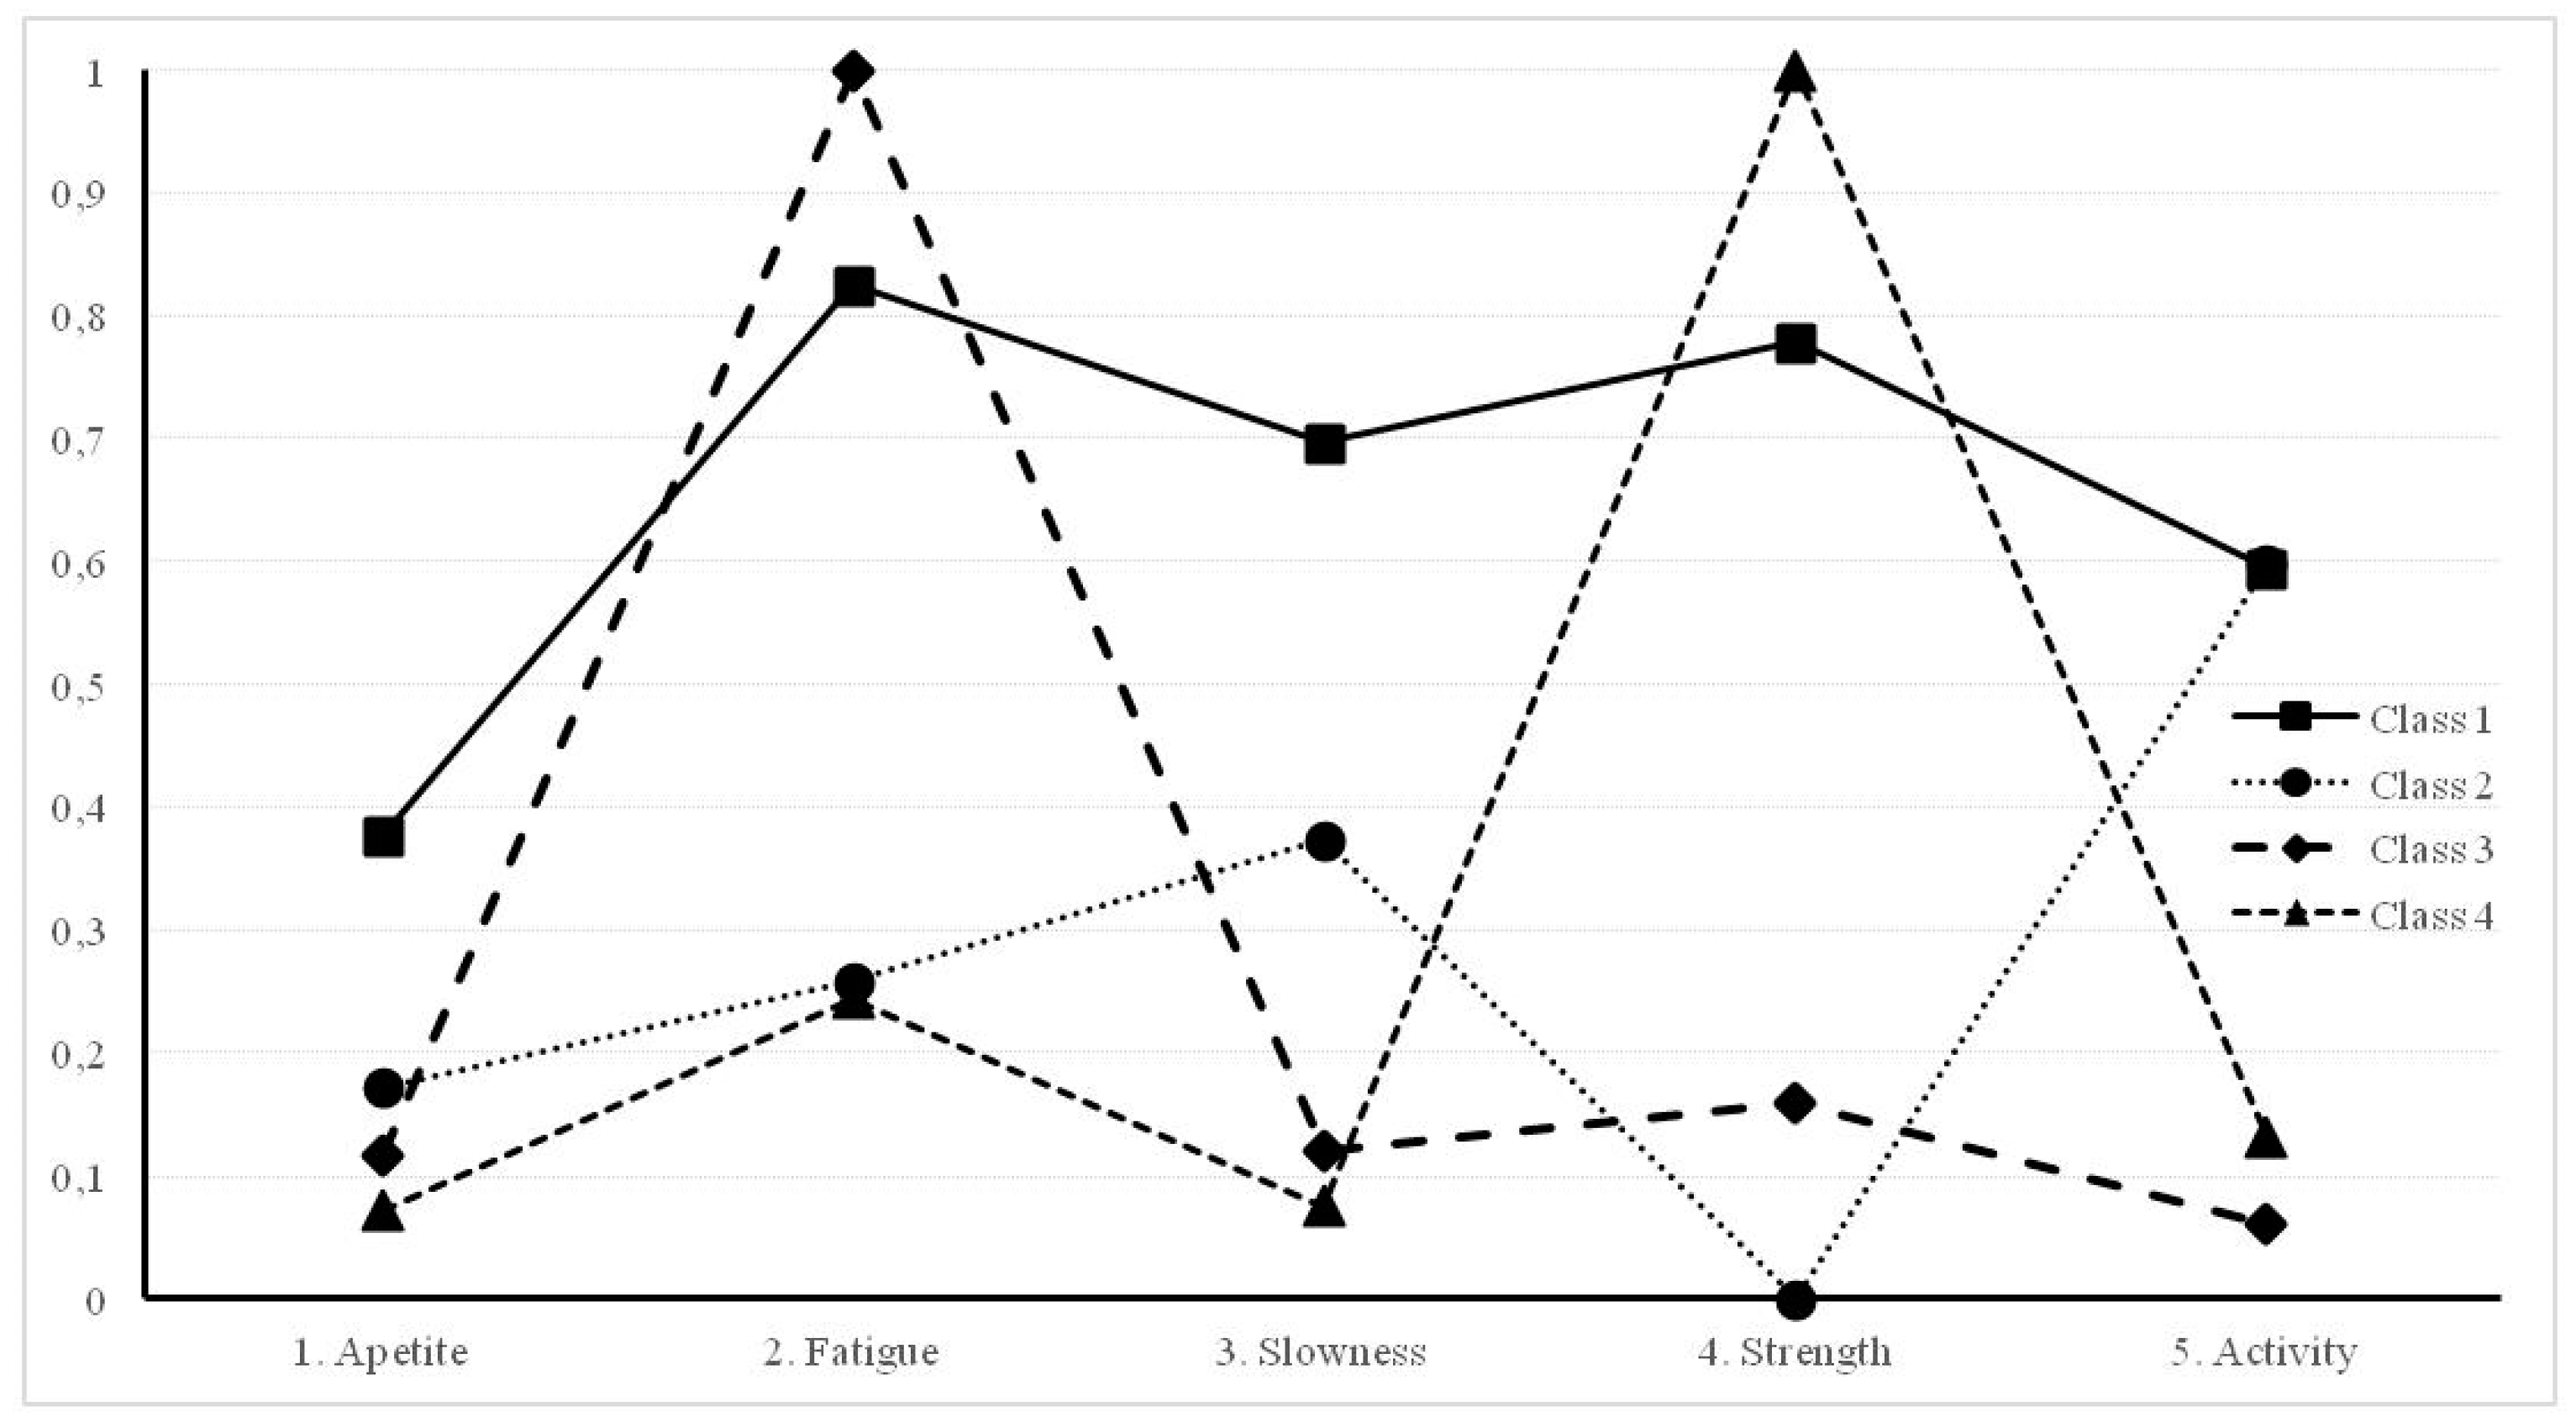
| Indicators | Class 1. Frail n = 526 | Class 2. Mobility Problems n = 207 | Class 3. Fatigued n = 364 | Class 4. Lack of Strength n = 384 |
|---|---|---|---|---|
| 1. Appetite | 0.377 | 0.172 | 0.117 | 0.072 |
| 2. Fatigue | 0.826 | 0.259 | 1.00 | 0.245 |
| 3. Slowness | 0.697 | 0.374 | 0.120 | 0.076 |
| 4. Strength | 0.779 | 0.000 | 0.160 | 1.00 |
| 5. Activity | 0.595 | 0.598 | 0.062 | 0.132 |
| Covariate | Class 2 vs. Class 1 | ||||||
| Effect | SE | p | Odd-Ratio | SE | 95% CI | p | |
| Age | −0.133 | 0.02 | <0.01 | 0.875 | 0.02 | 0.835–0.914 | <0.01 |
| Gender (0 = female, 1 = male) | −0.489 | 0.03 | 0.11 | 0.614 | 0.18 | 0.254–0.974 | 0.04 |
| Quality of Life | 0.023 | 0.03 | <0.01 | 1.225 | 0.04 | 1.145–1.305 | <0.01 |
| Perceived Health | 1.772 | 0.31 | <0.01 | 5.882 | 1.81 | 2.262–9.502 | <0.01 |
| Covariate | Class 3 vs. Class 1 | ||||||
| Effect | SE | p | Odd-Ratio | SE | 95% CI | p | |
| Age | −0.18 | 0.02 | <0.01 | 0.804 | 0.01 | 0.784–0.824 | <0.01 |
| Gender (0 = female, 1 = male) | −0.53 | 0.28 | 0.06 | 0.585 | 0.16 | 0.265–0.905 | 0.01 |
| Quality of Life | 0.169 | 0.03 | <0.01 | 1.184 | 0.04 | 1.104–1.264 | <0.01 |
| Perceived Health | 1.676 | 0.25 | <0.01 | 5.347 | 1.37 | 2.607–8.807 | <0.01 |
| Covariate | Class 4 vs. Class 1 | ||||||
| Effect | SE | p | Odd-Ratio | SE | 95% CI | p | |
| Age | −0.084 | 0.02 | <0.01 | 0.919 | 0.02 | 0.879–0.959 | <0.01 |
| Gender (0 = female, 1 = male) | −1.099 | 0.28 | <0.01 | 0.333 | 0.09 | 0.153–0.513 | <0.01 |
| Quality of Life | 0.169 | 0.03 | <0.01 | 1.265 | 0.04 | 1.185–1.345 | <0.01 |
| Perceived Health | 1.679 | 0.26 | <0.01 | 7.011 | 1.86 | 3.290–10.73 | <0.01 |
© 2020 by the authors. Licensee MDPI, Basel, Switzerland. This article is an open access article distributed under the terms and conditions of the Creative Commons Attribution (CC BY) license (http://creativecommons.org/licenses/by/4.0/).
Share and Cite
Tomás, J.M.; Sentandreu-Mañó, T.; Fernández, I. Frailty Status Typologies in Spanish Older Population: Associations with Successful Aging. Int. J. Environ. Res. Public Health 2020, 17, 6772. https://doi.org/10.3390/ijerph17186772
Tomás JM, Sentandreu-Mañó T, Fernández I. Frailty Status Typologies in Spanish Older Population: Associations with Successful Aging. International Journal of Environmental Research and Public Health. 2020; 17(18):6772. https://doi.org/10.3390/ijerph17186772
Chicago/Turabian StyleTomás, José M., Trinidad Sentandreu-Mañó, and Irene Fernández. 2020. "Frailty Status Typologies in Spanish Older Population: Associations with Successful Aging" International Journal of Environmental Research and Public Health 17, no. 18: 6772. https://doi.org/10.3390/ijerph17186772