Benefits and Costs of a Community-Led Total Sanitation Intervention in Rural Ethiopia—A Trial-Based Ex Post Economic Evaluation

 ,
,
Abstract
:1. Introduction
2. Materials and Methods
2.1. Study Area
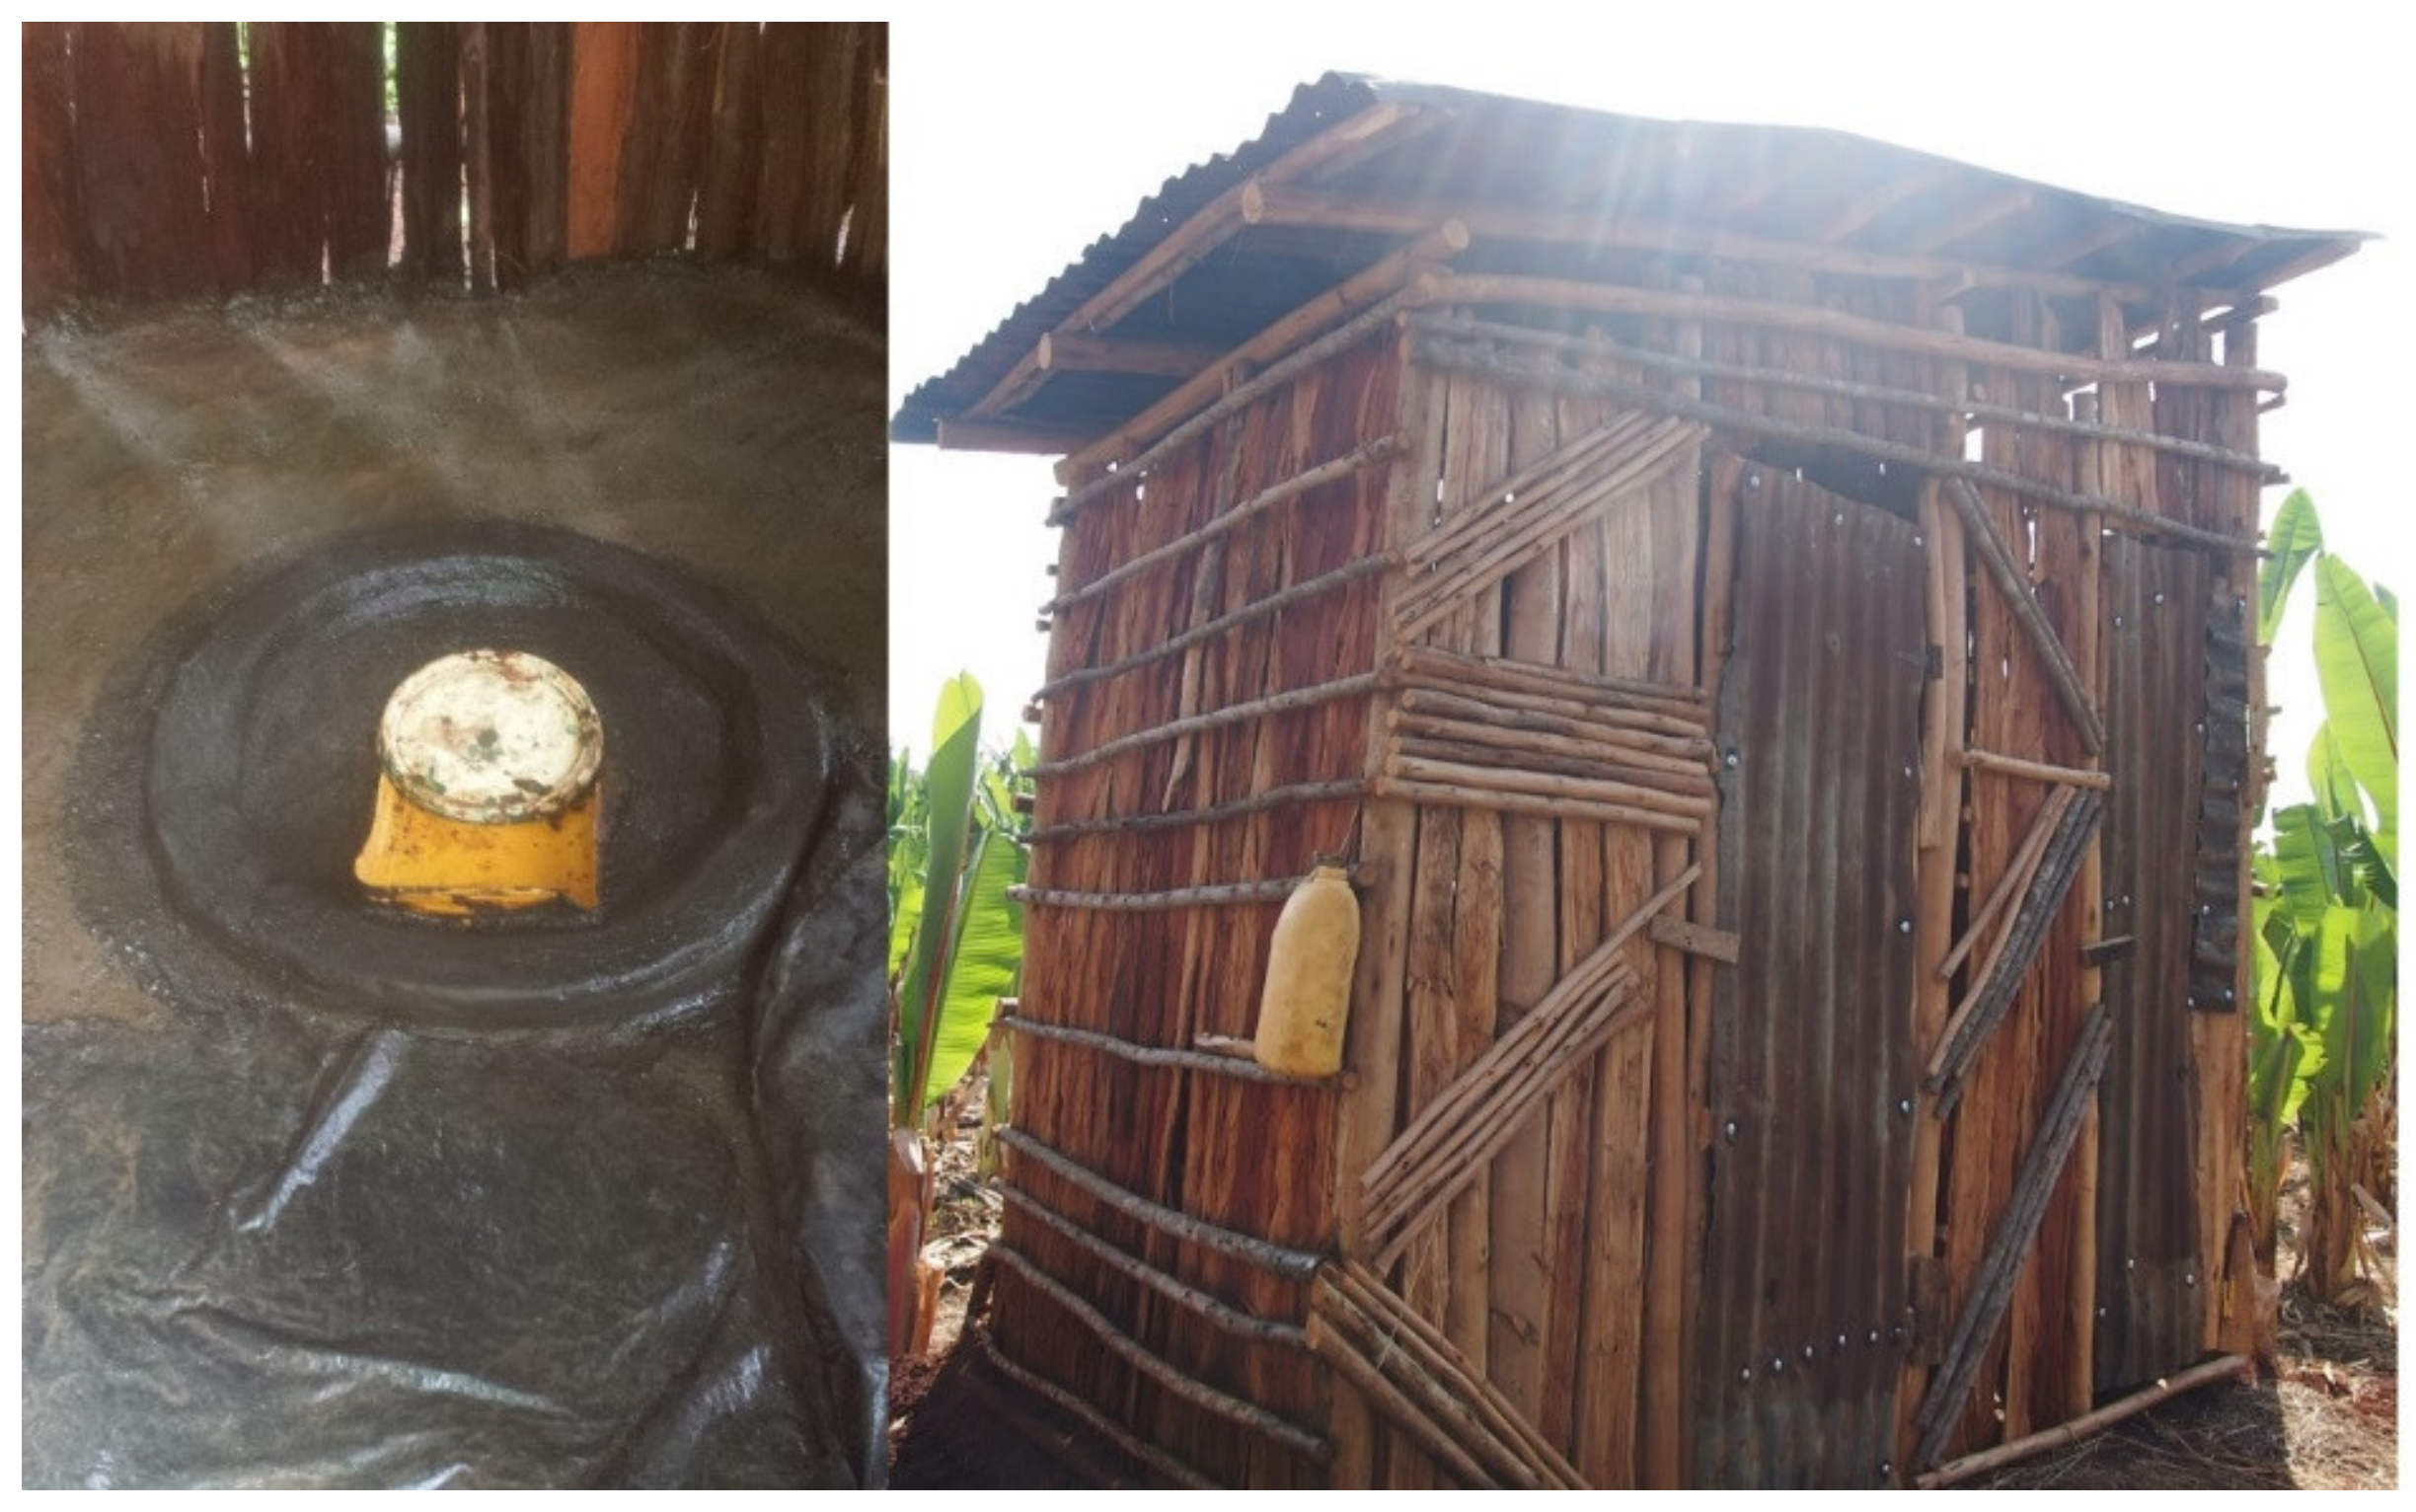
2.2. Intervention
2.3. Study Design
2.4. Benefit Measurements
2.4.1. Health Benefits
2.4.2. Time Savings from Increased Accessibility to a Household Latrine
2.5. Cost Measurements
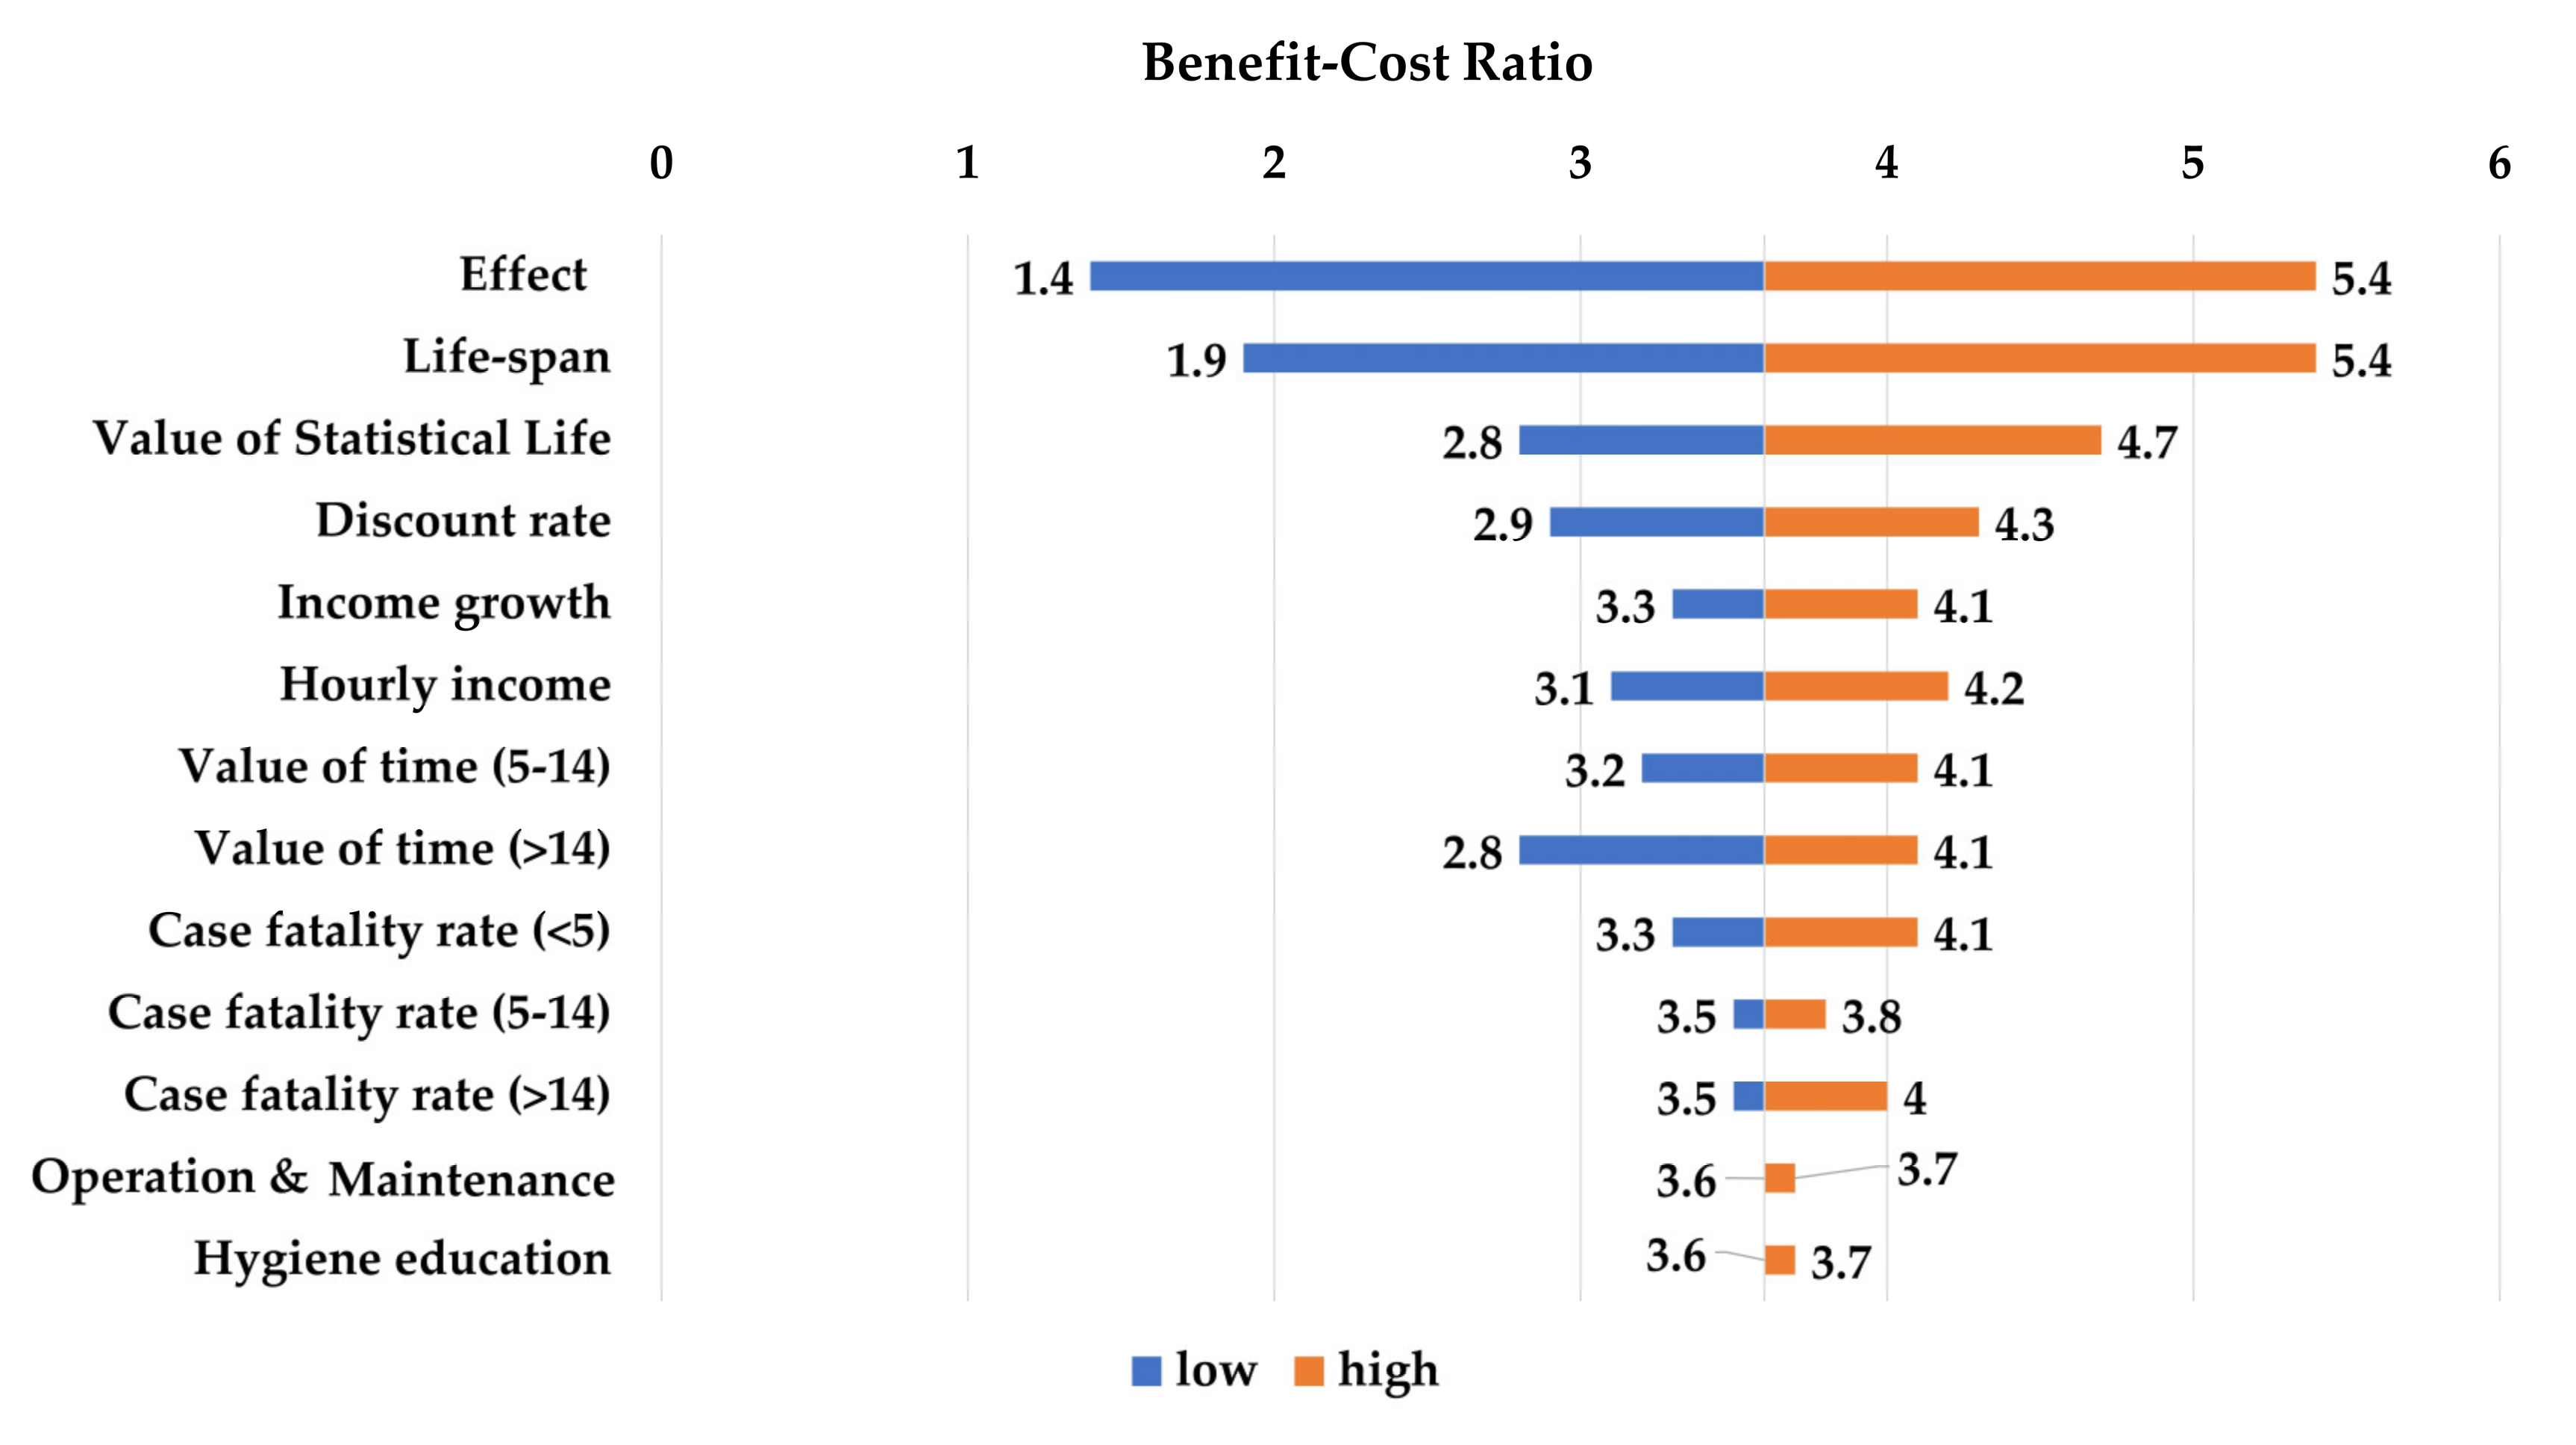
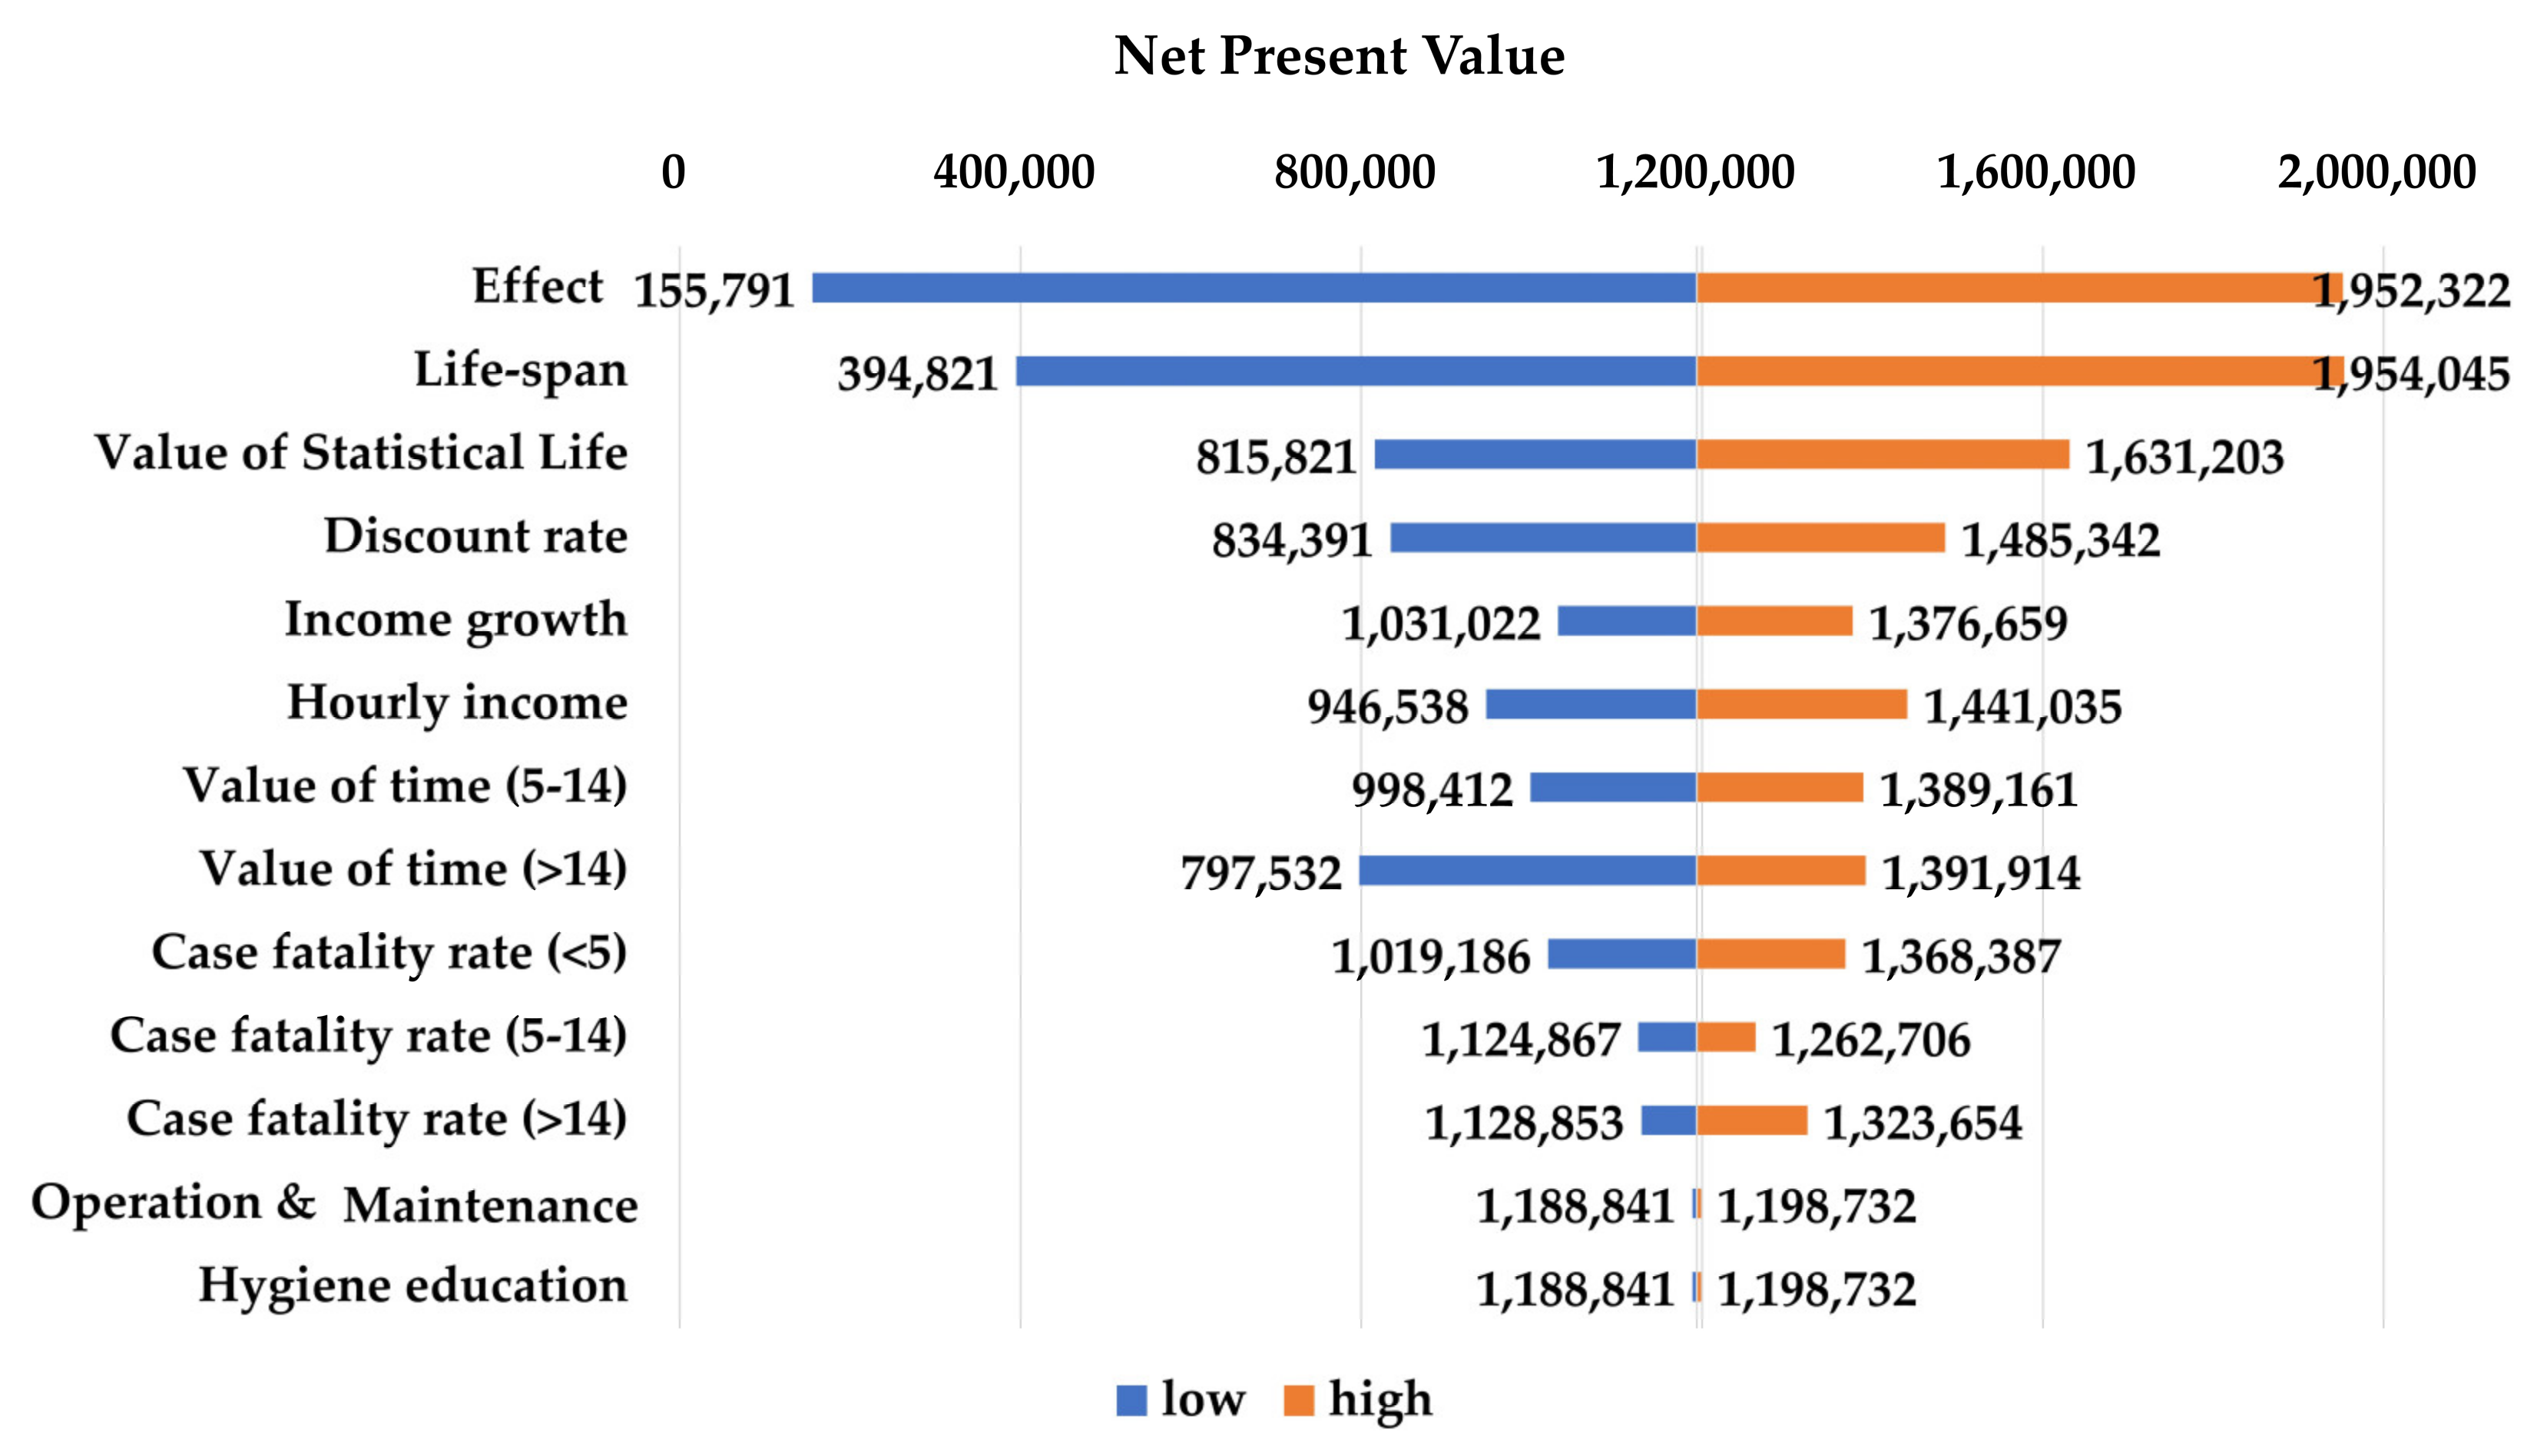
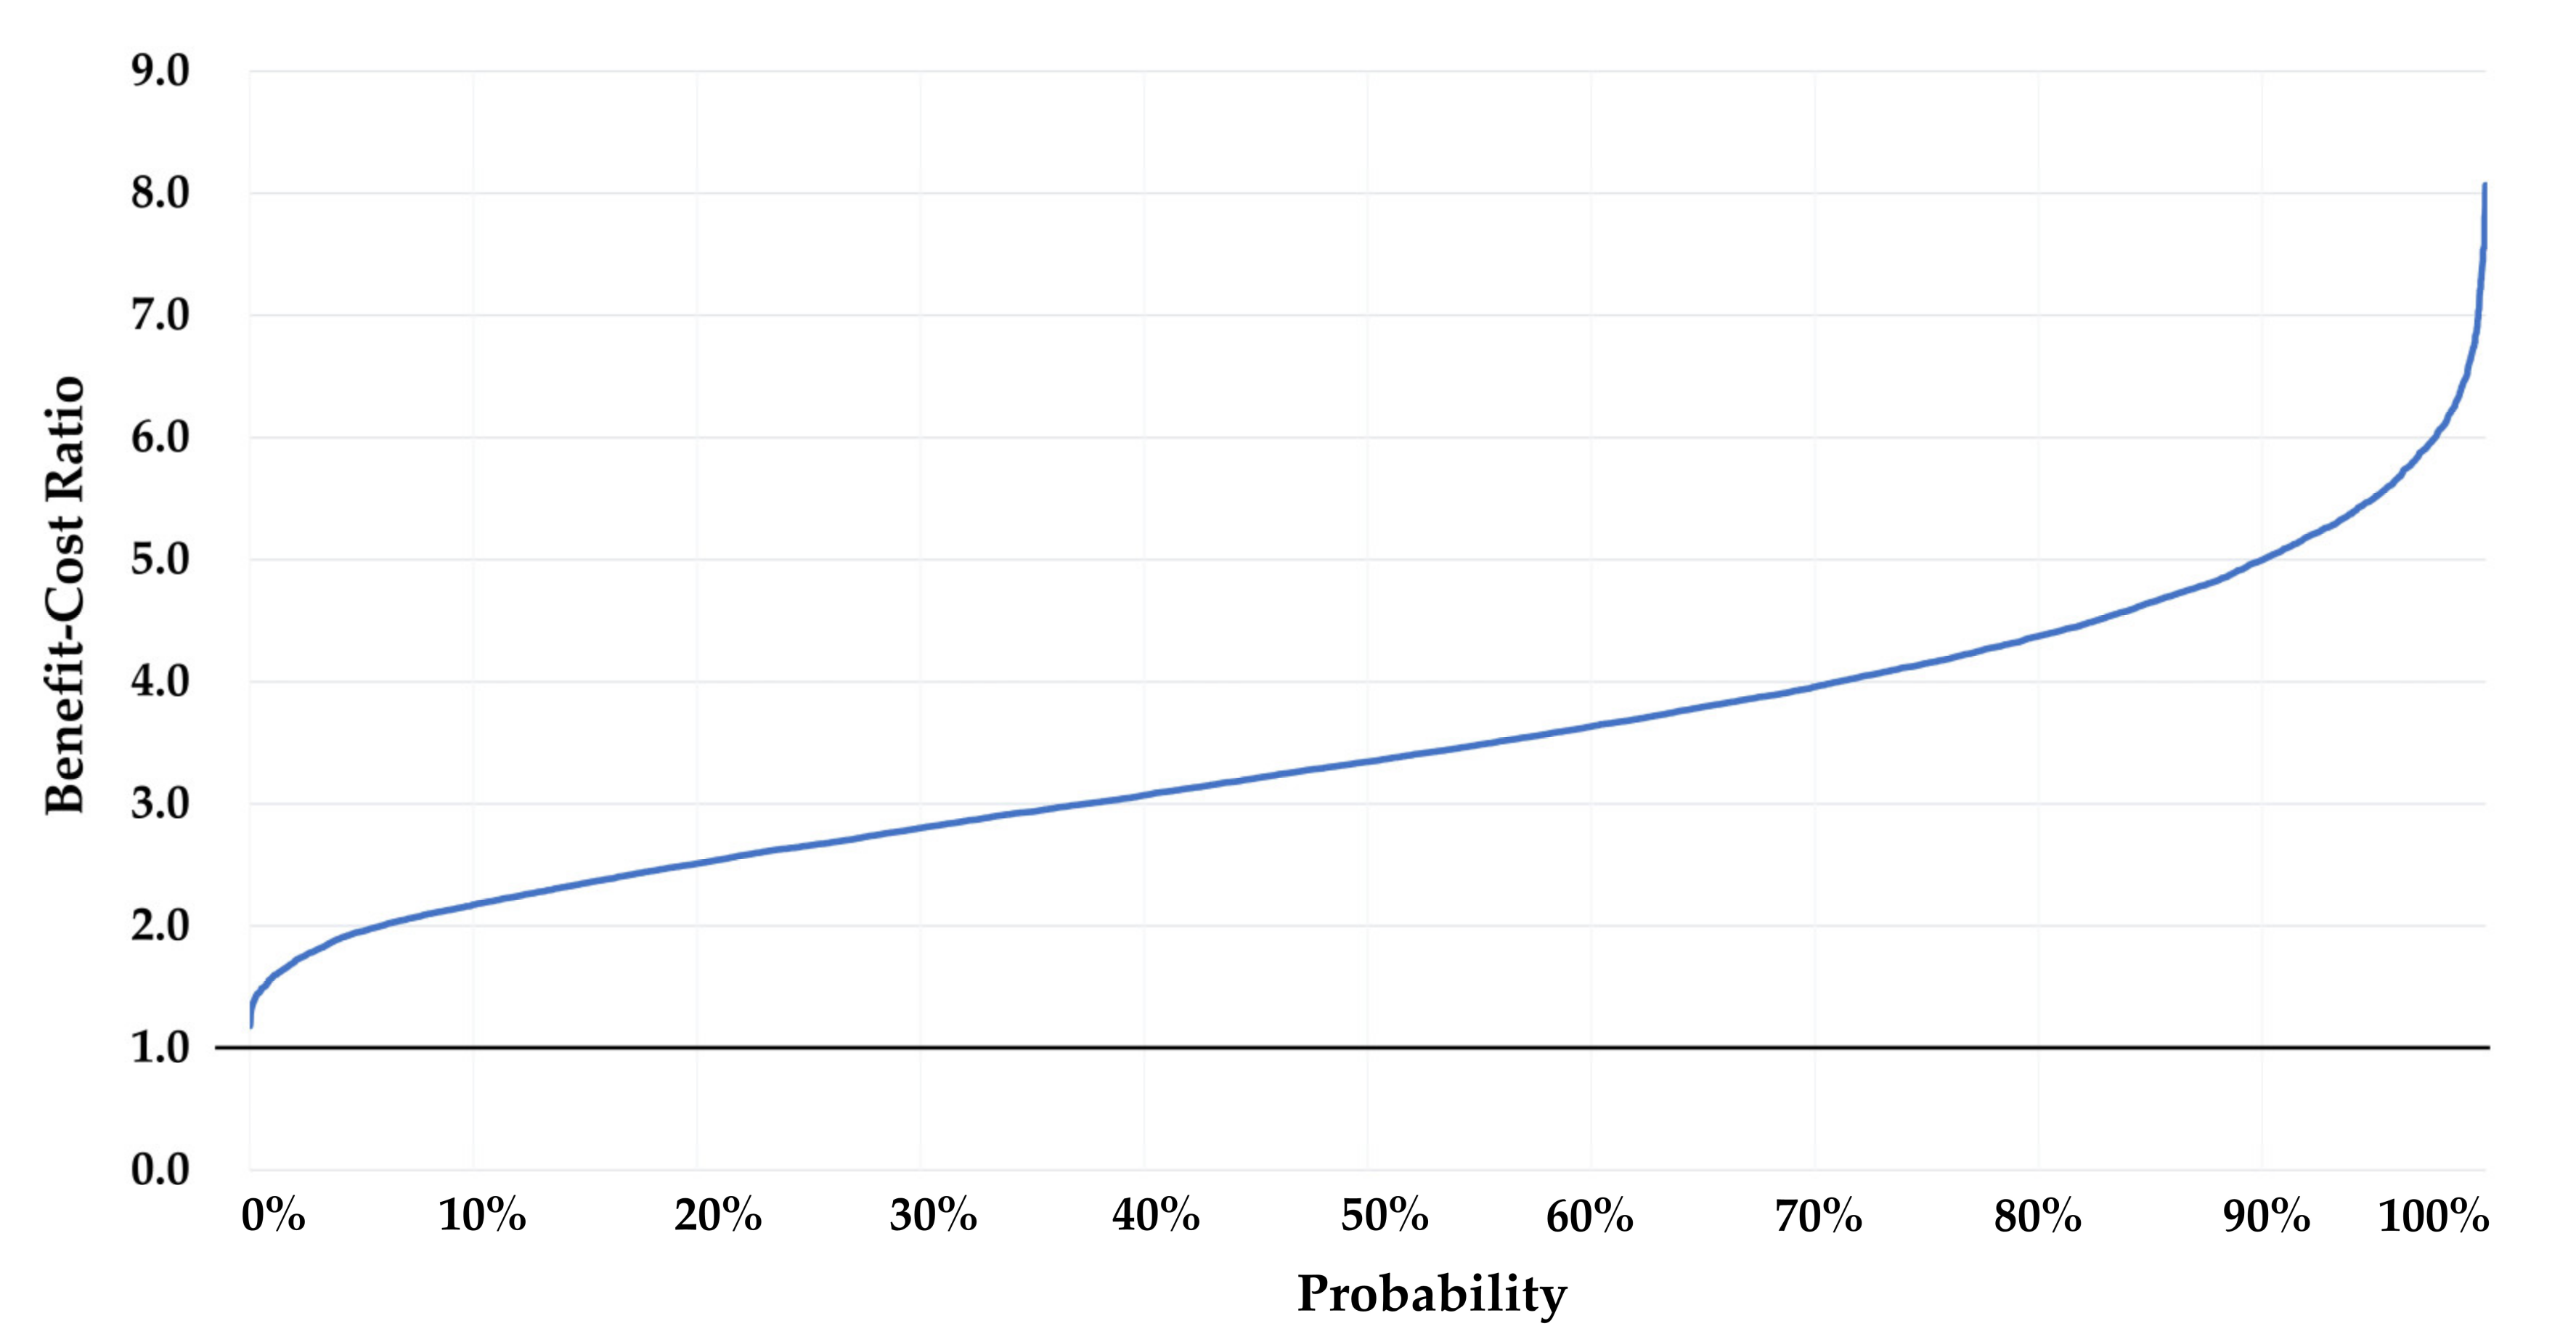
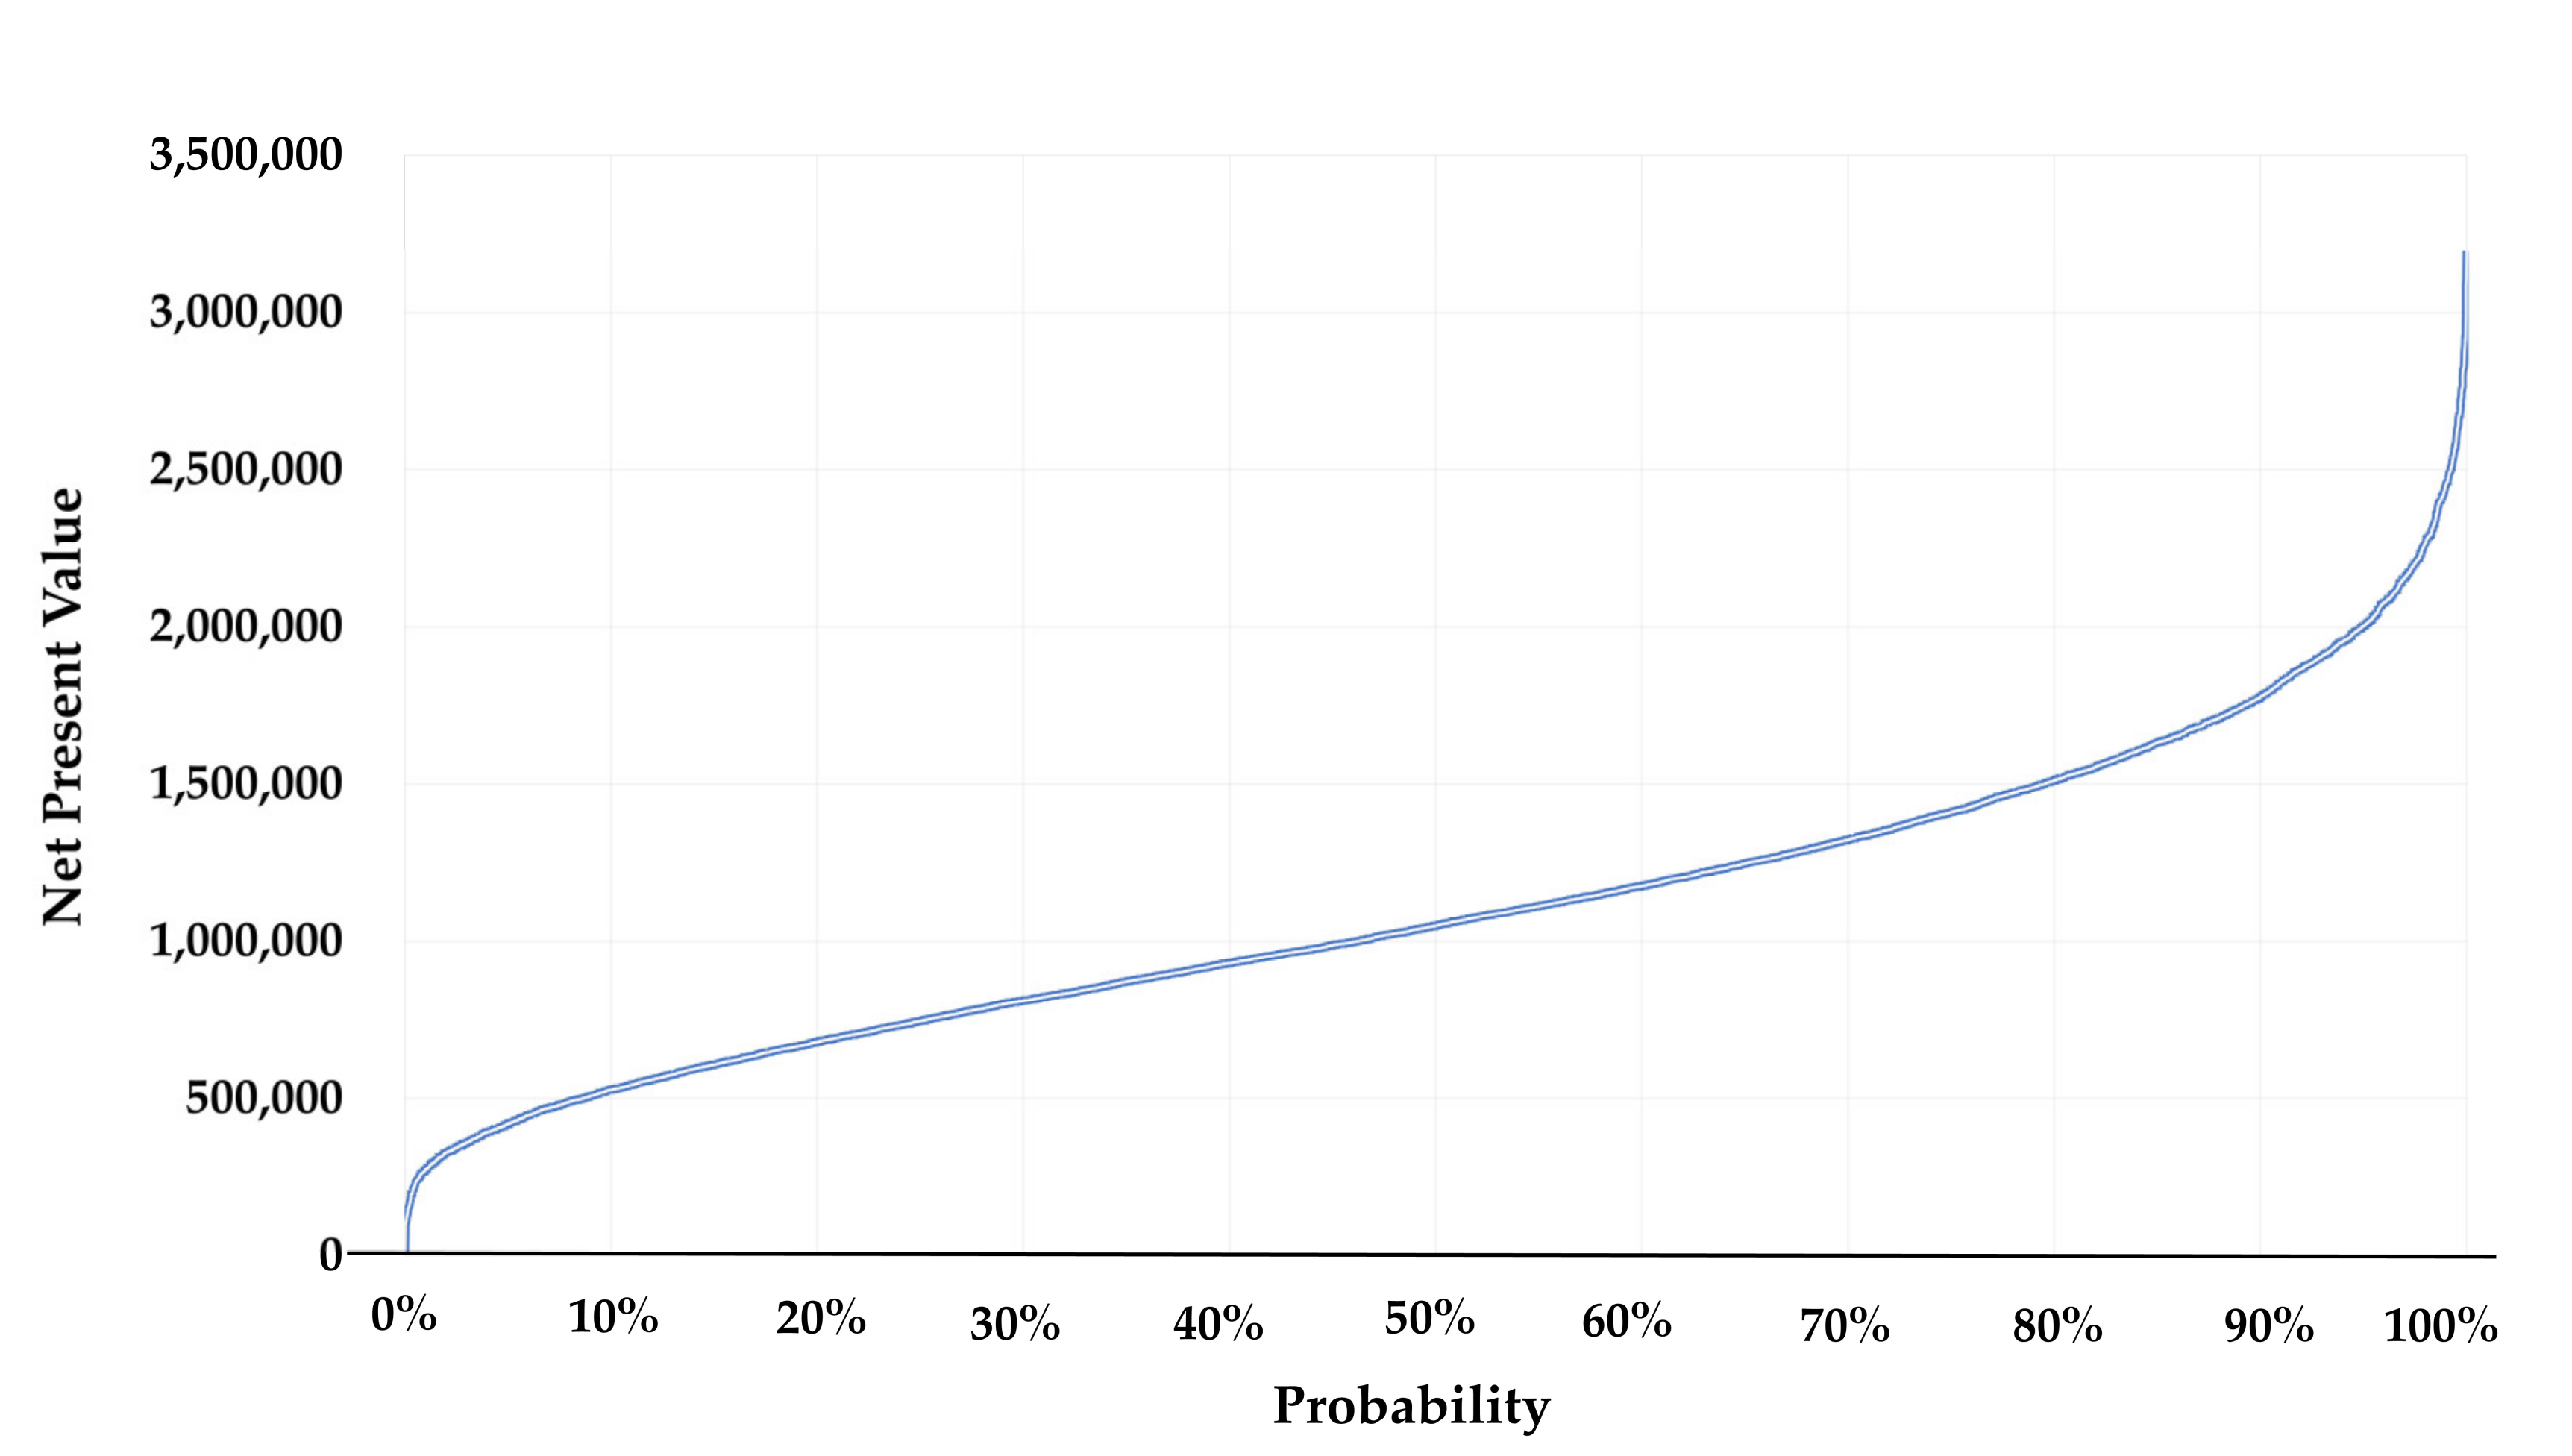
2.6. Sensitivity Analyses
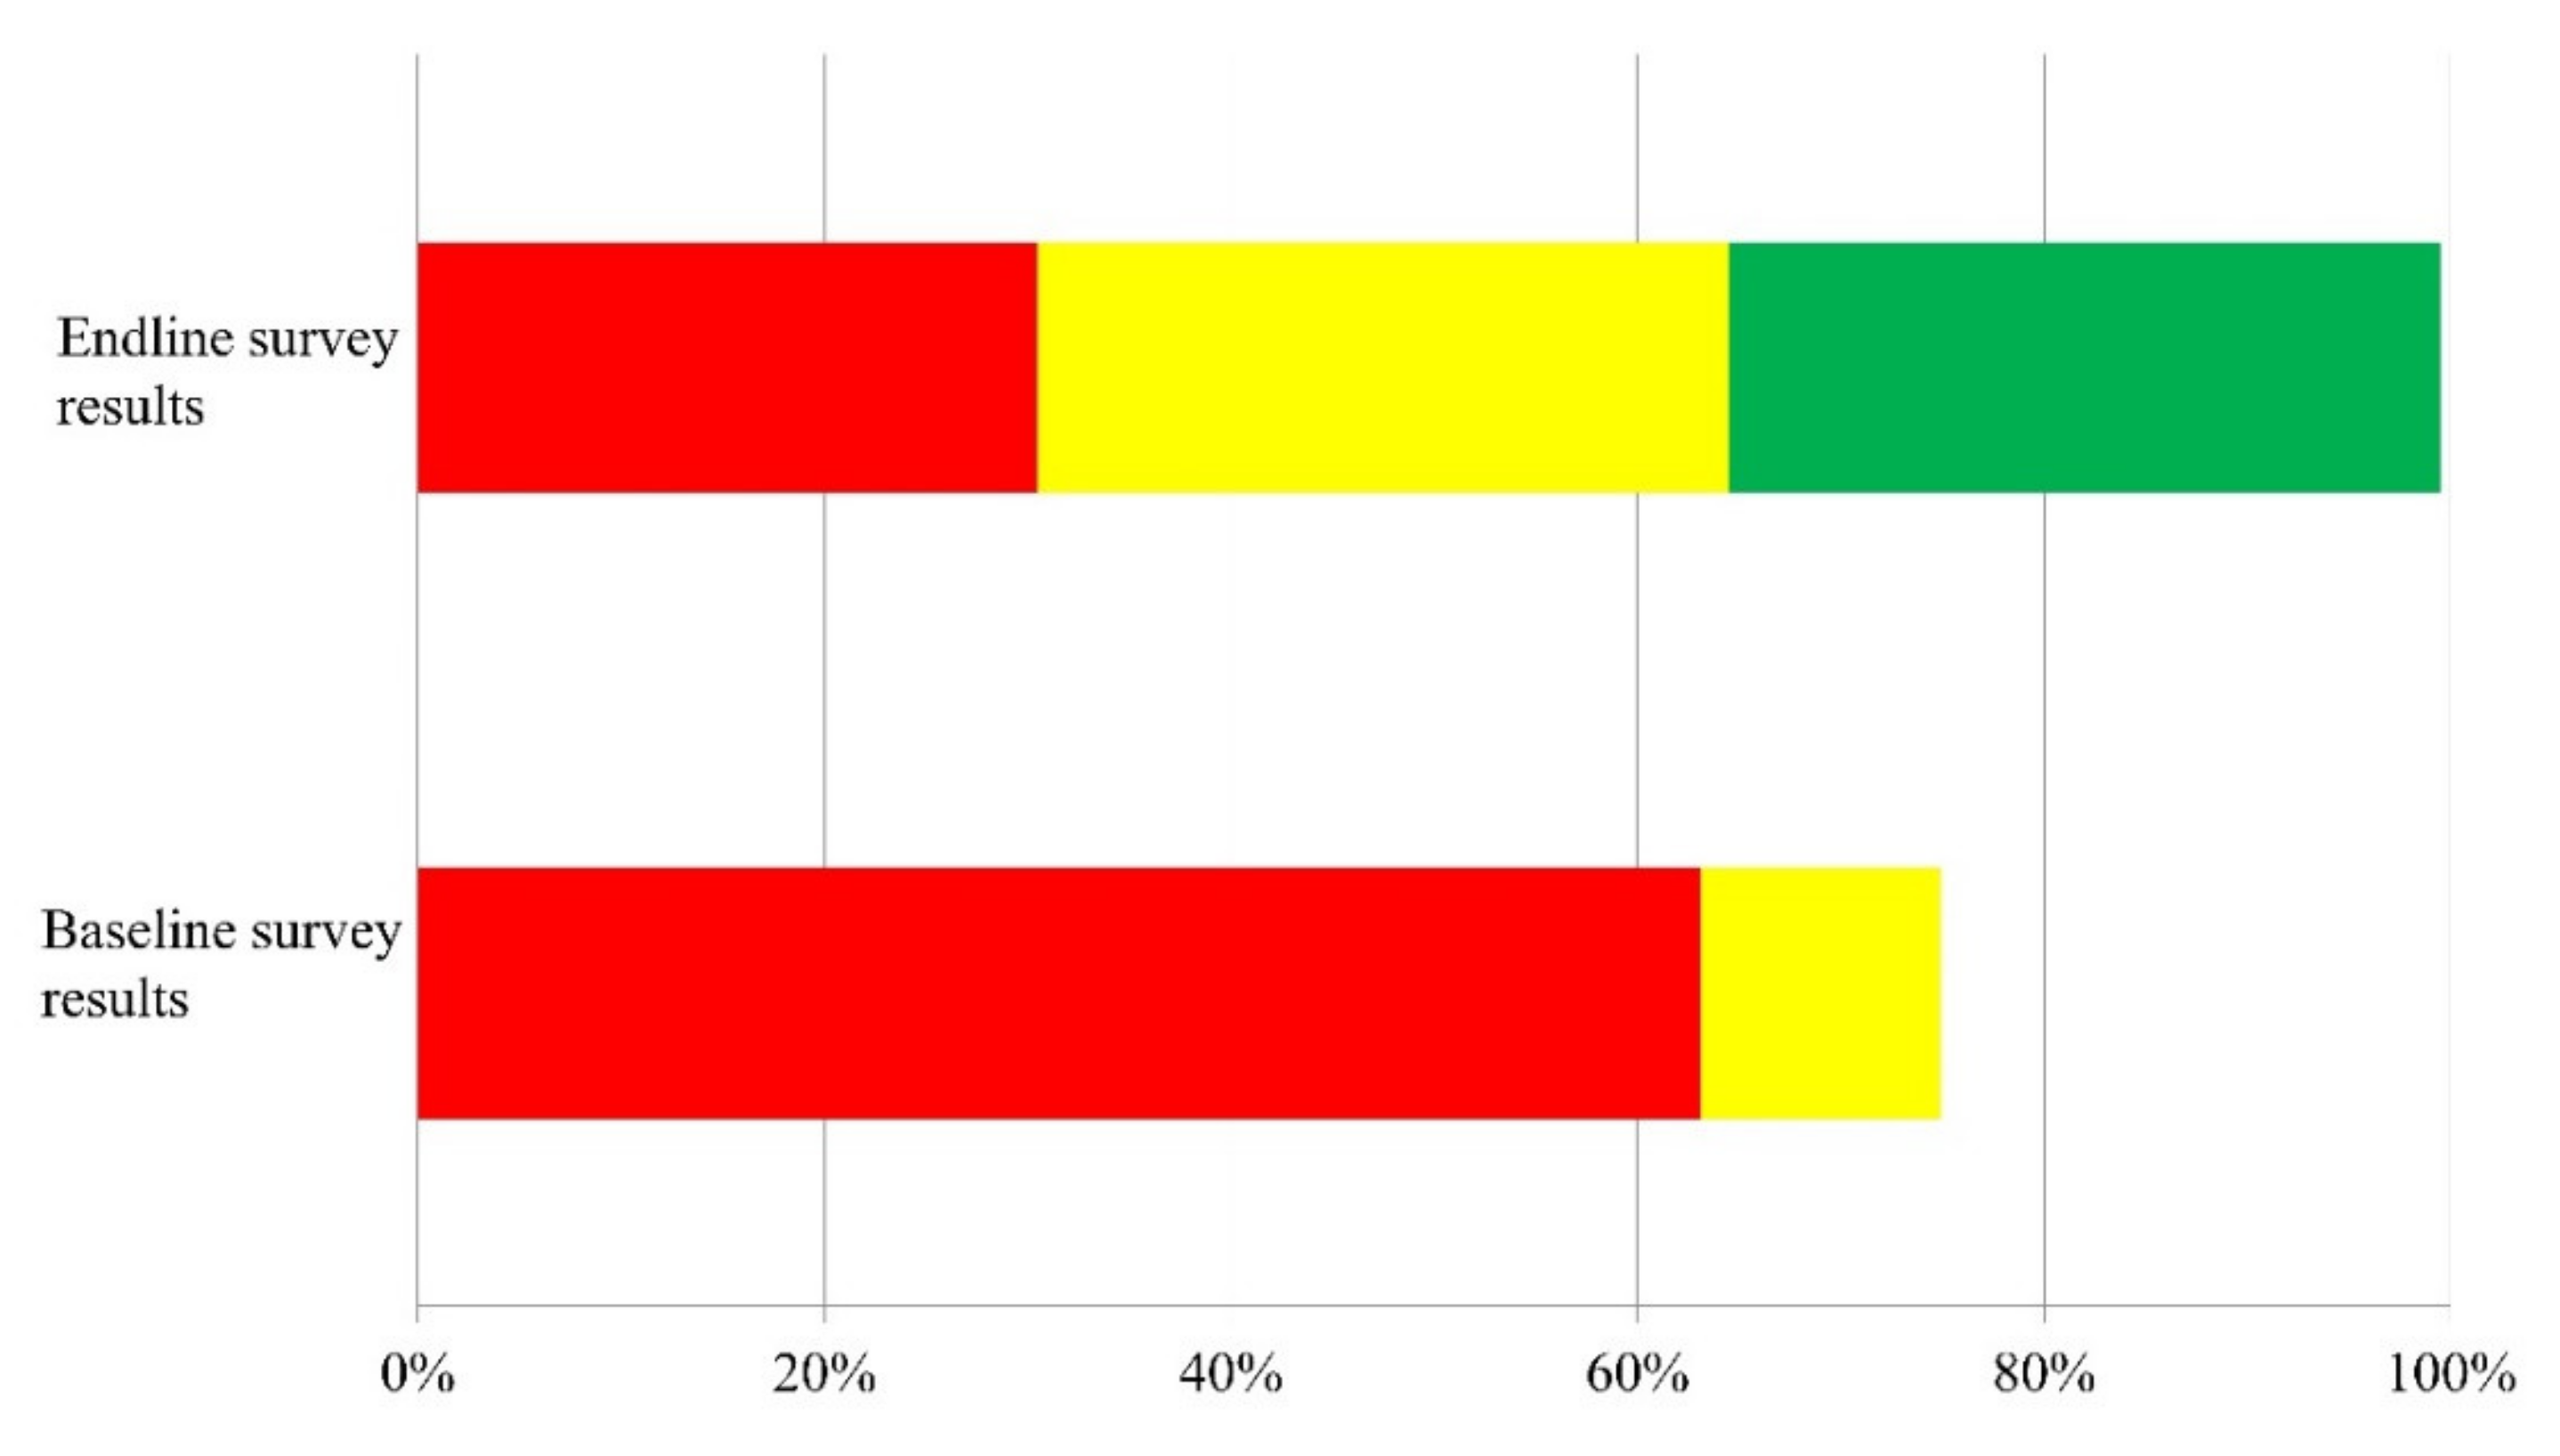
3. Results
4. Discussion
5. Conclusions
Supplementary Materials
Author Contributions
Funding
Acknowledgments
Conflicts of Interest
References
- UN. Transforming Our World: The 2030 Agenda for Sustainable Development; United Nations: New York, NY, USA, 2015. [Google Scholar]
- WHO/UNICEF. Progress on Household Drinking Water, Sanitation and Hygiene 2000–2017: Special Focus on Inequalities; World Health Organization: Geneva, Switzerland, 2019. [Google Scholar]
- Kar, K.; Chambers, R. CLTS Handbook; Plan UK: London, UK, 2008; Available online: https://www.communityledtotalsanitation.org/resource/handbook-community-led-total-sanitation (accessed on 27 June 2020).
- Venkataramanan, V.; Crocker, J.; Karon, A.; Bartram, J. Community-Led Total Sanitation: A Mixed-Methods Systematic Review of Evidence and Its Quality. Environ. Health Perspect. 2018, 126, 026001. [Google Scholar] [CrossRef] [PubMed]
- Chambers, R.; Bongartz, P.; Greaves, F.; Mukherjee, N.; Sanan, D. An Open Letter in Response to the World Development Report 2015; Institute of Development Studies: Brighton, UK, 2015; Available online: https://www.communityledtotalsanitation.org/blog/open-letter-response-world-development-report-2015 (accessed on 27 June 2020).
- Bongartz, P.; Vernon, N.; Fox, J. Sustainable Sanitation for All; Practical Action Publishing: Rugby, UK, 2016; Available online: https://practicalactionpublishing.com/book/2130/sustainable-sanitation-for-all (accessed on 27 June 2020).
- Bartram, J.; Charles, K.; Evans, B.; O’Hanlon, L.; Pedley, S. Commentary on community-led total sanitation and human rights: Should the right to community-wide health be won at the cost of individual rights? J. Water Health 2012, 10, 499–503. [Google Scholar] [CrossRef] [Green Version]
- Tyndale-Biscoe, P.; Bond, M.; Kidd, R. Open Defecation Free Sustainability Study; Plan International: Surrey, UK, 2013; Available online: https://www.communityledtotalsanitation.org/sites/communityledtotalsanitation.org/files/Plan_International_ODF_Sustainability_Study.pdf (accessed on 27 June 2020).
- FMOH. Implementing Guideline for CLTSH Programming; Federal Ministry of Health: Addis Ababa, Ethiopia, 2012.
- Drummond, M.F.; Sculpher, M.J.; Claxton, K.; Stoddart, G.L.; Torrance, G.W. Methods for the Economic Evaluation of Health Care Programmes, 4th ed.; Oxford University Press: Oxford, UK, 2015. [Google Scholar]
- Whittington, D.; Jeuland, M.; Barker, K.; Yuen, Y. Setting Priorities, Targeting Subsidies among Water, Sanitation, and Preventive Health Interventions in Developing Countries. World Dev. 2012, 40, 1546–1568. [Google Scholar] [CrossRef]
- Hutton, G.; Chase, C. The Knowledge Base for Achieving the Sustainable Development Goal Targets on Water Supply, Sanitation and Hygiene. Int. J. Environ. Res. Public Health 2016, 13, 536. [Google Scholar] [CrossRef] [PubMed] [Green Version]
- Hutton, G. Global costs and benefits of reaching universal coverage of sanitation and drinking-water supply. J. Water Health 2013, 11, 1–11. [Google Scholar] [CrossRef] [PubMed]
- Hutton, G. Benefits and Costs of the Water, Sanitation and Hygiene Targets for the Post-2015 Development Agenda: Post-2015 Consensus; Copenhagen Consensus Center: Copenhagen, Denmark, 2015; Available online: https://www.copenhagenconsensus.com/sites/default/files/water_sanitation_assessment_-_hutton.pdf (accessed on 27 June 2020).
- Hutton, G.; Haller, L.; Bartram, J. Global cost-benefit analysis of water supply and sanitation interventions. J. Water Health 2007, 5, 481–501. [Google Scholar] [CrossRef] [Green Version]
- Radin, M.; Jeuland, M.; Wang, H.; Whittington, D. Benefit-cost analysis of community-led total sanitation: Incorporating results from recent evaluations. J. Benefit Cost Anal. 2020, 1–38. [Google Scholar] [CrossRef]
- Hutton, G.; Rodriguez, U.-P.; Winara, A.; Nguyen, V.; Kov, P.; Chuan, L.; Blackett, I.; Weitz, A. Economic efficiency of sanitation interventions in Southeast Asia. J. Water Sanit. Hyg. Dev. 2014, 4, 23. [Google Scholar] [CrossRef]
- Whittington, D.; Hanemann, W.M.; Sadoff, C.; Jeuland, M. The challenge of improving water and sanitation services in less developed countries. Found. Trends Microecon. 2009, 4, 469607. [Google Scholar] [CrossRef]
- Ferro, G.; Lentini, E.; Mercadier, A. Economies of scale in the water sector: A survey of the empirical literature. J. Water Sanit. Hyg. Dev. 2011, 1, 179–193. [Google Scholar] [CrossRef]
- Weis, D.; Hutton, G.; Kumar, M. Health costs and benefits from a pilot rural sanitation intervention in India. J. Water Sanit. Hyg. Dev. 2019, 9, 129–138. [Google Scholar] [CrossRef]
- WSP-Africa. Study for Financial and Economic Analysis of Ecological Sanitation in Sub-Saharan Africa; Water and Sanitation Program-Africa: Nairobi, Kenya, 2009; Available online: https://documents.worldbank.org/en/publication/documents-reports/documentdetail/772771468003000076/study-for-financial-and-economic-analysis-of-ecological-sanitation-in-sub-saharan-africa (accessed on 27 June 2020).
- Whittington, D. Benefits and Costs of the Water, Sanitation and Hygiene Targets for the Post-2015 Development Agenda: Post-2015 Consensus; Copenhagen Consensus Center: Copenhagen, Denmark, 2015; Available online: https://www.copenhagenconsensus.com/sites/default/files/was_perspective_-_whittington_1.pdf (accessed on 27 June 2020).
- Whittington, D.; Radin, M.; Jeuland, M. Evidence-based policy analysis? The strange case of the randomized controlled trials of community-led total sanitation. Oxford Rev. Econ. Pol. 2020, 36, 191–221. [Google Scholar] [CrossRef]
- Jung, S.; Doh, Y.A.; Bizuneh, D.B.; Beyene, H.; Seong, J.; Kwon, H.; Kim, Y.; Habteyes, G.N.; Tefera, Y.; Cha, S. The effects of improved sanitation on diarrheal prevalence, incidence, and duration in children under five in the SNNPR State, Ethiopia: Study protocol for a randomized controlled trial. Trials 2016, 17, 204. [Google Scholar] [CrossRef] [PubMed] [Green Version]
- Cha, S.; Jung, S.; Bizuneh, D.B.; Abera, T.; Doh, Y.A.; Seong, J.; Schmidt, W.-P. Effect of a community-led total sanitation intervention on child diarrheal incidence and prevalence in a rural area of the SNNPR state, Ethiopia: A cluster-randomized controlled trial. Am. J. Trop. Med. Hyg. 2020. Accepted pending revisions. [Google Scholar]
- SNNPR. Demographic and Health Statistics Report of SNNPR; Southern Nations, Nationalities, and Peoples’ Regional Office: Hawassa, Ethiopia, 2014; Ethiopian year: 2007. [Google Scholar]
- Glennerster, R.; Takavarasha, K. Running Randomized Evaluations: A Practical Guide; Princeton University Press: New Jersey, NJ, USA, 2013. [Google Scholar]
- Wilkinson, T.; Sculpher, M.J.; Claxton, K.; Revill, P.; Briggs, A.; Cairns, J.A.; Teerawattananon, Y.; Asfaw, E.; Lopert, R.; Culyer, A.J.; et al. The International Decision Support Initiative Reference Case for Economic Evaluation: An Aid to Thought. Value Health 2016, 19, 921–928. [Google Scholar] [CrossRef]
- Robinson, L.A.; Hammitt, J.K.; Cecchini, M.; Chalkidou, K.; Claxton, K.; Cropper, M.; Eozenou, P.H.-V.; de Ferranti, D.; Deolalikar, A.B.; Guanais, F. Reference Case Guidelines for Benefit-Cost Analysis in Global Health and Development; Harvard University: Boston, MA, USA, 2019; Available online: https://cdn1.sph.harvard.edu/wp-content/uploads/sites/2447/2019/05/BCA-Guidelines-May-2019.pdf (accessed on 27 June 2020).
- Husereau, D.; Drummond, M.; Petrou, S.; Carswell, C.; Moher, D.; Greenberg, D.; Augustovski, F.; Briggs, A.H.; Mauskopf, J.; Loder, E.; et al. Consolidated Health Economic Evaluation Reporting Standards (CHEERS) Statement. Value Health 2013, 16, e1–e5. [Google Scholar] [CrossRef] [Green Version]
- Naghavi, M.; Abajobir, A.A.; Abbafati, C.; Abbas, K.M.; Abd-Allah, F.; Abera, S.F.; Aboyans, V.; Adetokunboh, O.; Afshin, A.; Agrawal, A.; et al. Global, regional, and national age-sex specific mortality for 264 causes of death, 1980–2016: A systematic analysis for the Global Burden of Disease Study 2016. Lancet 2017, 390, 1151–1210. [Google Scholar] [CrossRef] [Green Version]
- Robinson, L.A.; Hammitt, J.K.; O’Keeffe, L. Valuing Mortality Risk Reductions in Global Benefit-Cost Analysis. J. Benefit Cost Anal. 2019, 10, 15–50. [Google Scholar] [CrossRef] [Green Version]
- The World Bank. GNI Per Capita, Atlas Methods (US$ and International $); World Bank: Washington, DC, USA, 2020; Available online: https://data.worldbank.org/indicator/NY.GNP.PCAP.CD?locations=ET (accessed on 27 June 2020).
- Whittington, D.; Cook, J. Valuing Changes in Time Use in Low- and Middle-Income Countries. J. Benefit Cost Anal. 2019, 10, 51–72. [Google Scholar] [CrossRef] [Green Version]
- Tilahun, H.; Fekadu, B.; Abdisa, H.; Canavan, M.; Linnander, E.; Bradley, E.H.; Berman, P. Ethiopia’s health extension workers use of work time on duty: Time and motion study. Health Policy Plan. 2017, 32, 320–328. [Google Scholar] [CrossRef]
- Canavan, M.E.; Linnander, E.; Ahmed, S.; Mohammed, H.; Bradley, E.H. Unit Costing of Health Extension Worker Activities in Ethiopia: A Model for Managers at the District and Health Facility Level. Int. J. Health Policy Manag. 2017, 7, 394–401. [Google Scholar] [CrossRef] [Green Version]
- Mangham-Jefferies, L.; Mathewos, B.; Russell, J.; Bekele, A. How do health extension workers in Ethiopia allocate their time? Hum. Resour. Health 2014, 12. [Google Scholar] [CrossRef] [Green Version]
- WHO/UN-Water. Investing in Water and Sanitation: Increasing Access, Reducing Inequalities; GLAAS 2014 Special Report for Africa; World Health Organization: Geneva, Switzerland, 2014. [Google Scholar]
- WHO/UN-Water. TrackFin Initiative: Tracking Financing to Sanitation, Hygiene and Drinking-Water at the National Level; World Health Organization: Geneva, Switzerland, 2017. [Google Scholar]
- KOICA. Basic Design Study: Water, Sanitation and Hygiene Project in SNNPR State, Ethiopia; Korea International Cooperation Agency: Seongnam, Korea, 2014.
- SNNPR. Community-Led Accelerated Wash Project Annual Performance Report; Southern Nations, Nationalities, and Peoples’ Regional Office (Water and Irrigation Development Bureau): Hawassa, Ethiopia, 2018. [Google Scholar]
- Hutton, G.; Bartram, J. Global costs of attaining the Millennium Development Goal for water supply and sanitation. Bull. World Health Organ. 2008, 86, 13–19. [Google Scholar] [CrossRef] [PubMed]
- Nyarko, K.B.; Buamah, R.; Nunoo, F.K.N.; Appiah-Effah, E.; Afful, K.M.; Samwini, N.A.; Owusu-Boakye, A. Latrine Technology Manual; United Nations Children’s Fund Ghana: Accra, Ghana, 2016; Available online: https://www.susana.org/en/knowledge-hub/resources-and-publications/library/details/3313 (accessed on 27 June 2020).
- Hutton, G. Financial and Economic Impacts of the Swachh Bharat Mission in India; United Nations Children’s Fund India: New Delhi, India, 2017; Available online: https://www.unicef.org/india/reports/financial-and-economic-impacts-swachh-bharat-mission-india (accessed on 27 June 2020).
- WRC. Design and Operating Requirements to Optimize the Life Span of VIP Toilets: WRC Report 1630/1/07; Water Research Commission: Pretoria, South Africa, 2007. [Google Scholar]
- Nakagiri, A.; Niwagaba, C.B.; Nyenje, P.M.; Kulabako, R.N.; Tumuhairwe, J.B.; Kansiime, F. Are pit latrines in urban areas of Sub-Saharan Africa performing? A review of usage, filling, insects and odour nuisances. BMC Public Health 2016, 16. [Google Scholar] [CrossRef] [PubMed] [Green Version]
- Still, D.; Foxon, K. Tackling the Challenges of Full Pit Latrines. How Fast Do Pit Toilets Fill Up? A Scientific Understanding of Sludge Build Up and Accumulation in Pit Latrines; WRC Report 1745/2/12; Water Research Commission: Pretoria, South Africa, 2012. [Google Scholar]
- Todman, L.C.; van Eekert, M.H.A.; Templeton, M.R.; Hardy, M.; Gibson, W.T.; Torondel, B.; Abdelahi, F.; Ensink, J.H.J. Modeling the fill rate of pit latrines in Ifakara, Tanzania. J. Water Sanit. Hyg. Dev. 2014, 5, 100–106. [Google Scholar] [CrossRef]
- Nakagiri, A.; Kulabako, R.N.; Nynje, P.M.; Tumuhairwe, J.B.; Niwagaba, C.B.; Kansiime, F. Performance of pit latrines in urban poor areas: A case of Kampala, Uganada. Habitat Int. 2015, 49, 529–537. [Google Scholar] [CrossRef] [Green Version]
- Foxon, K. Scientific Support for the Design and Operation of Ventilated Improved Pit Latrines (VIPS); School of Chemical Engineering University of KwaZulu-Natal: Durban, South Africa, 2008. [Google Scholar]
- Crocker, J.; Saywell, D.; Bartram, J. Sustainability of Community-Led Total Sanitation Outcomes: Evidence From Ethiopia and Ghana. Int. J. Hyg. Environ. Health 2017, 220, 551–557. [Google Scholar] [CrossRef]
- Null, C.; Stewart, C.P.; Pickering, A.J.; Dentz, H.N.; Arnold, B.F.; Arnold, C.D.; Benjamin-Chung, J.; Clasen, T.; Dewey, K.G.; Fernald, L.C.H. Effects of water quality, sanitation, handwashing, and nutritional interventions on diarrhoea and child growth in rural Kenya: A cluster-randomised controlled trial. Lancet Glob. Health 2018, 6, e316–e329. [Google Scholar] [CrossRef] [Green Version]
- Pickering, A.J.; Djebbari, H.; Lopez, C.; Dentz, H.N.; Arnold, B.F.; Arnold, C.D.; Benjamin-Chung, J.; Clasen, T.; Dewey, K.G.; Fernal, L.C.H. Effect of a community-led sanitation intervention on child diarrhoea and child growth in rural Mali: A cluster-randomised controlled trial. Lancet Glob. Health 2015, 3, e701–e711. [Google Scholar] [CrossRef] [Green Version]
- Patil, S.R.; Arnold, B.F.; Salvatore, A.L.; Briceno, B.; Ganguly, S.; Colford, J.M., Jr.; Gertler, P.J. The effect of India’s total sanitation campaign on defecation behaviors and child health in rural Madhya Pradesh: A cluster randomized controlled trial. PLoS Med. 2014, 11, e1001709. [Google Scholar] [CrossRef] [PubMed]
- Clasen, T.; Boisson, S.; Routray, P.; Torondel, B.; Bell, M.; Cumming, O.; Ensink, J.; Freeman, M.; Jenkins, M.; Odagiri, M. Effectiveness of a rural sanitation programme on diarrhoea, soil-transmitted helminth infection, and child malnutrition in Odisha, India: A cluster-randomised trial. Lancet Glob. Health 2014, 2, e645–e653. [Google Scholar] [CrossRef] [Green Version]
- Luby, S.P.; Rahman, M.; Arnold, B.F.; Unicomb, L.; Ashraf, S.; Winch, P.J.; Stewart, C.P.; Begum, F.; Hussain, F.; Benjamin-Chun, J. Effects of water quality, sanitation, handwashing, and nutritional interventions on diarrhea and child growth in rural Bangladesh: A cluster randomized controlled trial. Lancet Glob. Health 2018, 6, e302–e315. [Google Scholar] [CrossRef] [Green Version]
- Wolf, J.; Hunter, P.R.; Freeman, M.C.; Cumming, O.; Clasen, T.; Bartram, J.; Higgins, J.P.T.; Johnston, R.; Medlicott, K.; Boisson, S. Impact of drinking water, sanitation and handwashing with soap on childhood diarrhoeal disease: Updated meta-analysis and meta-regression. Trop. Med. Int. Health 2018, 23, 508–525. [Google Scholar] [CrossRef] [PubMed]
- Freeman, M.C.; Garn, J.V.; Sclar, G.D.; Boisson, S.; Medlicott, K.; Alexander, K.T.; Penakalapati, G.; Anderson, D.; Mahtani, A.G.; Grimes, J.E.T. The impact of sanitation on infectious disease and nutritional status: A systematic review and meta-analysis. Int. J. Hyg. Environ. Health 2017, 220, 928–949. [Google Scholar] [CrossRef]
- Kar, K. Scaling-Up Community Led Total Sanitation: From Village to Nation; Practical Action: Rugby, UK, 2019. [Google Scholar]
- Chavasse, D.C.; Shier, R.P.; Murphy, O.A.; Huttly, S.R.; Cousens, S.N.; Akhtar, T. Impact of fly control on childhood diarrhoea in Pakistan: Community-randomised trial. Lancet 1999, 2, 22–25. [Google Scholar] [CrossRef]
- Burton, M.J.; Mabey, D. The global burden of trachoma: A review. PLoS Negl. Trop. Dis. 2009, 3, e460. [Google Scholar] [CrossRef]
- Pullan, R.; Smith, J.; Jasrasaria, R.; Brooker, S. Global numbers of infection and disease burden of soil-transmitted helminth infections in 2010. Parasites Vectors 2014, 7, 37. [Google Scholar] [CrossRef] [PubMed]
- Brooker, S.; Clements, A.; Bundy, D. Global epidemiology, ecology and control of soil-transmitted helminth infections. Adv. Parasitol. 2006, 62, 221–261. [Google Scholar]
- WHO. Working to Overcome the Global Impact of Neglected Tropical Diseases: First WHO Report on Neglected Tropical Diseases; World Health Organization: Geneva, Switzerland, 2010. [Google Scholar]
- Humphrey, J. Child undernutrition, tropical enteropathy, toilets, and handwashing. Lancet 2009, 3754, 1032–1035. [Google Scholar] [CrossRef]
- Kotloff, K.; Nataro, J.; Blackwelder, W.; Nasrin, D.; Farag, T.; Panchalingam, S.; Wu, Y.; Sow, S.; Sur, D.; Breiman, R. Burden and aetiology of diarrhoeal disease in infants and young children in developing countries (the global enteric multicenter study, gems): A prospective, case-control study. Lancet 2013, 382, 209–222. [Google Scholar] [CrossRef]
- Salazar-Lindo, E.; Allen, S.; Brewster, D.; Elliott, E.; Fasano, A.; Phillips, A.; Sanderson, I.; Tarr, P. Intestinal infections and environmental enteropathy: Working group report of the second world congress of pediatric gastroenterology, hepatology, and nutrition. J. Pediatr. Gastroenterol. Nutr. 2004, 39, S662–S669. [Google Scholar] [CrossRef] [Green Version]
- Guerrant, R.; DeBoer, M.; Moore, S.; Scharf, R.; Lima, A. The impoverished gut-A triple burden of diarrhoea, stunting and chronic disease. Nat. Rev. Gastroenterol. Hepatol. 2013, 10, 220–229. [Google Scholar] [CrossRef] [PubMed]
- Cairncross, S. The Case for Marketing Sanitation. Field Note; Water and Sanitation Program; World Bank: Washington, DC, USA, 2004. [Google Scholar]
- Fisher, J. For Her It’s the Big Issue. Putting Women at the Centre of Water Supply, Sanitation and Hygiene; Evidence Report; Water Supply and Sanitation Collaborative Council: Geneva, Switzerland, 2006. [Google Scholar]
- Jenkins, M.; Scott, B. Behavioral indicators of household decision-making and demand for sanitation and potential gains from social marketing in Ghana. Soc. Sci. Med. 2007, 64, 2427–2442. [Google Scholar] [CrossRef] [PubMed]
- Jasper, C.; Le, T.; Bartram, J. Water and sanitation in schools: A systematic review of the health and educational outcomes. Int. J. Environ. Res. Public Health 2012, 9, 2272–2287. [Google Scholar] [CrossRef] [PubMed] [Green Version]


| Intervention | Control | |
|---|---|---|
| Total days of diarrhoea | 481 | 773 |
| Number of children | 409 | 433 |
| Person-days | 49,571 | 52,467 |
| Effect of CLTS on longitudinal prevalence of child diarrhoea (Reduced days of child diarrhoea per year) * | 1.6 days, 95% Confidence Interval: 0.2–2.6 days p = 0.03 |
| <5 | 5–14 | 15 | SUM | |
|---|---|---|---|---|
| Diarrhoea cases avoided | 20,374 | 16,084 | 15,154 | 51,612 |
| Premature deaths averted | 14 | 3 | 5 | 22 |
| Time saved from taking care of sick people (hours) | 162,989 | 128,673 | 121,231 | 412,893 |
| Time saved from the switch to a household latrine (hours) | 0 | 1,101,556 | 963,346 | 2,064,902 |
| Item | Age Group | ||||||
|---|---|---|---|---|---|---|---|
| <5 | 5–14 | 15 | Subtotal | % | |||
| Benefits | Avoided diarrhoea cases | Treatment costs saved | 3294 | 1305 | 1230 | 5829 | 13% |
| Transportation costs saved | 3386 | 2312 | 2178 | 7876 | |||
| Meal costs saved | 903 | 465 | 439 | 1807 | |||
| Accommodation costs saved | 337 | 97 | 130 | 564 | |||
| Caregiver time saved | 51,769 | 20,435 | 38,506 | 110,709 | |||
| Health professionals’ time saved | 63,003 | 12,477 | 11,756 | 87,236 | |||
| Subtotal | 122,692 | 37,091 | 54,239 | 214,021 | |||
| Averted premature deaths | Value of statistical life | 611,103 | 137,839 | 194,801 | 943,744 | 58% | |
| Time saved from increased accessibility | Switch from open defecation | 0 | 33,469 | 118,927 | 152,396 | 29% | |
| Switch from using communal latrines | 0 | 46,949 | 91,930 | 138,878 | |||
| Switch from using neighbours’ latrines | 0 | 94,521 | 95,124 | 189,645 | |||
| Subtotal | 0 | 174,939 | 305,981 | 480,919 | |||
| Total | 733,795 (45%) | 349,869 (21%) | 555,021 (34%) | 1,638,684 (100%) | 100% | ||
| Costs | Initial costs | ||||||
| Project implementation and management | Recurrent | 223,845 | 54% | ||||
| capital | 14,580 | ||||||
| Subtotal | 238,425 | ||||||
| Investment of community and local stakeholders | Recurrent | 102,353 | 42% | ||||
| capital | 84,337 | ||||||
| Subtotal | 186,690 | ||||||
| Subtotal of initial costs | 425,115 | ||||||
| Operation and maintenance Education for the lifespan of a latrine | Operation and maintenance | 9,892 | 4% | ||||
| Education | 9,892 | ||||||
| Subtotal | 19,784 | ||||||
| Total | 444,899 | 100% | |||||
| Benefit–Cost Ratio (BCR) | 3.7 | ||||||
| Net Present Value (NPV) | 1,193,786 (49,741 per community; 687 per household) | ||||||
| Item | Cost | ||
|---|---|---|---|
| CLTS a Implementation | Recurrent | CLTS promoter introduction | 1200 |
| CLTS promoter training | 2160 | ||
| Educating mothers | 2160 | ||
| Community campaign | 1800 | ||
| Information, Education and Communication Materials | 9000 | ||
| Best promoter prize | 2670 | ||
| CLTS training | 5355 | ||
| CLTS implementation | 2651 | ||
| Experience sharing | 720 | ||
| Material incentives | 3840 | ||
| Monitoring/follow-up after the CLTS triggering | 43,204 | ||
| Meeting/workshop | 4800 | ||
| Subtotal | 79,560 | ||
| Project Management | Capital | Motorcycle | 5,590 |
| Vehicle | 8,990 | ||
| Subtotal | 14,580 | ||
| Recurrent | Korean staff salary and benefits | 78,000 | |
| Local management staff salary and benefits | 24,840 | ||
| Translator | 3600 | ||
| Stationery | 4520 | ||
| Drivers | 4800 | ||
| Fuel | 12,000 | ||
| Office | 3600 | ||
| Monitoring and evaluation | 8925 | ||
| Report printing | 4000 | ||
| Subtotal | 144,285 | ||
| Subtotal | Recurrent | 223,845 (94%) | |
| Capital | 14,580 (6%) | ||
| Total | 238,425 (100%) | ||
| Item | Participants | Number of People | Hours/Person | Hourly Income a | Cost | |
|---|---|---|---|---|---|---|
| Recurrent c | CLTS b training | District health officials | 5 | 56 | 4.50 | 1260 |
| Health professionals (health centre) | 5 | 56 | 2.54 | 711 | ||
| Health extension workers | 24 | 56 | 1.79 | 2400 | ||
| CLTS promoter training | CLTS promoters | 38 | 32 | 0.67 | 817 | |
| CLTS orientation | District health officials | 3 | 8 | 4.50 | 108 | |
| CLTS promoters | 38 | 8 | 0.67 | 204 | ||
| CLTS triggering | District health officials | 5 | 40 | 4.50 | 900 | |
| Health extension workers | 24 | 192 | 2.54 | 11,704 | ||
| CLTS promoters | 38 | 304 | 0.67 | 7740 | ||
| Community members | 804 | 8 | 0.67 | 4311 | ||
| CLTS follow-up | District health officials | 5 | 256 | 4.50 | 5760 | |
| Health extension workers | 24 | 256 | 1.79 | 10,998 | ||
| CLTS promoters | 38 | 512 | 0.67 | 13,036 | ||
| CLTS committee | 72 | 128 | 0.67 | 6175 | ||
| Community members | 1079 | 32 | 0.67 | 23,127 | ||
| Kebele leaders | 24 | 64 | 0.67 | 1029 | ||
| Review meeting | District health officials | 12 | 64 | 4.50 | 3456 | |
| Health extension workers | 24 | 64 | 2.54 | 3901 | ||
| CLTS promoters | 38 | 64 | 0.67 | 1629 | ||
| CLTS committee | 72 | 64 | 0.67 | 3087 | ||
| Subtotal | - | - | - | - | 102,353 (55%) | |
| Capital d | Latrine construction (time) | Community people | 872 | 120 | 0.67 | 70,107 |
| Latrine construction (cement) | Community people | 71 | - | 27.90 | 1968 | |
| Latrine construction (handwashing facility) | Community people | 721 | - | 17.01 | 12,263 | |
| Subtotal | - | - | - | - | 84,337 (45%) | |
| Total | - | - | - | - | 186,690 (100%) | |
© 2020 by the authors. Licensee MDPI, Basel, Switzerland. This article is an open access article distributed under the terms and conditions of the Creative Commons Attribution (CC BY) license (http://creativecommons.org/licenses/by/4.0/).
Share and Cite
Cha, S.; Jung, S.; Belew Bizuneh, D.; Abera, T.; Doh, Y.-A.; Seong, J.; Ross, I. Benefits and Costs of a Community-Led Total Sanitation Intervention in Rural Ethiopia—A Trial-Based Ex Post Economic Evaluation. Int. J. Environ. Res. Public Health 2020, 17, 5068. https://doi.org/10.3390/ijerph17145068
Cha S, Jung S, Belew Bizuneh D, Abera T, Doh Y-A, Seong J, Ross I. Benefits and Costs of a Community-Led Total Sanitation Intervention in Rural Ethiopia—A Trial-Based Ex Post Economic Evaluation. International Journal of Environmental Research and Public Health. 2020; 17(14):5068. https://doi.org/10.3390/ijerph17145068
Chicago/Turabian StyleCha, Seungman, Sunghoon Jung, Dawit Belew Bizuneh, Tadesse Abera, Young-Ah Doh, Jieun Seong, and Ian Ross. 2020. "Benefits and Costs of a Community-Led Total Sanitation Intervention in Rural Ethiopia—A Trial-Based Ex Post Economic Evaluation" International Journal of Environmental Research and Public Health 17, no. 14: 5068. https://doi.org/10.3390/ijerph17145068