The Association between Noise Exposure and Metabolic Syndrome: A Longitudinal Cohort Study in Taiwan


Abstract
:1. Introduction
2. Materials and Methods
2.1. Ethics
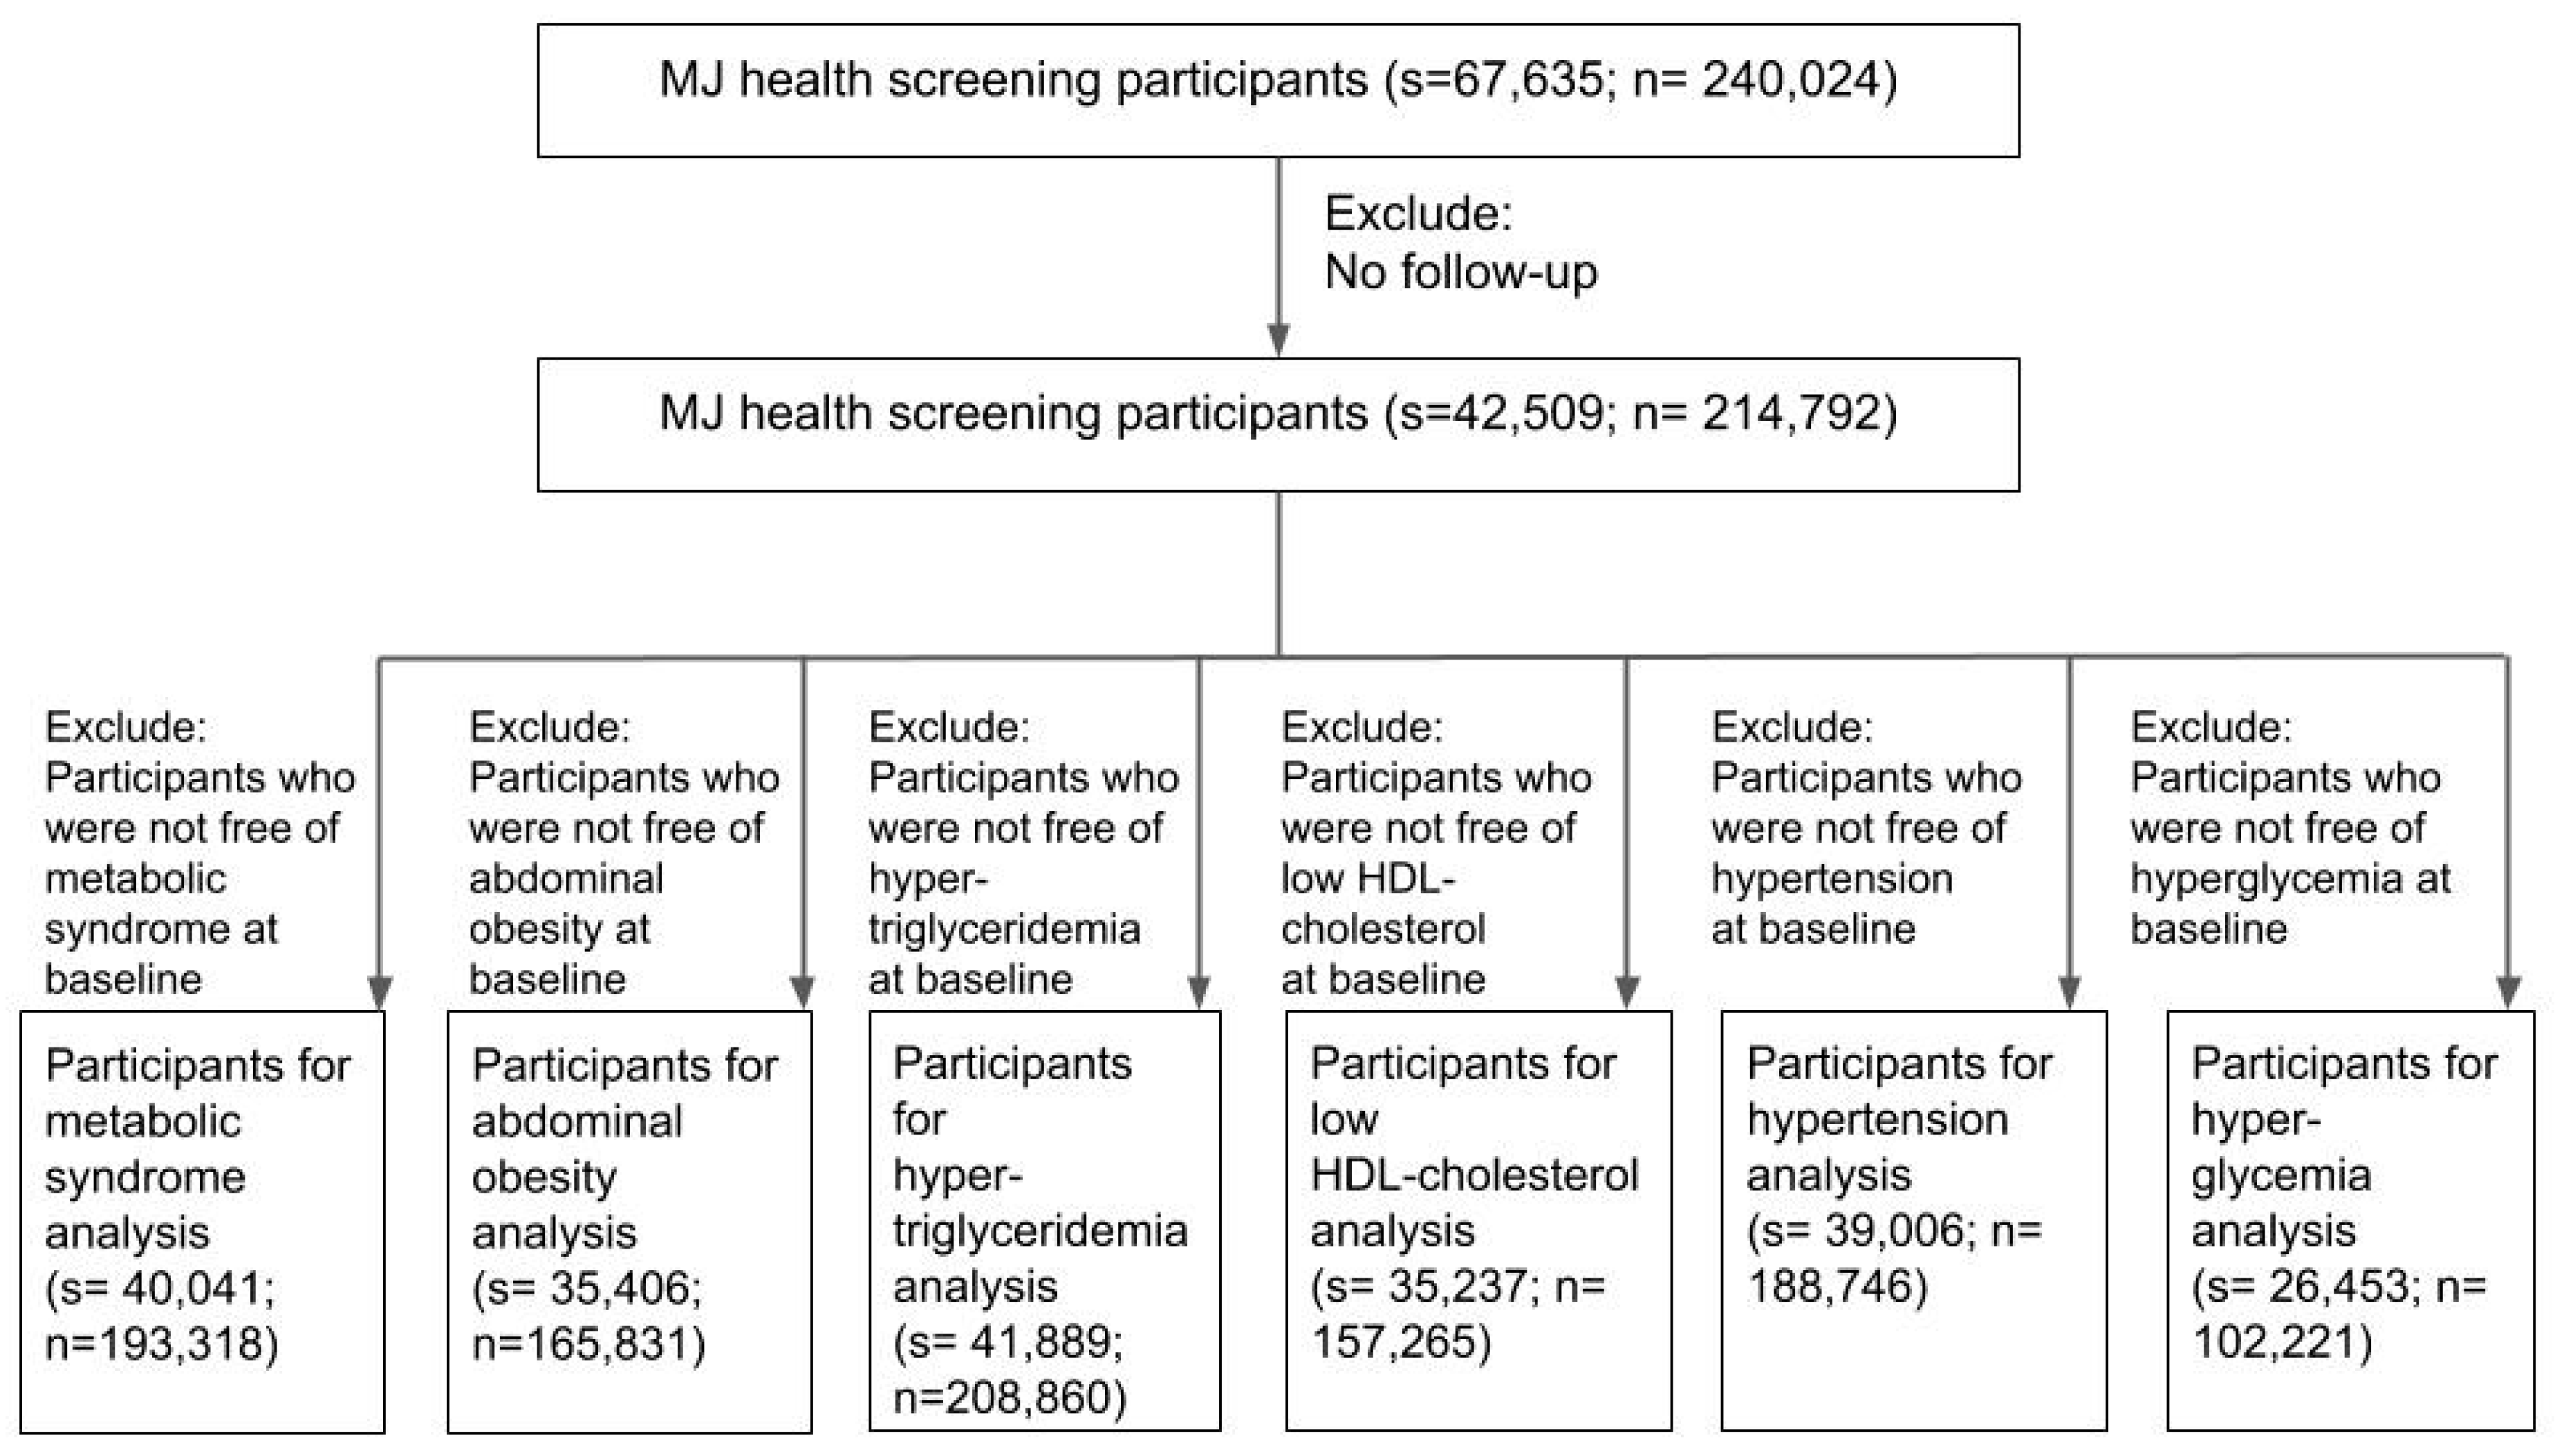
2.2. Study Participants
2.3. Noise Mapping
2.4. Statistical Analysis
2.5. Perceived Noise Exposure and Covariates
3. Results
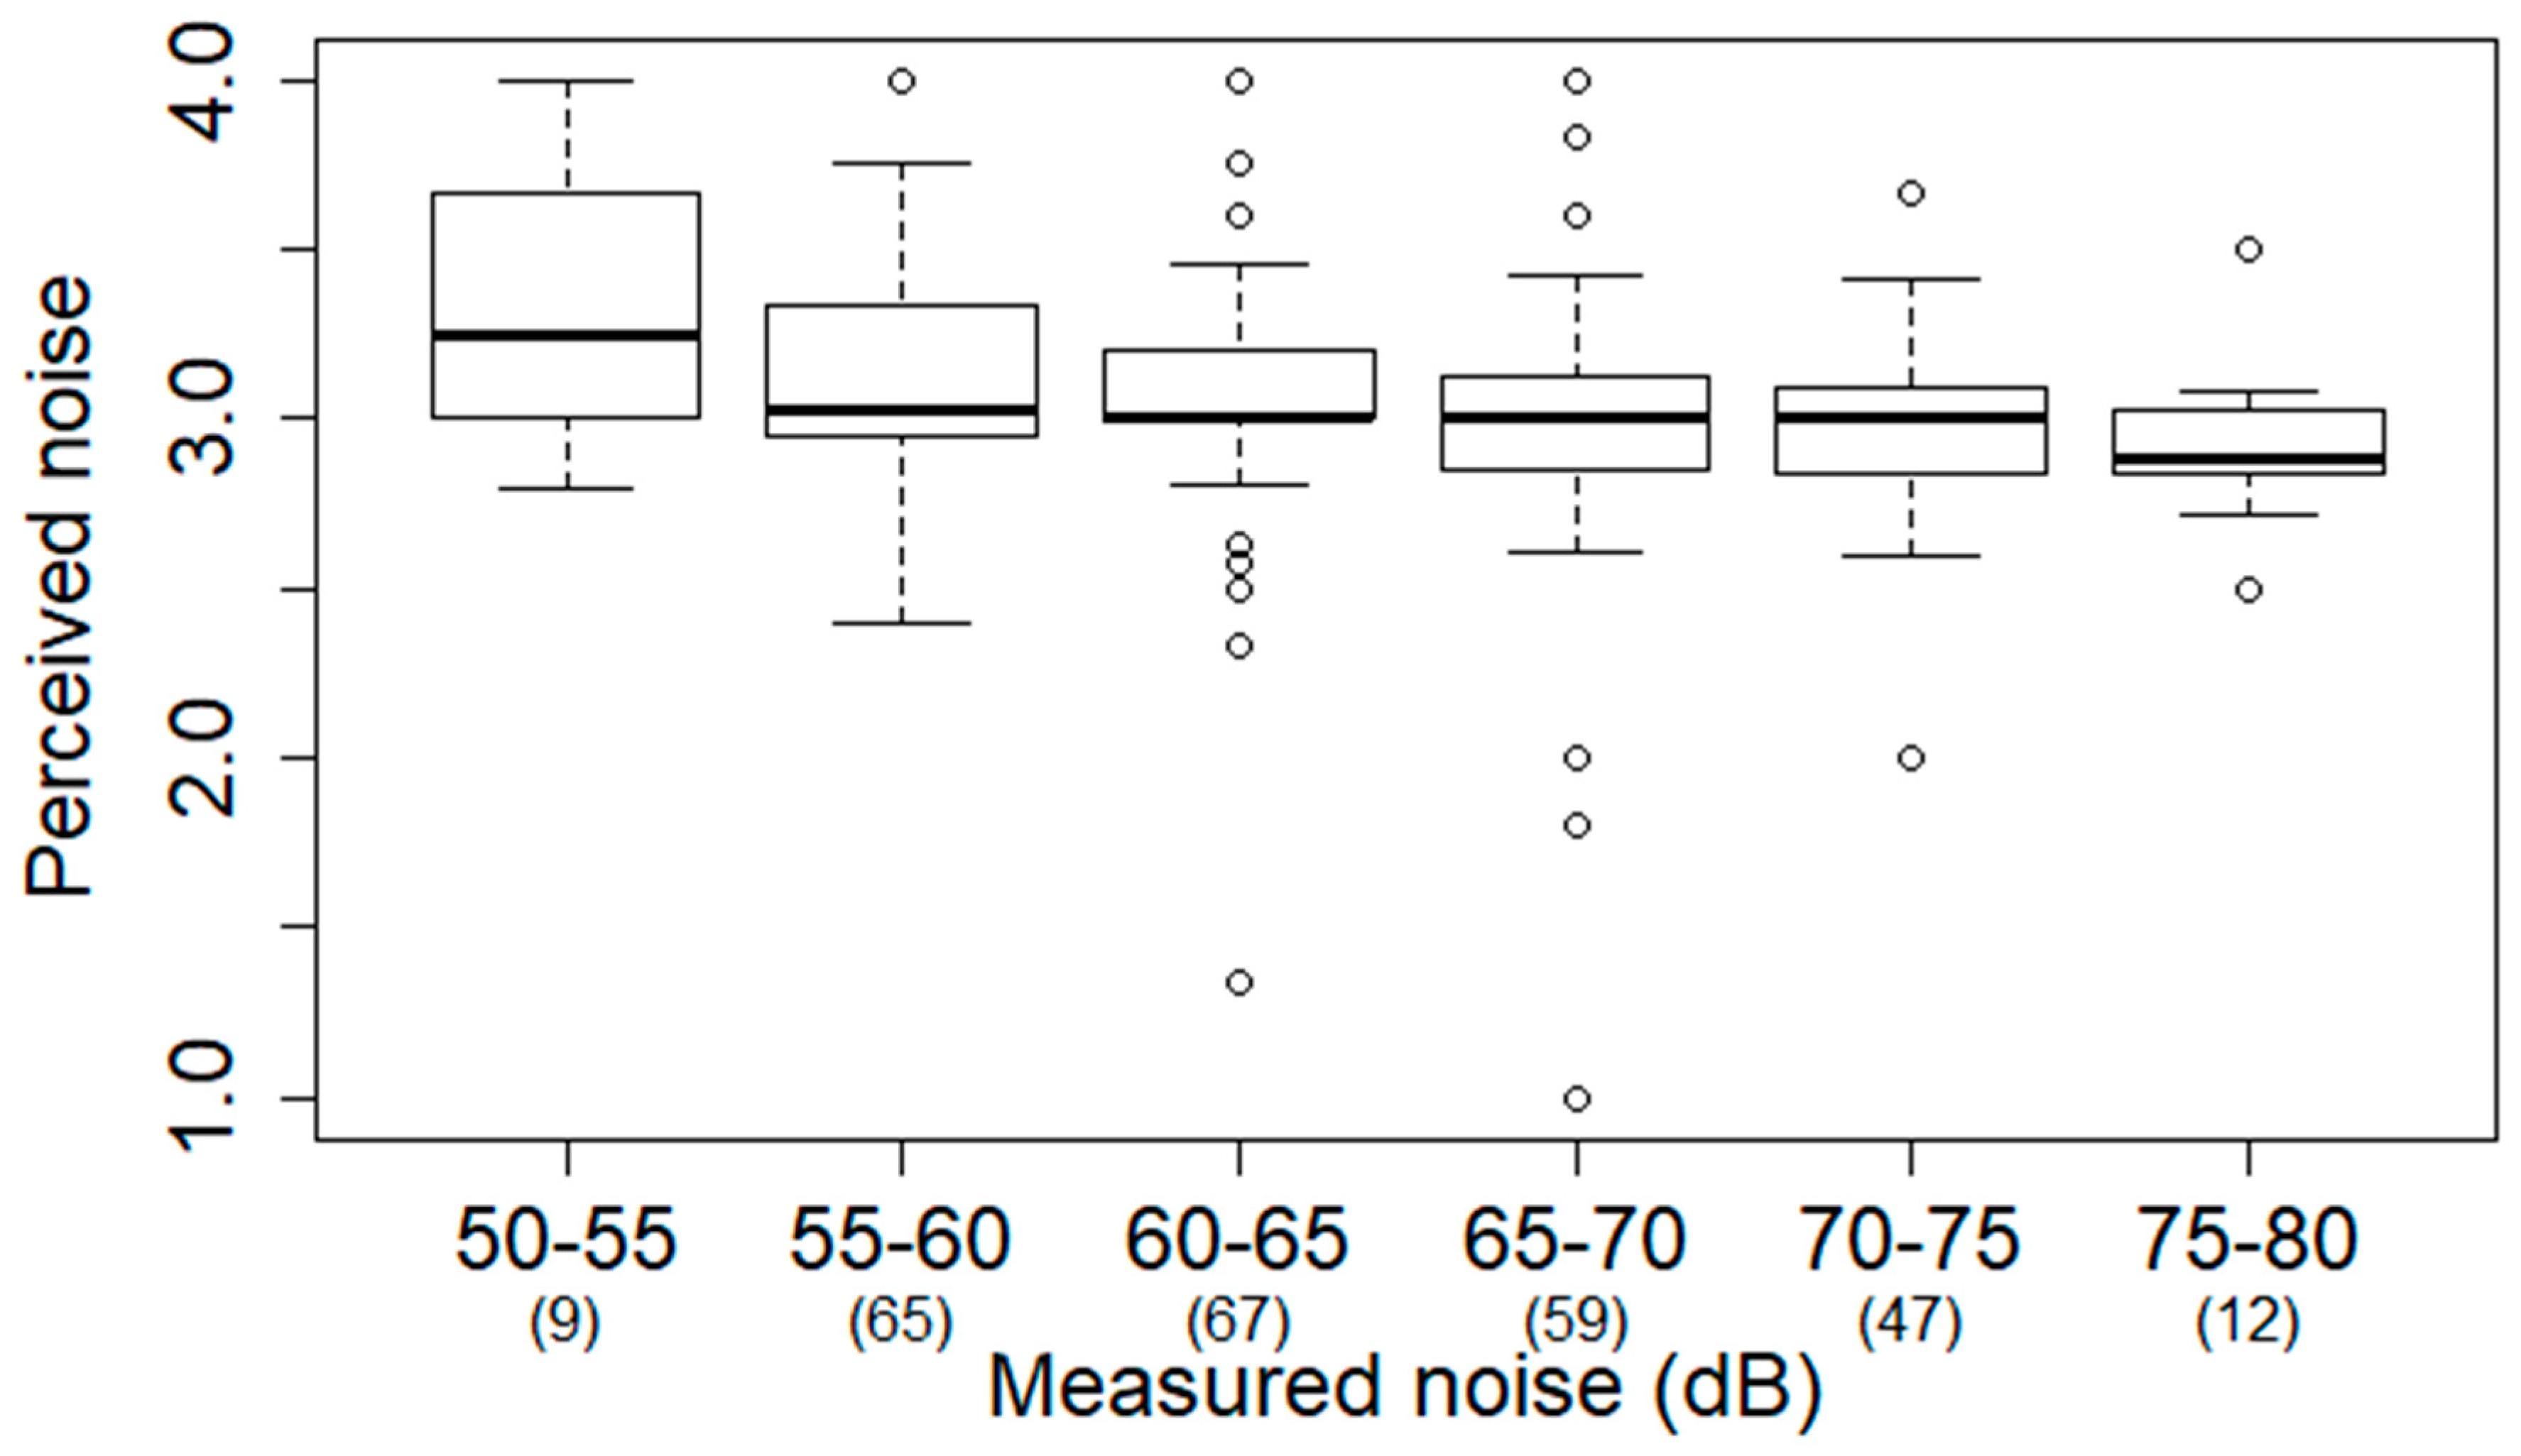
3.1. Noise Mapping
3.2. Baseline Characteristics of the Study Participants
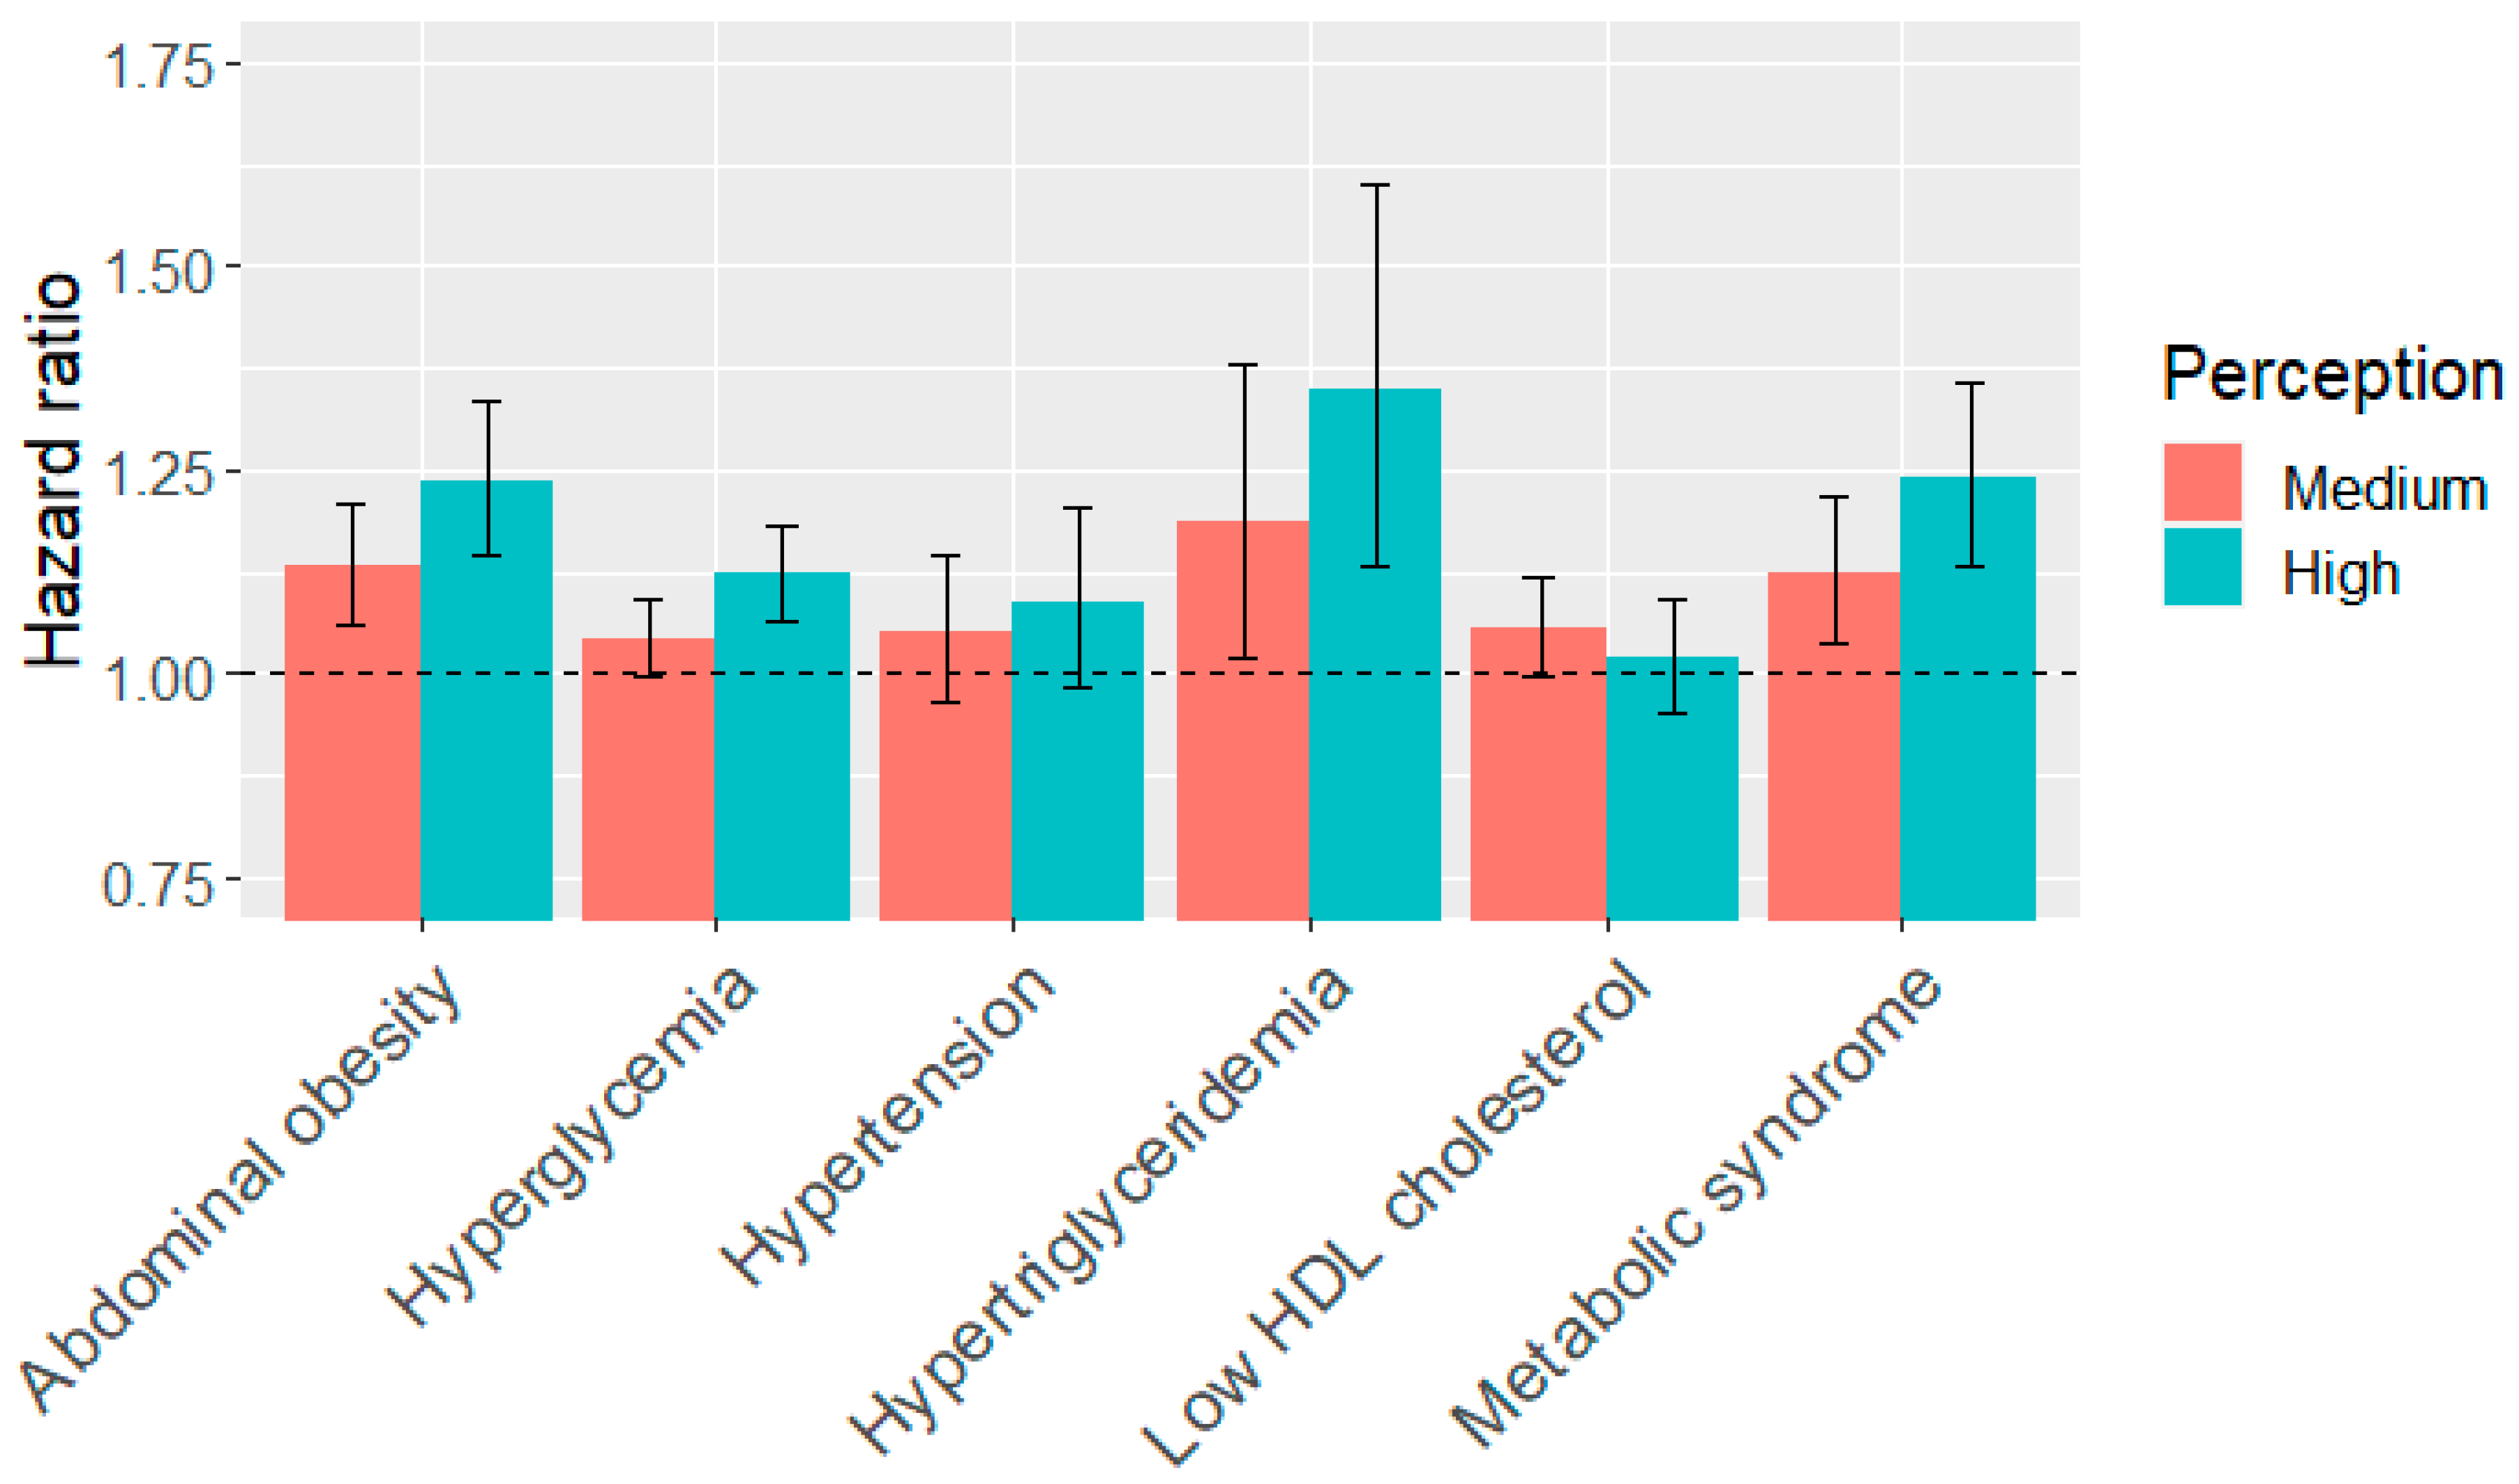
3.3. Association of Perceived Noise Exposure and Metabolic Syndrome
3.4. Association of Perceived Noise Exposure and Metabolic Syndrome Components
4. Discussion
5. Conclusions
Supplementary Materials
Author Contributions
Funding
Acknowledgments
Conflicts of Interest
References
- Liu, J.; Grundy, S.M.; Wang, W.; Smith, S.C.; Vega, G.L.; Wu, Z.S.; Zeng, Z.C.; Wang, W.H.; Zhao, D. Ten-year risk of cardiovascular incidence related to diabetes, prediabetes, and the metabolic syndrome. Am. Heart J. 2007, 153, 552–558. [Google Scholar] [CrossRef] [PubMed]
- Lee, J.A.; Yoo, J.E.; Park, H.S. Metabolic syndrome and incidence of breast cancer in middle-aged Korean women: A nationwide cohort study. Breast Cancer Res. Treat. 2017, 162, 389–393. [Google Scholar] [CrossRef] [PubMed]
- Grundy, S.M. Metabolic syndrome pandemic. Arterioscler. Thromb. Vasc. Biol. 2008, 28, 629–636. [Google Scholar] [CrossRef] [PubMed] [Green Version]
- Okafor, C.I. The metabolic syndrome in Africa: Current trends. Indian J. Endocrinol. Metab. 2012, 16, 56. [Google Scholar] [CrossRef] [PubMed]
- Ranasinghe, P.; Mathangasinghe, Y.; Jayawardena, R.; Hills, A.P.; Misra, A. Prevalence and trends of metabolic syndrome among adults in the Asia-Pacific region: A systematic review. BMC Public Health 2017, 17, 101. [Google Scholar] [CrossRef] [Green Version]
- Christensen, J.S.; Raaschou-Nielsen, O.; Tjønneland, A.; Overvad, K.; Nordsborg, R.B.; Ketzel, M.; Sørensen, T.I.; Sørensen, M. Road traffic and railway noise exposures and adiposity in adults: A cross-sectional analysis of the danish diet, cancer, and health cohort. Environ. Health Perspect. 2016, 124, 329–335. [Google Scholar] [CrossRef] [PubMed] [Green Version]
- Morley, D.; De Hoogh, K.; Fecht, D.; Fabbri, F.; Bell, M.; Goodman, P.; Elliott, P.; Hodgson, S.; Hansell, A.; Gulliver, J. International scale implementation of the CNOSSOS-EU road traffic noise prediction model for epidemiological studies. Environ. Pollut. 2015, 206, 332–341. [Google Scholar] [CrossRef]
- Ruiz-Padillo, A.; Torija, A.J.; Ramos-Ridao, Á.; Ruiz, D.P. A methodology for classification by priority for action: Selecting road stretches for network noise action plans. Transp. Res. Part D Transp. Environ. 2014, 29, 66–78. [Google Scholar] [CrossRef]
- Thiesse, L.; Rudzik, F.; Spiegel, K.; Leproult, R.; Pieren, R.; Wunderli, J.M.; Foraster, M.; Heritier, H.; Eze, I.C.; Meyer, M.; et al. Adverse impact of nocturnal transportation noise on glucose regulation in healthy young adults: Effect of different noise scenarios. Environ. Int. 2018, 121, 1011–1023. [Google Scholar] [CrossRef]
- Licitra, G.; Fredianelli, L.; Petri, D.; Vigotti, M.A. Annoyance evaluation due to overall railway noise and vibration in Pisa urban areas. Sci. Total Environ. 2016, 568, 1315–1325. [Google Scholar] [CrossRef]
- Bunn, F.; Zannin, P.H.T. Assessment of railway noise in an urban setting. Appl. Acoust. 2016, 104, 16–23. [Google Scholar] [CrossRef]
- Iglesias-Merchan, C.; Diaz-Balteiro, L.; Soliño, M. Transportation planning and quiet natural areas preservation: Aircraft overflights noise assessment in a National Park. Transp. Res. Part D Transp. Environ. 2015, 41, 1–12. [Google Scholar] [CrossRef]
- Stansfeld, S.A.; Berglund, B.; Clark, C.; Lopez-Barrio, I.; Fischer, P.; Öhrström, E.; Haines, M.M.; Head, J.; Hygge, S.; Van Kamp, I. Aircraft and road traffic noise and children’s cognition and health: A cross-national study. Lancet 2005, 365, 1942–1949. [Google Scholar] [CrossRef]
- Brink, M.; Schäffer, B.; Vienneau, D.; Foraster, M.; Pieren, R.; Eze, I.C.; Cajochen, C.; Probst-Hensch, N.; Röösli, M.; Wunderli, J.-M. A survey on exposure-response relationships for road, rail, and aircraft noise annoyance: Differences between continuous and intermittent noise. Environ. Int. 2019, 125, 277–290. [Google Scholar] [CrossRef] [PubMed]
- Fredianelli, L.; Carpita, S.; Licitra, G. A procedure for deriving wind turbine noise limits by taking into account annoyance. Sci. Total Environ. 2019, 648, 728–736. [Google Scholar] [CrossRef] [PubMed]
- Wagner, S.; Bareiss, R.; Guidati, G. Wind Turbine Noise; Springer Science & Business Media: Berlin/Heidelberg, Germany, 2012. [Google Scholar]
- Janssen, S.A.; Vos, H.; Eisses, A.R.; Pedersen, E. A comparison between exposure-response relationships for wind turbine annoyance and annoyance due to other noise sources. J. Acoust. Soc. Am. 2011, 130, 3746–3753. [Google Scholar] [CrossRef] [Green Version]
- Michaud, D.S.; Feder, K.; Keith, S.E.; Voicescu, S.A.; Marro, L.; Than, J.; Guay, M.; Denning, A.; McGuire, D.A.; Bower, T. Exposure to wind turbine noise: Perceptual responses and reported health effects. J. Acoust. Soc. Am. 2016, 139, 1443–1454. [Google Scholar] [CrossRef] [Green Version]
- Bolognese, M.; Fidecaro, F.; Palazzuoli, D.; Licitra, G. Port noise and complaints in the north Tyrrhenian sea and framework for remediation. Environments 2020, 7, 17. [Google Scholar] [CrossRef] [Green Version]
- Badino, A.; Borelli, D.; Gaggero, T.; Rizzuto, E.; Schenone, C. Airborne noise emissions from ships: Experimental characterization of the source and propagation over land. Appl. Acoust. 2016, 104, 158–171. [Google Scholar] [CrossRef]
- Bernardini, M.; Fredianelli, L.; Fidecaro, F.; Gagliardi, P.; Nastasi, M.; Licitra, G. Noise assessment of small vessels for action planning in canal cities. Environments 2019, 6, 31. [Google Scholar] [CrossRef] [Green Version]
- Schenone, C.; Pittaluga, I.; Borelli, D.; Kamali, W.; El Moghrabi, Y. The impact of environmental noise generated from ports: Outcome of MESP project. Noise Mapp. 2016, 1. [Google Scholar] [CrossRef] [Green Version]
- Cohen, J.P.; Coughlin, C.C.; Crews, J. Traffic noise in Georgia: Sound levels and inequality. J. Hous. Econ. 2019, 44, 150–165. [Google Scholar] [CrossRef] [Green Version]
- Collins, T.W.; Nadybal, S.; Grineski, S.E. Sonic injustice: Disparate residential exposures to transport noise from road and aviation sources in the continental United States. J. Transp. Geogr. 2020, 82, 102604. [Google Scholar] [CrossRef]
- Casey, J.A.; Morello-Frosch, R.; Mennitt, D.J.; Fristrup, K.; Ogburn, E.L.; James, P. Race/ethnicity, socioeconomic status, residential segregation, and spatial variation in noise exposure in the contiguous United States. Environ. Health Persp. 2017, 125, 077017. [Google Scholar] [CrossRef] [PubMed] [Green Version]
- Tsai, K.T.; Lin, M.D.; Chen, Y.H. Noise mapping in urban environments: A Taiwan study. Appl. Acoust. 2009, 70, 964–972. [Google Scholar] [CrossRef]
- Van Kempen, E.; Casas, M.; Pershagen, G.; Foraster, M. WHO environmental noise guidelines for the European region: A systematic review on environmental noise and cardiovascular and metabolic effects: A summary. Int. J. Environ. Res. Public Health 2018, 15, 379. [Google Scholar] [CrossRef] [PubMed] [Green Version]
- Yu, Y.; Paul, K.; Arah, O.A.; Mayeda, E.R.; Wu, J.; Lee, E.; Shih, I.F.; Su, J.; Jerrett, M.; Haan, M.; et al. Air pollution, noise exposure, and metabolic syndrome—A cohort study in elderly Mexican-Americans in Sacramento area. Environ. Int. 2020, 134. [Google Scholar] [CrossRef] [PubMed]
- Duesenberg, M.; Wolf, O.T.; Metz, S.; Roepke, S.; Fleischer, J.; Elias, V.; Renneberg, B.; Otte, C.; Wingenfeld, K. Psychophysiological stress response and memory in borderline personality disorder. Eur. J. Psychotraumatol. 2019, 10, 1568134. [Google Scholar] [CrossRef] [PubMed] [Green Version]
- Babisch, W. Stress hormones in the research on cardiovascular effects of noise. Noise Health 2003, 5, 1. [Google Scholar]
- Rojek, M.; Rajzer, M.; Wojciechowska, W.; Skalski, P.; Pizon, T.; Czarnecka, D. Nighttime aircraft noise effect on blood pressure profile. Eur. Heart J. 2018, 39, 497–498. [Google Scholar] [CrossRef]
- Oftedal, B.; Krog, N.H.; Pyko, A.; Eriksson, C.; Graff-Iversen, S.; Haugen, M.; Schwarze, P.E.; Pershagen, G.; Aasvang, G.M. Road traffic noise and markers of obesity—A population-based study. Environ. Res. 2015, 138, 144–153. [Google Scholar] [CrossRef] [PubMed]
- Arlien-Soborg, M.C.; Schmedes, A.S.; Stokholm, Z.A.; Grynderup, M.B.; Bonde, J.P.; Jensen, C.S.; Hansen, A.M.; Frederiksen, T.W.; Kristiansen, J.; Christensen, K.L.; et al. Ambient and at-the-ear occupational noise exposure and serum lipid levels. Int. Arch. Occup. Environ. Health 2016, 89, 1087–1093. [Google Scholar] [CrossRef] [PubMed]
- Bell, G.; Mora, S.; Greenland, P.; Tsai, M.; Gill, E.; Kaufman, J.D. Association of air pollution exposures with high-density lipoprotein cholesterol and particle number: The multi-ethnic study of atherosclerosis. Arterioscler. Thromb. Vasc. Biol. 2017, 37, 976–982. [Google Scholar] [CrossRef] [PubMed] [Green Version]
- Evrard, A.S.; Lefevre, M.; Champelovier, P.; Lambert, J.; Laumon, B. Does aircraft noise exposure increase the risk of hypertension in the population living near airports in France? Occup. Environ. Med. 2017, 74, 123–129. [Google Scholar] [CrossRef] [PubMed] [Green Version]
- Paiva, K.M.; Cardoso, M.R.A.; Zannin, P.H.T. Exposure to road traffic noise: Annoyance, perception and associated factors among Brazil’s adult population. Sci. Total Environ. 2019, 650, 978–986. [Google Scholar] [CrossRef]
- Miedema, H.; Oudshoorn, C. Annoyance from transportation noise: Relationships with exposure metrics DNL and DENL and their confidence intervals. Environ. Health Perspect. 2001, 109, 409–416. [Google Scholar] [CrossRef]
- Hong, J.Y.; Jeon, J.Y. Exploring spatial relationships among soundscape variables in urban areas: A spatial statistical modelling approach. Landsc. Urban Plan. 2017, 157, 352–364. [Google Scholar] [CrossRef]
- Eze, I.C.; Foraster, M.; Schaffner, E.; Vienneau, D.; Héritier, H.; Pieren, R.; Thiesse, L.; Rudzik, F.; Rothe, T.; Pons, M. Transportation noise exposure, noise annoyance and respiratory health in adults: A repeated-measures study. Environ. Int. 2018, 121, 741–750. [Google Scholar] [CrossRef]
- Leslie, E.; Cerin, E. Are perceptions of the local environment related to neighbourhood satisfaction and mental health in adults? Prev. Med. 2008, 47, 273–278. [Google Scholar] [CrossRef]
- Andrew, R.G.; Burns, R.C.; Allen, M.E. The influence of location on water quality perceptions across a geographic and socioeconomic gradient in Appalachia. Water 2019, 11, 2225. [Google Scholar] [CrossRef] [Green Version]
- Tobler, W.R. A computer movie simulating urban growth in the Detroit region. Econ. Geogr. 1970, 46, 234–240. [Google Scholar] [CrossRef]
- Son, J.Y.; Bell, M.L.; Lee, J.T. Individual exposure to air pollution and lung function in Korea—Spatial analysis using multiple exposure approaches. Environ. Res. 2010, 110, 739–749. [Google Scholar] [CrossRef] [PubMed]
- Kwan, M.P.; Richardson, D.; Wang, D.; Zhou, C. Space-Time Integration in Geography and GIScience; Springer: Berlin, Germany, 2015. [Google Scholar]
- Martínez-Gómez, D.; Hamer, M.; Ortega, F.B.; Cabanas-Sánchez, V.; Sadarangani, K.P.; Lavie, C.J.; Rodríguez-Artalejo, F. Association of changes in physical activity and incidence and remission of overall and abdominal obesity in 113,950 adults. Obesity 2020, 28, 660–668. [Google Scholar] [CrossRef] [PubMed]
- Lin, L.Y.; Hsu, C.Y.; Lee, H.A.; Wang, W.H.; Kurniawan, A.L.; Chao, J.C.J. Dietary patterns in relation to components of dyslipidemia and fasting plasma glucose in adults with dyslipidemia and elevated fasting plasma glucose in Taiwan. Nutrients 2019, 11, 845. [Google Scholar] [CrossRef] [PubMed] [Green Version]
- Kurniawan, A.L.; Hsu, C.Y.; Rau, H.H.; Lin, L.Y.; Chao, J.C.J. Association of kidney function-related dietary pattern, weight status, and cardiovascular risk factors with severity of impaired kidney function in middle-aged and older adults with chronic kidney disease: A cross-sectional population study. Nutr. J. 2019, 18, 27. [Google Scholar] [CrossRef]
- Aumond, P.; Can, A.; Mallet, V.; De Coensel, B.; Ribeiro, C.; Botteldooren, D.; Lavandier, C. Kriging-based spatial interpolation from measurements for sound level mapping in urban areas. J. Acoust. Soc. Am. 2018, 143, 2847–2857. [Google Scholar] [CrossRef] [Green Version]
- Crane, M.; Newman, M.C.; Chapman, P.F.; Fenlon, J.S. Risk Assessment with Time to Event Models; CRC Press: London, UK, 2016. [Google Scholar]
- Rouam, S. Hazard ratios. In Encyclopedia of Systems Biology; Dubitzky, W., Wolkenhauer, O., Cho, K.-H., Yokota, H., Eds.; Springer: New York, NY, USA, 2013; pp. 878–880. [Google Scholar]
- R Core Team. R: A Language and Environment for Statistical Computing; R Foundation for Statistical Computing: Vienna, Austria; Available online: http://www.R-project.org (accessed on 29 April 2020).
- Ministry of Health and Welfare of Taiwan. Available online: https://health99.hpa.gov.tw/OnlinkHealth/BMI.html (accessed on 21 February 2020).
- Moore, S.C.; Patel, A.V.; Matthews, C.E.; de González, A.B.; Park, Y.; Katki, H.A.; Linet, M.S.; Weiderpass, E.; Visvanathan, K.; Helzlsouer, K.J.; et al. Leisure time physical activity of moderate to vigorous intensity and mortality: A large pooled cohort analysis. PLoS Med. 2012, 9, e1001335. [Google Scholar] [CrossRef] [Green Version]
- World Health Organization. Global Recommendations on Physical Activity for Health; WHO: Geneva, Switzerland, 2010. [Google Scholar]
- Lao, X.Q.; Deng, H.B.; Liu, X.D.; Chan, T.C.; Zhang, Z.L.; Chang, L.Y.; Yeoh, E.K.; Tam, T.; Wong, M.C.S.; Thomas, G.N. Increased leisure-time physical activity associated with lower onset of diabetes in 44828 adults with impaired fasting glucose: A population-based prospective cohort study. Br. J. Sports Med. 2019, 53, 895–900. [Google Scholar] [CrossRef]
- de Keijzer, C.; Basagana, X.; Tonne, C.; Valentin, A.; Alonso, J.; Anto, J.M.; Nieuwenhuijsen, M.J.; Kivimaki, M.; Singh-Manoux, A.; Sunyer, J.; et al. Long-term exposure to greenspace and metabolic syndrome: A Whitehall II study. Environ. Pollut. 2019, 255, 113231. [Google Scholar] [CrossRef]
- Eriksson, C.; Pershagen, G.; Nilsson, M. Biological Mechanisms Related to Cardiovascular and Metabolic Effects by Environmental Noise; WHO Regional Office for Europe: Copenhagen, Denmark, 2018. [Google Scholar]
- Cai, Y.T.; Hansell, A.L.; Blangiardo, M.; Burton, P.R.; de Hoogh, K.; Doiron, D.; Fortier, I.; Gulliver, J.; Hveem, K.; Mbatchou, S.; et al. BioSHaRE, Long-term exposure to road traffic noise, ambient air pollution, and cardiovascular risk factors in the HUNT and lifelines cohorts. Eur. Heart J. 2017, 38, 2290–2296. [Google Scholar] [CrossRef] [Green Version]
- Mehrdad, R.; Malek, B.A.; Nahan, M.A. Relationship between exposure to industrial noise and serum lipid profile. Acta Med. Iran. 2011, 49, 725–729. [Google Scholar] [PubMed]
- Pyko, A.; Eriksson, C.; Oftedal, B.; Hilding, A.; Ostenson, C.G.; Krog, N.H.; Julin, B.; Aasvang, G.M.; Pershagen, G. Exposure to traffic noise and markers of obesity. Occup. Environ. Med. 2015, 72, 594–601. [Google Scholar] [CrossRef] [PubMed]
- Foraster, M.; Eze, I.C.; Vienneau, D.; Schaffner, E.; Jeong, A.; Heritier, H.; Rudzik, F.; Thiesse, L.; Pieren, R.; Brink, M.; et al. Long-term exposure to transportation noise and its association with adiposity markers and development of obesity. Environ. Int. 2018, 121, 879–889. [Google Scholar] [CrossRef] [PubMed]
- Eze, I.C.; Imboden, M.; Foraster, M.; Schaffner, E.; Kumar, A.; Vienneau, D.; Heritier, H.; Rudzik, F.; Thiesse, L.; Pieren, R.; et al. Exposure to night-time traffic noise, melatonin-regulating gene variants and change in glycemia in adults. Int. J. Environ. Res. Public Health 2017, 14, 1492. [Google Scholar] [CrossRef] [Green Version]
- Chang, T.-Y.; Yu, T.-Y.; Liu, C.-S.; Young, L.-H.; Bao, B.-Y. Occupational noise exposure and its association with incident hyperglycaemia: A retrospective cohort study. Sci. Rep. 2020, 10, 1–10. [Google Scholar] [CrossRef]
- Liao, J.; Chen, X.; Xu, S.; Li, Y.; Zhang, B.; Cao, Z.; Zhang, Y.; Liang, S.; Hu, K.; Xia, W. Effect of residential exposure to green space on maternal blood glucose levels, impaired glucose tolerance, and gestational diabetes mellitus. Environ. Res. 2019, 176, 108526. [Google Scholar] [CrossRef]
- Sobotova, L.; Jurkovicova, J.; Stefanikova, Z.; Sevcikova, L.; Aghova, L. Community response to environmental noise and the impact on cardiovascular risk score. Sci. Total Environ. 2010, 408, 1264–1270. [Google Scholar] [CrossRef]
- Sørensen, M.; Hjortebjerg, D.; Eriksen, K.T.; Ketzel, M.; Tjønneland, A.; Overvad, K.; Raaschou-Nielsen, O. Exposure to long-term air pollution and road traffic noise in relation to cholesterol: A cross-sectional study. Environ. Int. 2015, 85, 238–243. [Google Scholar] [CrossRef]
- Sørensen, M.; Hvidberg, M.; Hoffmann, B.; Andersen, Z.J.; Nordsborg, R.B.; Lillelund, K.G.; Jakobsen, J.; Tjønneland, A.; Overvad, K.; Raaschou-Nielsen, O. Exposure to road traffic and railway noise and associations with blood pressure and self-reported hypertension: A cohort study. Environ. Health 2011, 10, 92. [Google Scholar] [CrossRef] [Green Version]
- Lin, Y.-T.; Chen, T.-W.; Chang, Y.-C.; Chen, M.-L.; Hwang, B.-F. Relationship between time-varying exposure to occupational noise and incident hypertension: A prospective cohort study. Int. J. Hyg. Environ. Health 2020, 226, 113487. [Google Scholar] [CrossRef]
- Zeeb, H.; Hegewald, J.; Schubert, M.; Wagner, M.; Droge, P.; Swart, E.; Seidler, A. Traffic noise and hypertension—Results from a large case-control study. Environ. Res. 2017, 157, 110–117. [Google Scholar] [CrossRef] [PubMed]
- Daiber, A.; Kröller-Schön, S.; Oelze, M.; Hahad, O.; Li, H.; Schulz, R.; Steven, S.; Münzel, T. Oxidative stress and inflammation contribute to traffic noise-induced vascular and cerebral dysfunction via uncoupling of nitric oxide synthases. Redox Biol. 2020, 101506. [Google Scholar] [CrossRef] [PubMed]
- Recio, A.; Linares, C.; Banegas, J.R.; Díaz, J. Road traffic noise effects on cardiovascular, respiratory, and metabolic health: An integrative model of biological mechanisms. Environ. Res. 2016, 146, 359–370. [Google Scholar] [CrossRef] [PubMed]
- National Institutes of Health. Dietary Assessment Primer, Food Frequency Questionnaire at a Glance. Available online: https://dietassessmentprimer.cancer.gov/profiles/questionnaire/#:~:text≥Description,ranges%20from%2080%20to%20120 (accessed on 1 June 2020).


| Metabolic Syndrome Mean (SD) or % (n) | Low HDL Cholesterol Mean (SD) or % (n) | Abdominal Obesity Mean (SD) or % (n) | Hyperglycemia Mean (SD) or % (n) | Hypertriglyceridemia Mean (SD) or % (n) | Hypertension Mean (SD) or % (n) | |
|---|---|---|---|---|---|---|
| Gender | M: 49.6% (19,860) F: 50.4% (20,181) | M: 49.9% (17,571) F: 50.1% (17,666) | M: 48.0% (17,002) F: 52.0% (18,404) | M: 42.1% (11,068) F: 57.9% (15,219) | M: 49.7% (20,823) F: 50.3% (21,066) | M: 49.4% (19,277) F: 50.6% (19,729) |
| Age, years | 41 (13) | 41 (13) | 40 (12) | 38 (12) | 41 (13) | 40 (12) |
| Body mass index, kg/m2 | 22.6 (3.2) | 22.5 (3.3) | 21.9 (2.7) | 22.1 (3.3) | 22.8 (3.5) | 22.6 (3.3) |
| Physical activity, MET hrs/wk | 8.3 (14.2) | 8.5 (14.3) | 8.3 (14.2) | 7.7 (13.1) | 8.4 (14.2) | 8.2 (14.1) |
| Perceived noise | 3.0 (0.19) | 3.0 (0.20) | 3.0 (0.19) | 3.0 (0.19) | 3.0 (0.20) | 3.0 (0.19) |
| Univariate Model 1 | Multivariable Model 2 | ||||||
|---|---|---|---|---|---|---|---|
| Risk Factor (events/subjects) | Noise Exposure | HR | CI | p-Value | HR | CI | p-Value |
| Metabolic syndrome (3804/40,041) | Medium perception | 1.0 | 0.93–1.1 | 0.863 | 1.13 | 1.04–1.22 | 0.003 |
| High perception | 1.1 | 0.98–1.2 | 0.129 | 1.24 | 1.13–1.36 | <0.001 | |
| Low HDL cholesterol (7197/35,237) | Medium perception | 1.1 | 1.01–1.1 | 0.015 | 1.06 | 1.00–1.12 | 0.054 |
| High perception | 1.0 | 0.97–1.1 | 0.231 | 1.02 | 0.95–1.09 | 0.576 | |
| Abdominal obesity (5778/35,406) | Medium perception | 1.1 | 1–1.1 | 0.069 | 1.13 | 1.06–1.21 | <0.001 |
| High perception | 1.1 | 1–1.2 | 0.002 | 1.24 | 1.15–1.33 | <0.001 | |
| Hypertension (3167/39,006) | Medium perception | 0.93 | 0.86–1 | 0.1 | 1.05 | 0.97–1.14 | 0.235 |
| High perception | 0.94 | 0.86–1 | 0.245 | 1.09 | 0.99–1.20 | 0.088 | |
| Hyper-triglyceridemia (1090/41,889) | Medium perception | 1.1 | 0.94–1.26 | 0.281 | 1.19 | 1.02–1.38 | 0.023 |
| High perception | 1.2 | 1.01–1.42 | 0.034 | 1.35 | 1.14–1.60 | 0.001 | |
| Hyperglycemia (11,273/26,453) | Medium perception | 1.0 | 0.95–1.0 | 0.937 | 1.04 | 1.00–1.09 | 0.059 |
| High perception | 1.1 | 1.00–1.1 | 0.055 | 1.12 | 1.07–1.18 | <0.001 | |
© 2020 by the authors. Licensee MDPI, Basel, Switzerland. This article is an open access article distributed under the terms and conditions of the Creative Commons Attribution (CC BY) license (http://creativecommons.org/licenses/by/4.0/).
Share and Cite
Huang, T.; Chan, T.-C.; Huang, Y.-J.; Pan, W.-C. The Association between Noise Exposure and Metabolic Syndrome: A Longitudinal Cohort Study in Taiwan. Int. J. Environ. Res. Public Health 2020, 17, 4236. https://doi.org/10.3390/ijerph17124236
Huang T, Chan T-C, Huang Y-J, Pan W-C. The Association between Noise Exposure and Metabolic Syndrome: A Longitudinal Cohort Study in Taiwan. International Journal of Environmental Research and Public Health. 2020; 17(12):4236. https://doi.org/10.3390/ijerph17124236
Chicago/Turabian StyleHuang, Tao, Ta-Chien Chan, Ying-Jhen Huang, and Wen-Chi Pan. 2020. "The Association between Noise Exposure and Metabolic Syndrome: A Longitudinal Cohort Study in Taiwan" International Journal of Environmental Research and Public Health 17, no. 12: 4236. https://doi.org/10.3390/ijerph17124236