The Accumulation and Metabolism Characteristics of Rare Earth Elements in Sprague–Dawley Rats

Abstract
:1. Introduction
2. Materials and Methods
2.1. Animal Experiment and Grouping
2.2. Sample Procedures
2.3. Sample Pretreatment and Determination
2.4. Statistical Analysis
3. Results
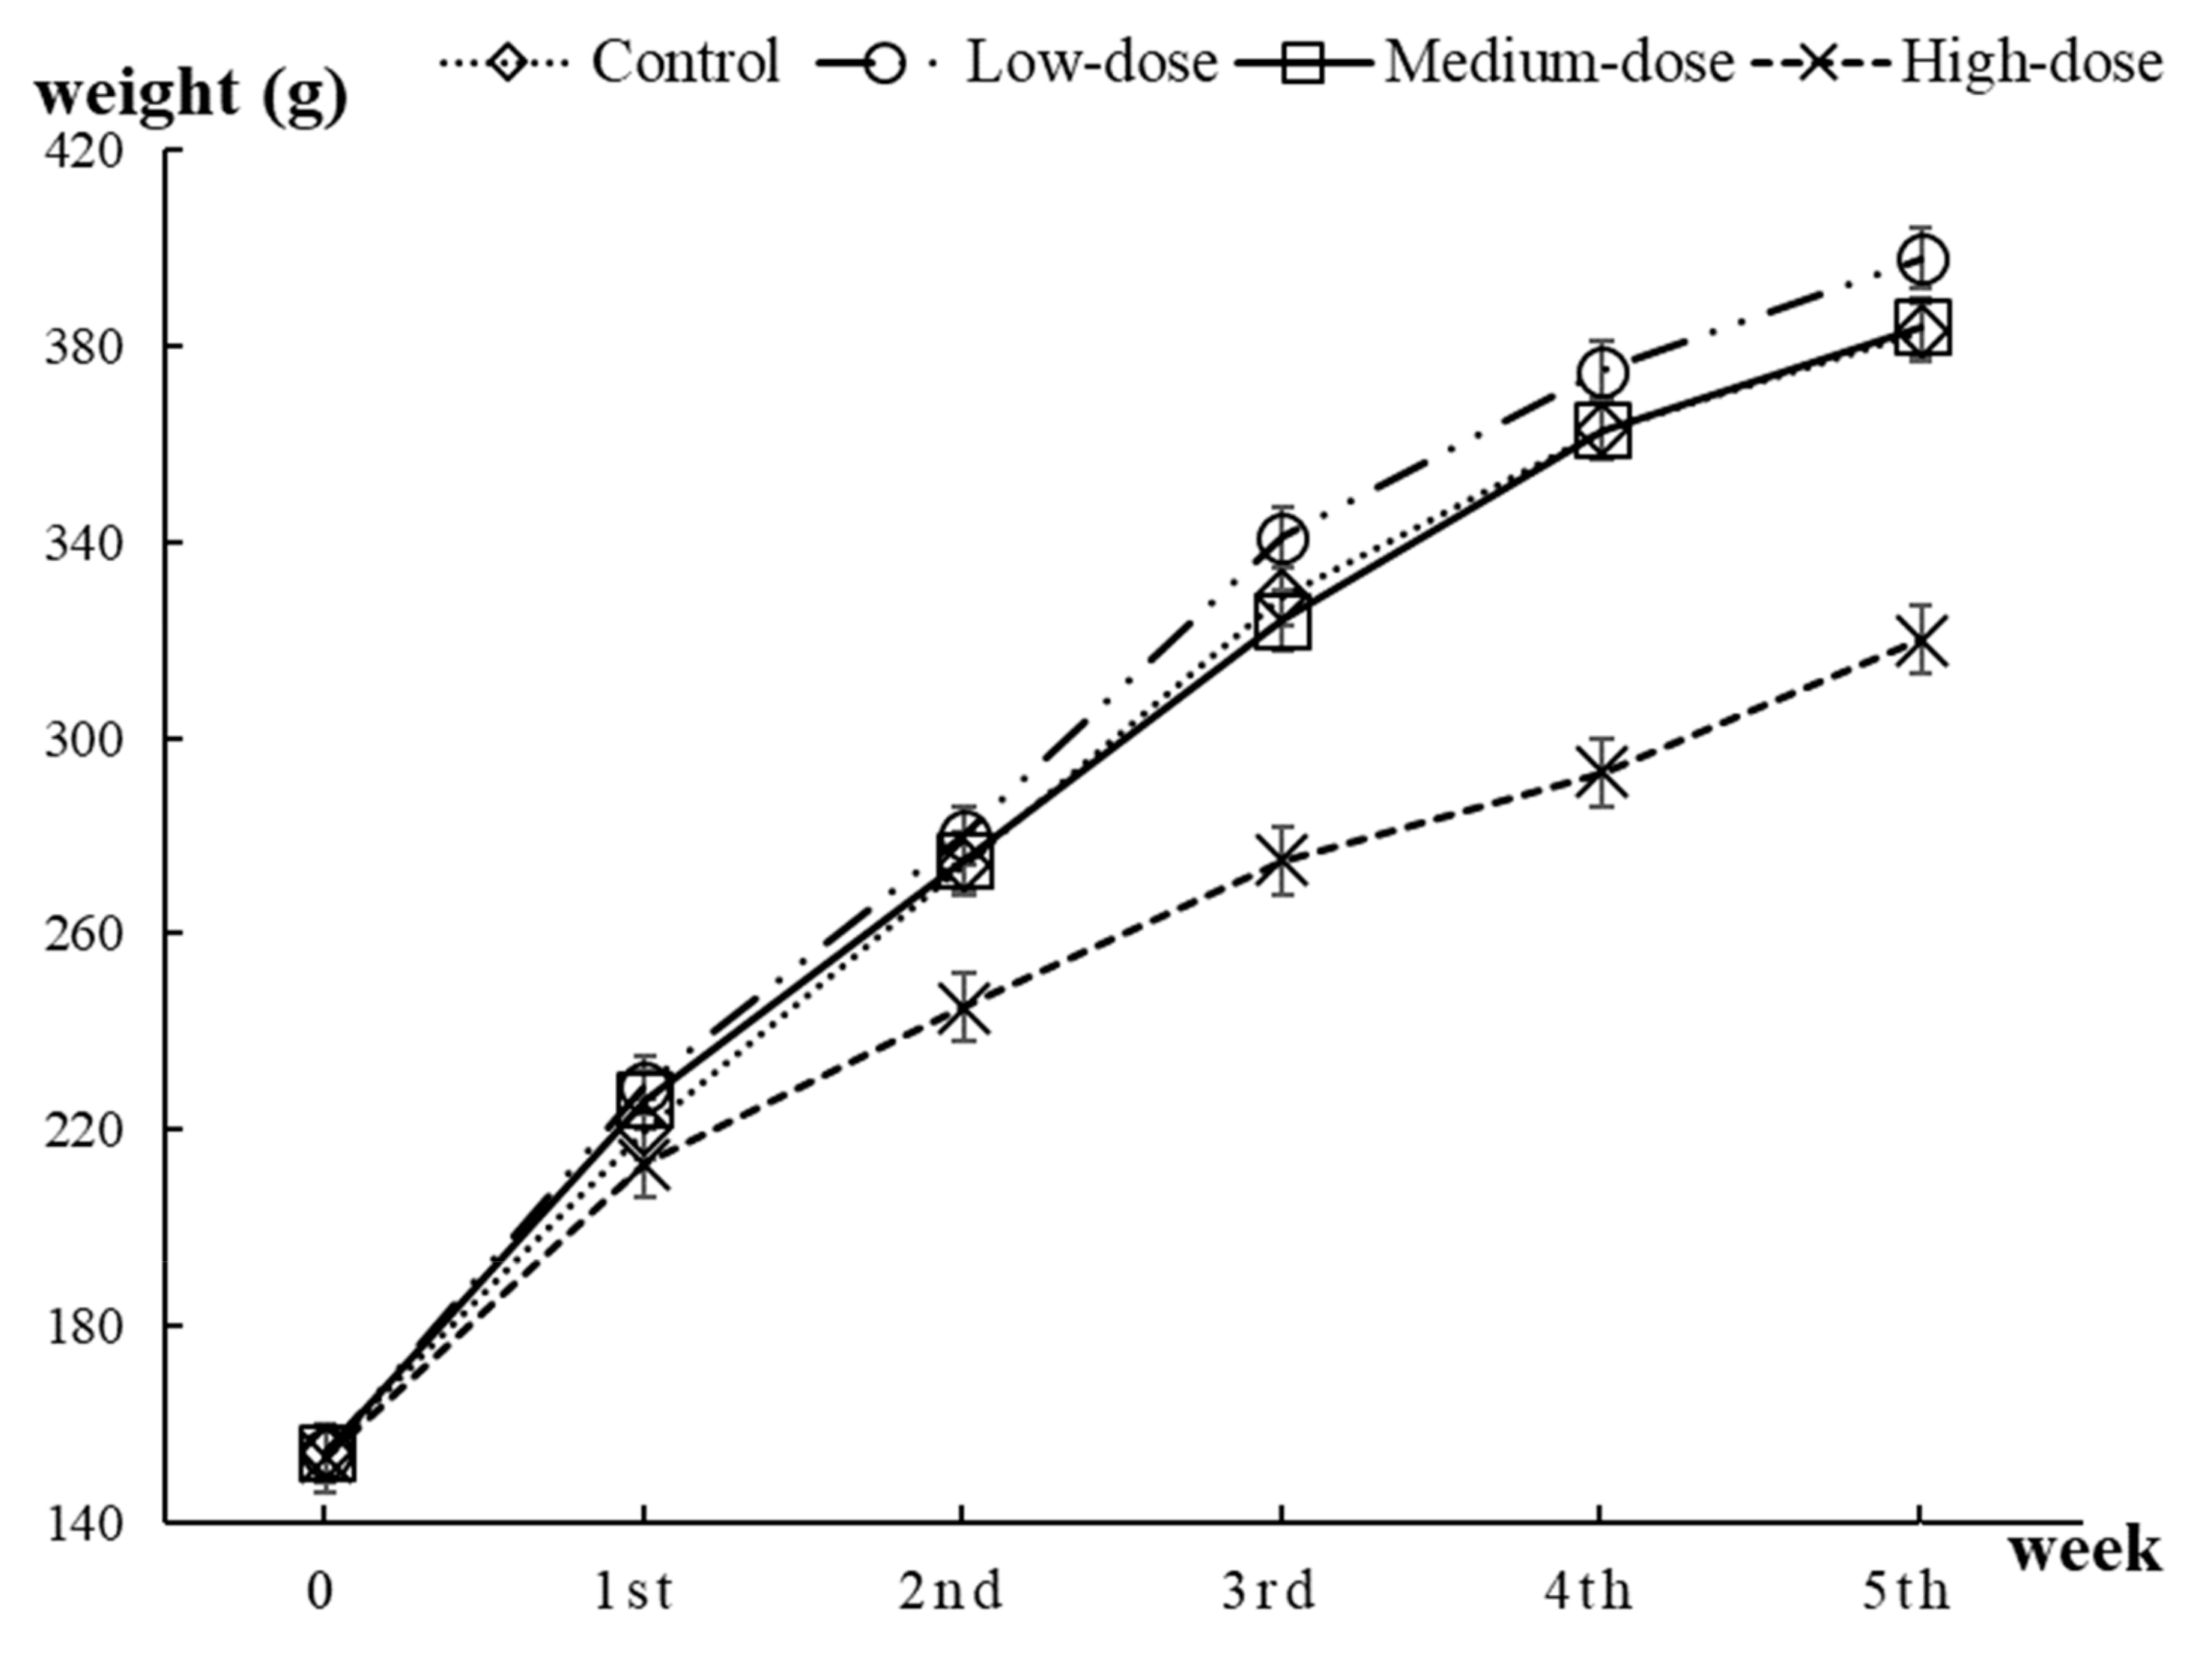
3.1. Body Weight
3.2. REE Concentrations in Different Tissues and Organs
3.3. Correlations among Different Tissues and Organs of Rats
4. Discussion
5. Conclusions
Supplementary Materials
Author Contributions
Funding
Acknowledgments
Conflicts of Interest
References
- Grawunder, A.; Gube, M. Element distribution in fruiting bodies of Lactarius pubescens with focus on rare earth elements. Chemosphere 2018, 208, 614–625. [Google Scholar] [CrossRef]
- Du, X.; Graedel, T.E. Uncovering the global life cycles of the rare earth elements. Sci. Rep. 2011, 1, 145. [Google Scholar] [CrossRef] [PubMed] [Green Version]
- Wang, B.; Yan, L.; Huo, W.; Lu, Q.; Cheng, Z.; Zhang, J.; Li, Z. Rare earth elements and hypertension risk among housewives: A pilot study in Shanxi Province, China. Environ. Pollut. 2017, 220, 837–842. [Google Scholar] [CrossRef]
- Adeel, M.; Lee, J.Y.; Zain, M.; Rizwan, M.; Nawab, A.; Ahmad, M.A.; Shafiq, M.; Yi, H.; Jilani, G.; Javed, R.; et al. Cryptic footprints of rare earth elements on natural resources and living organisms. Environ. Int. 2019, 127, 785–800. [Google Scholar] [CrossRef] [PubMed]
- Abdelnour, S.A.; Abd El-Hack, M.E.; Khafaga, A.F.; Noreldin, A.E.; Arif, M.; Chaudhry, M.T.; Losacco, C.; Abdeen, A.; Abdel-Daim, M.M. Impacts of rare earth elements on animal health and production: Highlights of cerium and lanthanum. Sci. Total. Env. 2019, 672, 1021–1032. [Google Scholar] [CrossRef] [PubMed]
- Pagano, G.; Aliberti, F.; Guida, M.; Oral, R.; Siciliano, A.; Trifuoggi, M.; Tommasi, F. Rare earth elements in human and animal health: State of art and research priorities. Environ. Res. 2015, 142, 215–220. [Google Scholar] [CrossRef]
- MacMillan, G.A.; Chetelat, J.; Heath, J.P.; Mickpegak, R.; Amyot, M. Rare earth elements in freshwater, marine, and terrestrial ecosystems in the eastern Canadian Arctic. Environ. Sci. Process Impacts. 2017, 19, 1336–1345. [Google Scholar] [CrossRef]
- Bai, Y.; Long, C.; Hu, G.; Zhou, D.; Gao, X.; Chen, Z.; Wang, T.; Yu, S.; Han, Y.; Yan, L. Association of blood chromium and rare earth elements with the risk of DNA damage in chromate exposed population. Environ. Toxicol. Pharm. 2019, 72, 103237. [Google Scholar] [CrossRef]
- Carpenter, D.; Boutin, C.; Allison, J.E.; Parsons, J.L.; Ellis, D.M. Uptake and Effects of Six Rare Earth Elements (REEs) on Selected Native and Crop Species Growing in Contaminated Soils. PloS ONE 2015, 10, e0129936. [Google Scholar] [CrossRef] [Green Version]
- Thomas, P.J.; Carpenter, D.; Boutin, C.; Allison, J.E. Rare earth elements (REEs): Effects on germination and growth of selected crop and native plant species. Chemosphere 2014, 96, 57–66. [Google Scholar] [CrossRef] [Green Version]
- Tong, S.L.; Zhu, W.Z.; Gao, Z.H.; Meng, Y.X.; Peng, R.L.; Lu, G.C. Distribution characteristics of rare earth elements in children’s scalp hair from a rare earths mining area in southern China. J. Environ. Sci. Health A Tox. Hazard Subst. Environ. Eng. 2004, 39, 2517–2532. [Google Scholar] [CrossRef]
- Pagano, G.; Guida, M.; Tommasi, F.; Oral, R. Health effects and toxicity mechanisms of rare earth elements—Knowledge gaps and research prospects. Ecotoxicol. Environ. Saf. 2015, 115, 40–48. [Google Scholar] [CrossRef]
- Fan, G.Q.; Yuan, Z.K.; Zheng, H.L.; Liu, Z.J. Study on the effects of exposure to rare earth elements and health-responses in children aged 7–10 years (in Chinese). J. Hyg. Res. 2004, 33, 23–28. [Google Scholar]
- Xiao, H.; Li, F.; Zhang, Z.; Feng, L.; Li, Z.; Yang, J.; Chai, Z. Distribution of ytterbium-169 in rat brain after intravenous injection. Toxicol. Lett. 2005, 155, 247–252. [Google Scholar] [CrossRef] [PubMed]
- Nohmi, T.; Masumura, K.; Toyoda-Hokaiwado, N. Transgenic rat models for mutagenesis and carcinogenesis. Genes Env. 2017, 39, 11. [Google Scholar] [CrossRef] [PubMed] [Green Version]
- Damme, N.M.; Fernandez, D.P.; Wang, L.M.; Wu, Q.; Kirk, R.A.; Towner, R.A.; McNally, J.S.; Hoffman, J.M.; Morton, K.A. Analysis of retention of gadolinium by brain, bone, and blood following linear gadolinium-based contrast agent administration in rats with experimental sepsis. Magn. Reson. Med. 2019. [Google Scholar] [CrossRef]
- Dressler, V.L.; Ogunmodede, O.T.; Heidrich, G.M.; Neves, V.M.; Schetinger, M.R.C.; Morsch, V.M. Investigative Analysis of Lanthanum Oxide Nanoparticles on Elements in Bone of Wistar Rats After 30 Days of Repeated Oral Administration. Biol. Trace Elem. Res. 2019. [Google Scholar] [CrossRef]
- Calabrese, E.J.; Mattson, M.P. Hormesis provides a generalized quantitative estimate of biological plasticity. J. Cell Commun. Signal. 2011, 5, 25–38. [Google Scholar] [CrossRef] [Green Version]
- Calabrese, E.J. Hormesis is central to toxicology, pharmacology and risk assessment. Hum. Exp. Toxicol. 2010, 29, 249–261. [Google Scholar] [CrossRef]
- Mattson, M.P. Hormesis defined. Ageing Res. Rev. 2008, 7, 1–7. [Google Scholar] [CrossRef]
- Fang, H.Q.; Yu, Z.; Zhi, Y.; Fang, J.; Li, C.X.; Wang, Y.M.; Peng, S.Q.; Jia, X.D. Subchronic Oral Toxicity Evaluation of Lanthanum: A 90-day, Repeated Dose Study in Rats. Biomed. Environ. Sci. 2018, 31, 363–375. [Google Scholar] [CrossRef]
- Cheng, J.; Fei, M.; Fei, M.; Sang, X.; Sang, X.; Cheng, Z.; Gui, S.; Zhao, X.; Sheng, L.; Sun, Q.; et al. Gene expression profile in chronic mouse liver injury caused by long-term exposure to CeCl3. Environ. Toxicol. 2014, 29, 837–846. [Google Scholar] [CrossRef] [PubMed]
- Nakamura, Y.; Tsumura, Y.; Tonogai, Y.; Shibata, T.; Ito, Y. Differences in behavior among the chlorides of seven rare earth elements administered intravenously to rats. Fundam. Appl. Toxicol. 1997, 37, 106–116. [Google Scholar] [CrossRef] [PubMed]
- Badri, N.; Florea, A.; Mhamdi, M.; Matei, H.; Tekaya, W.H.; Baati, R.; Maghraoui, S.; Tekaya, L. Toxicological effects and ultrastructural changes induced by lanthanum and cerium in ovary and uterus of Wistar rats. J. Trace Elem. Med. Biol. 2017, 44, 349–355. [Google Scholar] [CrossRef]
- Zhang, J.C.; Li, X.X.; Jin, X.S.; Wang, L.; Yu, S.F.; Lin, Q. Effects of rare earth ion on the proliferation, differentiation and expression of osteoblasts in vitro(Chinese). Prog. Nat. Sci. 2010, 4, 404–409. [Google Scholar]
- Massadeh, A.; Gharibeh, A.; Omari, K.; Al-Momani, I.; Alomary, A.; Tumah, H.; Hayajneh, W. Simultaneous determination of Cd, Pb, Cu, Zn, and Se in human blood of jordanian smokers by ICP-OES. Biol. Trace Elem. Res. 2010, 133, 1–11. [Google Scholar] [CrossRef]
- Benes, B.; Spevackova, V.; Smid, J.; Cejchanova, M.; Cerna, M.; Subrt, P.; Marecek, J. The concentration levels of Cd, Pb, Hg, Cu, Zn and Se in blood of the population in the Czech Republic. Cent. Eur. J. Public Health 2000, 8, 117–119. [Google Scholar]
- Kim, Y.S.; Lim, C.H.; Shin, S.H.; Kim, J.C. Twenty-Eight-Day Repeated Inhalation Toxicity Study of Nano-Sized Neodymium Oxide in Male Sprague-Dawley Rats. Toxicol. Res. 2017, 33, 239–253. [Google Scholar] [CrossRef] [Green Version]


| Control (n=10) | Low-Dose (n=10) | Medium-Dose (n=10) | High-Dose (n=10) | Detoxification (n=10) | P-Value | ||
|---|---|---|---|---|---|---|---|
| Whole Blood (ng/mL) | |||||||
| La | 2.71 ± 1.56 d | 3.12 ± 1.84 d | 2.28 ± 0.77 d | 37.2 ± 21.6 a,b,c,e | 2.03 ± 0.91 d | <0.001 | |
| Ce | 4.89 ± 2.87 d | 5.95 ± 3.56 d | 4.47 ± 1.41 d | 76.76 ± 43.89 a,b,c,e | 4.21 ± 1.85 d | <0.001 | |
| Pr | 0.55 ± 0.33 d | 0.67 ± 0.39 d | 0.49 ± 0.15 d | 8.47 ± 4.86 a,b,c,e | 0.39 ± 0.21 d | <0.001 | |
| Nd | 0.99 ± 0.29 d | 1.17 ± 0.42 d | 0.9 ± 0.17 d | 4.34 ± 2.29 a,b,c,e | 0.91 ± 0.45 d | <0.001 | |
| Gd | 0.2 ± 0.05 d | 0.24 ± 0.08 d | 0.18 ± 0.01 d | 1.16 ± 0.54 a,b,c,e | 0.17 ± 0.07 d | <0.001 | |
| Spleen (ng/g) | |||||||
| La | 2.22 ± 1.34 d,e | 2.71 ± 1.00 d,e | 68.96 ± 35.73 d,e | 10,559.94 ± 8994.95 a,b,c,e | 778.15 ± 588.96 a,b,c,d | <0.001 | |
| Ce | 2.51 ± 2.68 d,e | 3.22 ± 2.24 d,e | 158.86 ± 77.19 d,e | 1382.2 ± 1187.87 a,b,c | 2264.89 ± 1495.49 a,b,c | <0.001 | |
| Pr | 0.47 ± 0.3 d,e | 0.6 ± 0.29 d,e | 20.74 ± 9.84 d,e | 570.17 ± 520.3 a,b,c,e | 297.31 ± 195.57 a,b,c,d | <0.001 | |
| Nd | 0.3 ± 0.28 d,e | 0.62 ± 0.28 d,e | 8.27 ± 3.19 d,e | 430.29 ± 404.95 a,b,c,e | 119.69 ± 89.2 a,b,c,d | <0.001 | |
| Gd | 0.02 ± 0.02 d,e | 0.03 ± 0.05 d,e | 1.66 ± 0.72 d,e | 109.75 ± 93.56 a,b,c,e | 23.84 ± 15.94 a,b,c,d | <0.001 | |
| Bone (ng/g) | |||||||
| La | 59.61 ± 14.23 d,e | 69.78 ± 10.67 d,e | 234.8 ± 102.49 d,e | 2017.35 ± 489.96 a,b,c,e | 1369.56 ± 177.08 a,b,c,d | <0.001 | |
| Ce | 18.87 ± 8.25 d,e | 26.71 ± 9.27 d,e | 478.96 ± 268.6 d,e | 5418.33 ± 1369.7 a,b,c,e | 3463.71 ± 587.97 a,b,c,d | <0.001 | |
| Pr | 21.86 ± 4.73 d,e | 23.95 ± 2.65 d,e | 81.93 ± 32.71 d,e | 825.33 ± 191.14 a,b,c,e | 558.15 ± 79.92 a,b,c,d | <0.001 | |
| Nd | 3.54 ± 2.05 d,e | 3.82 ± 1.65 d,e | 29.33 ± 14.39 d,e | 348.55 ± 111.4 a,b,c,e | 235.26 ± 50.81 a,b,c,d | <0.001 | |
| Gd | 0.86 ± 0.44 d,e | 0.75 ± 0.38 d,e | 6.86 ± 3.53 d,e | 87.43 ± 20.65 a,b,c,e | 58.16 ± 9.67 a,b,c,d | <0.001 | |
| Hair (ng/g) | |||||||
| La | 642.29 ± 277.15 d | 508.79 ± 211.18 d | 2160.79 ± 473.22 d | 18,320.41 ± 5757.4 a,b,c,e | 271.08 ± 210.62 d | <0.001 | |
| Ce | 1377.46 ± 537.5 d | 1053 ± 396.25 d | 4086.98 ± 904.61 d | 32,629.22 ± 9544.6 a,b,c,e | 507.84 ± 404.31 d | <0.001 | |
| Pr | 160.52 ± 61.74 d | 124.12 ± 47.2 d | 465.47 ± 104.41 d | 3523.33 ± 1035 a,b,c,e | 54.95 ± 43.41 d | <0.001 | |
| Nd | 59.75 ± 27.99 d | 41.73 ± 15.06 d | 139.62 ± 27.19 d | 1096.23 ± 294.87 a,b,c,e | 27.29 ± 17.52 d | <0.001 | |
| Gd | 18.1 ± 7.19 d | 13.74 ± 5.48 d | 60.87 ± 12.92 d | 462.43 ± 130.53 a,b,c,e | 6.78 ± 5.00 d | <0.001 | |
| Liver(ng/g) | |||||||
| La | 7.01 ± 2.53 d,e | 13.59 ± 6.35 d,e | 370.26 ± 204.61 d,e | 4552.18 ± 2141.21 a,b,c | 1272.52 ± 548.04 a,b,c | <0.001 | |
| Ce | 12.59 ± 5.24 d,e | 23.39 ± 11.18 d,e | 785.92 ± 486.75 d,e | 12,807.13 ± 6105.85 a,b,c | 3723.99 ± 1610.61 a,b,c | <0.001 | |
| Pr | 1.24 ± 0.67 d,e | 2.48 ± 1.28 d,e | 90.05 ± 55.61 d,e | 1617.66 ± 755.31 a,b,c | 453.3 ± 196.99 a,b,c | <0.001 | |
| Nd | 1.54 ± 0.45 d,e | 1.35 ± 0.89 d,e | 31.45 ± 18.26 d,e | 617.95 ± 257.92 a,b,c | 174.86 ± 95.36 a,b,c | <0.001 | |
| Gd | 0.28 ± 0.09 d,e | 0.34 ± 0.14 d,e | 9.86 ± 6.26 d,e | 165.12 ± 79.38 a,b,c,e | 39.46 ± 16.62 a,b,c,d | <0.001 | |
| Control (n=10) | Low-Dose (n=10) | Medium-Dose (n=10) | High-Dose (n=10) | Detoxification (n=10) | P-Value | ||
|---|---|---|---|---|---|---|---|
| Whole Blood (%) | |||||||
| La | 28.61 ± 1.27 | 27.38 ± 1.37 | 27.23 ± 1.15 | 29.06 ± 1.64 | 26.26 ± 4.16 | 0.052 | |
| Ce | 51.57 ± 1.9 d,e | 52.28 ± 3.02 d | 53.46 ± 1.35 d | 59.9 ± 1.64 a,b,c,e | 54.75 ± 3.48 a,d | <0.001 | |
| Pr | 5.82 ± 0.41 d,e | 5.97 ± 0.31 d,e | 5.86 ± 0.52 d,e | 6.62 ± 0.33 a,b,c,e | 4.91 ± 0.77 a,b,c,d | <0.001 | |
| Nd | 11.62 ± 2.46 d | 11.92 ± 3.43 d | 11.17 ± 1.61 d | 3.48 ± 0.96 a,b,c,e | 11.83 ± 2.4 d | <0.001 | |
| Gd | 2.38 ± 0.49 d | 2.45 ± 0.78 d | 2.29 ± 0.48 d | 0.95 ± 0.12 a,b,c,e | 2.25 ± 0.61 d | <0.001 | |
| Bone (%) | |||||||
| La | 57.13 ± 4.46 c,d,e | 55.96 ± 7.34 c,d,e | 28.9 ± 1.75 a,b,d,e | 23.24 ± 0.52 a,b,c | 24.17 ± 0.81 a,b,c | <0.001 | |
| Ce | 17.49 ± 5.15 b,c,d,e | 21.12 ± 6.15 a,c,d,e | 56.5 ± 2.72 a,b,d,e | 62.25 ± 0.67 a,b,c | 60.82 ± 1.43 a,b,c | <0.001 | |
| Pr | 21.28 ± 3.52 b,c,d,e | 19.26 ± 2.05 a,c,d,e | 10.23 ± 1.11 a,b | 9.53 ± 0.28 a,b | 9.83 ± 0.18 a,b | <0.001 | |
| Nd | 3.28 ± 1.49 | 3.06 ± 1.26 | 3.54 ± 0.14 | 3.98 ± 0.53 | 4.16 ± 0.79 | 0.081 | |
| Gd | 0.81 ± 0.34 b | 0.6 ± 0.29 a,c,d,e | 0.82 ± 0.04 b | 1.01 ± 0.03 b | 1.02 ± 0.04 b | <0.001 | |
| Hair (%) | |||||||
| La | 28.06 ± 1.54 c,d,e | 28.76 ± 1.59 c,d,e | 31.25 ± 0.61 a,b,d | 32.62 ± 1.06 a,b,c,e | 31.25 ± 0.56 a,b,d | <0.001 | |
| Ce | 61.38 ± 1.33 c,d,e | 60.85 ± 1.41 c,d,e | 59.08 ± 0.59 a,b | 58.29 ± 0.87 a,b | 57.9 ± 1.22 a,b | <0.001 | |
| Pr | 7.17 ± 0.3 c,d,e | 7.16 ± 0.11 c,d,e | 6.72 ± 0.12 a,b,d,e | 6.29 ± 0.18 a,b,c | 6.3 ± 0.21 a,b,c | <0.001 | |
| Nd | 2.58 ± 0.23 e | 2.45 ± 0.25 e | 2.06 ± 0.37 e | 1.98 ± 0.13 e | 3.71 ± 1.52 a,b,c,d | <0.001 | |
| Gd | 0.8 ± 0.03 | 0.79 ± 0.03 | 0.88 ± 0.04 | 0.83 ± 0.04 | 0.84 ± 0.19 | 0.191 | |
| Spleen (%) | |||||||
| La | 45.91 ± 10.09 c,d,e | 41.42 ± 8.57 c,d,e | 26.4 ± 1.29 a,b,d | 81.29 ± 1.19 a,b,c,e | 21.52 ± 2.74 a,b,d | <0.001 | |
| Ce | 36.37 ± 18.23 c,d,e | 40.06 ± 10.74 c,d,e | 61.49 ± 1.04 a,b,d | 10.62 ± 0.18 a,b,c,e | 65.8 ± 2.15 a,b,d | <0.001 | |
| Pr | 9.47 ± 1.75 c,d | 8.71 ± 0.99 d | 8.06 ± 0.24 a,d | 4.19 ± 0.43 a,b,c,e | 8.66 ± 0.48 d | <0.001 | |
| Nd | 7.57 ± 8.02 | 9.53 ± 3.42 c,d,e | 3.39 ± 0.59 b | 3.07 ± 1.08 b | 3.32 ± 0.4 b | <0.001 | |
| Gd | 0.67 ± 0.99 | 0.29 ± 0.44 | 0.66 ± 0.07 | 0.83 ± 0.06 | 0.7 ± 0.05 | 0.158 | |
| Liver (%) | |||||||
| La | 31.22 ± 1.3 b,c,d,e | 33.13 ± 1.95 a,c,d,e | 29.1 ± 0.92 a,b,d,e | 23.09 ± 1.09 a,b,c | 22.46 ± 1.37 a,b,c | <0.001 | |
| Ce | 55.16 ± 1.84 c,d,e | 56.44 ± 2.24 c,d,e | 60.74 ± 0.87 a,b,d,e | 64.66 ± 0.97 a,b,c | 65.51 ± 1.39 a,b,c | <0.001 | |
| Pr | 5.24 ± 0.68 b,c,d,e | 5.87 ± 0.5 a,c,d,e | 6.96 ± 0.12 a,b,d,e | 8.2 ± 0.18 a,b,c | 7.97 ± 0.24 a,b,c | <0.001 | |
| Nd | 7.11 ± 1.67 b,c,d,e | 3.71 ± 3.43 a | 2.44 ± 0.28 a | 3.21 ± 0.32 a | 3.35 ± 1.22 a | <0.001 | |
| Gd | 1.26 ± 0.19 b,c,d,e | 0.85 ± 0.19 a,e | 0.76 ± 0.04 a | 0.83 ± 0.03 a | 0.7 ± 0.04 a,b | <0.001 | |
| Variables | La | Ce | Nd | Gd | Pr | |||||||||||||||
|---|---|---|---|---|---|---|---|---|---|---|---|---|---|---|---|---|---|---|---|---|
| Whole Blood | Bone | Hair | Spleen | Whole Blood | Bone | Hair | Spleen | Whole Blood | Bone | Hair | Spleen | Whole Blood | Bone | Hair | Spleen | Whole Blood | Bone | Hair | Spleen | |
| Bone | 0.095 | 0.583 * | −0.022 | −0.212 | 0.053 | |||||||||||||||
| Hair | 0.039 | −0.791 * | −0.533 * | -0.760 * | 0.445 * | 0.178 | 0.090 | 0.158 | 0.066 | 0.790 * | ||||||||||
| Spleen | 0.380 * | −0.044 | 0.180 | −0.414 * | 0.124 | −0.154 | 0.155 | 0.150 | −0.004 | −0.202 | 0.708 * | 0.089 | −0.451 * | 0.461 * | 0.575 * | |||||
| Liver | 0.092 | 0.849 * | −0.680 * | −0.184 | 0.578 * | 0.877 * | −0.745 * | 0.060 | 0.085 | −0.240 | 0.089 | 0.131 | 0.185 | −0.252 | −0.093 | −0.104 | −0.021 | −0.817 * | −0.822 * | −0.567 * |
© 2020 by the authors. Licensee MDPI, Basel, Switzerland. This article is an open access article distributed under the terms and conditions of the Creative Commons Attribution (CC BY) license (http://creativecommons.org/licenses/by/4.0/).
Share and Cite
Cao, B.; Wu, J.; Xu, C.; Chen, Y.; Xie, Q.; Ouyang, L.; Wang, J. The Accumulation and Metabolism Characteristics of Rare Earth Elements in Sprague–Dawley Rats. Int. J. Environ. Res. Public Health 2020, 17, 1399. https://doi.org/10.3390/ijerph17041399
Cao B, Wu J, Xu C, Chen Y, Xie Q, Ouyang L, Wang J. The Accumulation and Metabolism Characteristics of Rare Earth Elements in Sprague–Dawley Rats. International Journal of Environmental Research and Public Health. 2020; 17(4):1399. https://doi.org/10.3390/ijerph17041399
Chicago/Turabian StyleCao, Bing, Jing Wu, Changlian Xu, Yan Chen, Qing Xie, Li Ouyang, and Jingyu Wang. 2020. "The Accumulation and Metabolism Characteristics of Rare Earth Elements in Sprague–Dawley Rats" International Journal of Environmental Research and Public Health 17, no. 4: 1399. https://doi.org/10.3390/ijerph17041399