Exploring Risk Factors Contributing to the Severity of Hazardous Material Transportation Accidents in China

Abstract
:1. Introduction
2. Materials and Methods
2.1. Data Source and Study Area
2.2. Variables
2.2.1. Hazmat Factors
2.2.2. Driver Factors
2.2.3. Location Factors
2.2.4. Environment Factors
2.2.5. Vehicle Factors
2.2.6. Accident Factors
2.3. Definition of Accidents Severity
- No injury (level 1): the people involved in accidents sustained no injuries at all.
- Minor injury (level 2): the victim need not to be admitted to the hospital.
- Severe injury (level 3): the victim was admitted to the hospital either for treatment or observation.
- Fatality (level 4): the victim died within 30 days of collision or on site.
2.4. Methods
3. Results and Discussion
3.1. Hazmat Factors
3.2. Driver Factors
3.3. Location Factors
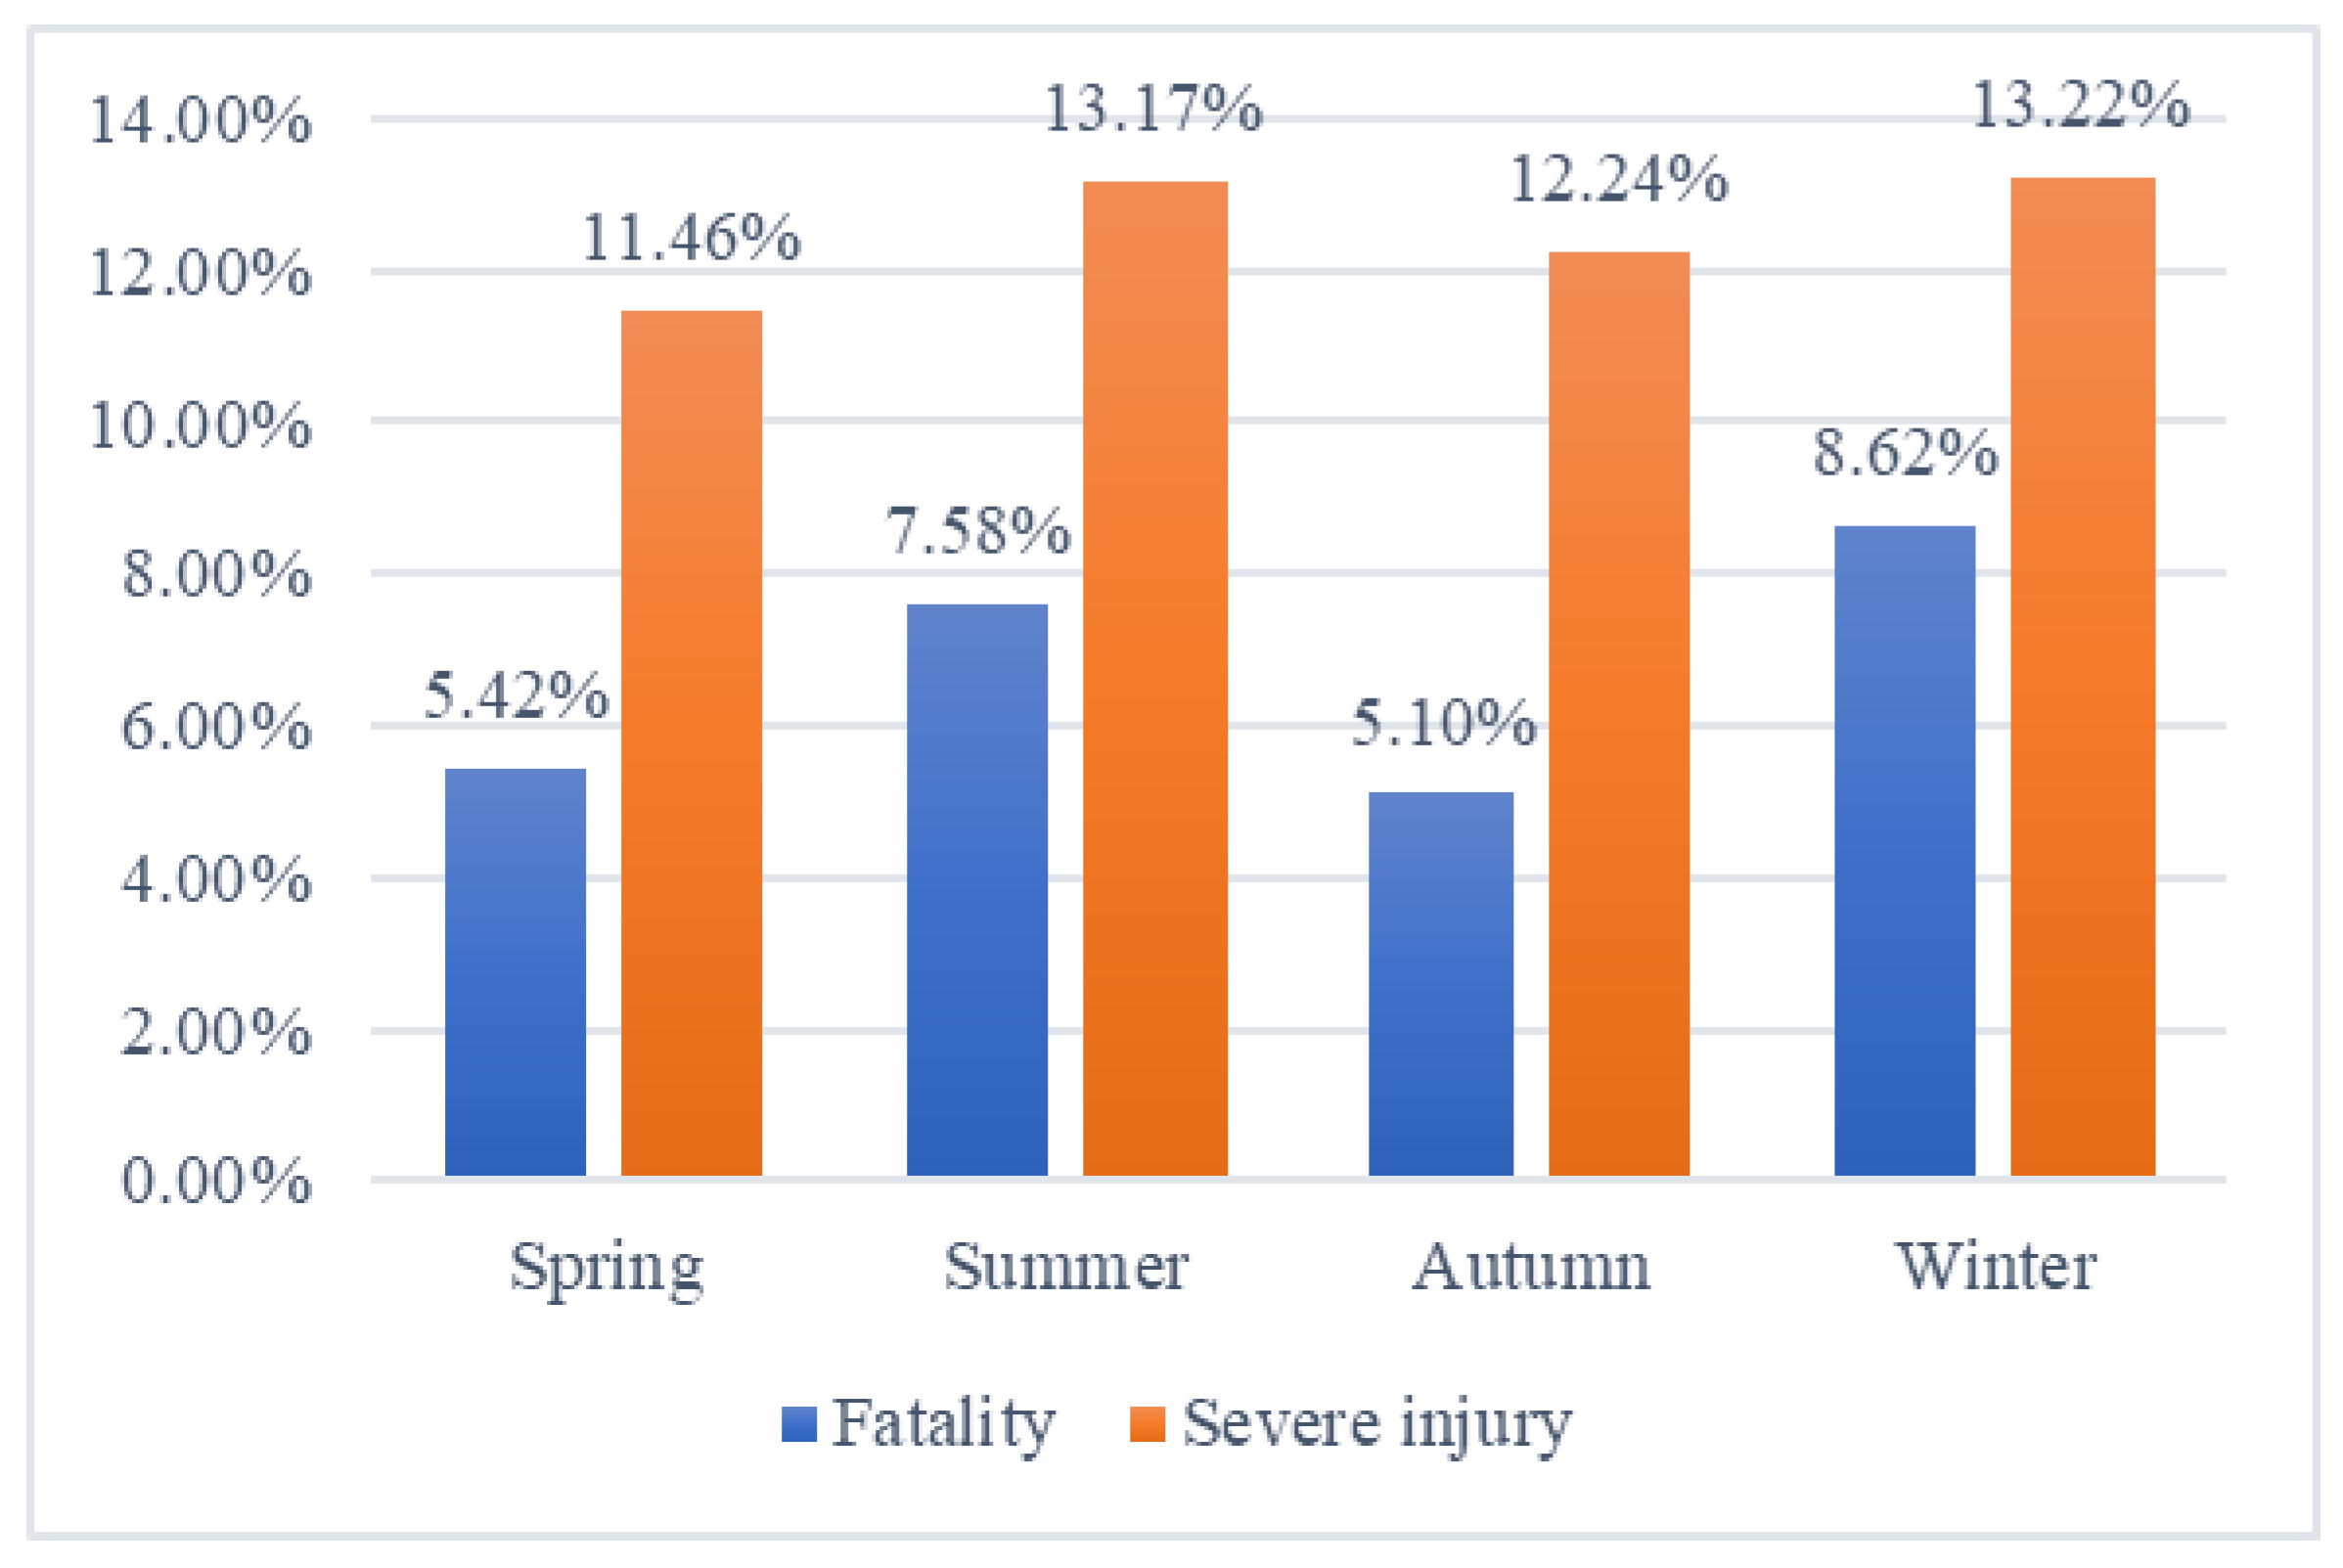
3.4. Environment Factors
3.5. Vehicle Factors
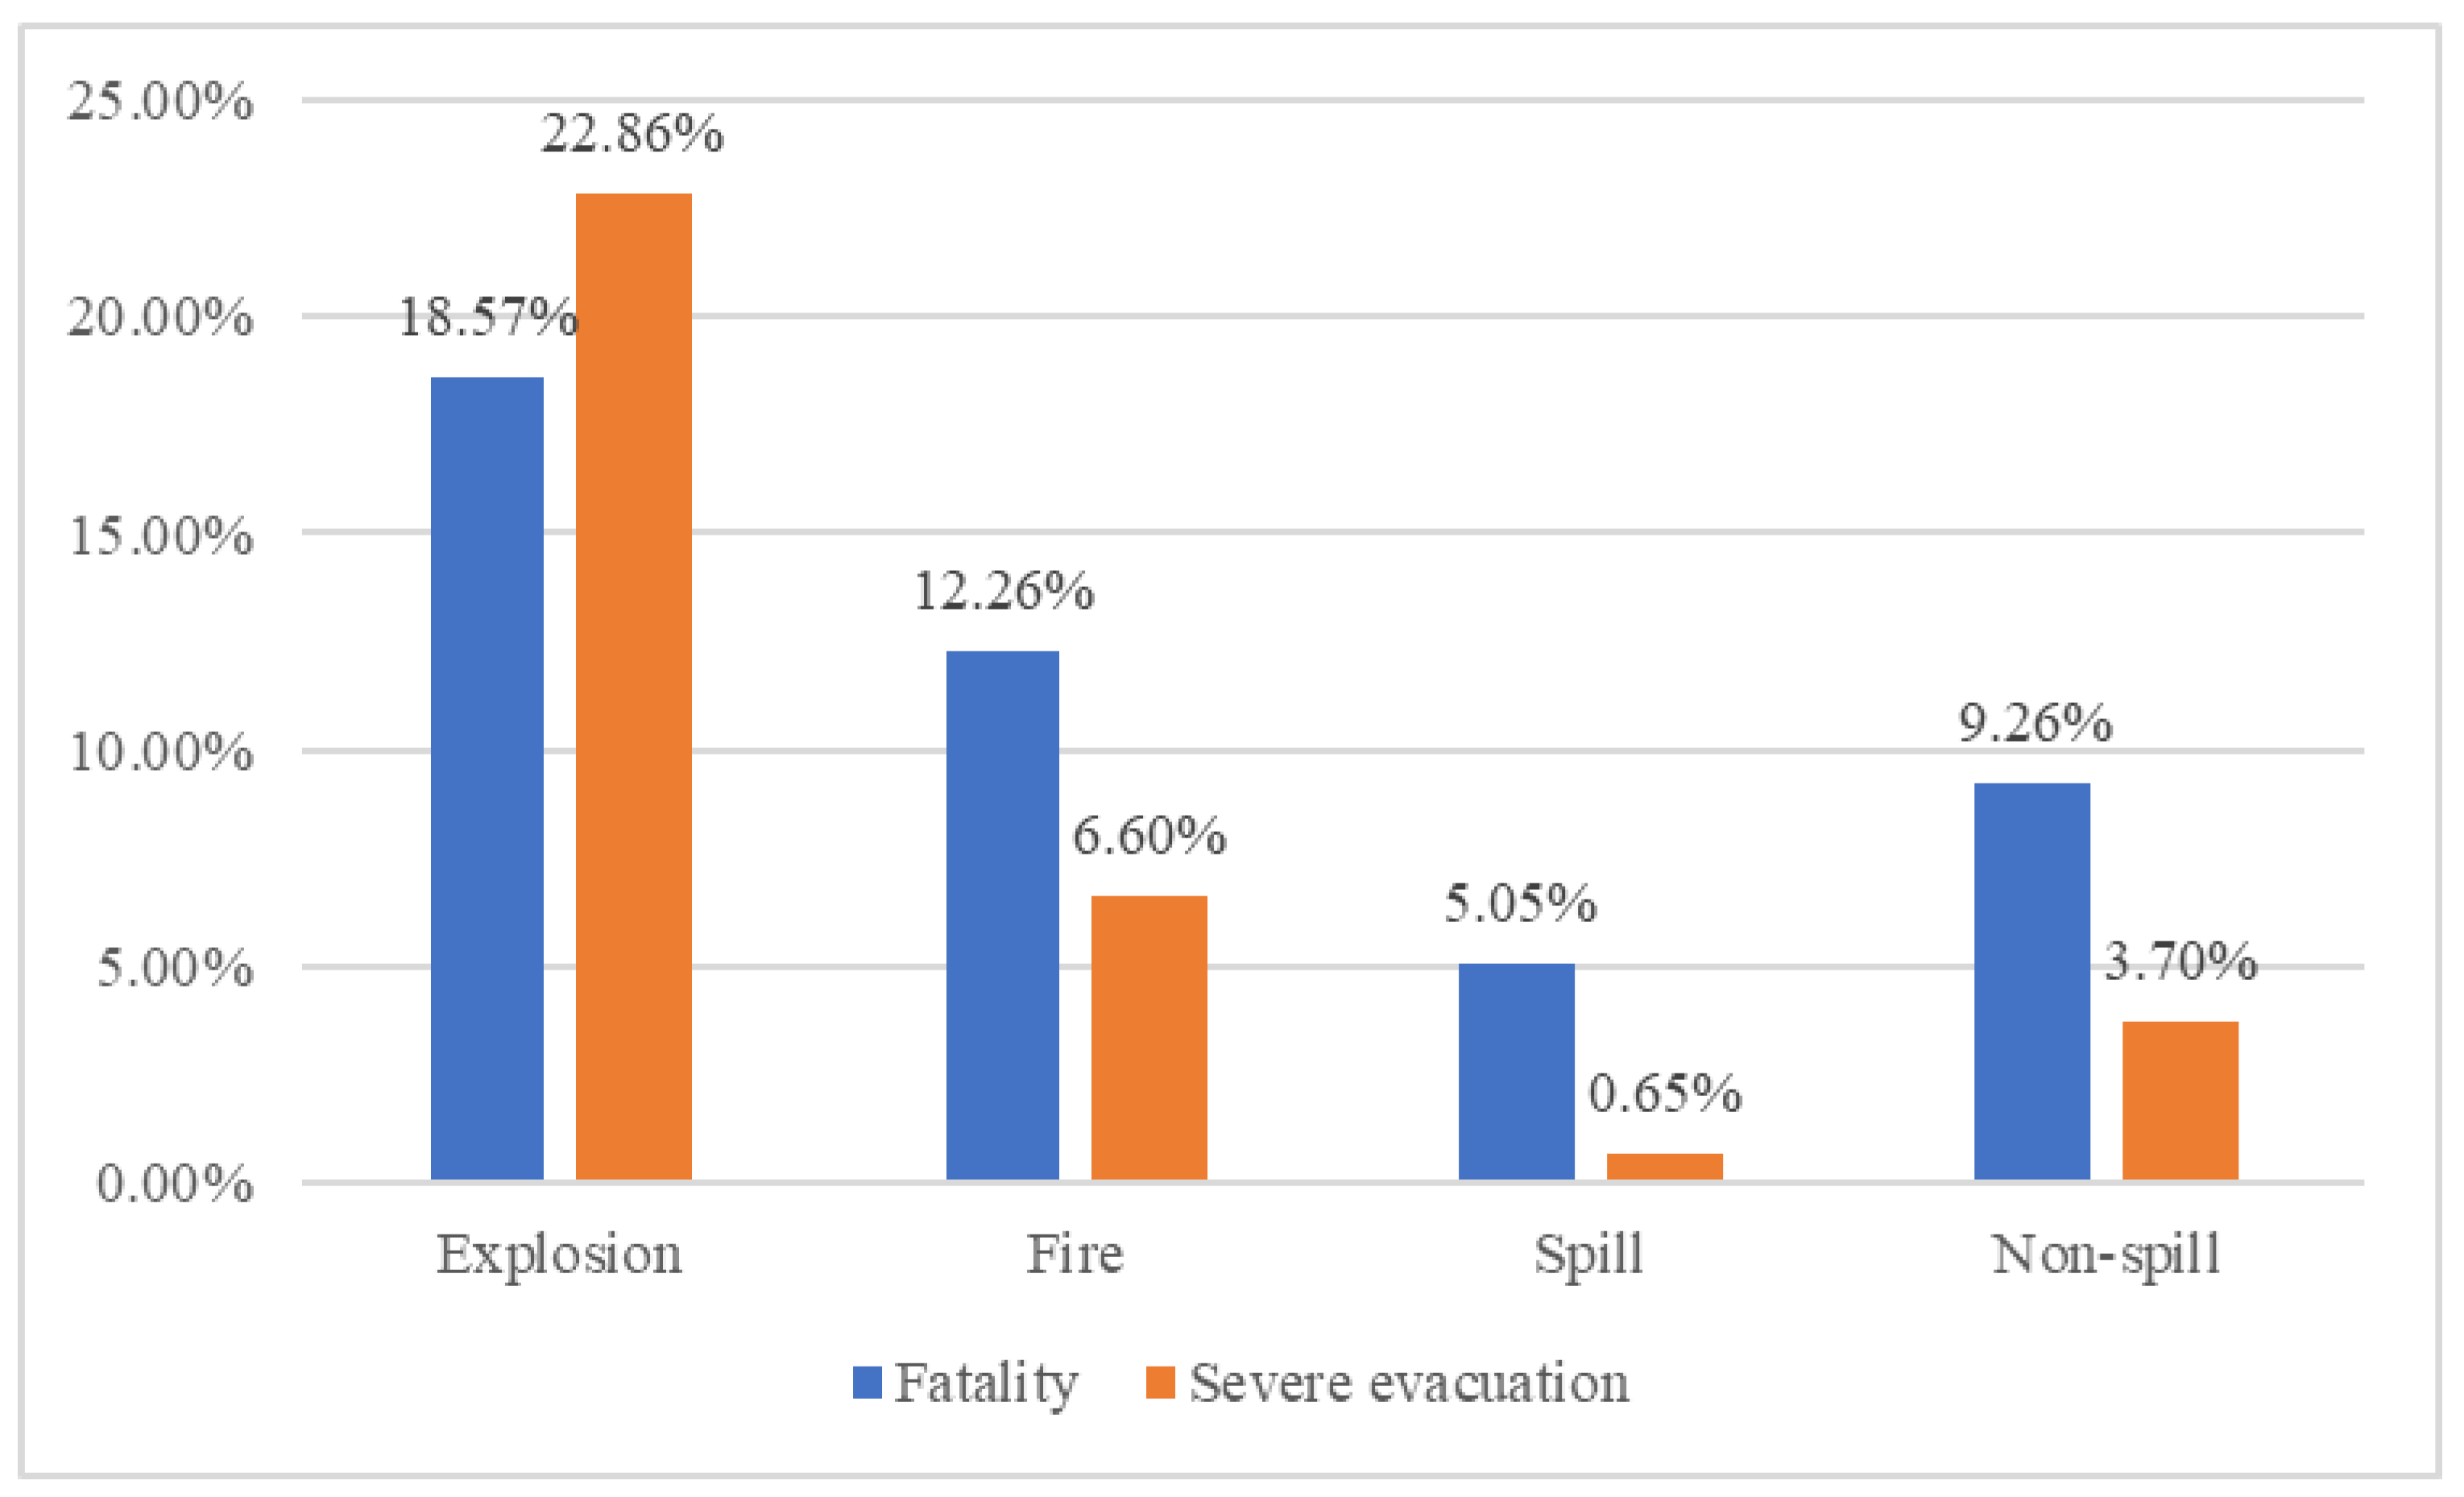
3.6. Accident Factors
4. Conclusions and Recommendation
Author Contributions
Funding
Acknowledgments
Conflicts of Interest
References
- U.S. Census Bureau 2015. Hazardous Materials: 2012 Commodity Flow Survey. Available online: http://www.census.gov/econ/cfs/2012/ec12tcf-us-hm.pdf (accessed on 5 January 2017).
- Cordeiro, F.G.; Bezerra, B.S.; Peixoto, A.S.P.; Ramos, R.A.R. Methodological aspects for modeling the environmental risk of transporting hazardous materials by road. Transp. Res. Part D Transp. Environ. 2016, 44, 105–121. [Google Scholar] [CrossRef]
- European Agreement Concerning the International Carriage of Dangerous Goods by Road (ADR), Drawn Up at Geneva on 30 September 1957; United Nations: New York, NY, USA; Geneva, France, 1975.
- Abkowitz, M.; Delorenzo, J.; Duych, R.; Greenberg, A.; Mcsweeney, T. Assessing the economic effect of incidents involving truck transport of hazardous materials. Transp. Res. Rec. J. Transp. Res. Board 2001, 1763, 125–129. [Google Scholar] [CrossRef]
- Wang, Z. Research on Safety Risk Identification and Evaluation Warning Problems at the Road Transport of Dangerous Goods; Chang’an University: Xi’an, China, 2015. [Google Scholar]
- Shorten, C.V.; Galloway, J.; Krebs, J.G.; Fleming, R.S. A 12-year history of hazardous materials incidents in Chester County, Pennsylvania. J. Hazard. Mater. 2002, 89, 29–40. [Google Scholar] [CrossRef]
- Zhao, L.J.; Wu, P.; Xu, K. Statistic analysis and countermeasures on dangerous chemical accidents in China. China Saf. Sci. J. (CSSJ) 2009, 7, 030. [Google Scholar]
- Oggero, A.; Darbra, R.M.; Munoz, M.; Planas, E.; Casal, J. A survey of accidents occurring during the transport of hazardous substances by road and rail. J. Hazard. Mater. 2006, 133, 1–7. [Google Scholar] [CrossRef] [PubMed]
- Vilchez, J.A.; Sevilla, S.; Montiel, H.; Casal, J. Historical analysis of accidents in chemical plants and in the transportation of hazardous materials. J. Loss Prev. Process. Ind. 1995, 8, 87–96. [Google Scholar] [CrossRef]
- Montiel, H.; Vilchez, J.A.; Arnaldos, J.; Casal, J. Historical analysis of accidents in the transportation of natural gas. J. Hazard. Mater. 1996, 51, 77–92. [Google Scholar] [CrossRef]
- Yang, J.; Li, F.; Zhou, J.; Zhang, L.; Huang, L.; Bi, J. A survey on hazardous materials accidents during road transport in China from 2000 to 2008. J. Hazard. Mater. 2010, 184, 647–653. [Google Scholar] [CrossRef]
- Shen, X.; Yan, Y.; Li, X.; Xie, C.; Wang, L. Analysis on tank truck accidents involved in road hazardous materials transportation in China. Traffic Inj. Prev. 2014, 15, 762–768. [Google Scholar] [CrossRef]
- Yao, H.; Zhang, T.; Liu, B.; Lu, F.; Fang, S.; You, Z. Analysis of surface water pollution accidents in China: Characteristics and lessons for risk management. Environ. Manag. 2016, 57, 868–878. [Google Scholar] [CrossRef]
- Uddin, M.; Huynh, N. Factors influencing injury severity of crashes involving HAZMAT trucks. Int. J. Transp. Sci. Technol. 2018, 7, 1–9. [Google Scholar] [CrossRef]
- Chen, F.; Chen, S. Injury severities of truck drivers in single-and multi-vehicle accidents on rural highways. Accid. Anal. Prev. 2011, 43, 1677–1688. [Google Scholar] [CrossRef] [PubMed]
- Zhao, L.; Wang, X.; Qian, Y. Analysis of factors that influence hazardous material transportation accidents based on Bayesian networks: A case study in China. Saf. Sci. 2012, 50, 1049–1055. [Google Scholar] [CrossRef]
- Zhu, T.; Zhao, L.J.; Wang, X.L. Analysis of the hazardous material transportation accidents based on the Bayesian network method. J. Saf. Environ. 2016, 16, 53–60. [Google Scholar]
- Ma, X.L.; Xing, Y.Y.; Lu, J. Causation analysis of hazardous material road transportation accidents by bayesian network using genie. J. Adv. Transp. 2018, 2018, 6248105. [Google Scholar] [CrossRef]
- Szeto, W.Y. Routing and scheduling hazardous material shipments: Nash game approach. Transp. B Transp. Dyn. 2013, 1, 237–260. [Google Scholar] [CrossRef]
- Talarico, L.; Reniers, G.; Sorensen, K.; Springael, J. MISTRAL: A game-theoretical model to allocate security measures in a multi-modal chemical transportation network with adaptive adversaries. Reliab. Eng. Syst. Saf. 2015, 138, 105–114. [Google Scholar] [CrossRef]
- Meng, Q.; Lee, D.H.; Cheu, R.L. Multiobjective vehicle routing and scheduling problem with time window constraints in hazardous material transportation. J. Transp. Eng. 2005, 131, 699–707. [Google Scholar] [CrossRef]
- Androutsopoulos, K.; Zografos, K. A bi-objective time-dependent vehicle routing and scheduling problem for hazardous materials distribution. Eur. J. Transp. Logist. 2012, 1, 157–183. [Google Scholar] [CrossRef]
- Wang, N.M.; Zhang, M.; Che, A.; Jiang, B. Bi-Objective Vehicle Routing for Hazardous Materials Transportation with No Vehicles Travelling in Echelon. IEEE Trans. Intell. Transp. Syst. 2018, 19, 1867–1879. [Google Scholar] [CrossRef]
- Bula, G.A.; Afsar, H.M.; González, F.A.; Prodhon, C.; Velasco, N. Bi-objective vehicle routing problem for hazardous materials transportation. J. Clean. Prod. 2019, 206, 976–986. [Google Scholar] [CrossRef]
- He, G.; Zhang, L.; Lu, Y.; Mol, A.P.J. Managing major chemical accidents in China: Towards effective risk information. J. Hazard. Mater. 2011, 187, 171–181. [Google Scholar] [CrossRef]
- Annual Development Report of Chinese Hazardous Chemicals Industry, 2016.12; Publication China Federation of Logistics and Purchasing Hazardous Chemicals Logistics Branch: Beijing, China, 2016.
- United Nations. UN Recommendation on the Transport of Dangerous Goods, Model Regulations; United Nations: New York, NY, USA, 2001. [Google Scholar]
- Jalayer, M.; Shabanpour, R.; Pour-Rouholamin, M.; Golshani, N.; Zhou, H. Wrong-way driving crashes: A random-parameters ordered probit analysis of injury severity. Accid. Anal. Prev. 2018, 117, 128–135. [Google Scholar] [CrossRef] [PubMed]
- Usman, T.; Fu, L.; Miranda-Moreno, L.F. Analysis of factors affecting winter collision severity. In Proceedings of the 92nd Annual Meeting of the Transportation Research Board, Washington, DC, USA, 13–17 January 2013. [Google Scholar]
- Islam, S.; Jones, S.L.; Dye, D. Comprehensive analysis of single-and multi-vehicle large truck at-fault crashes on rural and urban roadways in Alabama. Accid. Anal. Prev. 2014, 67, 148–158. [Google Scholar] [CrossRef] [PubMed]
- Duncan, C.S.; Khattak, A.J.; Council, F.M. Applying the ordered probit model to injury severity in truck-passenger car rear-end collisions. Transp. Res. Rec. 1998, 1635, 63–71. [Google Scholar] [CrossRef]
- Kockelman, K.M.; Kweon, Y.J. Driver injury severity: An application of ordered probit models. Accid. Anal. Prev. 2002, 34, 313–321. [Google Scholar] [CrossRef] [Green Version]
- Quddus, M.A.; Wang, C.; Ison, S. Impact of Road Traffic Congestion on Crash Severity Using Ordered Response Models. In Proceedings of the 88th Annual Meeting of the Transportation Research Board, Washington, DC, USA, 11–15 January 2009. [Google Scholar]
- Greene, W.H. Econometric Analysis, 4th ed.; Prentice Hall: Upper Saddle River, NJ, USA, 2000. [Google Scholar]
- Halton, J.H. On the efficiency of certain quasi-random sequences of points in evaluating multi-dimensional integrals. Numer. Math. 1960, 2, 84–90. [Google Scholar] [CrossRef]
- Bhat, C.R. Simulation estimation of mixed discrete choice models using randomized and scrambled Halton sequences. Transp. Res. Part B Methodol. 2003, 37, 837–855. [Google Scholar] [CrossRef] [Green Version]
- Train, K. Halton Sequences for Mixed Logit; University of California: Berkley, CA, USA, 2000. [Google Scholar]
- Milton, J.C.; Shankar, V.N.; Mannering, F.L. Highway accident severities and the mixed logit model: An exploratory empirical analysis. Accid. Anal. Prev. 2008, 40, 260–266. [Google Scholar] [CrossRef]
- Christoforou, Z.; Cohen, S.; Karlaftis, M.G. Vehicle occupant injury severity on highways: An empirical investigation. Accid. Anal. Prev. 2010, 42, 1606–1620. [Google Scholar] [CrossRef]
- Ma, Z.; Zhang, H.; Chien, S.I.; Wang, J.; Dong, C. Predicting expressway crash frequency using a random effect negative binomial model: A case study in china. Accid. Anal. Prev. 2017, 98, 214–222. [Google Scholar] [CrossRef] [PubMed]
- Carol, S.; Vilchez, J.A.; Casal, J. Study of the severity of industrial accidents with hazardous substances by historical analysis. J. Loss Prev. Process Ind. 2002, 15, 517–524. [Google Scholar] [CrossRef]
- Wu, Z.Z.; Ren, C.X.; Duo, Y.Q. Risk Assessment Method for Road Transport Accident of Dangerous Goods; Chemical Industry Press: Beijing, China, 2014. [Google Scholar]
- Zheng, Z.; Lu, P.; Lantz, B. Commercial truck crash injury severity analysis using gradient boosting data mining model. J. Saf. Res. 2018, 65, 115–124. [Google Scholar] [CrossRef] [PubMed]
- Fridstrøm, L.; Ingebrigtsen, S. An aggregate accident model based on pooled, regional time-series data. Accid. Anal. Prev. 1991, 23, 363–378. [Google Scholar] [CrossRef]
- Zhang, G.; Yau, K.K.W.; Zhang, X.; Li, Y. Traffic accidents involving driver fatigue and their extent of casualties. Accid. Anal. Prev. 2016, 87, 34–42. [Google Scholar] [CrossRef]
- Dissanayake, S.; Lu, J. Factors influential in making an injury severity difference to older drivers involved in fixed object–passenger car crashes. Accid. Anal. Prev. 2002, 34, 609–618. [Google Scholar] [CrossRef]
- Boufous, S.; Finch, C.; Hayen, A.; Williamson, A. The impact of environmental, vehicle and driver characteristics on injury severity in older drivers hospitalized as a result of a traffic crash. J. Saf. Res. 2008, 39, 65–72. [Google Scholar] [CrossRef] [Green Version]
- Abegaz, T.; Berhane, Y.; Worku, A.; Assrat, A.; Assefa, A. Effects of excessive speeding and falling asleep while driving on crash injury severity in Ethiop.: A generalized ordered logit model analysis. Accid. Anal. Prev. 2014, 71, 15–21. [Google Scholar] [CrossRef]
- Chirachavala, T.; Cleveland, D.E.; Kostyniuk, L.P. Severity of large-truck and combination-vehicle accidents in over-the-road service: A discrete multivariate analysis. Transp. Res. Rec. 1984, 975, 23–36. [Google Scholar]
- Annual Development Report of Chinese Hazardous Chemicals Industry, 2017.12; Publication China Federation of Logistics and Purchasing Hazardous Chemicals Logistics Branch: Beijing, China, 2017.
- Chen, C.; Zhang, G.; Liu, X.C.; Ci, Y.S.; Huang, H.L.; Ma, J.M.; Chen, Y.Y.; Guan, H.Z. Driver injury severity outcome analysis in rural interstate highway crashes: A two-level Bayesian logistic regression interpretation. Accid. Anal. Prev. 2016, 97, 69–78. [Google Scholar] [CrossRef]
- Naik, B.; Tung, L.W.; Zhao, S.; Khattak, A.J. Weather impacts on single-vehicle truck crash injury severity. J. Saf. Res. 2016, 58, 57–65. [Google Scholar] [CrossRef]
- Chang, L.Y. Analysis of freeway accident frequencies: Negative binomial regression versus artificial neural network. Saf. Sci. 2005, 43, 541–557. [Google Scholar] [CrossRef]
- Fu, R.; Guo, Y.; Yuan, W.; Feng, H.; Ma, Y. The correlation between gradients of descending roads and accident rates. Saf. Sci. 2011, 49, 416–423. [Google Scholar] [CrossRef]
- Park, J.; Abdel-Aty, M.; Wang, J.H. Time series trends of the safety effects of pavement resurfacing. Accid. Anal. Prev. 2017, 101, 78–86. [Google Scholar] [CrossRef]
- Islam, M.; Hernandez, S. Modeling injury outcomes of crashes involving heavy vehicles on Texas highways. J. Transp. Res. Rec. 2013, 2388, 28–36. [Google Scholar] [CrossRef] [Green Version]
- Wu, Q.; Chen, F.; Zhang, G.; Liu, X.C.; Wang, H.; Bogus, S.M. Mixed logit model-based driver injury severity investigations in single- and multi-vehicle crashes on rural two-lane highways. Accid. Anal. Prev. 2014, 72, 105–115. [Google Scholar] [CrossRef] [PubMed]
- Islam, S.; Hossain, A.B.; Barnett, T. Comprehensive injury severity analysis of SUV and pickup truck rollover crashes: Alabama case study. J. Transp. Res. Rec. 2016, 2601, 1–9. [Google Scholar] [CrossRef]
- Islam, M.; Hernandez, S. Large truck–involved crashes: Exploratory injury severity analysis. J. Transp. Eng. 2013, 139, 596–604. [Google Scholar] [CrossRef] [Green Version]
- Zhang, H.D.; Zheng, X.P. Characteristics of hazardous chemical accidents in China: A statistical investigation. J. Loss Prev. Process Ind. 2012, 25, 686–693. [Google Scholar] [CrossRef]
- Pahukula, J.; Hernandez, S.; Unnikrishnan, A. A time of day analysis of crashes involving large trucks in urban areas. Accid. Anal. Prev. 2015, 75, 155–163. [Google Scholar] [CrossRef]
- Laman, H.A. Comprehensive Severity Analysis of Large Vehicle Crashes; University of Central Florida: Orlando, FL, USA, 2012. [Google Scholar]
- Shinstine, D.S.; Wulff, S.S.; Ksaibati, K. Factors associated with crash severity on rural roadways in Wyoming. J. Traffic Transp. Eng. 2016, 3, 308–323. [Google Scholar] [CrossRef] [Green Version]
- de Oña, J.; Mujalli, R.O.; Calvo, F.J. Analysis of traffic accident injury severity on Spanish rural highways using Bayesian networks. Accid. Anal. Prev. 2011, 43, 402–411. [Google Scholar] [CrossRef] [PubMed]
- Wu, Q.; Zhang, G.; Chen, C.; Tarefder, R.; Wang, H.; Wei, H. Heterogeneous impacts of gender-interpreted contributing factors on driver injury severities in single-vehicle rollover crashes. Accid. Anal. Prev. 2016, 94, 28–34. [Google Scholar] [CrossRef] [PubMed]
- Chen, C.; Zhang, G.; Qian, Z.; Tarefder, R.A.; Tian, Z. Investigating driver injury severity patterns in rollover crashes using support vector machine models. Accid. Anal. Prev. 2016, 90, 128–139. [Google Scholar] [CrossRef] [PubMed]
- Garrido, R.A.; Bronfman, A.C. Equity and social acceptability in multiple hazardous materials routing through urban areas. Transp. Res. Part A Policy Pract. 2017, 102, 244–260. [Google Scholar] [CrossRef]


| Factors | Variables | Description | Count (Proportion) |
|---|---|---|---|
| Hazmat factors | Type of Hazmat | Explosives | 24 (1.4%) |
| Gases | 248 (14.4%) | ||
| Flammable liquids | 910 (52.9%) | ||
| Flammable solids | 26 (1.5%) | ||
| Oxidizers and organic peroxides | 13 (0.8%) | ||
| Poison | 57 (3.3%) | ||
| Corrosives | 245 (14.2%) | ||
| Others | 198 (11.5%) | ||
| Quantity of Hazmat | <10 tons | 526 (30.6%) | |
| 10–24 tons | 436 (25.3%) | ||
| 24–39 | 641 (37.2%) | ||
| ≥40 tons | 118 (6.9%) | ||
| Driver factors | Misoperation | No | 1593 (92.6%) |
| Yes | 128 (7.4%) | ||
| Driver fatigue | No | 1678 (97.5%) | |
| Yes | 43 (2.5%) | ||
| Speeding | No | 1652 (96.0%) | |
| Yes | 69 (4.0%) | ||
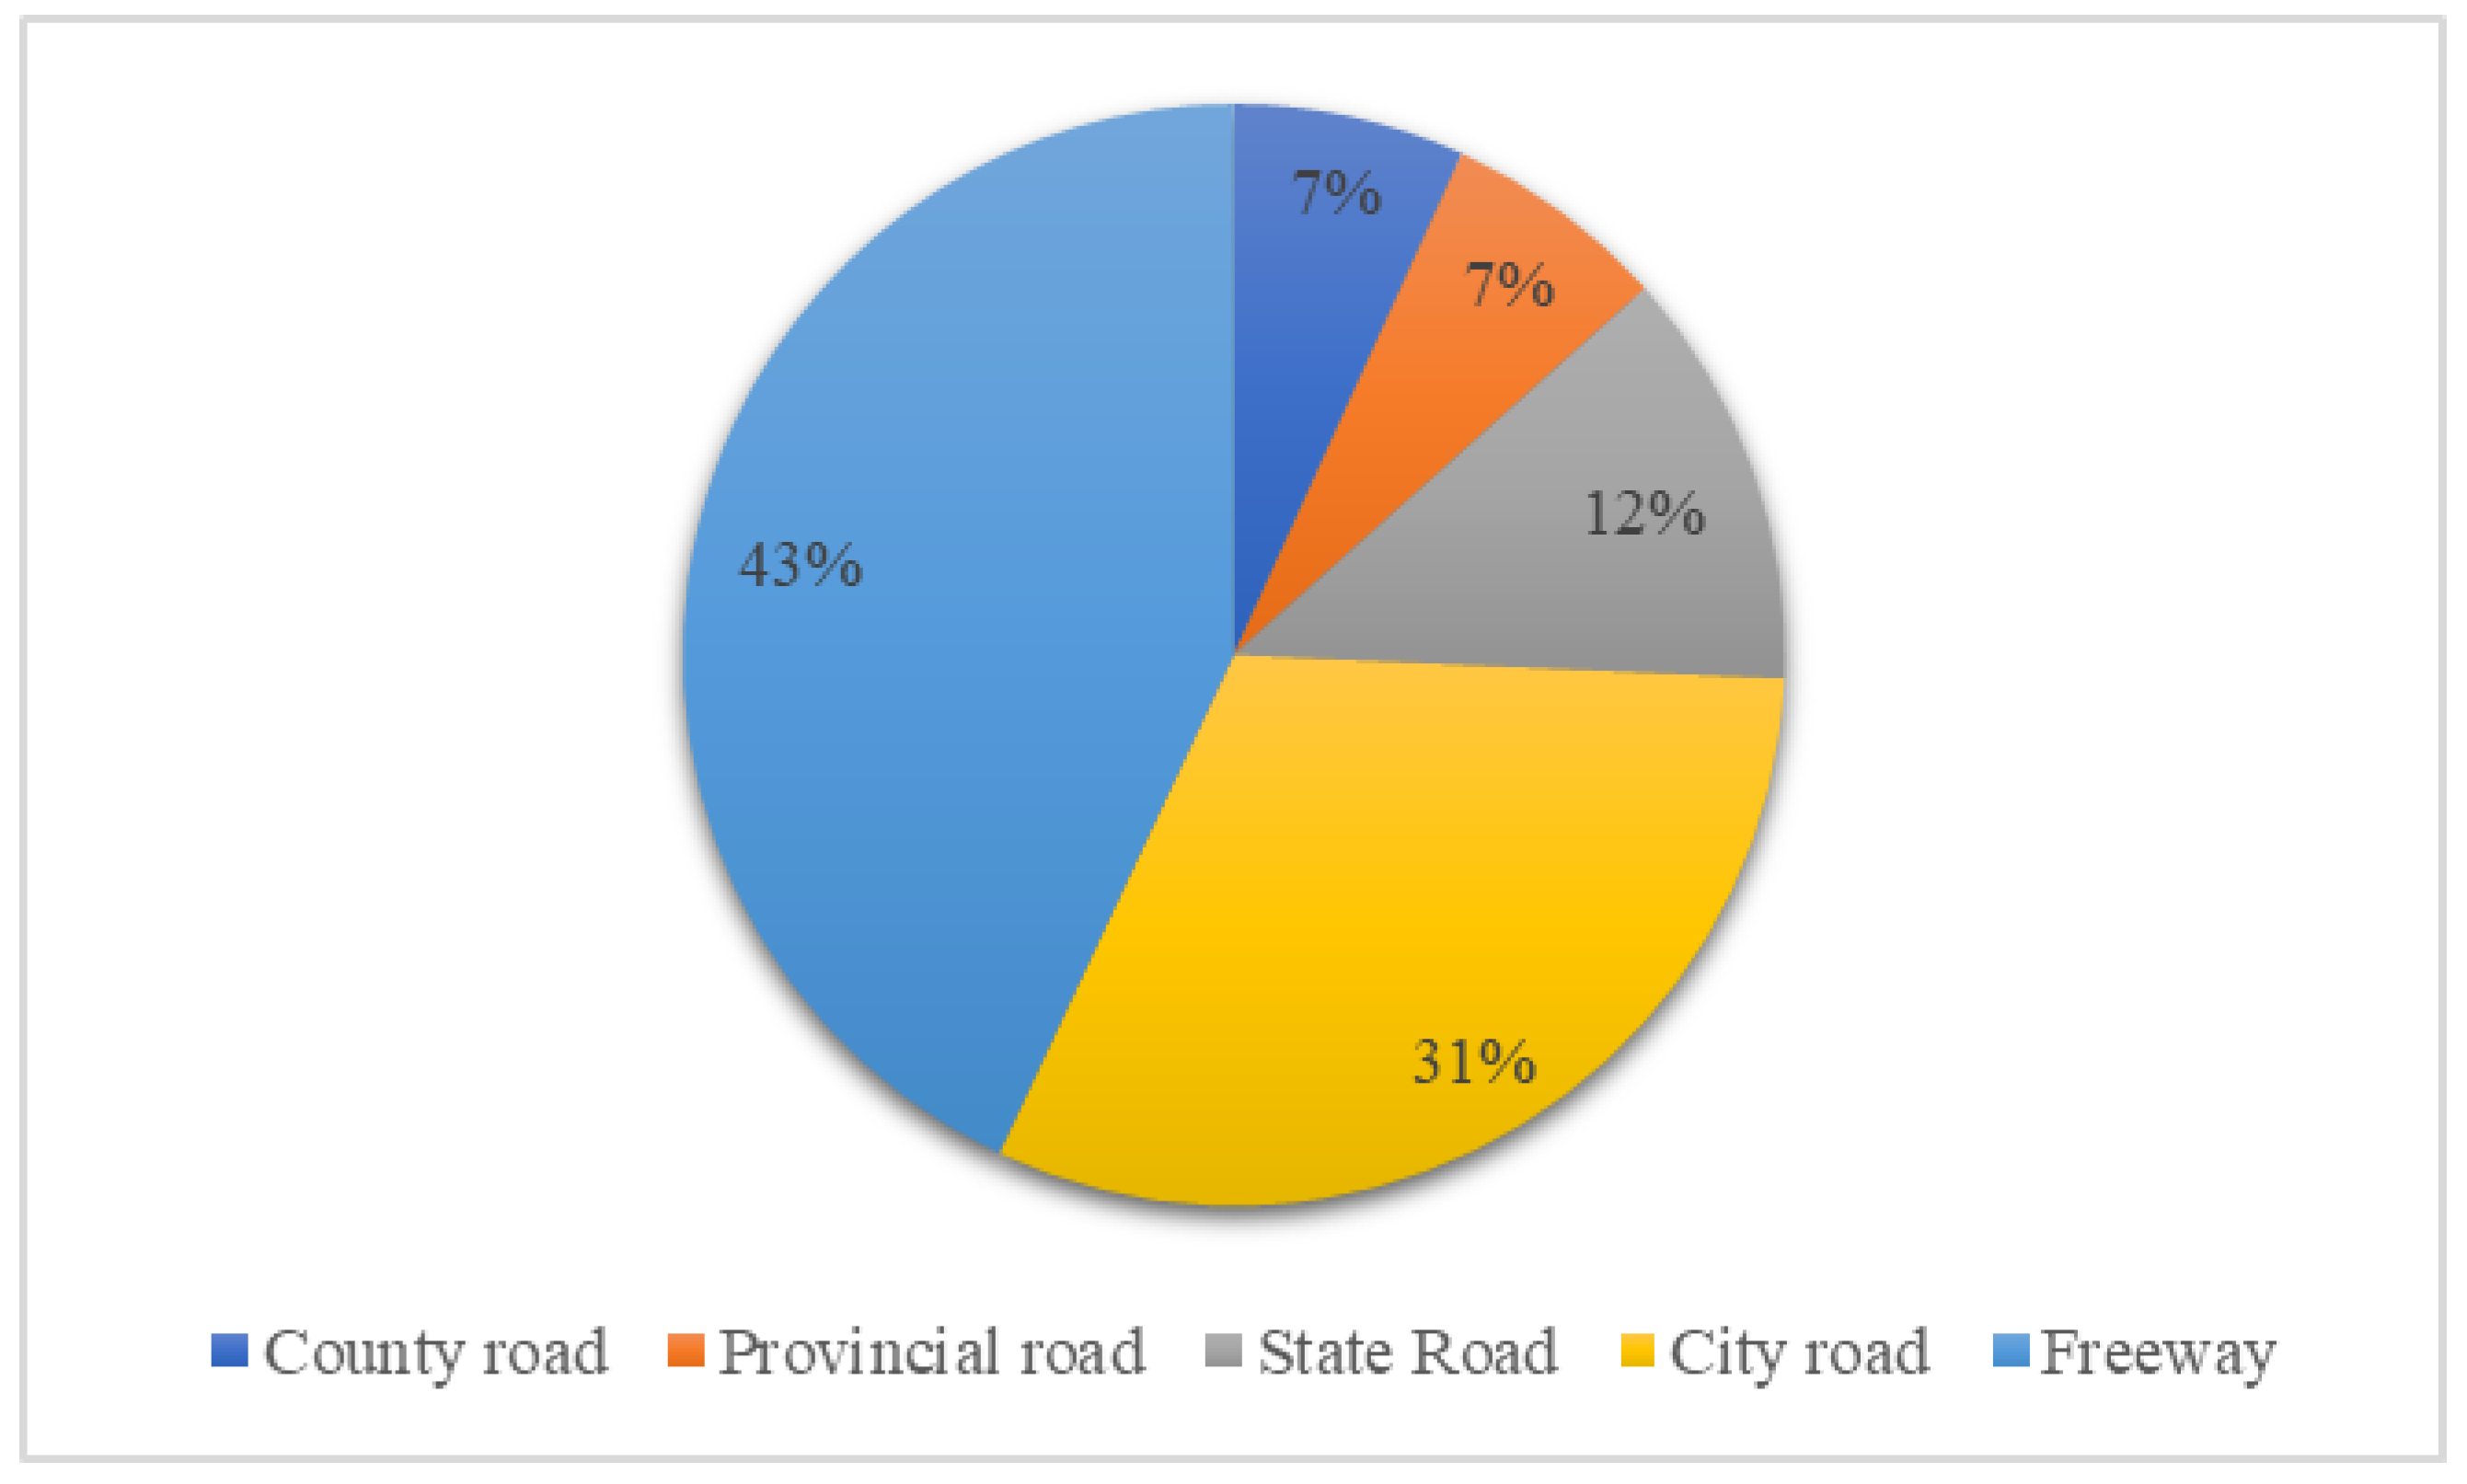
| Location factors | Road types | County road | 117 (6.8%) |
| Provincial road | 114 (6.6%) | ||
| State Road | 211 (12.3%) | ||
| City road | 539 (31.3%) | ||
| Freeway | 740 (43.0%) | ||
| Road surface | Dry | 1380 (80.2%) | |
| Wet | 341 (19.8%) | ||
| Tunnel | No | 1648 (95.8%) | |
| Yes | 73 (4.2%) | ||
| Ramp | No | 1687 (98%) | |
| Yes | 34 (2.0%) | ||
| Curve | No | 1655 (96.2%) | |
| Yes | 66 (3.8%) | ||
| Slope | No | 1664 (96.7%) | |
| Yes | 57 (3.3%) | ||
| Environment factors | Seasons | Winter | 480 (27.9%) |
| Summer | 501 (29.1%) | ||
| Autumn | 392 (22.8%) | ||
| Spring | 348 (20.2%) | ||
| Weekly distribution | Weekend | 1314 (76.4%) | |
| Weekday | 407 (23.6%) | ||
| Accidents occurred at holidays | No | 1660 (96.5%) | |
| Yes | 61 (3.5%) | ||
| Lighting intensity | Dark | 524 (30.4%) | |
| Daytime | 874 (50.8%) | ||
| Dusk | 124 (7.2%) | ||
| Dawn | 199 (11.6%) | ||
| Weather | Sunny | 424 (24.6%) | |
| Cloudy | 747 (43.4%) | ||
| Rainy, fog and snow | 550 (32.0%) | ||
| Vehicle factors | Number of vehicles | 1 | 1028 (59.7%) |
| 2 | 571 (33.2%) | ||
| 3 | 60 (3.5%) | ||
| ≥4 | 62 (3.6%) | ||
| Vehicle types | Hazardous trucks | 961 (55.8%) | |
| Hazardous truck and truck | 586 (34.0%) | ||
| Private car & Truck | 110 (6.4%) | ||
| Non-motor & Truck | 29 (1.7%) | ||
| Bus & Private car & Truck | 11 (0.6%) | ||
| Bus & Truck | 24 (1.39%) | ||
| Accidents factors | Type of accidents | Rear-end | 395 (23.0%) |
| Sideswipe | 31 (1.8%) | ||
| Rollover | 636 (37.06%) | ||
| Head on collision | 295 (17.1%) | ||
| Vehicle failure | 364 (21.2%) | ||
| Accident consequence | Explosion | 55 (3.2%) | |
| Fire | 204 (11.9%) | ||
| Spill | 1170 (68.0%) | ||
| Non-spill | 292 (17.0%) |
| Model Fit Statistics | RPOP (Injury) | FPOP (Injury) | RPOP (Evacuation) | FPOP (Evacuation) |
|---|---|---|---|---|
| Log likelihood | −1317.71 | −1377.61 | −966.97 | −1013.57 |
| AIC | 2821.42 | 2941.22 | 2119.94 | 2213.14 |
| BIC | 3320.88 | 3440.68 | 2619.40 | 2712.60 |
| Pseudo R-square | 0.12 | 0.08 | 0.17 | 0.13 |
| Injury | Evacuation | ||||
|---|---|---|---|---|---|
| Parameter Estimate | z-Statics | Parameter Estimate | z−Statics | ||
| Constant | −1.26 ** | −2.49 | −1.13 * | −1.95 | |
| Threshold u1 | 0.28 *** | 10.66 | 0.68 *** | 12.68 | |
| Threshold u2 | 1.12 *** | 17.04 | 1.43 *** | 12.62 | |
| Hazmat factors | Type of Hazmat (Reference: Flammable Liquids) | ||||
| Gases | 0.02 (0.40 ***) | 0.22 (3.45) | 0.47 *** (0.26 **) | 4.71 (2.41) | |
| Explosives | 1.39 *** | 4.07 | 1.66 *** | 6.68 | |
| Poisons | 0.03 (0.44 *) | 0.16 (1.95) | 0.32 *(0.72 ***) | 1.6 (2.65) | |
| Corrosives | −0.18 * (0.34 ***) | −1.68 (3.13) | −0.13 (0.72 ***) | −1.09 (4.74) | |
| Others | −0.29 ** | −2.05 | −−− | −−− | |
| Quantity of Hazmat (Reference:<10) | |||||
| 25−39 | −−− | −−− | 0.15 ** | 2.01 | |
| ≥40 | −−− | −−− | 0.23 ** | 2.45 | |
| Driver factors | Misoperation (Reference: No) | ||||
| Yes | 0.37 ***(0.25 ***) | 3.00 (7.61) | 0.05 (0.07 **) | 0.32 (2.21) | |
| Driver fatigue (Reference: No) | |||||
| Yes | 0.63 *** | 2.91 | −−− | −−− | |
| Speeding (Reference: No) | |||||
| Yes | 0.33 * | 1.69 | −−− | −−− | |
| Location factors | Road Types (Reference: County Road) | ||||
| Provincial road | −−− | −−− | −−− | −−− | |
| State Road | −−− | −−− | −−− | −−− | |
| City road | −−− | −−− | −−− | −−− | |
| Freeway | −0.04 (1.22 ***) | 0.27 (7.18) | −0.32 ** (0.66 ***) | 2.08 (4.02) | |
| Road Surface (Reference: Dry) | |||||
| Wet | −0.20 (0.18 **) | 1.85 (2.07) | −0.31 *** (0.38 ***) | 2.67 (3.74) | |
| Tunnel (Reference: No) | |||||
| Yes | 0.91 *** | 3.89 | −−− | −−− | |
| Grade (Reference: No) | |||||
| Yes | 0.52 *** | 2.82 | −−− | −−− | |
| Environment factors | Seasons (Reference: Winter) | ||||
| Autumn | −0.20 * | −1.74 | −−− | −−− | |
| Spring | −0.22 ** | −2.08 | −−− | −−− | |
| Weekly Distribution (Reference: Weekends) | |||||
| Weekdays | −−− | −−− | 0.14 * | 1.53 | |
| Lighting Intensity (Reference: Dark) | |||||
| Dusk | −0.39 ** | −2.22 | 0.28 ** | 1.97 | |
| Vehicle factors | Number of Vehicles (Reference:1) | ||||
| 3 | 0.64 *** | 2.93 | −−− | −−− | |
| ≥4 | 0.66 *** | 2.90 | −−− | −−− | |
| Accidents factors | Type of Accidents (Reference: Rear−End) | ||||
| Sideswipe | −0.74 * | −1.94 | −−− | −−− | |
| Vehicle failure | −0.76 *** | −3.81 | −−− | −−− | |
| Accident Consequence (Reference: Explosion) | |||||
| Fire | −0.68 *** | −3.31 | −0.49 *** | −2.63 | |
| Spill | −0.87 *** (0.88 ***) | −4.90 (6.32) | −0.64 *** (0.58 ***) | 3.90 * (2.91) | |
| Non−spill | −0.68 *** (0.49 **) | −2.61 (2.1) | −0.74 *** (1.50 ***) | −2.66 (8.33) | |
| Injury | Evacuation | ||||||||
|---|---|---|---|---|---|---|---|---|---|
| No Injury | Minor Injury | Severe Injury | Fatality | No Evacuation | Minor Evacuation | General Evacuation | Severe Evacuation | ||
| Type of Hazmat (Reference: Flammable Liquids) | |||||||||
| Hazmat factors | Gases | −0.022 | 0.005 | 0.012 | 0.005 | −0.143 | 0.080 | 0.048 | 0.015 |
| Explosives | −0.511 | −0.007 | 0.016 | 0.006 | −0.091 | 0.052 | 0.030 | 0.009 | |
| Poisons | −0.019 | 0.004 | 0.010 | 0.004 | −0.043 | 0.025 | 0.013 | 0.004 | |
| Corrosives | 0.056 | −0.011 | −0.031 | −0.014 | 0.061 | −0.039 | −0.017 | −0.004 | |
| Others | 0.081 | −0.019 | −0.045 | −0.017 | −−− | −−− | −−− | −−− | |
| Quantity of Hazmat (Reference: <10 tons) | |||||||||
| 25−39 | −−− | −−− | −−− | −−− | −0.035 | 0.019 | 0.010 | 0.002 | |
| ≥40 | −−− | −−− | −−− | −−− | −0.056 | 0.025 | 0.017 | 0.006 | |
| Driver factors | Misoperation (Reference: No) | ||||||||
| Yes | −0.113 | 0.024 | 0.062 | 0.026 | −0.838 | 0.005 | 0.003 | 0.001 | |
| Driver fatigue (Reference: No) | |||||||||
| Yes | −0.191 | 0.042 | 0.105 | 0.045 | −−− | −−− | −−− | −−− | |
| Speeding (Reference: No) | |||||||||
| Yes | −0.100 | 0.022 | 0.055 | 0.023 | −−− | −−− | −−− | −−− | |
| Location factors | Road Types (Reference: County Road) | ||||||||
| Provincial road | −−− | −−− | −−− | −−− | −−− | −−− | −−− | −−− | |
| State Road | −−− | −−− | −−− | −−− | −−− | −−− | −−− | −−− | |
| City road | −−− | −−− | −−− | −−− | −−− | −−− | −−− | −−− | |
| Freeway | 0.029 | −0.018 | −0.009 | −0.022 | 0.059 | −0.037 | −0.018 | −0.004 | |
| Road Surface (Reference: Dry) | |||||||||
| Wet | 0.044 | −0.010 | −0.024 | −0.010 | 0.067 | −0.042 | −0.020 | −0.005 | |
| Tunnel (Reference: No) | |||||||||
| Yes | −0.332 | 0.038 | 0.163 | 0.132 | −−− | −−− | −−− | −−− | |
| Slope (Reference: No) | |||||||||
| Yes | −0.183 | 0.029 | 0.096 | 0.058 | −−− | −−− | −−− | −−− | |
| Environment factors | Seasons (Reference: Winter) | ||||||||
| Autumn | 0.057 | −0.013 | −0.031 | −0.013 | −−− | −−− | −−− | −−− | |
| Spring | 0.064 | −0.015 | −0.035 | −0.014 | −−− | −−− | −−− | −−− | |
| Weekly Distribution (Reference: Weekends) | |||||||||
| Weekdays | −−− | −−− | −−− | −−− | −0.850 | 0.088 | 0.044 | 0.019 | |
| Lighting Intensity (Reference: Dark) | |||||||||
| Dusk | 0.004 | −0.026 | −0.057 | −0.020 | −0.015 | 0.049 | 0.028 | 0.008 | |
| Vehicle factors | Number of Vehicles (Reference:1) | ||||||||
| 3 | −0.020 | 0.033 | 0.117 | 0.076 | −−− | −−− | −−− | −−− | |
| ≥4 | −0.234 | 0.034 | 0.121 | 0.080 | −−− | −−− | −−− | −−− | |
| Accidents factors | Type of Accidents (Reference: Rear−End) | ||||||||
| Sideswipe | 0.045 | −0.045 | −0.089 | −0.027 | −−− | −−− | −−− | −−− | |
| Vehicle failure | 0.189 | −0.048 | −0.104 | −0.037 | −−− | −−− | −−− | −−− | |
| Accident Consequence (Reference: Explosion) | |||||||||
| Fire | 0.154 | −0.001 | −0.090 | −0.031 | 0.135 | −0.073 | −0.030 | −0.007 | |
| Spill | 0.164 | −0.026 | −0.156 | −0.102 | 0.109 | −0.098 | −0.060 | −0.020 | |
| Non−spill | 0.303 | −0.002 | −0.085 | −0.027 | 0.178 | −0.095 | −0.034 | −0.007 | |
© 2020 by the authors. Licensee MDPI, Basel, Switzerland. This article is an open access article distributed under the terms and conditions of the Creative Commons Attribution (CC BY) license (http://creativecommons.org/licenses/by/4.0/).
Share and Cite
Xing, Y.; Chen, S.; Zhu, S.; Zhang, Y.; Lu, J. Exploring Risk Factors Contributing to the Severity of Hazardous Material Transportation Accidents in China. Int. J. Environ. Res. Public Health 2020, 17, 1344. https://doi.org/10.3390/ijerph17041344
Xing Y, Chen S, Zhu S, Zhang Y, Lu J. Exploring Risk Factors Contributing to the Severity of Hazardous Material Transportation Accidents in China. International Journal of Environmental Research and Public Health. 2020; 17(4):1344. https://doi.org/10.3390/ijerph17041344
Chicago/Turabian StyleXing, Yingying, Shengdi Chen, Shengxue Zhu, Yi Zhang, and Jian Lu. 2020. "Exploring Risk Factors Contributing to the Severity of Hazardous Material Transportation Accidents in China" International Journal of Environmental Research and Public Health 17, no. 4: 1344. https://doi.org/10.3390/ijerph17041344