Article

Risk Assessment and Implications of Schoolchildren Exposure to Classroom Heavy Metals Particles in Jeddah, Saudi Arabia

by
Mansour A. Alghamdi
1,*,
Salwa K. Hassan
2,
Noura A. Alzahrani
3,
Fahd M. Almehmadi
1 and
Mamdouh I. Khoder
1
1
Department of Environmental Sciences, Faculty of Meteorology, Environment and Arid Land Agriculture, King Abdulaziz University, P.O. Box 80208, Jeddah 21589, Saudi Arabia
2
Air Pollution Department, National Research Centre, El Behooth Str., Dokki, Giza 12622, Egypt
3
Office of Education/South Jeddah (Girls), Department of Primary Grades, Ministry of Education, Jeddah 23524, Saudi Arabia
*
Author to whom correspondence should be addressed.
Int. J. Environ. Res. Public Health 2019, 16(24), 5017; https://doi.org/10.3390/ijerph16245017
Submission received: 30 October 2019 / Revised: 26 November 2019 / Accepted: 6 December 2019 / Published: 10 December 2019
(This article belongs to the Section Children's Health)

Abstract

:
Classrooms Air Conditioner Filter (CACF) particles represent all of the exposed particles that have migrated to the interior environment. This study was conducted to assess the heavy metals contamination in CACF particles from Jeddah primary schools located in urban, suburban and residential areas; and to evaluate their health risks of children exposure (non-carcinogenic and carcinogenic). Heavy metals levels in CACF particles of schools were in the following order: urban schools > suburban schools > residential schools. Fe, Mn and Zn were the dominant species. Geo-accumulation index (Igeo), contamination factor (CF) and pollution load index (PLI) values indicated that the contamination levels was in the following order Cd > Pb > Zn > As > Cu > Ni > Mn > Cr > Co >V > Fe. School CACF particles was moderately contaminated with As and Zn and moderately to heavily contaminated with Pb and Cd. Enrichment factors (EFs) indicated that Zn, Cd, Pb, As and Cu in CACF particles were severe enriched. The hazard quotient (HQs) and hazards index (HI) values for heavy metals were lower than the acceptable level of one. As, Pb, Cr and Mn were exhibited high non-cancer effects for children. The lifetime cancer risk (LCR) and total lifetime cancer risk (TLCR), HQs and HI values for the different exposure pathways of heavy metals decreased in the following order: ingestion > dermal contact > inhalation. Carcinogenic and non-carcinogenic risk rank order of schools were urban schools > suburban schools > residential schools. The LCR and TLCR of heavy metals was in the following order: Co > Ni >Cr > Cd > As > Pb. The ingestion lifetime cancer risk (LCRing) and TLCR values from exposure to Ni and Cr in urban and suburban schools, Cd in urban schools, and Co in all Jeddah schools only exceed the acceptable range (1 × 10⁻⁶–1 × 10⁻⁴) Only LCRing and TLCR values from exposure to ∑ carcinogens exceed the acceptable level.

1. Introduction

Air conditioning (AC) is widely used as an effective mean to control the heat and to keep the indoor air quality within safe levels, since air pollutants such as particulate matter can be captured on the AC filter [1]. These deposited particles refer to the particles that settle on the AC filter during air current impact; their particle size is assumed to be less than 100 µm [2]. On the other hand, AC filter particles can considered as a source of particles, organic and inorganic contamination that was deposited on these filters [3]. Particles on an AC filter can be resuspended and adhere onto interior surfaces, and then building occupants, including children, can be exposed to ingest them [4]. Therefore, particles that accumulate on the AC filter will represent all of the exposed particles that have migrated to the interior environment, including suspended and resuspended settled particles during occupant activities. Skin, hair, smoking, cooking and heating emissions, construction and building materials, clothing, furnishing and other materials found in building interiors are the interior particulate sources [5,6], whereas the particulates that penetrate through doors, ventilation system, windows and AC filters for fresh air are considered the exterior particulate sources [7].
Interior particles’ composition differs from site to site, depending on the interior and exterior activities. Several studies have reported that interior particles contain heavy metals and other toxic materials [8,9,10,11,12] that make them one of the most important contaminants because they have a negative impact on human health, especially young children. The interior particles’ heavy metals sources are varied, depending on the location of the building, conditions, the activities occurring in the interior environment as well as exterior sources [8,13,14]. Cigarette smoking, construction, cosmetics and carpet materials, demolition, leaded paints, etc. all elevate the interior levels of chromium (Cr), zinc (Zn), copper (Cu), manganese (Mn), lead (Pb), and cadmium (Cd) [15,16,17,18,19]. Many studies have concluded that the road dust heavy metals from heavy traffic are another source of heavy metals in the interior environment [20,21,22,23]. Cd, Cu, Pb, nickel (Ni) and Zn pollutants are emitted from fossil fuel and coal combustion [19,24]. Lubricating oil use elevates aluminum (Al), Mn, magnesium (Mg) and iron (Fe) levels in particles [25]. Traffic and industrial emissions, surface soil, building materials, particularly from renovation process are the sources of preschools’ heavy metals [26]. Classroom particles from schools located in industrial vicinities and heavy traffic areas contain high levels of heavy metals [27,28].
It has been reported that exposure to Pb, Cd, Hg, Zn and Cr leads to several diseases like kidney failure, cardiovascular, blood and bone diseases, nervous system and gingivitis [29,30]. Heavy metals like Fe, As, and Pb of interior particle sources can cause cancer and cardiac injury [31]. Accumulation of metals in human tissues and other parts of the body will probably result in metal-associated diseases later in life [32]. Inhalation, dust ingestion, and dermal contact are the common pathways whereby heavy metals enter the body [33,34]. In general, oral ingestion is the main pathway exposure to these heavy metals in contaminated particles [35,36,37]. Children in particular are more exposed to interior particles due to their tendency to play on the ground and put things in their mouth [38].
Air quality inside schools, particularly in primary schools, is very important to children due to their higher inhalation rates per body mass, long time spent in schools, and higher sensitivity of children to environmental pollutants. Exposure to even low concentrations of air pollutants in schools leads to various health complaints, loss of productivity, effects on the academic performance [39] and the mental stability of children [40]. School classroom particles’ heavy metals adversely affect students’ memory potential [41]. Hence, the contamination and health risks related to the Classrooms Air Conditioner Filter (CACF) particles need to be evaluated. Therefore, CACF particles that representing the suspended and resuspended settled particles can provide useful information about air quality in the interior school environment and the possible hazards resulting from the exposure of children to classrooms environments with heavy metals particles. Thus, the present study aimed to assess the heavy metal contamination levels in CACF particles at selected Jeddah primary schools; and to evaluate the resulting health risks (non-carcinogenic and carcinogenic) to children due to this exposure, using the United States Environmental Protection Agency (USEPA) risk assessment models.

2. Materials and Methods
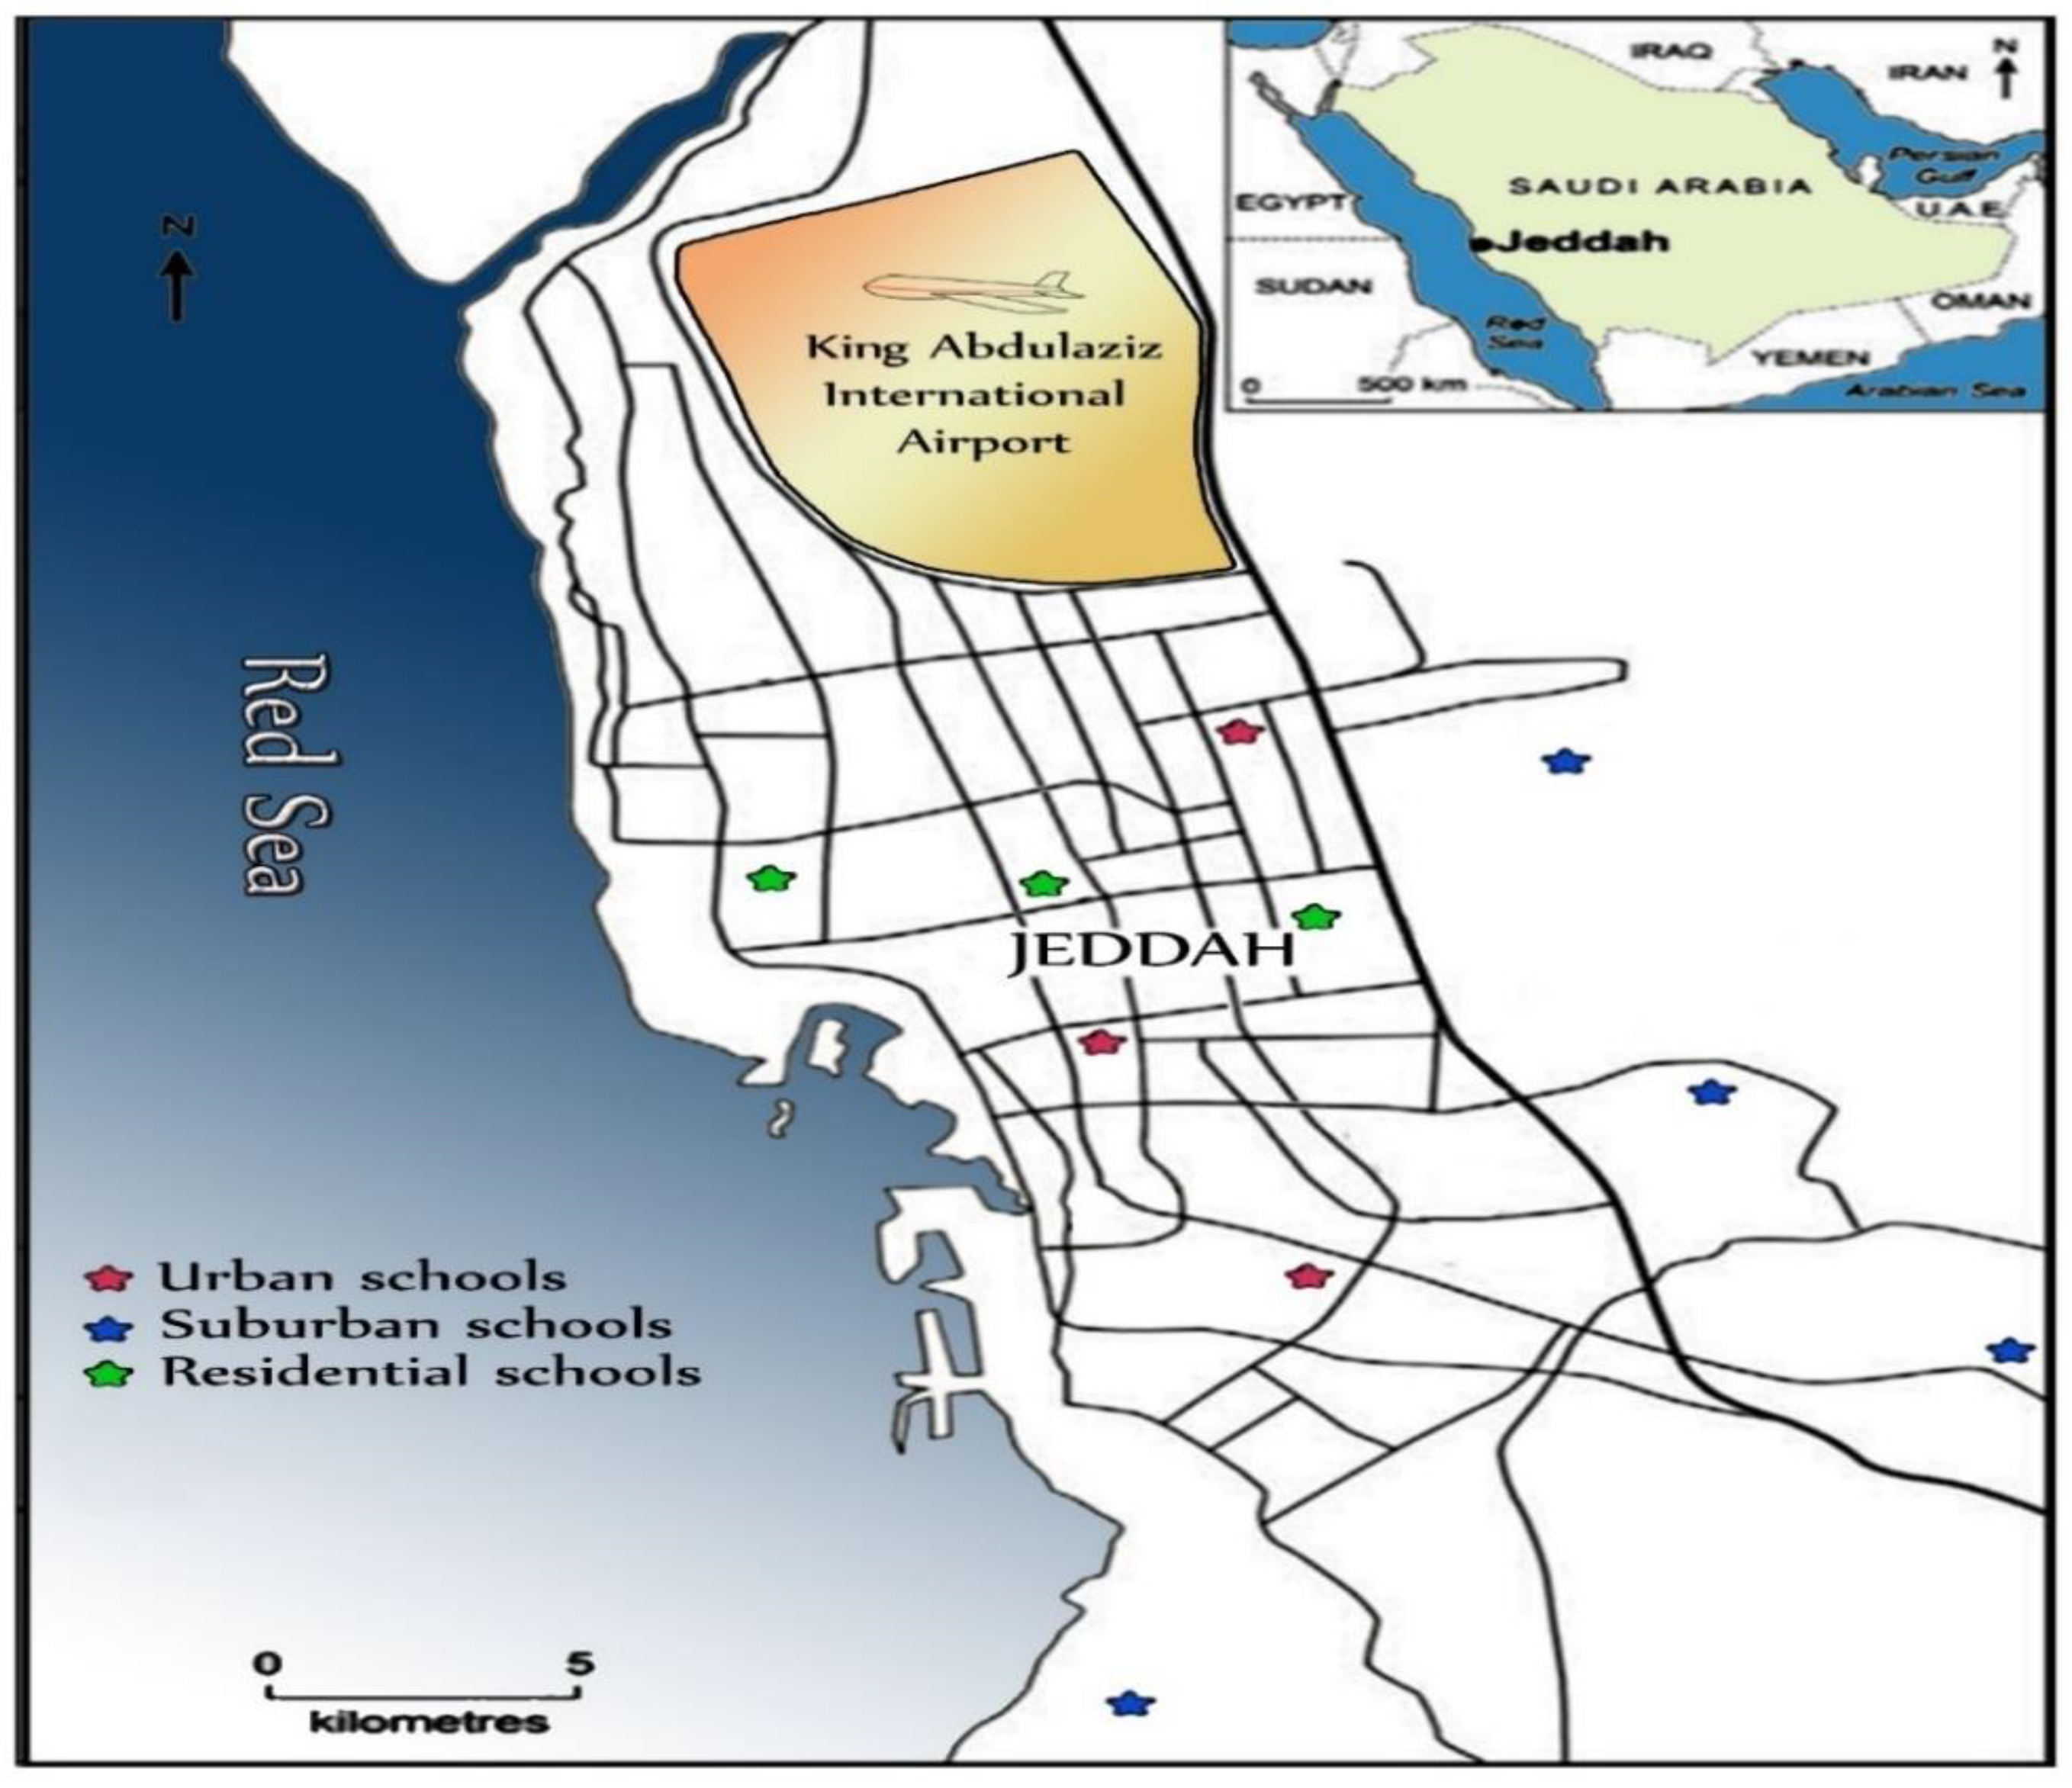
2.1. Study Area

Jeddah (latitude 29.2 North and longitude 39.7 East) is the largest city in Makkah Province and the second largest city in Saudi Arabia after the capital Riyadh (Figure 1). The city is traditionally known as “The Red Sea Bride” as it is located on the east coast of Red Sea, with an urban area of some 1765 km2 and more than 4 million inhabitants (2016 estimates) [42]. The city is surrounded by mountains to the northeast, east and southeast. The international airport is located in the northern part of the city and the harbor located in the south-western part of the city; they are heavily used during certain seasons of the Hijri calendar such as Omra and Hajj. South of Jeddah city are the industrial sector and a naval port.
The weather in Jeddah is hot in summer, and moderate in winter without a real cold season. The average high temperatures in July and January are 39.4 °C and 29 °C, respectively, with scarce precipitation and high humidity. Calm to moderate winds are blown to the city from the northwest for most periods of the year. Historically, it recognized as the gate of Makkah city where the pilgrims land in Jeddah airport before going to the holy city. The city is modern and distinct, with many economic, industrial and tourism activities that made Jeddah an attractive place for business, tourists and travellers alike. Besides that, huge public projects have been recently built: a new airport, railway stations and waterfront that will emphasize the city’s transformation in the new era. Road traffic is more than 1.4 million vehicles, fueled mainly by unleaded gasoline and diesel and stationary sources, like oil refining, seaport activities, a desalination plant, power-generation plants and industrial activities in the south, are the main emission sources of air pollutants in the city.
In Saudi Arabia, dust storms is considered to be one of the most severe environmental hazards. Due to the topography, drought, light textured topsoil and scant vegetative cover, Saudi Arabia is susceptible to dust and dust storms. Previous studies revealed that the highest incidence of dust storms frequency events occurred during the spring in Saudi Arabia [43,44,45]. The sand-dust events during the spring season carry more coarser than fine particles to Jeddah and the soil originated species contribute mainly to dust storm particles [44]. During the period of the present study, dust storms occurred in April and May 2019. Although there is no monitoring station or sensors next to each school or published data on the concentration levels of particulate matter in the atmosphere of the present study areas during the period of study, a recent study on particulate matter (PM2.5, PM2.5–10, and PM10) in the atmosphere of an urban area of Jeddah indicated that the highest seasonal averages concentrations were found in spring, whereas the lowest values were found in autumn [46].

2.2. Sample Collection and Preparation

CACF particle samples were collected from 10 primary schools located in urban, suburban and residential areas (Figure 1), representing different environmental conditions, and various functional categories to reveal the pollution impacts resulting from various human activities. The sampling period was predefined to obtain maximum loadings of particulate matter during two months of the spring season. In the present study, 40 samples were collected, during the months of April–May 2019. At each school, four samples were collected simultaneously from different classrooms from the air conditioner filters of each classroom, which were generally window air conditioners with 42 × 36 cm size filters. The samples were collected using a plastic brush, clean polythene sheets and airtight polyethylene bags. To ensure proper collection of CACF samples, the particles deposited on CACF materials were extracted in a closed room. The CACF particles were trapped slowly in order to avoid the interference of air, as the deposited particles on the CACF are of small size and as such they can become resuspended with ease [47]. The collected samples were stored in clean-labelled polyethylene bags and transported to the lab. CACF particles samples were air-dried at room temperature in the laboratory, and then the coarse impurities were removed using a 1.0 mm mesh nylon sieve. The rest of the samples were homogenized and sieved through a 38-μm sieve size and stored in small self-sealing plastic bags for analysis. In the present study, CACF particles with particle size ≤38 µm diameter was selected to determine their heavy metal concentrations because: (1) the concentration of metal increases with the decrease in dust particle size [48], (2) they represent high health risks [49,50] and (3) they remain airborne for long durations and can easily be transported [35,51].

2.3. Sample Digestion and Analysis

To measure the concentrations of heavy metals in CACF particles, accurately weighed dust samples (1 g) were digested in an acid (nitric and hydrochloric) mixture using the method described by Shabbaj et al. [37]. After digestion, sample solutions were filtered through Whatman filter paper (No. 42), and diluted to 100 mL with deionized water. Samples were stored at 4 °C in pre-cleaned polyethylene bottle until analysis. Inductively Coupled Plasma Optical Emission Spectrometry (ICP- OES-5100, Thermo Fisher Scientific, MA, USA) was used to determine the concentrations of the heavy metals (Fe, Mn, Zn, Pb, Cd, V, Co, Ni, As, Cr and Cu) in the digested CACF particle samples. The quality of data was ensured using standard materials between samples. The standard deviation of repeated measurements of standards was used to determine the precision of measured metals; it was less than 2.5%. Heavy metal concentrations in laboratory blanks, filter blanks and reagent blanks were determined by the same procedure described above in order to assess external heavy metal pollution resulting from the analytical procedures. No contamination was noted.

2.4. Pollution Assessment Methodology

2.4.1. Contamination Factor (CF)

Assessment of the level of contamination in CACF particles by heavy metals is expressed in terms of a contamination factor (CF). The CF for each heavy metal was calculated as the ratio between the metal concentrations in CAC filter particles with its background value [52]:
CF = C n   S a m p l e C n   B a c k g r o u n d
where CF < 1 refers to low contamination, 1 ≤ CF > 3 indicates moderate contamination, 3 ≤ CF ≤ 6 means considerable contamination and CF > 6 refers to very high contamination [53].

2.4.2. Pollution Load Index (PLI)

PLI for each heavy metal in CACF particles samples was calculated using the following equation [54]:
PLI = ( CF 1 × CF 2 × CF 3 × CF 4 × × CF n ) 1 / n
where PLI is the pollution load index, CF is the contamination factor calculated as described in Equation (1) and n is the number of heavy metals studied. A PLI value < 1 indicates no pollution, PLI = 1 present that only baseline levels of pollutants are present, whereas PLI value > 1 indicates polluted CACF particles [54].

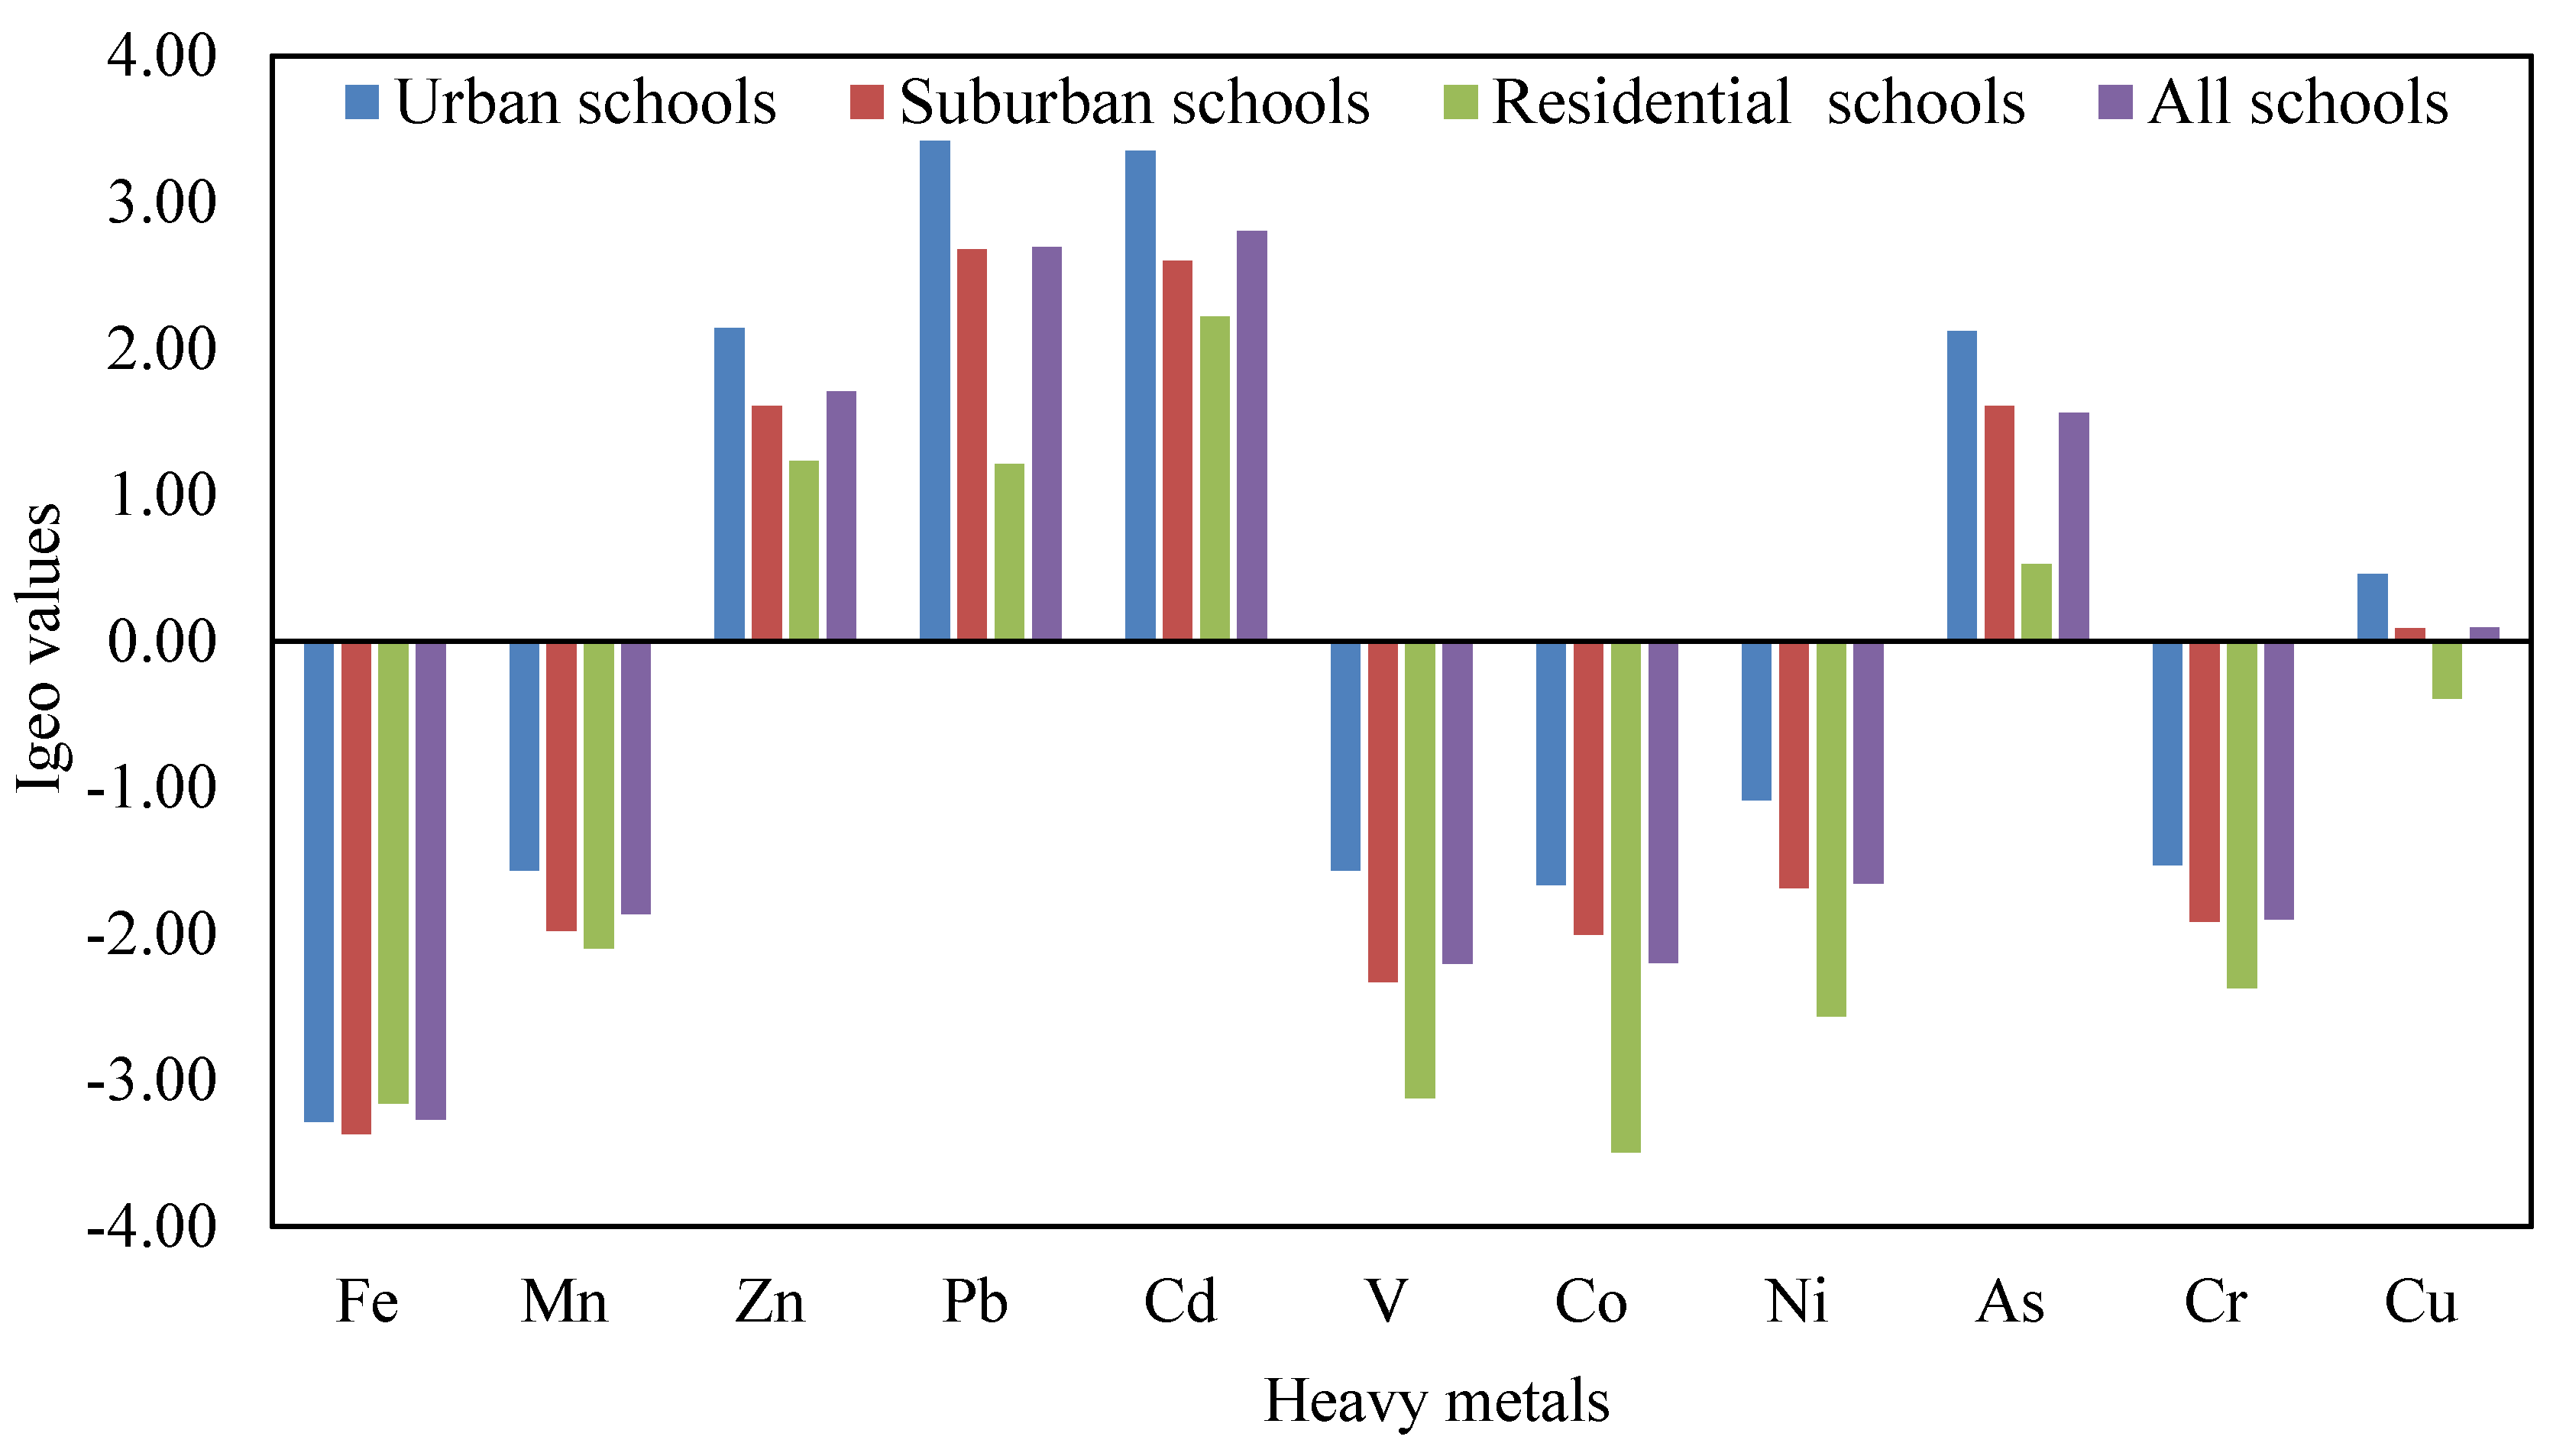
2.4.3. Geo-Accumulation Index (Igeo)

The heavy metal contamination levels in CACF particles was evaluating by using the geo-accumulation index (Igeo) which is widely applied to assess heavy metal pollution in dust [55]. Seven different enrichment classes (Table 1) ranging from (0–6), starting from “normal background value” to “very heavily polluted” were used to evaluate the heavy metal pollution [56,57]. The Igeo was calculated from the following equation [58]:
I geo = log 2 ( C n / 1.5 B n )
where Igeo is the geo-accumulation index for different heavy metals, Cn the measured concentration of the heavy metals in CACF particles samples. The constant 1.5 was used to minimize the effect of possible variations in the background values. While the Bn refers to the background value of metals in the earth’s crust [59].

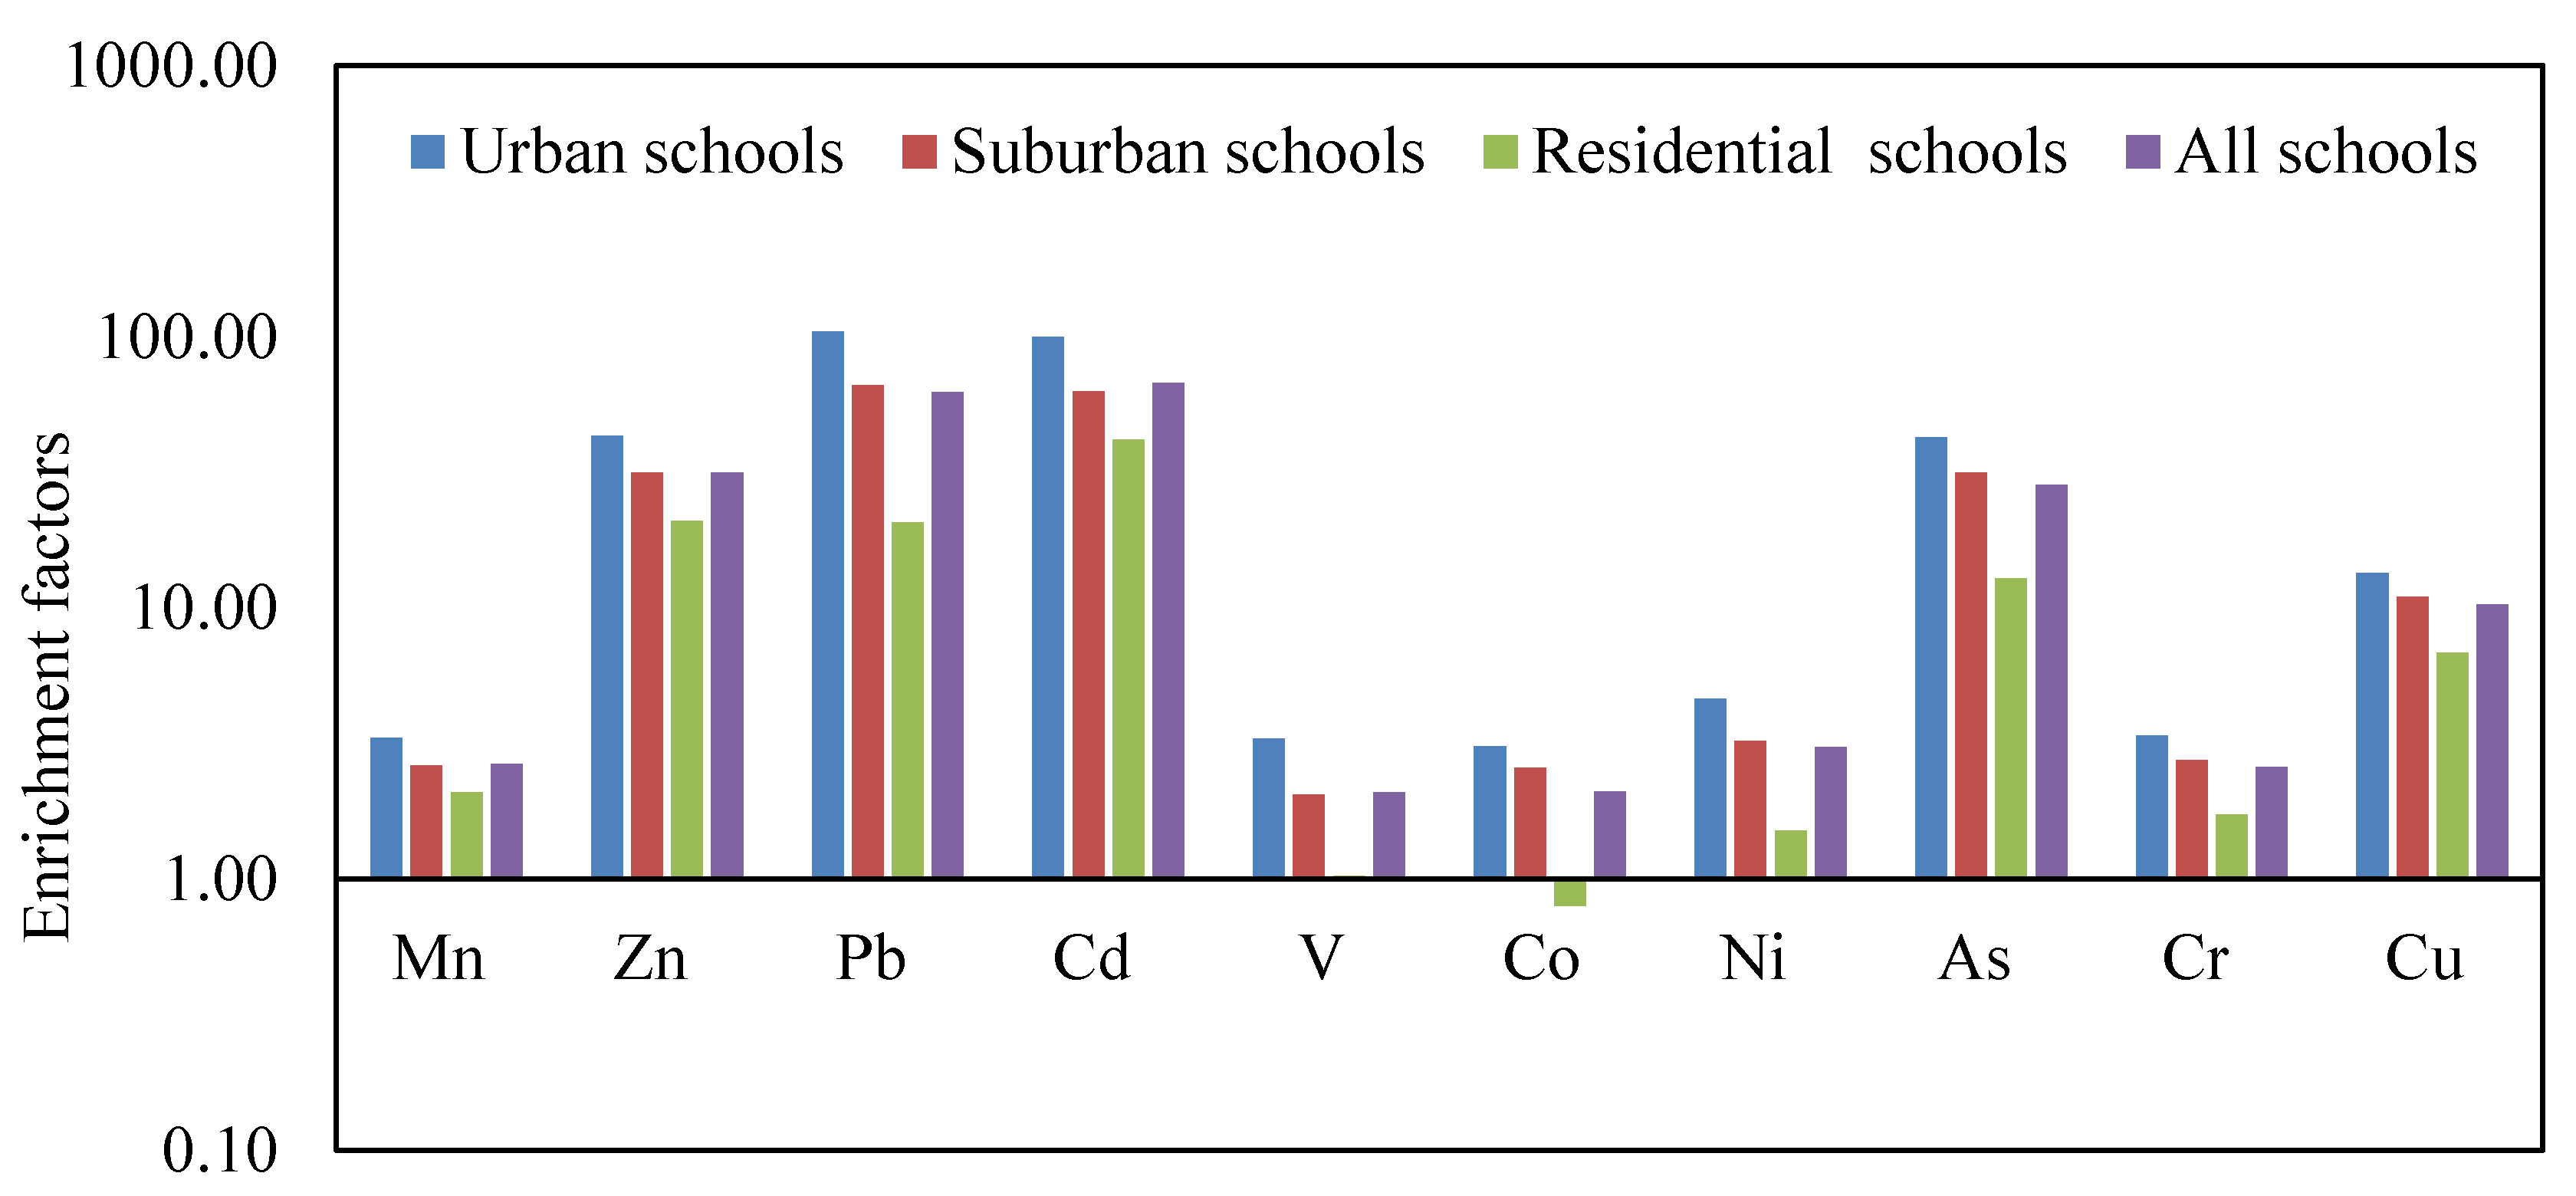
2.4.4. Enrichment Factor (EF)

EF is used to distinguish among the anthropogenic sources and natural origin of heavy metals in CACF particles, as well as, to estimate the degree of the anthropogenic contribution and metal contamination. It was calculated using Equation (4) [60,61]:
EF = ( C x / C reference ) Road dust ( C x / C reference ) Earth crust
where EF refers to the enrichment factor for each heavy metal, Cx is the target heavy metal concentrations, and Creference is the reference metal concentration. In the present study, Fe was selected as a reference metal that used for the calculation of EF, since our calculation of EFs was done assuming that contributions of man–made sources to Fe are insignificant in Jeddah. The composition of the Earth’s crust was taken from Taylor [59] and Taylor and McLennan [62], since average local soil profile data was not available and will be investigated in the follow up study. The use of average crust values provides a meaningful comparison to other studies that commonly use this technique. EF values less than 2 refer to a deficiency to minimal enrichment [63], between 2 and 10 indicate moderate enrichment, whereas higher than 10 shows severe enrichment [64].

2.5. Health Risk Assessment (HRA)

HRA models, developed by the United States Environmental Protection Agency (USEPA), were used to quantify the health risk (carcinogenic and non-carcinogenic) for children from exposure to heavy metals in CACF particles [65,66]. Children in school classrooms are exposed to heavy metals in CACF particles through direct ingestion, inhalation and dermal absorption. The total non-carcinogenic risk for children was calculated for each heavy metal in CACF particles by the summation of the individual risks that calculated from the three exposure pathways [65,67].
Daily dose (ADD) (mg kg−1 day−1) average from exposure to heavy metals in CACF particles through the different exposure pathways was calculated according to Exposure Factors Handbook [68] and the Technical Report of USEPA [69] using the following equations:
ADD ing = C × IngR × CF × EF × ED BW × AT
ADD inh = C × InhR × EF × ED PEF × BW × AT
ADD dermal = C × SA × CF × AF × ABF × EF × ED BW × AT
HQ = ADD RfD
HI = HQ ing + HQ inh + HQ dermal
LCR = ADD × SF
TLCR = LCR ing + LCR inh + LCR dermal
where the ADDing, ADDinh and ADDdermal are the daily dose (mg kg−1 day−1) average exposure to heavy metals through ingestion, inhalation and dermal contact, respectively. RfD and SF are the values of reference dose (mg kg−1 day−1) and slope factor [36,70,71,72,73]. The detailed description about the values of exposure factors for children and adults that were applied to the above model Equations (5)–(11) in the present study are given in Table 2. In order to evaluate the non-carcinogenic hazards from exposure to heavy metals in CACF particles in Jeddah schools, HQ (hazard quotient), and HI (hazards index) Equations (8) and (9) were applied [74,75].
For carcinogenic risk, the lifetime cancer risk (LCR) of children from potential carcinogen exposure in CACF particles over a lifetime was calculated using Equation (10), for ADD and SF is the slope factor for cancer. Total lifetime cancer risk (TLCR) is the summation of LCR calculated for ingestion, dermal contact and inhalation [12] using Equations (10) and (11).
There is a chance that adverse health effects occur when HQ and total risk of non-carcinogenic (HI) more than one for a single metal, and the probability increase with increasing the HI value [70,71]. On the other hand, the TLCR values that exceed the acceptable carcinogenic risk range (1 × 10⁻⁶–1 × 10⁻⁴) indicate that potential carcinogenic risks are occur [76].

3. Results and Discussion

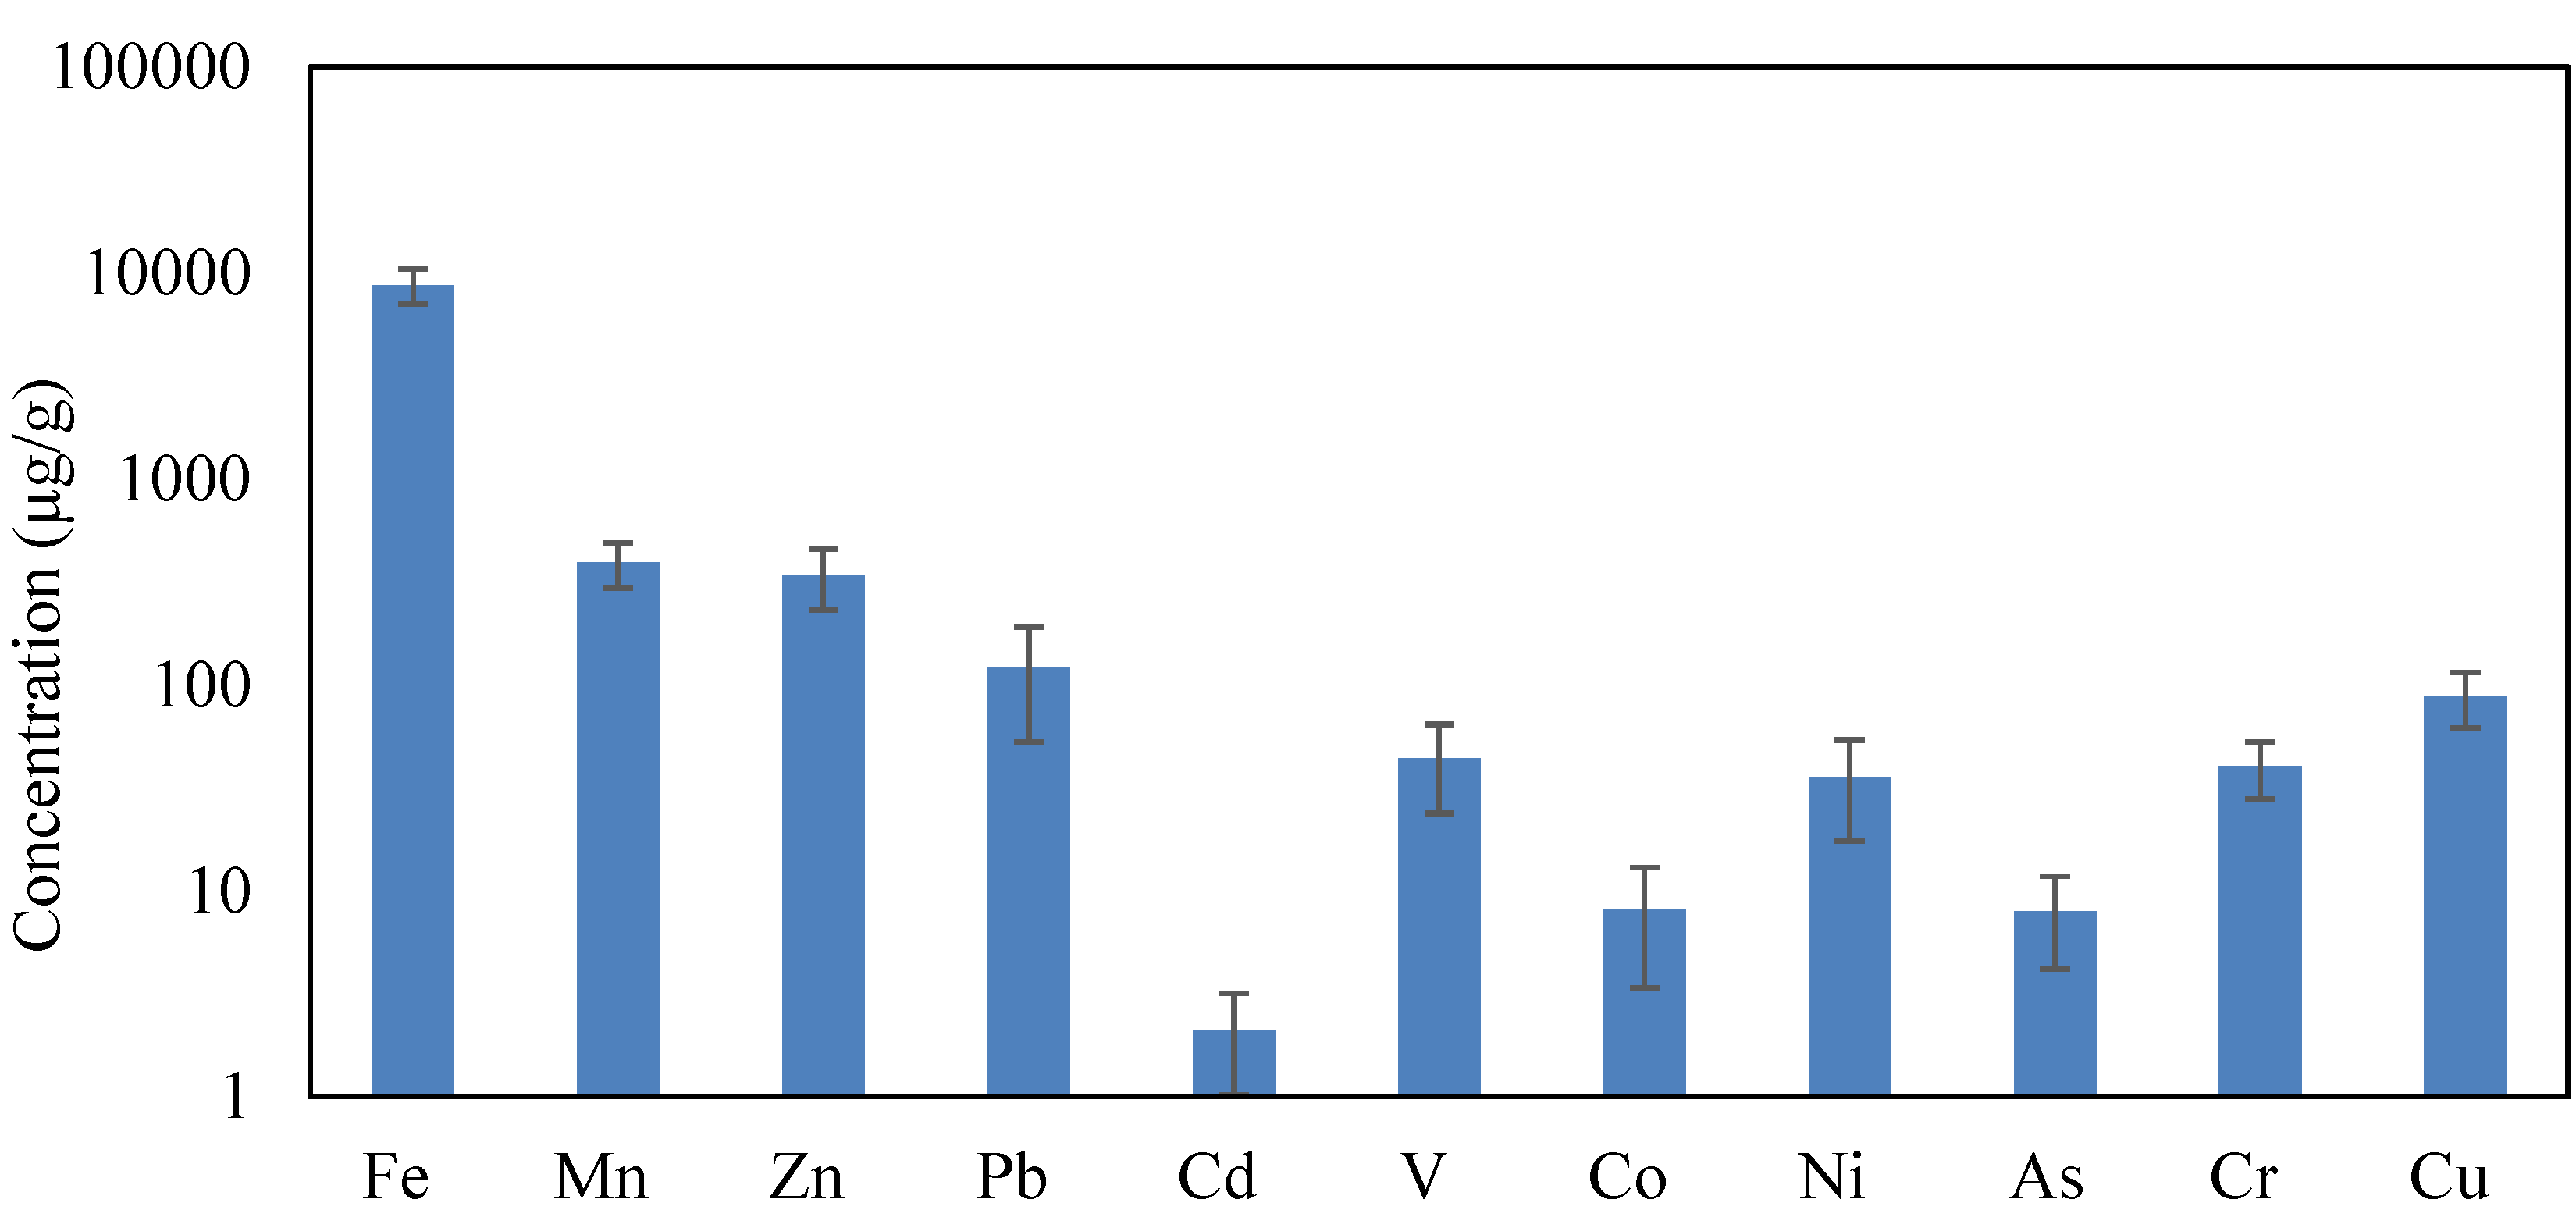
3.1. Heavy Metal Concentrations in CACF Particles

The average concentrations of heavy metals in CACF particles collected from Jeddah schools are shown in Figure 2. The heavy metals levels were in descending order of Fe (8752 µg/g) > Mn (392 µg/g) > Zn (343 µg/g) > Pb (121 µg/g) > Cu (88 µg/g) > V (44 µg/g) > Cr (40 µg/g) > Ni (36 µg/g) > Co (8.1 µg/g) > As (7.95 µg/g) and Cd (2.1 µg/g). Pb, Cu, Mn, Zn, Co and Cd maximum permissible concentration (MPC) in soil were 100, 100, 1500, 300, 30, and 3 µg/g, respectively [89]. In the present study, only the Pb and Zn concentrations were higher than the MPC. Due to use of the white boards with erasable ink pens for teaching instead of blackboards and chalk in Jeddah schools, it is assumed that the sources of heavy metals in CACF particles mostly originated from the exterior. Traffic that circulates around the Jeddah schools is the exterior anthropogenic source of CACF particles heavy metals. Table 3 shows comparison of heavy metals concentrations in CACF particles in Jeddah schools with those found in the school classroom particles of other cities around the world. From this table, it can be seen that the heavy metal levels in school classroom particles vary extremely between the different cities in world; this may be attributed to the variation in the exterior sources such as traffic intensity, human activities, land use type and technologies used, which are the main sources of these metals in the interior microenvironments. The heavy metals levels in CACF particles from Jeddah schools were lower/higher or similar to those found in other city schools of the world. As summarized in Table 3, for example the Cu concentration in CACF particles of Jeddah schools is lower than in Malaysia (Jengka, Selangor), Iran (Bushehr Serdang), and higher than in China (Xian), Malaysia (Sri Serdang, Shah Alam, Nigeria (Ogun State). The Pb content in CACF particles of Jeddah schools is higher than in Nigeria (Ogun State), Malaysia (Shah Alam, Sri Serdang) and Iran (Bushehr) but lower than elsewhere in Malaysia (Selangor, Jengka, Selangor), and China (Xian). The Ni concentration in CACF particles of Jeddah schools is almost similar to that of China (Xian), lower than in Iran (Bushehr), Malaysia (Serdang), and higher than in Malaysia (Shah Alam) and Nigeria (Ogun State). These results back up the concept that each city school has a distinctive combination of heavy metal composition, and their variations and similarities in levels of these heavy metals in the interior particles between the world cities’ schools may not reflect the actual natural and anthropogenic diversities among various schools settings.
The spatial differences of the heavy metals concentrations in collected CACF particles from various land use areas in Jeddah are shown in Table 4. All heavy metal concentrations (except for Fe in residential schools) in CACF particles were higher in urban schools than suburban and residential schools. Based on the concentrations of ∑metals emitted from anthropogenic sources in each functional land used areas (Mn, Zn, Pb, Cd, V, Co, Ni, As, Cr and Cu), they could be classified as follows: urban schools > suburban schools > residential schools. The wide differences in the level of heavy metals among schools in various functional areas result from the difference in exterior characteristic activities that release distinct types of heavy metals in each functional area [94,95]. In the present study, the relatively higher traffic density around the urban schools than suburban and residential schools leads to an increase in the emission of heavy metal particles in the exterior and then consequently in the interior environment of urban schools, while Fe in residential schools mostly comes from natural sources. This result is in agreement with previous studies which reported that traffic emissions are the major source of heavy metal particles that be brought into school classrooms [12,14,90,93,96,97]. Heavy metals in urban street dust originate mainly from vehicular traffic emissions [36]. Vehicle exhaust, tire, brake and engine lining wear, vehicle component collisions, and using of lubricating oils increase the levels of heavy metals [79,90,98,99,100,101].

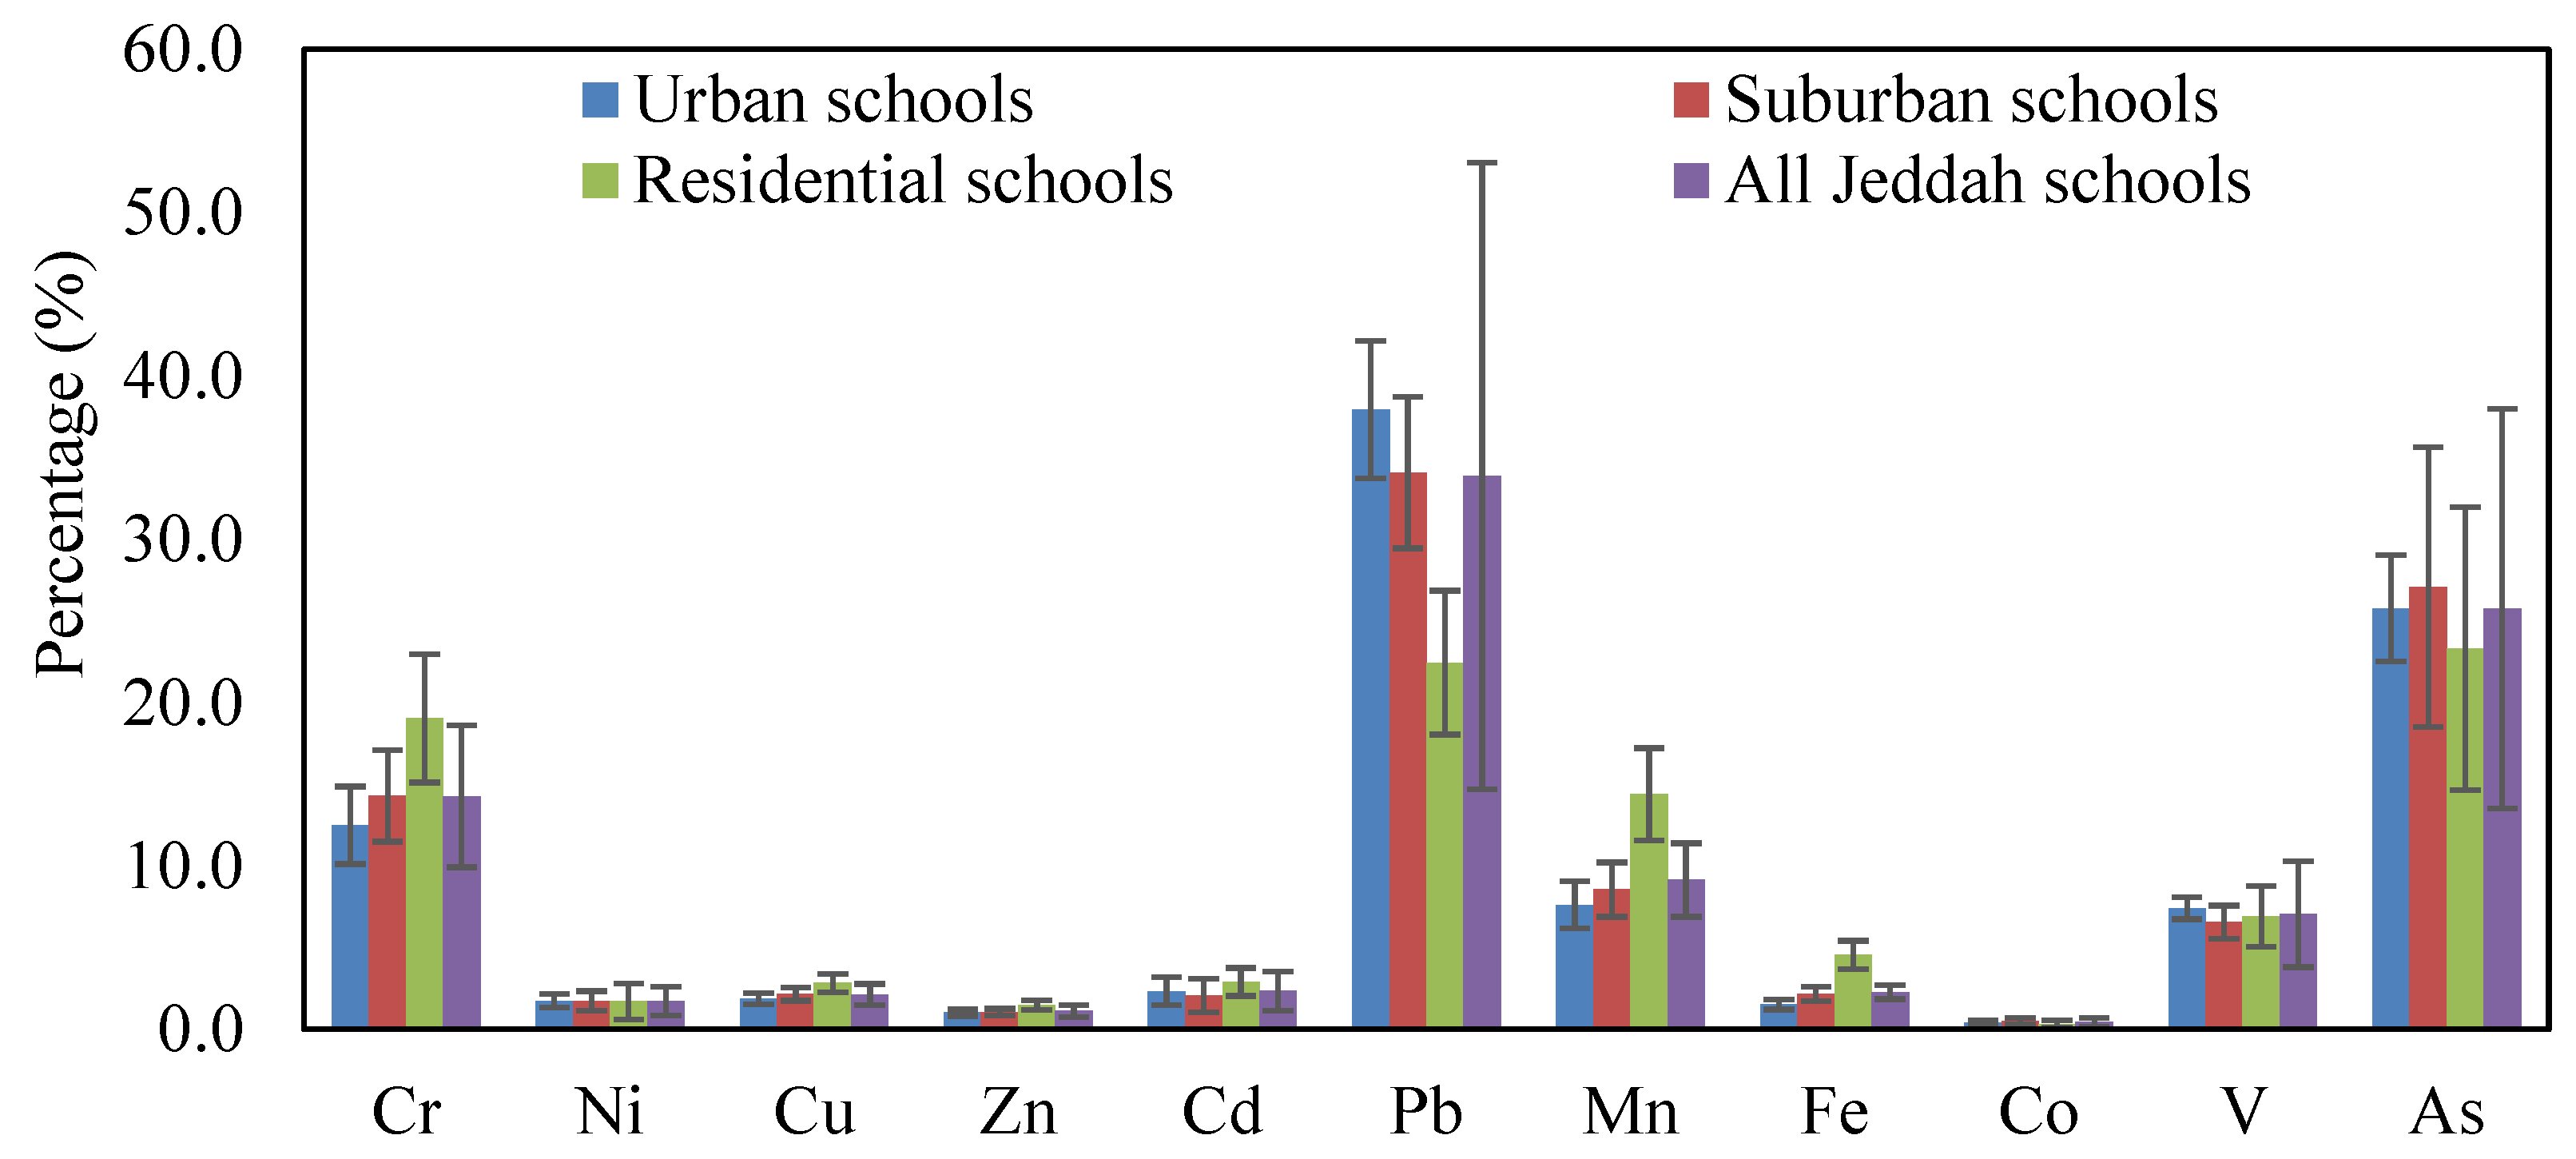
3.2. Pollution Characteristics of CACF Particles

Based on CF and PLI calculations, the CF and PLI values for each heavy metal in CACF particles collected from each school in various land use functional areas in Jeddah are shown in Table 5. The values of CF were different from metal to metal in all schools, with the highest Zn, Pb, Cd and As values. CF values were lower than the ones for Fe, Mn, V, Co, Ni and Cr, whereas the values were higher than the ones for Zn, Pb, Cd, Cu and As in the different schools. The lack of contamination of CACF particles of the different schools by Fe, Mn, V, Co, Ni and Cr metals, which have similar CF values of less than one, indicate that they originate from soil and resuspended dust. On the other hand, the contamination of CACF particles by Zn, Pb, Cd, Cu and As metals may be due to traffic emissions, which are the main sources of these metals in the study areas. Moreover, the highest CF values for Zn, Pb, Cd, Cu and As metals, originated from vehicle emissions, were found in CACF particles of urban schools followed by suburban and residential schools. Moreover, the CF values for the individual metal were different in urban, suburban and residential schools, with maximum values in urban schools. This may be attributed to the higher traffic density around urban schools, which lead to an increase in the concentrations of these metals in the CACF particles. Regarding the PLI values, they were 1.57, 1.12, 0.71, and 1.15 for urban, suburban, residential and all schools of Jeddah, respectively. This finding suggests that the heavy metals in CACF particles of Jeddah urban schools were more contaminated, that can be attributed to the influence of high vehicular traffic emissions around these schools. Past studies have reported that automobile emissions are the main source of heavy metals in interior particles [41,102,103,104]. The geo-accumulation index (Igeo) categorizes the pollution levels into seven classes, depending on the severity of contamination that used to determine the metal pollution status. The Igeo values for heavy metals in CACF particles collected from various schools are presented in Figure 3. The order of the mean Igeo values in CACF particles were Pb > Cd > Zn > As > Cu > Ni > Cr > Mn > V > Co > Fe in urban schools, Pb > Cd > Zn > As > Cu > Ni > Cr > Mn > Co > V > Fe in suburban schools, Cd > Zn > Pb > As > Cu > Mn > Cr > Ni > V > Fe > Co in residential schools, and Cd > Pb > Zn > As > Cu > Ni > Mn > Cr > Co > V > Fe in all Jeddah schools. Based on the criteria of contamination of CACF particles based on Igeo values (Table 1), CACF particles were uncontaminated (Igeo class 0) by Fe, Mn, V, Co, Ni in all schools and Cu in residential schools; uncontaminated to moderately contaminated (Igeo class 1) by Cu in urban, suburban and all Jeddah schools and As in residential schools; moderately contaminated (Igeo class 2) by Zn and As in suburban schools and Zn and Pb in residential schools and Zn and As in all schools. CACF particles were moderately to heavily contaminated (Igeo class 3) by Zn and As in urban schools, Pb and Cd in suburban schools, Cd in residential schools and Pb and Cd in all schools, and heavily contaminated (Igeo class 4) by Pb and Cd in urban schools. These results indicate that CACF particles that have small particle sizes and large surface area, especially in urban schools, can carry a lot of heavy metals like Zn, As, Pb and Cd. Moreover, increases the heavy metals that are released from exterior anthropogenic sources lead to an increase in their content in school CACF particles.
The estimated value of EF for each heavy metals in CACF particles collected from schools located in various areas are represented graphically in Figure 4. EF values between 2 and 10 indicate a moderate enrichment, whereas EF values > 10 indicate severe enrichment [64]. Based on the estimated EF for each heavy metal in the present study, V, Co, Ni and Cr in CACF particles of residential schools with EF values less than 2 indicate that they were deficient to minimally contaminated and these metals originate from exterior natural sources. The EF values of Mn, V, Co, Ni, and Cr in both urban and suburban schools particles, and Mn and Cu in residential schools particles were between 2 and 10, suggesting that they were moderately enriched. Moreover, EF values larger than 10 were found for Zn, Pb, Cd, As and Cu in both urban and suburban school particles and Zn, Pb, Cd, and As in residential schools particles, indicating that they were severely enriched. With regard to all Jeddah schools, the mean values of EF for each heavy metal in CACF particles displayed the following decreasing trend: Cd > Pb > Zn >As > Cu > Ni > Mn > Cr > Co > V. For the mean EF values, Mn, V, Co, Ni and Cr were between 2 and 10, showing that they were moderately enriched. Cd, Pb, Zn As and Cu were larger than 10, suggesting severe enrichment by exterior anthropogenic sources. Cu, Cr, Ni, Pb and Zn originate from vehicle emissions [11,105]. Anthropogenic Cu and Zn are produced from traffic-related materials such as lubricating oils, vehicle brake and tire wear and yellow paint [106,107,108,109]. Enrichment of heavy metals in the interior environment may be due to exterior sources like heavy traffic roads [79,110]. Furthermore, in countries which have a desert climate, dust storms which are considered a natural source of air pollution can significantly impact interior air quality, since these storms may lead to an increase in the concentrations of metals in the exterior and consequently in the interior. A study of the effect of dust storms on the level of metals in the atmosphere of Jeddah city revealed that the dust storms lead to an increase in the concentrations of crustal elements (e.g., Si, Ca, Na, Al, Fe, K, and Mg) that originate from soil and resuspended dust, and the anthropogenic elements (e.g., Co, Cu, Zn, As, Pb, Cd, V and Ni) that are emitted from anthropogenic sources [44]. The deserts surrounding Jeddah city were evidently the sources of the mineral crust elements in CACF particles by means of regional or long range transport to the study area, beside their anthropogenic sources, while the anthropogenic heavy metals in CACF particles originate from sources found in both the local and their surrounding areas. In this study, CACF particles samples collected from the study sites represent the time of dust storms and the time of normal conditions together. Therefore, the local pollution sources in Jeddah beside the dust storms that strike Jeddah city during the sampling time (spring season) may lead to an increase the concentrations of the measured metals at all schools [44]. However, the presence and levels of heavy metals in CACF particles by means of the effect of dust storm events through regional or long range transport to the study area are not clear yet. Therefore, further studies to differentiate between the effects of dust storm events and the effects of anthropogenic activities during normal days on the heavy metal levels in CACF particles are needed. Despite the phase out of leaded gasoline usage in Saudi Arabia in 2001 [111], the enrichment of Pb in CACF particles of Jeddah schools, especially in urban areas, is still high. This may be due to historical Pb contamination of exterior road dusts and its long half-life in soils [112].

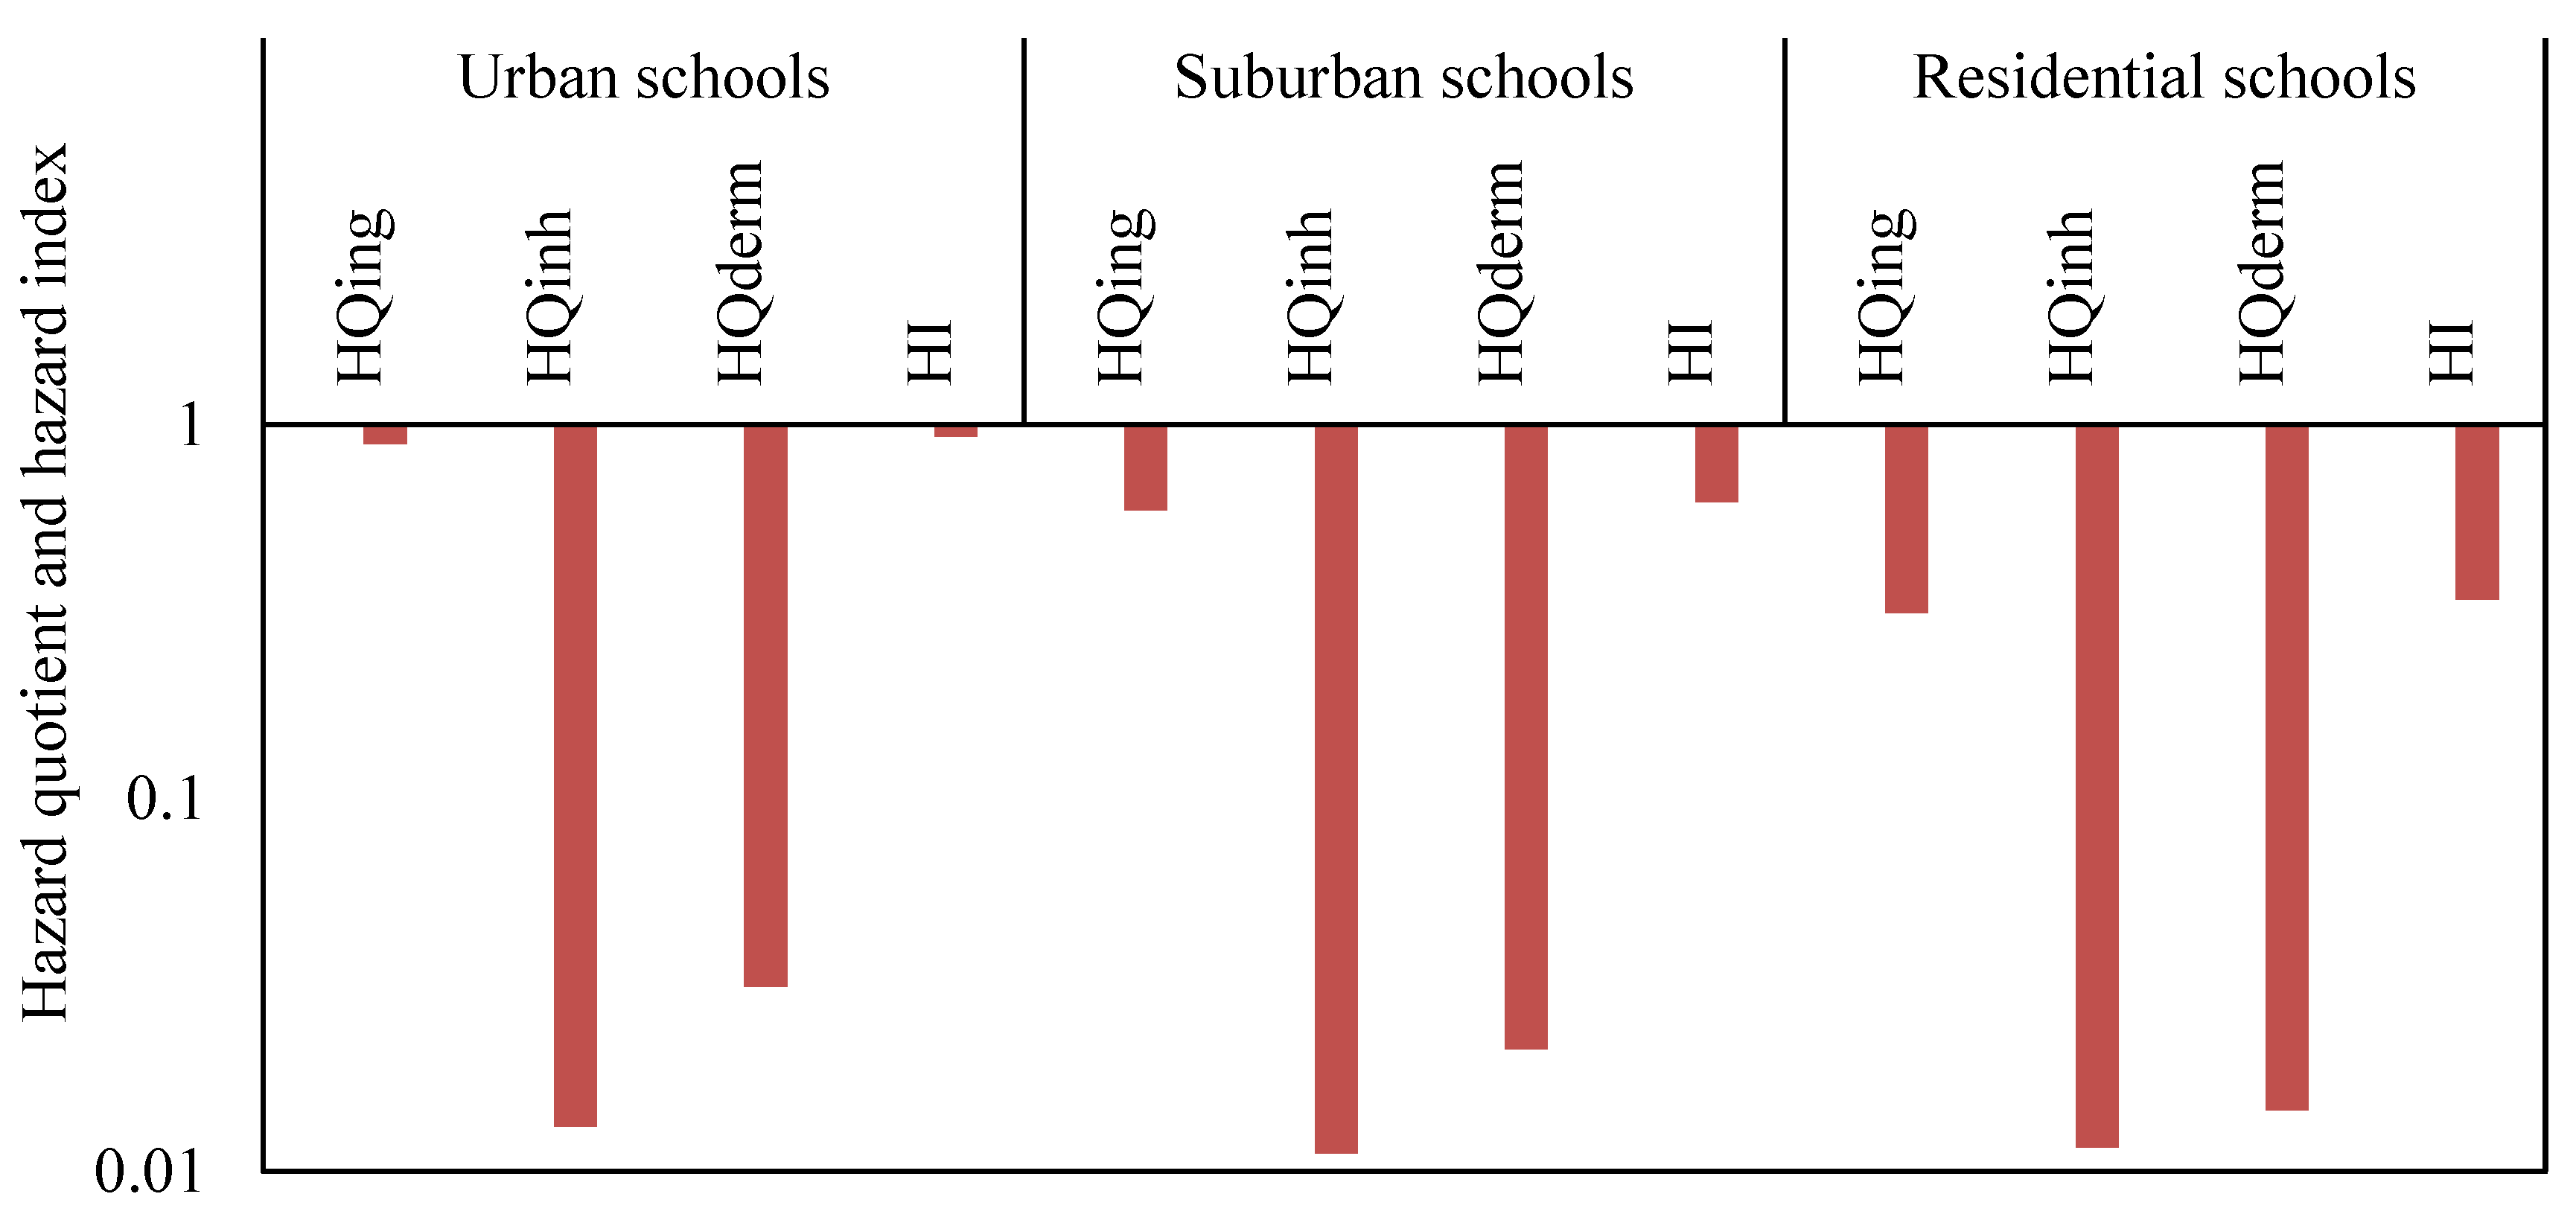
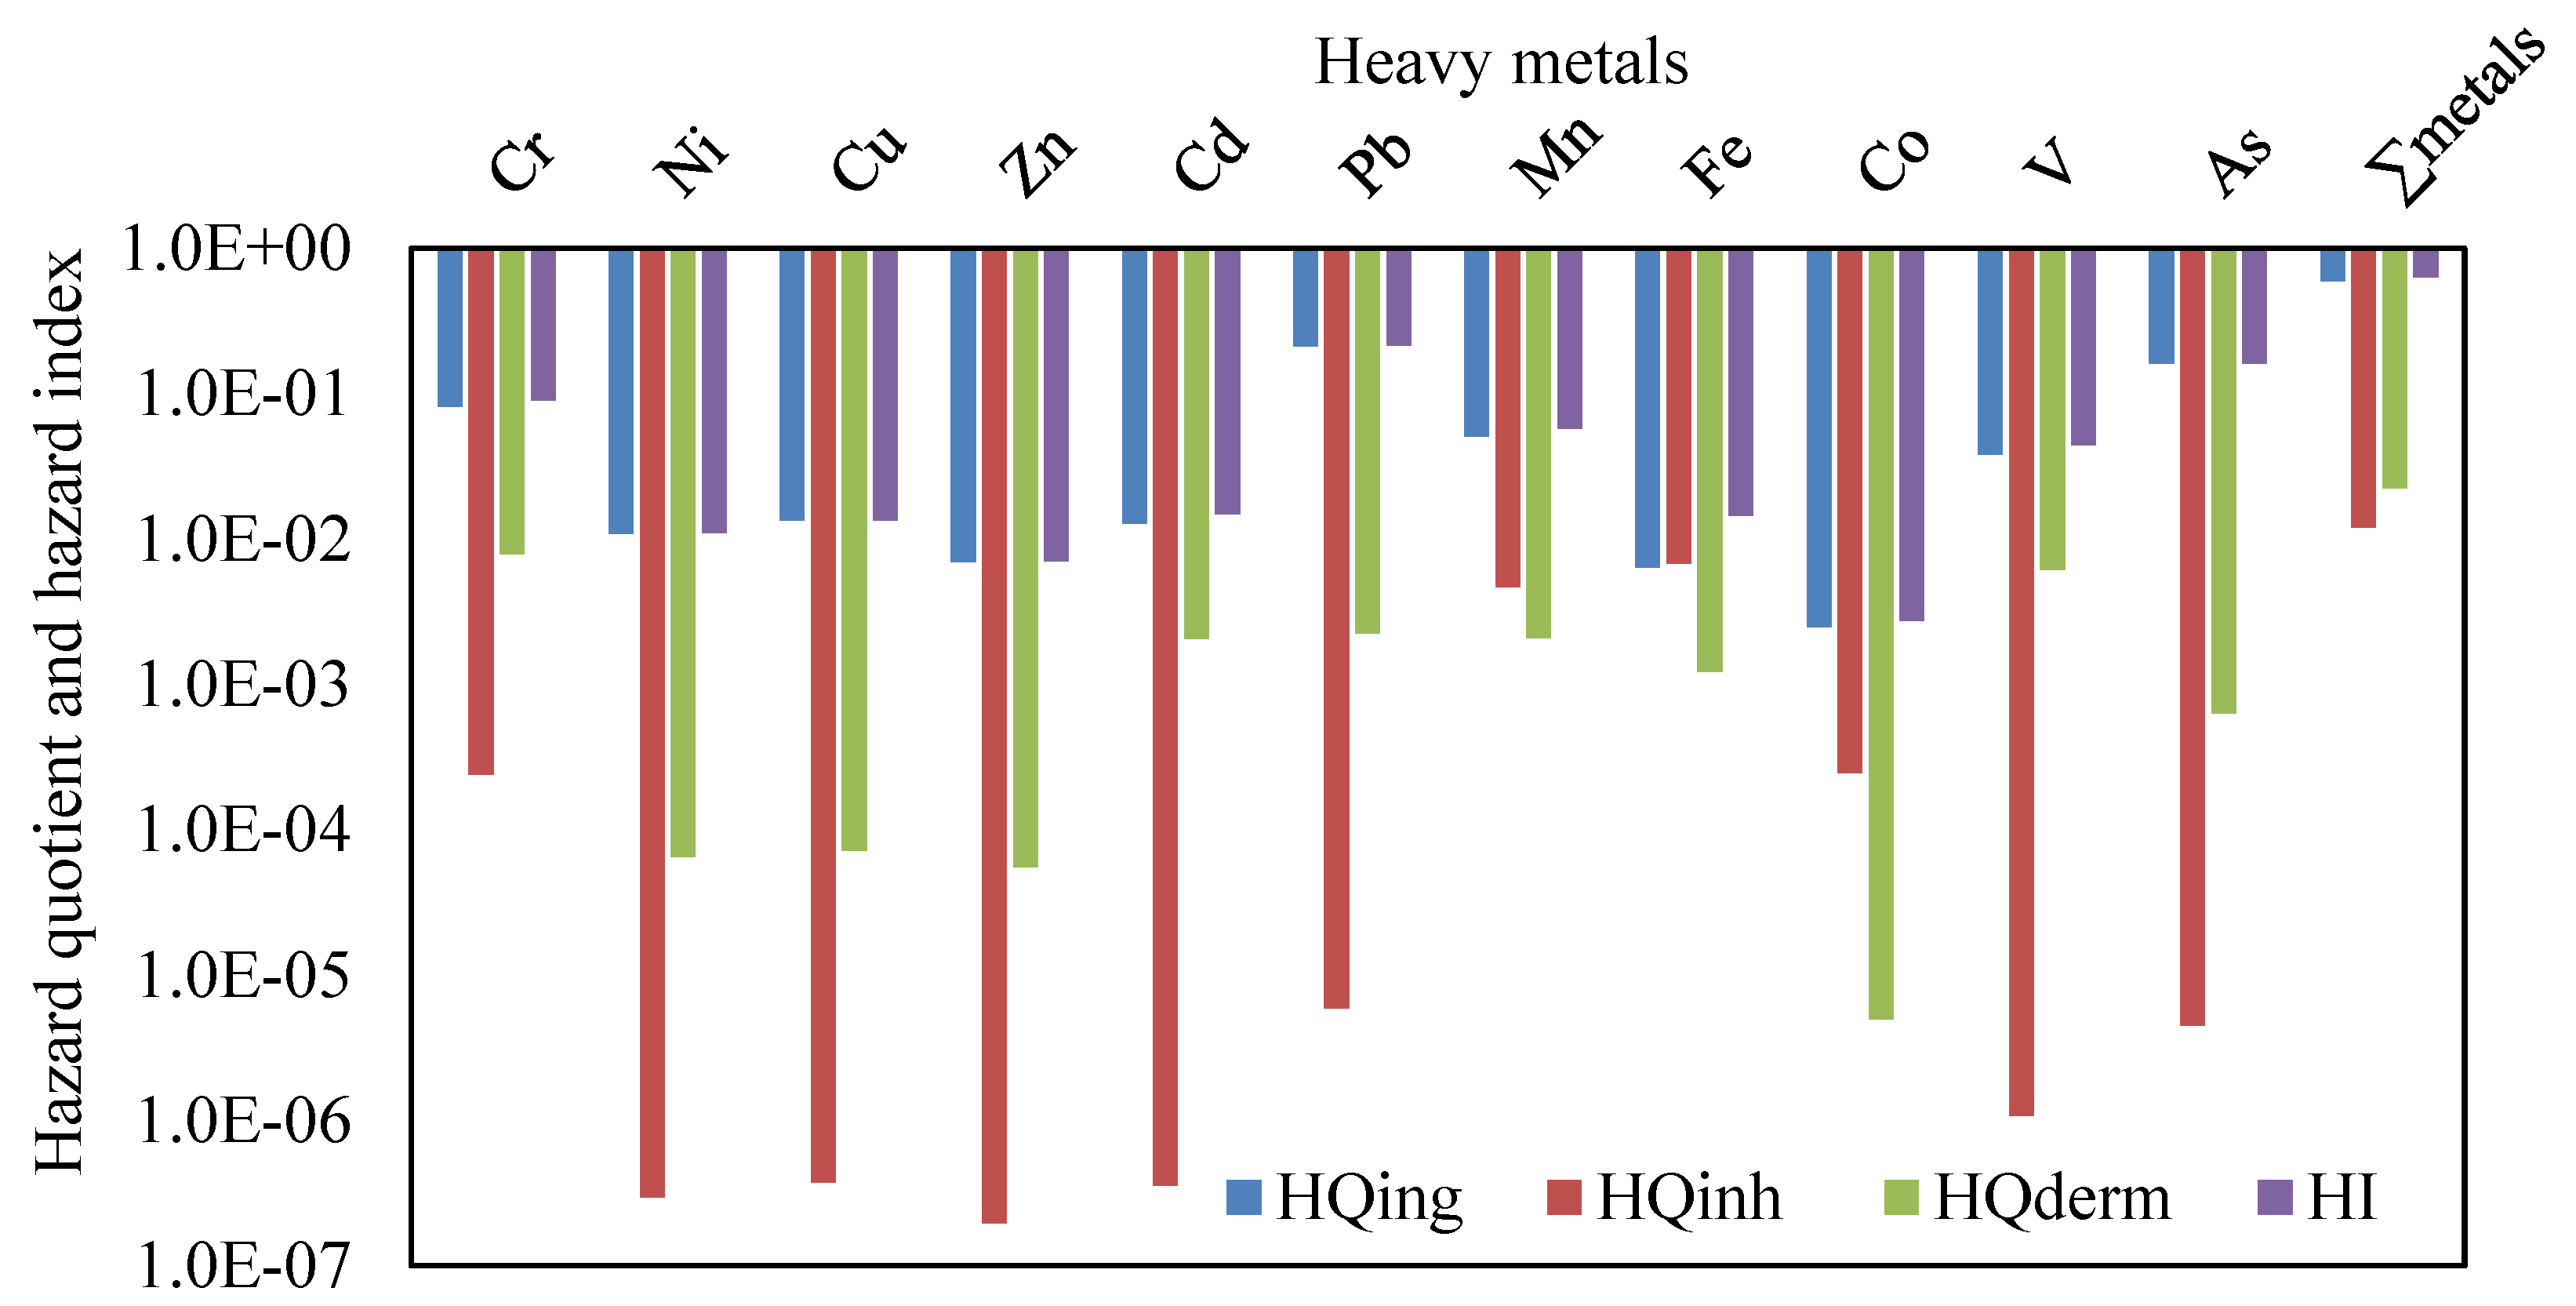
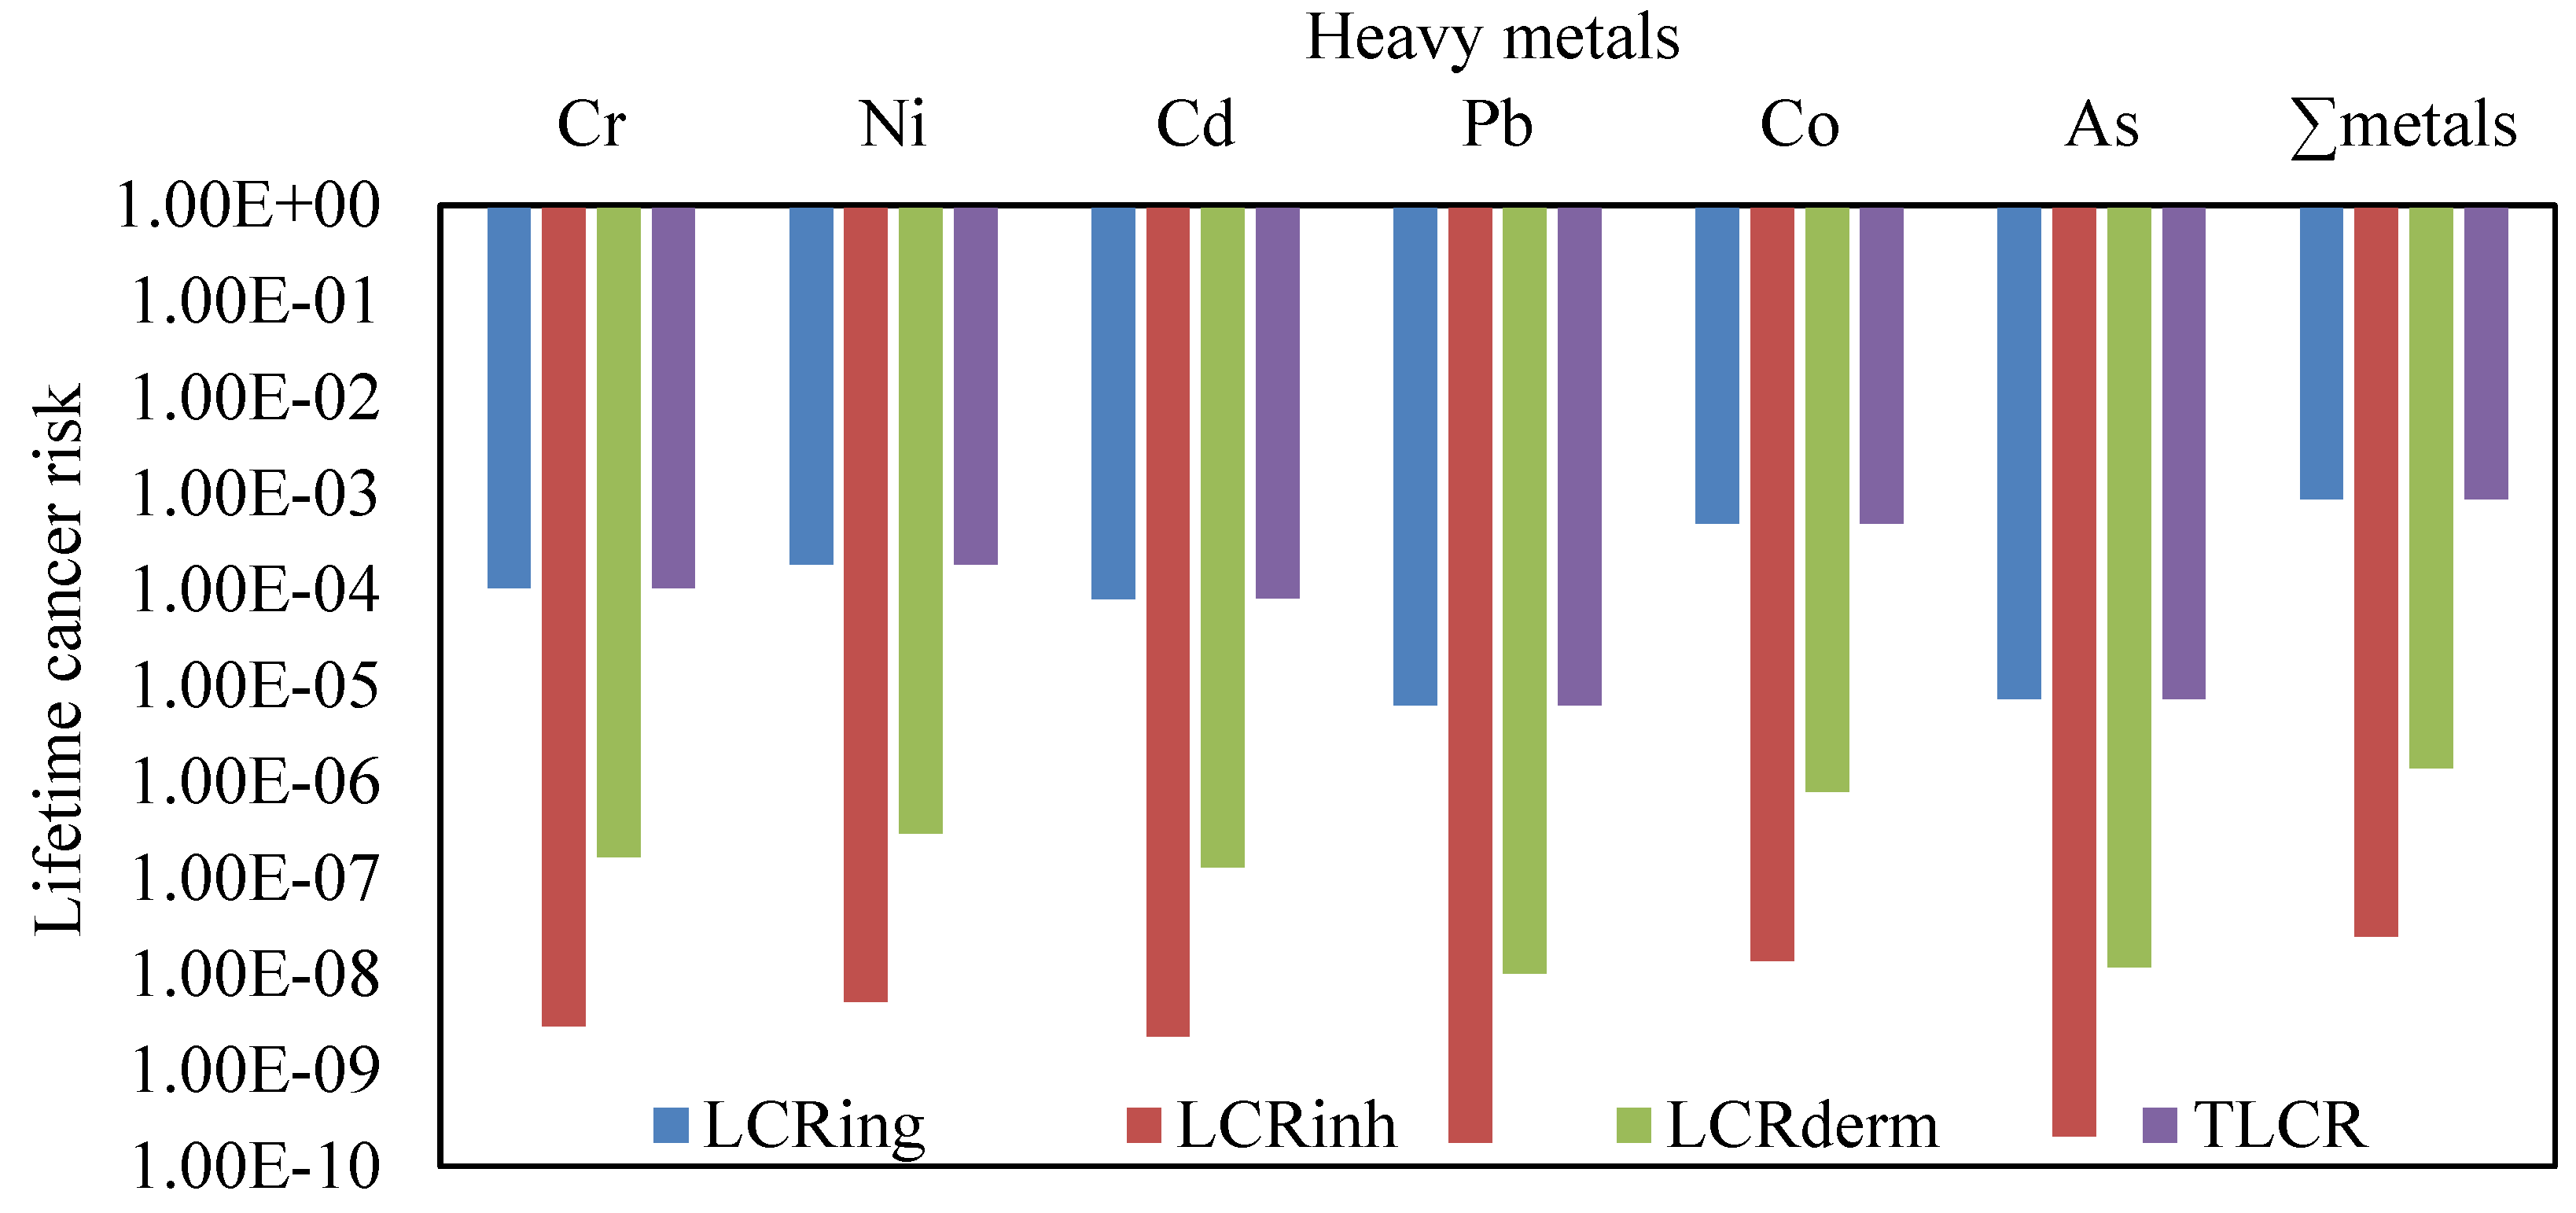
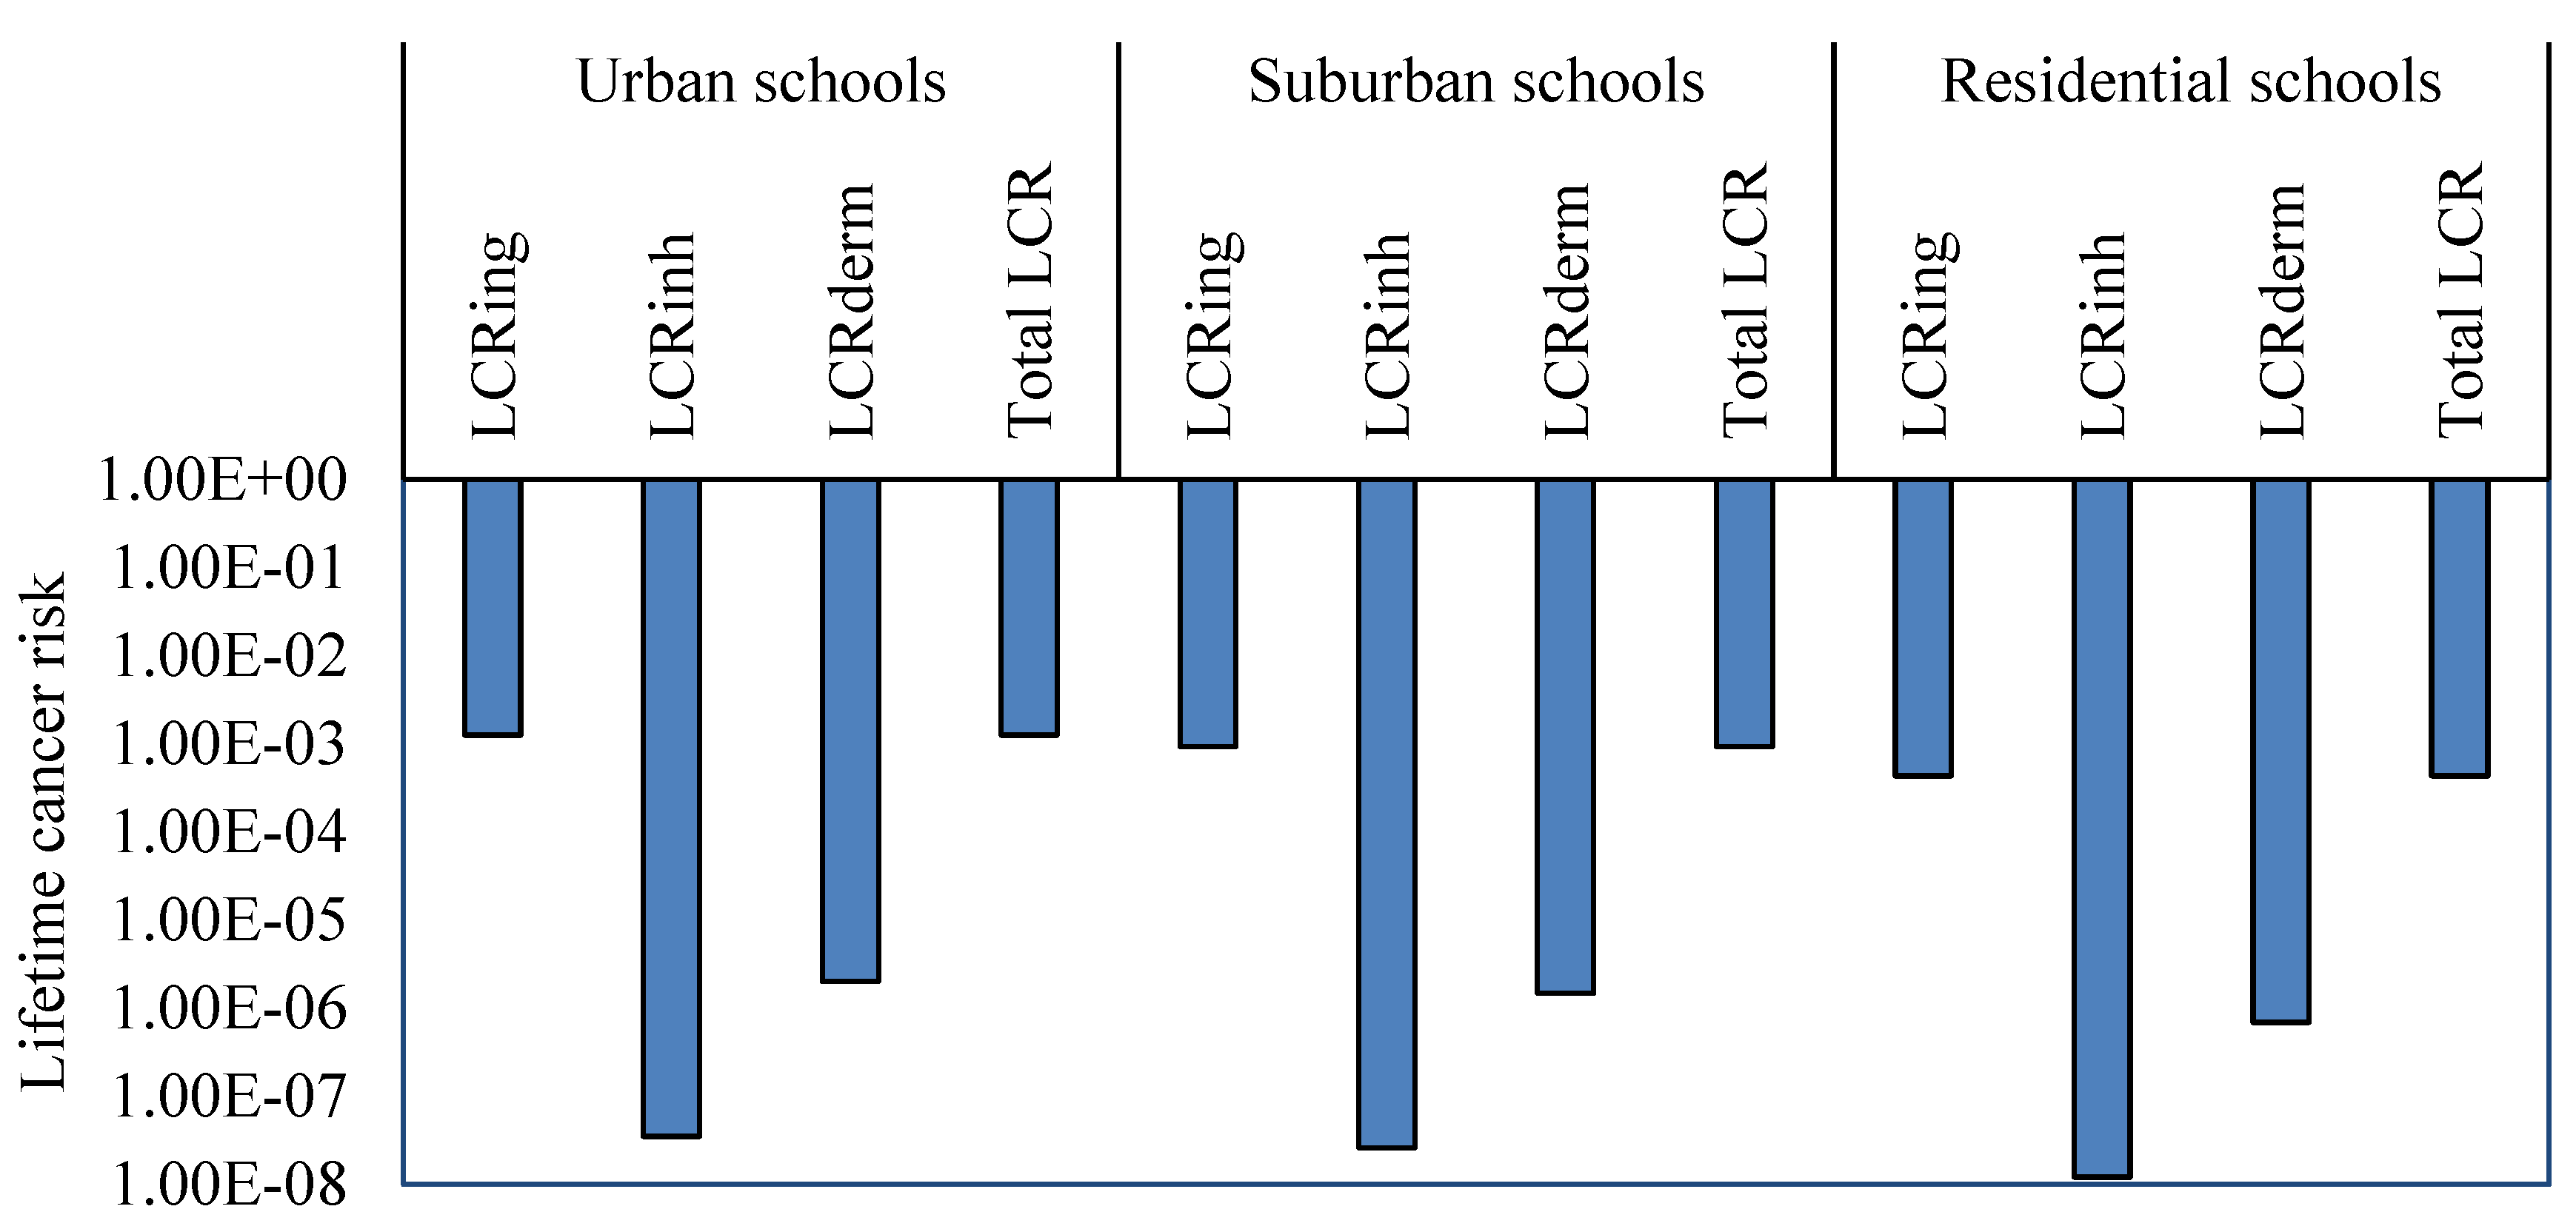
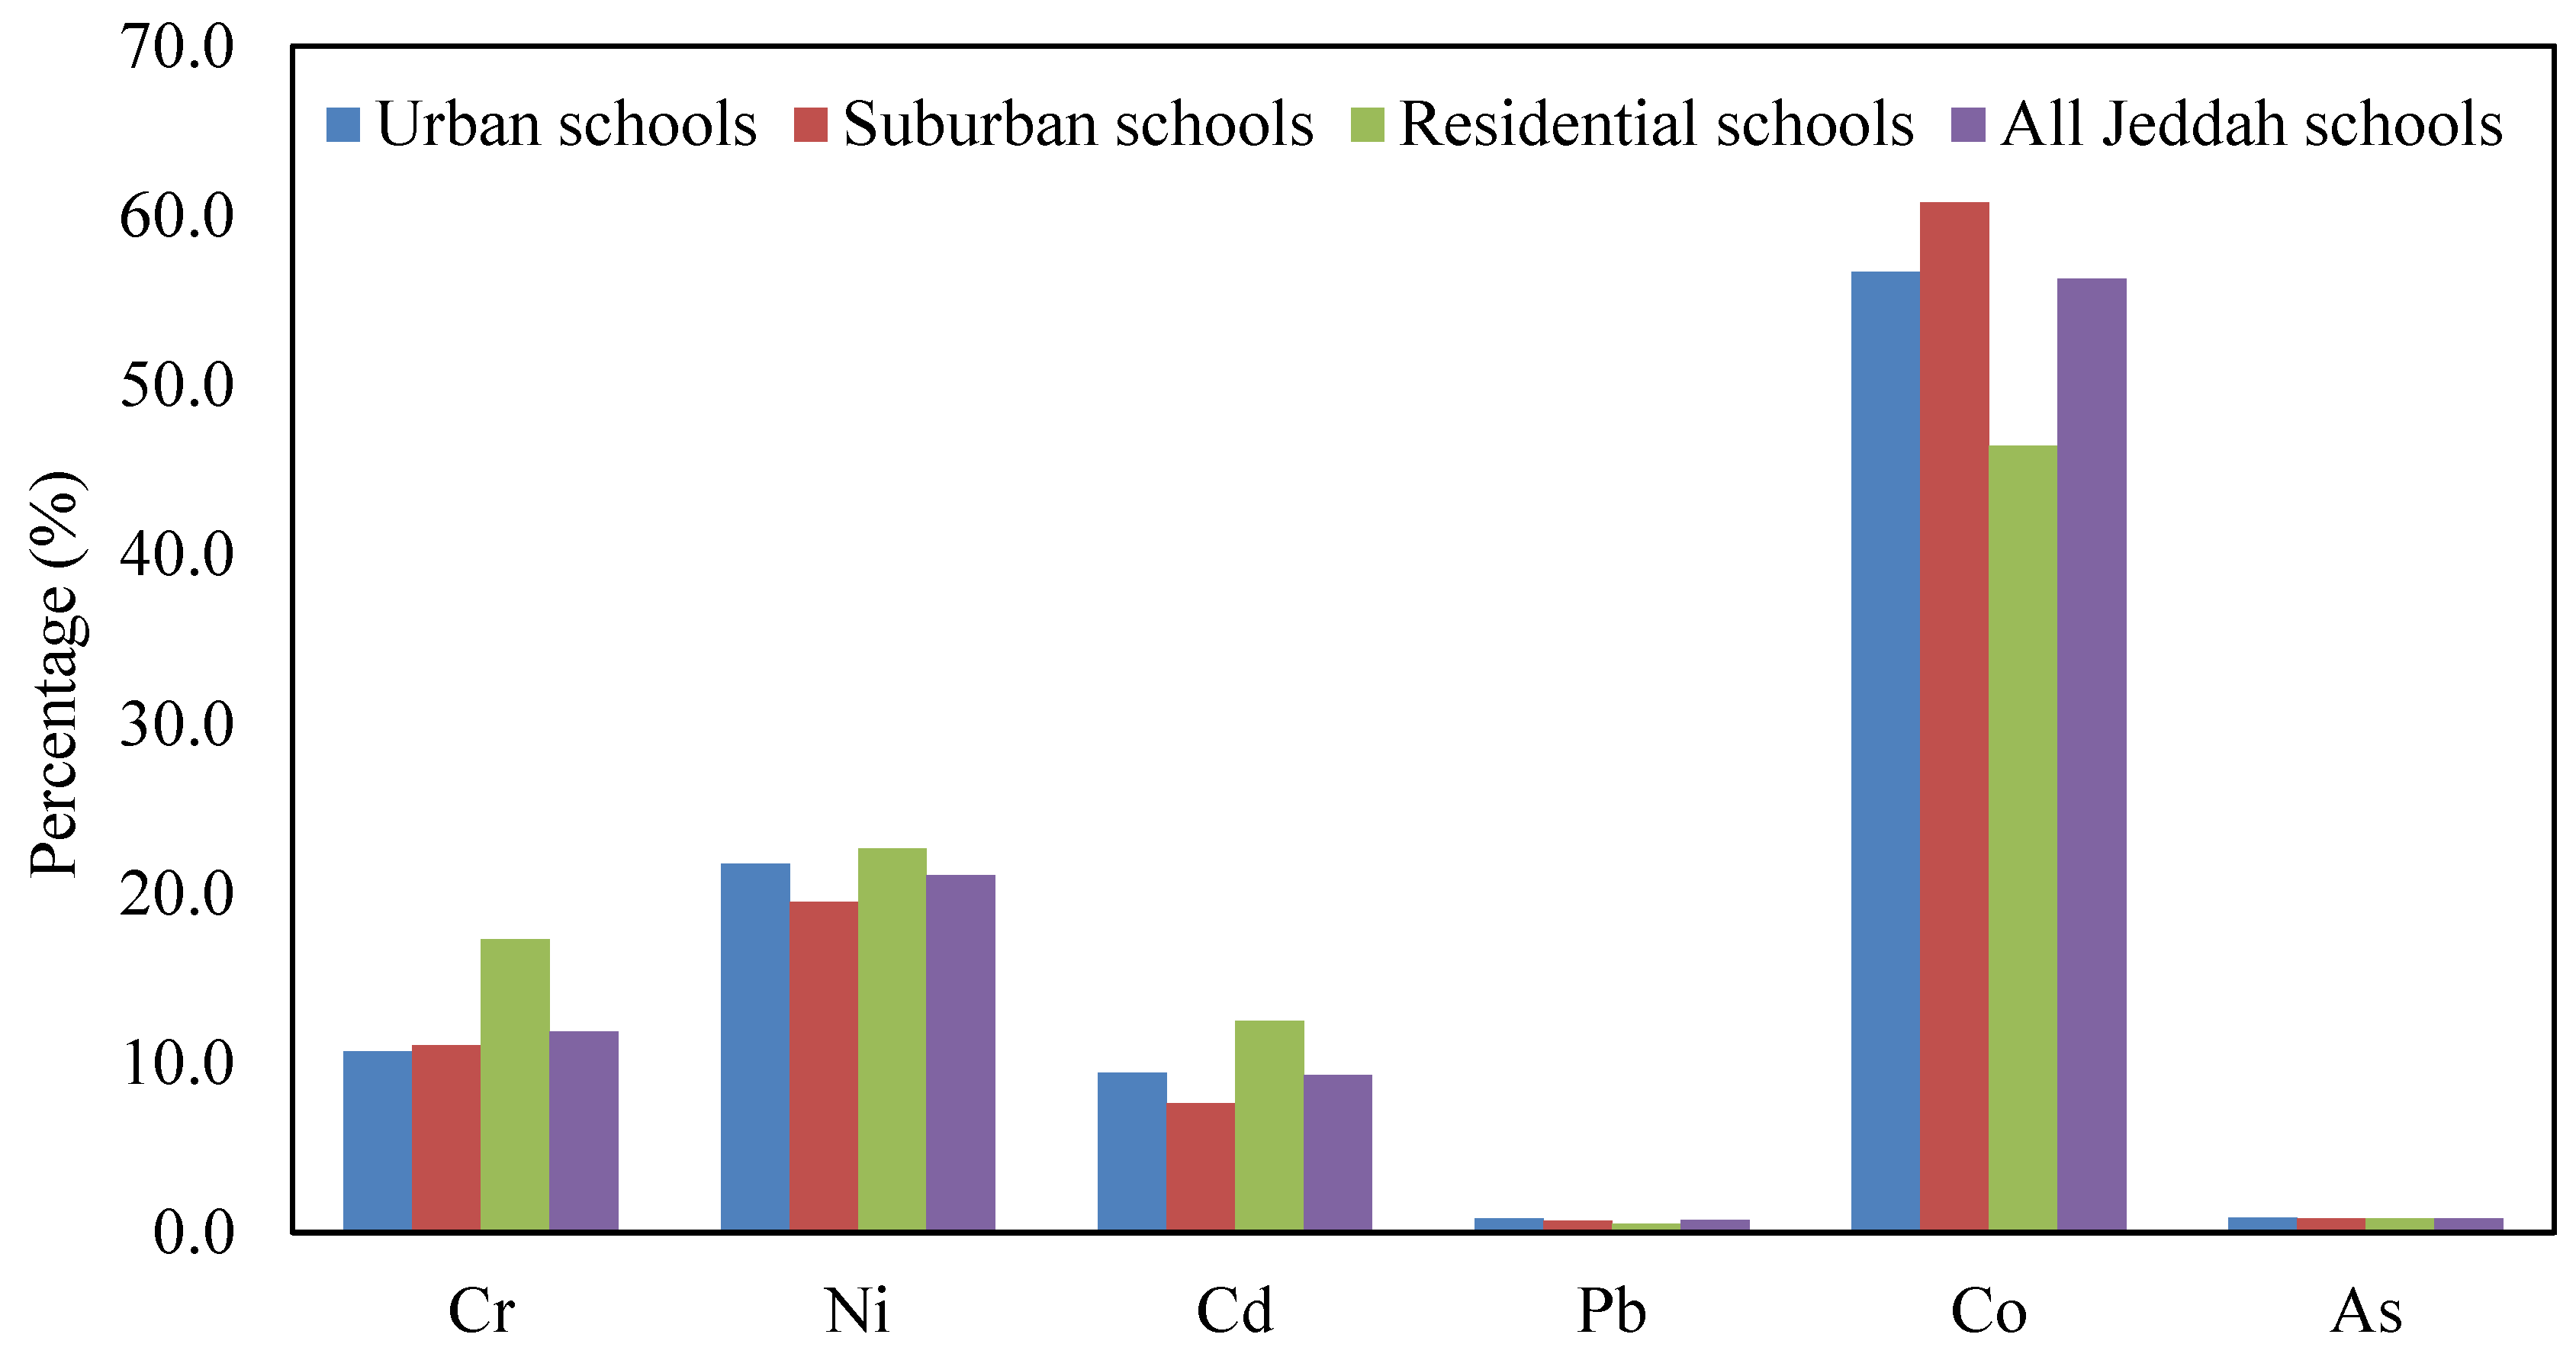
3.3. Health Risk (Non-Carcinogenic and Carcinogenic) Assessment of CACF Particles Heavy Metals

Risk characterization of the possible adverse health effects of human beings exposed to contaminants is a known as a health risk assessment [38]. Health risk (non-carcinogenic) values among children from heavy metal exposure in CACF particles collected from primary schools located in various functional areas in Jeddah through ingestion, inhalation and dermal contact are summarized in Table 6 and Figure 5. Based on the values of hazard quotient (HQ) for the ingestion (HQing), inhalation (HQinh) and dermal (HQdermal) pathways and hazard index (HI) from individual and total heavy metals exposure in CACF particles, the rank order of schools in different functional areas were urban schools > suburban schools > residential schools. Among the heavy metals in the various schools, As, Pb, and Fe, Mn, and Cr, V, and Pb, As displayed higher values for HQing, HQinh, HQdermal, and HI, respectively, compared with other metals. No significant non-carcinogenic risk for children, through ingestion, inhalation and dermal contact pathways, were found in the different schools from exposure to individual and ∑ heavy metals in CACF particles, since the values of HQs and HI for heavy metals were <1 that indicate that there was no non-carcinogenic risk [66].
Based on the mean concentrations of heavy metals in CACF particles collected from all studied Jeddah schools, HQing, HQinh, HQdermal and HI were calculated and are presented in Figure 6. The hazard quotient mean values of heavy metals were in the order of Pb > As > Cr > Mn > V > Cu > Cd > Ni > Zn > Fe > Co for HQing, Fe > Mn > Co ≈ Cr > Pb > As > V > Cu > Cd > Ni > Zn for HQinh, and Cr > V > Pb > Mn > Cd > Fe > As > Cu > Ni > Zn > Co for HQdermal. For HI values the order was Pb > As > Cr > Mn >V > Cd > Fe > Cu > Ni > Zn > Co. The mean relative contribution of individual heavy metal non-cancer to total non-cancer risks in the various schools are presented graphically in Figure 7. From this figure, it can be seen that Pb and As were the predominant contributors to non-cancer effects in the classrooms, and they accounted for 37.9% and 25.8% (urban schools), 34.1% and 27.1% (suburban schools), 22.5% and 13.3% (residential schools), and 33.9% and 25.8% (all Jeddah schools) of the total effects, respectively.
For the non-carcinogenic harmful effects, ingestion was the main pathway of children exposure to heavy metals particles, followed by dermal contact and inhalation. The contribution of the HQing, HQinh and HQdermal to the HI were 95.22%, 1.42% and 3.36% in urban schools, 94.78%, 1.80% and 3.42% in suburban schools, 92.30%, 3.41% and 4.29% in residential schools, and 94.6%, 1.9% and 3.5% in all Jeddah schools, respectively. This indicates that ingestion appeared to be the main route exposure of children to the heavy metals in classroom particles of Jeddah schools, consistent with other reports [17,33,34,105,113]. Tong and Lam [114] reported that dust may easily cling to the skin of children and be ingested unintentionally. In the present study, the calculated HQs and HI values for each metal and ∑HI for all the metals were lower than the safe limit of one, indicating the CACF particles pose no non-carcinogenic effect for children via the various exposure routes. The non-carcinogenic effects for the heavy metals in the present study are consistent with many studies [17,113]. Although the non-carcinogenic risk outcomes from exposure of heavy metals in CACF particles of Jeddah schools were found in the acceptable range suggested by USEPA [74], these heavy metals can cause serious health effect by its accumulation in body tissues [115,116,117]. Even if the values of HI for heavy metals are in safe level; metal exposure in high concentration can cause severe neurological, developmental health effects and increase health risks [118,119]. Sulaiman et al. [90] reported that the increasing of heavy metals might lead to the increasing of health risks values. Therefore, it can proposed that classroom particles monitoring should be done regularly to ensure lower health risks. The output of the present study may provide the initial indication of the risk for children from heavy metal exposure in classroom particles of Jeddah schools.
Cancer risk for children, from exposure of heavy metals particles (Cr, Ni, Cd, Pb, Co and As) collected from various Jeddah schools through ingestion, inhalation and dermal contact way, were calculated and are shown in Table 7 and Figure 8. Based on the values of ingestion lifetime cancer risk (LCRing), inhalation lifetime cancer risk (LCRinh), dermal lifetime cancer risk (LCRdermal) pathways and total lifetime cancer risk (TLCR) from individual and ∑heavy metals exposure in CACF particles, the rank order of schools in functional areas were urban schools > suburban schools > residential schools. Among Cr, Ni, Cd, Pb, Co and As in the various schools, Co and Ni displayed higher values for LCRing, LCRinh, LCRdermal, and TLCR compared with other metals. The values of LCR and TLCR were in increasing order as ingestion > dermal contact > inhalation pathways. These values were within the acceptable level (1 × 10⁻⁶–1 × 10⁻⁴), except the LCRing and TLCR values from exposure to Ni and Cr in urban and suburban schools, Cd in urban schools, and Co in all schools which exceed the acceptable range.
Based on the average Cr, Ni, Cd, Pb, Co and As concentrations in the CACF particles collected from all Jeddah schools, LCRing, LCRinh, LCRdermal, and TLCR were calculated and represented graphically in Figure 8. The lifetime cancer risk values of heavy metals were in the order of Co > Ni > Cr > Cd > As > Pb for LCRing, LCRinh, LCRdermal and TLCR. Only LCRing and TLCR values from exposure of children to ∑carcinogens exceeded the acceptable level (Figure 9). The mean relative contribution of individual heavy metal cancer total cancer risks in different schools are represented graphically in Figure 10. From this figure, it can be shown that Co and Ni were the predominant contributors to cancer effects in the classrooms; they accounted for 56.7% and 21.8% in urban schools, 60.7% and 19.5% in suburban schools, 46.4% and 22.7% in residential schools, and 56.3% and 21.1% in all Jeddah schools of the total cancer effects, respectively. With regard to carcinogenic effects, ingestion appeared to be the main route of children exposure to Cr, Ni, Cd, Pb, Co and As in classroom particles of Jeddah schools, followed by dermal contact and inhalation. The relative contribution of the LCRing, LCRinh and LCRdermal to the TLCR in various schools were similar, they accounted 99.84%, 0.003% and 0.16%, respectively. Similar trends were founded in previous studies [12,17,28].

4. Conclusions

The present study investigated the contamination and risk assessment of heavy metals in CACF particles collected from schools located in various areas in Jeddah. The levels of heavy metals in CACF particles from schools located in urban areas were higher than in those located in suburban and residential areas, which is attributed to the influence of high vehicular traffic emissions around these urban schools. Heavy metal levels in CACF particles in Jeddah schools were in descending order of Fe > Mn > Zn > Pb > Cu > V > Cr > Ni > Co > As and Cd. Based on the calculated CF and PLI values, Zn, Pb, Cd and As have the highest CF values in different schools, whereas the highest PLI value was found in urban schools, indicating more contamination. The calculation results of geo-accumulation index (Igeo) indicate that CACF particles were uncontaminated by Fe, Mn, V, Co, Ni in all Jeddah schools and Cu in residential schools; uncontaminated to moderately contaminated by Cu in urban, suburban and all Jeddah schools and As in residential schools. Moreover, CACF particles were moderately contaminated by Zn and As in suburban schools and Zn and Pb in residential schools and Zn and As in all Jeddah schools, and moderately to heavily contaminated by Zn and As in urban schools, Pb and Cd in suburban schools, Cd in residential schools and Pb and Cd in all Jeddah schools, and heavily contaminated by Pb and Cd in urban schools. According to the estimated EF values, heavy metals in the CACF particles of Jeddah schools demonstrated different degrees of enrichments, with Pb, Zn, Cd, As and Cu the severe enriched by exterior anthropogenic sources like traffic emissions. The HI values from exposure to CACF particles heavy metals were in the following order Pb > As > Cr > Mn > V > Cd > Fe > Cu > Ni > Zn > Co for non-carcinogenic risk, whereas TLCR values in the order of Co > Ni > Cr > Cd > As > Pb for carcinogenic risk in Jeddah schools. The major route of exposure to heavy metals that leading to both carcinogenic and non-carcinogenic risks is through ingestion followed by dermal and inhalation pathway. Co (56.3%) and Ni (21.1%) were the predominant contributors to cancer effects, whereas Pb (33.9%) and As (25.8%) were the predominant contributors to non-cancer effects in Jeddah schools. HQs and HI values from exposure to individual and total heavy metals in different schools were lower than the safe level (<1), suggesting that no non-carcinogenic risks were posed. LCR and TLCR values were within the acceptable level (1 × 10⁻⁶–1 × 10⁻⁴), except the LCRing and TLCR values from exposure to Ni and Cr in urban and suburban schools, Cd in urban schools, and Co in all schools which exceed the acceptable range. Only LCRing and TLCR values from exposure of children to ∑carcinogens exceed the acceptable level. Carcinogenic and non-carcinogenic risks rank order of schools in functional areas were urban schools > suburban schools > residential schools.
It can be concluded that the health risks might increase if the heavy metal concentrations increase too. Therefore, even if there are no significant potential health risks from exposure to heavy metals in Jeddah schools, classroom particle monitoring should be done regularly to ensure lower health risks. The output of the present study may provide an initial indication of the risk for children from heavy metal exposure in classroom particles of Jeddah schools.

Author Contributions

M.A.A., S.K.H. and M.I.K. designed the study and supervised execution of the work. S.K.H. M.I.K., F.M.A., N.A.A. executed the work and analyzed the data. M.A.A., S.K.H., F.M.A. and M.I.K. wrote the manuscript. M.A.A., S.K.H., M.I.K. and F.M.A. contributed to the manuscript preparation and proofreading. All authors approved the final version of the manuscript.

Funding

This research was funded by Deanship of Scientific Research (DSR) at King Abdulaziz University, Jeddah, under grant no. (I-122-30).

Acknowledgments

The authors acknowledge with thanks DSR for technical and financial support.

Conflicts of Interest

The authors have no actual or potential conflict of interest including any financial, personal or other relationships with other people or organizations within three years of beginning the submitted work that could inappropriately influence, or be perceived to influence, their work.

References

  1. Beko, G.; Halas, O.; Clausen, G.; Weschler, C.J. Initial studies of oxidation processes on filter surfaces and their impact on perceived air quality. Indoor Air 2006, 16, 56–64. [Google Scholar] [CrossRef] [PubMed]
  2. Huang, M.; Wang, W.; Chan, C.Y.; Cheung, K.C.; Man, Y.B.; Wang, X.; Wong, M.H. Contamination and risk assessment (based on bioaccessibility via ingestion and inhalation) of metal (loid)s in outdoor and indoor particles from urban centers of Guangzhou, China. Sci. Total Environ. 2014, 479, 117–124. [Google Scholar] [CrossRef] [PubMed]
  3. Verdenelli, M.C.; Cecchini, C.; Orpianesi, C.; Dadea, G.M.; Cresci, A. Efficacy of antimicrobial filter treatments on microbial colonization of air panel filters. J. Appl. Microbiol. 2003, 94, 9–15. [Google Scholar] [CrossRef] [Green Version]
  4. Butte, W.; Heinzow, B. Pollutants in house dust as indicators of indoor contamination. Rev. Environ. Contam. Toxicol. 2001, 175, 1–46. [Google Scholar]
  5. Morawska, L.; Salthammer, T. (Eds.) Indoor Environment: Airborne Particles and Settled Dust; Wiley-VCH: Weinheim, Germany, 2003. [Google Scholar]
  6. See, S.W.; Karthikeyana, S.; Balasubramanian, R. Health risk assessment of occupational exposure to particulate-phase polycyclic aromatic hydrocarbons associated with Chinese, Malay and Indian cooking. J. Environ. Monit. 2006, 8, 369–376. [Google Scholar] [CrossRef]
  7. Gramotnev, G.; Ristovski, Z. Experimental investigation of ultra-fine particle size distribution near a busy road. Atmos. Environ. 2004, 38, 1767–1776. [Google Scholar] [CrossRef] [Green Version]
  8. Latif, M.T.; Othman, M.R.; Kim, C.L.; Murayadi, S.A.; Sahaimi, K.N.A. Composition of household dust in semi-urban areas in Malaysia. Indoor Built Environ. 2009, 18, 155–161. [Google Scholar] [CrossRef]
  9. Hochstetler, H.A.; Yermakov, M.; Reponen, T.; Ryan, P.H.; Grinshpun, S.A. Aerosol particles generated by diesel-powered school buses at urban schools as a source of children’s exposure. Atmos. Environ. 2011, 45, 1444–1453. [Google Scholar] [CrossRef] [Green Version]
  10. Aucott, M.; Caldarelli, A. Quantity of lead released to the environment in New Jersey in the form of motor vehicle wheel weights. Water Air Soil Pollut. 2012, 223, 1743–1752. [Google Scholar] [CrossRef]
  11. Latif, M.T.; Saw, M.Y.; Saad, A.; Mohamad, N.; Baharuddin, N.H.; Mokhtar, M.; Tahir, N.M. Composition of heavy metals in indoor dust and their possible exposure: A case study of preschool children in Malaysia. Air Qual. Atmos. Health 2014, 7, 181–193. [Google Scholar] [CrossRef]
  12. Tan, S.Y.; Praveena, S.M.; Abidin, E.Z.; Cheema, M.S. Heavy metal quantification of classroom dust in school environment and its impacts on children health from Rawang (Malaysia). Environ. Sci. Pollut. Res. 2018, 25, 34623–34635. [Google Scholar] [CrossRef] [PubMed]
  13. Abdul-Wahab, S.A. Indoor and outdoor relationships of atmospheric particulates in Oman. Indoor Built Environ. 2006, 15, 247–255. [Google Scholar] [CrossRef]
  14. Pekey, H.; Pekey, B.; Arslanbaş, D.; Bozkurt, Z.B.; Doğan, G.; Tuncel, G. Source apportionment of personal exposure to fine particulate matter and volatile organic compounds using positive matrix factorization. Water Air Soil Pollut. 2012, 224, 1403. [Google Scholar] [CrossRef]
  15. Dundar, M.S.; Altundag, H. Heavy metal determinations of house dusts in Adapazari city, Turkey after earthquake. Trace Elem. Electrolytes 2002, 19, 55–58. [Google Scholar]
  16. Chen, X.; Xia, X.; Zhao, Y.; Zhang, P. Heavy metal concentrations in roadside soils and correlation with urban traffic in Beijing, China. J. Hazard Mater. 2010, 181, 640–646. [Google Scholar] [CrossRef]
  17. Olujimi, O.; Steiner, O.; Goessler, W. Pollution indexing and health risk assessments of trace elements in indoor dusts from classrooms, living rooms and offices in Ogun State, Nigeria. J. Afr. Earth Sci. 2015, 101, 396–404. [Google Scholar] [CrossRef]
  18. Isaxon, C.; Gudmundsson, A.; Nordin, E.Z.; Lonnblad, L.; Dahl, A.; Wieslander, G.; Bohgard, M.; Wierzbicka, A. Contribution of indoor-generated particles to residential exposure. Atmos. Environ. 2015, 106, 458–466. [Google Scholar] [CrossRef]
  19. Ullah, H.; Liu, G.; Yousaf, B.; Ubaid, M.; Abbas, Q. Combustion characteristics and retention-emission of selenium during co-fi ring of torre fi ed biomass and its blends with high ash coal. Bioresour. Technol. 2017, 245, 73–80. [Google Scholar] [CrossRef]
  20. Tiittanen, P.; Timonen, K.L.; Ruuskanen, J.; Mirme, A.; Pekkanen, J. Fine particulate air pollution, resuspended road dust and respiratory health among symptomatic children. Eur. Resp. J. 1999, 13, 266–273. [Google Scholar] [CrossRef] [Green Version]
  21. Adachi, K.; Tainosho, Y. Characterization of heavy metal particles embedded in tire dust. Environ. Int. 2004, 30, 1009–1017. [Google Scholar] [CrossRef]
  22. Al-Khashman, O.A. The investigation of metal concentrations in street dust samples in Aqaba city, Jordan. Environ. Geochem. Health 2007, 29, 197–207. [Google Scholar] [CrossRef] [PubMed]
  23. Gaudry, A.; Moskura, M.; Mariet, C.; Ayrault, S.; Denayer, F.; Bernard, N. Inorganic pollution in PM10 particles collected over three french sites under various influences: Rural conditions, traffic and industry. Water Air Soil Pollut. 2008, 193, 91–106. [Google Scholar] [CrossRef]
  24. Yousaf, B.; Liu, G.; Abbas, Q.; Wang, R.; Ubaid, M.; Ullah, H.; Liu, R.; Zhou, C. Systematic investigation on combustion characteristics and emission-reduction mechanism of potentially toxic elements in biomass-and biochar-coal cocombustion systems. Appl. Energy 2017, 208, 142–157. [Google Scholar] [CrossRef]
  25. Patel, M.; Azanza Ricardo, C.L.; Scardi, P.; Aswath, P.B. Morphology, structure and chemistry of extracted diesel sootdPart I: Transmission electron microscopy, Raman spectroscopy, X-ray photoelectron spectroscopy and synchrotron X-ray diffraction study. Tribol. Int. 2012, 52, 29–39. [Google Scholar] [CrossRef]
  26. Kumpiene, J.; Brännvall, E.; Taraskevicius, R.; Aksamitauskas, C.; Zinkute, R. Spatial variability of topsoil contamination with trace elements in preschools in Vilnius, Lithuania. J. Geochem. Explor. 2011, 108, 15–20. [Google Scholar] [CrossRef]
  27. Popoola, O.E.; Bamgbose, O.; Okonkwo, O.J.; Arowolo, T.A.; Popoola, A.O.; Awofolu, O.R. Heavy metals content in classroom dust of some public primary schools in metropolitan Lagos, Nigeria. Res. J. Environ. Earth Sci. 2012, 4, 460–465. [Google Scholar]
  28. Praveena, S.M.; Abdul Mutalib, N.S.; Aris, A.Z. Determination of heavy metals in indoor dust from primary school (Sri Serdang, Malaysia): Estimation of the health risks. Environ. Forensics 2015, 16, 257–263. [Google Scholar] [CrossRef]
  29. Divrikli, U.; Soylak, M.; Elci, L.; Dogan, M. The investigation of trace heavy metal concentrations in the street dust samples collected from Kayseri, Turkey. J. Trace Microprobe Tech. 2003, 21, 713–720. [Google Scholar] [CrossRef]
  30. Shi, G.; Chen, Z.; Bi, C.; Wang, L.; Teng, J.; Li, Y.; Xu, S. A comparative study of health risk of potentially toxic metals in urban and suburban road dust in the most populated city of China. Atmos. Environ. 2011, 45, 764–771. [Google Scholar] [CrossRef]
  31. Massey, D.; Kulshrestha, A.; Taneja, A. Particulate matter concentrations and their related metal toxicity in rural residential environment of semi-arid region of India. Atmos. Environ. 2013, 67, 278–286. [Google Scholar] [CrossRef]
  32. Mass, S.; Scheifler, R.; Benslama, M.; Crini, N.; Lucot, E.; Brahmia, Z.; Benyacoub, S.; Giraudoux, P. Spatial distribution of heavy metals concentrations in urban, suburban and agricultural soils in Mediterranean city of Algeria. Environ. Pollut. 2010, 152, 73–81. [Google Scholar] [CrossRef] [PubMed]
  33. Zheng, N.; Liu, J.; Wang, Q.; Liang, Z. Health risk assessment of heavy metal exposure to street dust in the zinc smelting district, Northeast of China. Sci. Total Environ. 2010, 408, 726–733. [Google Scholar] [CrossRef] [PubMed]
  34. Zheng, N.; Liu, J.; Wang, Q.; Liang, Z. Heavy metals exposure of children from stairway and sidewalk dust in the smelting district, northeast of China. Atmos. Environ. 2010, 44, 3239–3245. [Google Scholar] [CrossRef]
  35. Li, H.-H.; Chen, L.-J.; Yu, L.; Guob, Z.-B.; Shan, C.-Q.; Lin, J.-Q.; Gu, Y.-G.; Yang, Z.-B.; Yang, Y.-X.; Shao, J.-R.; et al. Pollution characteristics and risk assessment of human exposure to oral bioaccessibility of heavy metals via urban street dusts from different functional areas in Chengdu, China. Sci. Total Environ. 2017, 586, 1076–1084. [Google Scholar] [CrossRef]
  36. Ali, M.U.; Liu, G.; Yousaf, B.; Abbas, Q.; Ullah, H.; Munir, M.A.M.; Fu, B. Pollution characteristics and human health risks of potentially (eco) toxic elements (PTEs) in road dust from metropolitan area of Hefei, China. Chemosphere 2017, 181, 111–121. [Google Scholar] [CrossRef]
  37. Shabbaj, I.I.; Alghamdi, M.A.; Shamy, M.; Hassan, S.K.; Alsharif, M.M.; Khoder, M.I. Risk assessment and implication of human exposure to road dust heavy metals in Jeddah, Saudi Arabia. Int. J. Environ. Res. Public Health 2018, 15, 36. [Google Scholar] [CrossRef] [Green Version]
  38. Luo, X.; Jing-Ding, J.; Xu, B.; Wang, Y.; Li, H.; Yu, S. Incorporating bioaccessibility into human health risk assessments of heavy metals in urban park soils. Sci. Total Environ. 2012, 424, 88–96. [Google Scholar] [CrossRef]
  39. Rosbach, J.; Vonk, M.; Duijm, F.; Ginkel, J.T.; Gehring, U.; Brunekreef, B.A. Ventilation intervention study in classrooms to improve indoor air quality: The FRESH study. Environ. Health 2013, 12, 110. [Google Scholar] [CrossRef] [Green Version]
  40. Mohai, P.; Kweon, B.S.; Lee, S.; Ard, K. Air pollution around schools is linked to poorer student health and academic performance. J. Epidemiol. Community Health 2011, 65, 852–862. [Google Scholar] [CrossRef] [Green Version]
  41. Tahir, N.M.; Chee, P.S.; Jaafar, M. Determination of heavy metals content in soils and indoor dusts from nurseries in Dungun, Terengganu Malaysian. J. Anal. Sci. 2007, 11, 280–286. [Google Scholar]
  42. Jeddah CPI Profile: Future Saudi Cities Programme (FSCP). The United Nations Human Settlements Programme (UN-HABITAT) and Ministry of Municipal and Rural Affairs in the Kingdom of Saudi Arabia (MOMRA). 2018. Available online: https://www.futuresaudicities.org/cpi-reports/CPI%20Profile%20for%20Jeddah.pdf (accessed on 15 September 2019).
  43. Notaro, M.; Alkolibi, F.; Fadda, E.; Bakhrjy, F. Trajectory analysis of Saudi Arabian dust storms. J. Geophys. Res. Atmos. 2013, 118, 6028–6043. [Google Scholar] [CrossRef]
  44. Alghamdi, M.A.; Almazroui, M.; Shamy, M.; Ana Redal, M.; Alkhalaf, A.K.; Hussein, M.A.; Khoder, M.I. Characterization and elemental composition of atmospheric aerosol loads during springtime dust storm in western Saudi Arabia. Aerosol Air Qual. Res. 2015, 15, 440–453. [Google Scholar] [CrossRef] [Green Version]
  45. Albugami, S.; Palmer, S.; Cinnamon, J.; Meersmans, J. Spatial and temporal variations in the incidence of dust storms in saudi arabia revealed from in situ observations. Geosciences 2019, 9, 162. [Google Scholar] [CrossRef] [Green Version]
  46. Lim, C.C.; Thurston, G.D.; Shamy, M.; Alghamdi, M.; Khoder, M.; Mohorjy, A.M.; Alkhalaf, A.K.; Brocato, J.; Chen, L.C.; Costa, M. Temporal variation of fine and coarse particulate matter sources in Jeddah, Saudi Arabia. J. Air Waste Manag. Assoc. 2018, 68, 123–138. [Google Scholar] [CrossRef] [PubMed] [Green Version]
  47. Ali, M.U.; Liu, G.; Yousaf, B.; Abbas, Q.; Ullah, H.; Munir, M.A.M.; Zhang, H. Compositional characteristics of black-carbon and nanoparticles in air-conditioner dust from an inhabitable industrial metropolis. J. Clean. Prod. 2018, 180, 34–42. [Google Scholar] [CrossRef]
  48. Lee, P.K.; Touray, J.C. Characteristics of a polluted artificial soil located along a motorway and effects of acidification on the leaching behavior of heavy metals (Pb, Zn, Cd). Water Res. 1998, 32, 3425–3435. [Google Scholar] [CrossRef]
  49. Liu, E.; Yan, T.; Birch, G.; Zhu, Y. Pollution and health risk of potentially toxic metals in urban road dust in Nanjing, a mega-city of China. Sci. Total Environ. 2014, 476, 522–531. [Google Scholar] [CrossRef]
  50. Li, H.; Zuo, X.J. Speciation and size distribution of copper and zinc in urban road runoff. Bull. Environ. Contam. Toxicol. 2013, 90, 471–476. [Google Scholar] [CrossRef]
  51. Soltani, N.; Keshavarzi, B.; Moore, F.; Tavakol, T.; Lahijanzadeh, A.R.; Jaafarzadeh, N.; Kermani, M. Ecological and human health hazards of heavy metals and polycyclic aromatic hydrocarbons (PAHs) in road dust of Isfahan metropolis, Iran. Sci. Total Environ. 2015, 505, 712–723. [Google Scholar] [CrossRef]
  52. Guillén, M.T.; Delgado, J.; Albanese, S.; Nieto, J.M.; Lima, A.; De Vivo, B. Environmental geochemical mapping of Huelva municipality soils (SW Spain) as a tool to determine background and baseline values. J. Geochem. Explor. 2011, 109, 59–69. [Google Scholar] [CrossRef]
  53. Mmolawa, K.B.; Likuku, A.S.; Gaboutloeloe, G.K. Assessment of heavy metal pollution in soils along major roadside areas in Botswana. Afr. J. Environ. Sci. Technol. 2011, 5, 186–196. [Google Scholar]
  54. Tomlinson, D.L.; Wilson, J.G.; Harris, C.R.; Jeffrey, D.W. Problems in the assessment of heavy-metal levels in estuaries and the formation of a pollution index. Helgoländer Meeresuntersuchungen 1980, 33, 566. [Google Scholar] [CrossRef] [Green Version]
  55. Müller, G. Die Schwermetallbelastung der Sedimente des Neckars und seiner Nebenflüsse Eine Bestandsaufnahme. Chemiker Zeitung 1981, 6, 157–164. [Google Scholar]
  56. Wei, X.; Gao, B.; Wang, P.; Zhou, H.; Lu, J. Pollution characteristics and health risk assessment of heavy metals in street dusts from different functional areas in Beijing, China. Ecotoxicol. Environ. Saf. 2015, 112, 186–192. [Google Scholar] [CrossRef] [PubMed]
  57. Wei, B.; Yang, L. A review of heavy metal contaminations in urban soils, urban road dusts and agricultural soils from China. Microchem. J. 2010, 94, 99–107. [Google Scholar] [CrossRef]
  58. Müller, G. Schwermetalle in den sedimenten des Rheins-Veranderungenseit. Umsch Wiss Tech. 1979, 79, 778–783. [Google Scholar]
  59. Taylor, S.R. Abundance of chemical elements in the continental crust: A new table. Geochim. Cosmochim. Acta 1964, 28, 1273–1285. [Google Scholar] [CrossRef]
  60. Yongming, H.; Peixuan, D.; Junji, C.; Posmentier, E.S. Multivariate analysis of heavy metal contamination in urban dusts of Xi’an, Central China. Sci. Total Environ. 2006, 355, 176–186. [Google Scholar] [CrossRef]
  61. Yuen, J.Q.; Olin, P.H.; Lim, H.S.; Benner, S.G.; Sutherland, R.A.; Ziegler, A.D. Accumulation of potentially toxic elements in road deposited sediments in residential and light industrial neighborhoods of Singapore. J. Environ. Manag. 2012, 101, 151–163. [Google Scholar] [CrossRef]
  62. Taylor, S.R.; McLennan, S.M. The Continental Crust: Its Composition and Evolution; Blackwell Scientific Publications: Oxford, UK, 1985. [Google Scholar]
  63. Birch, G.F.; Olmos, M.A. Sediment-bound heavy metals as indicators of human influence and biological risk in coastal water bodies. ICES J. Mar. Sci. 2008, 65, 1407–1413. [Google Scholar] [CrossRef]
  64. Chen, C.-W.; Kao, C.-M.; Chen, C.-F.; Dong, C.-D. Distribution and accumulation of heavy metals in the sediments of Kaohsiung Harbor, Taiwan. Chemosphere 2007, 66, 1431–1440. [Google Scholar] [CrossRef] [PubMed]
  65. United States Environmental Protection Agency (USEPA). Superfund Public Health Evaluation Manual; EPA/540/1–86; U.S. Environmental Protection Agency: Washington, DC, USA, 1986.
  66. United States Environmental Protection Agency (USEPA). Supplemental Guidance for Developing Soil Screening Levels for Superfund Sites; OSWER 9355.4-24; Office of Solid Waste and Emergency Response: Washington, DC, USA, 2001.
  67. United States Environmental Protection Agency (USEPA). Human Risk Assessment User Guideline of Human Risk Assessment. 2012. Available online: http://www.epa.gov/reg3hwmd/risk/human/rb-concentration_table/usersguide.htm (accessed on 12 August 2019).
  68. United States Environmental Protection Agency (USEPA). Exposure Factors Handbook; PA/600/P-95/002F; EPA; Office of Research and Development: Washington, DC, USA, 1997.
  69. United States Environmental Protection Agency (USEPA). Soil Screening Guidance: Technical Background Documen; EPA/540/ R-95/128; Office of Solid Waste and Emergency Response: Washington, DC, USA, 1996.
  70. United States Environmental Protection Agency (USEPA). Risk Assessment Guidancefor Superfund: Volume III—Part A, Process for Conducting Probabilistic Risk Assessment; EPA540-R-02-002; U.S. Environmental Protection Agency: Washington, DC, USA, 2001.
  71. United States Environmental Protection Agency (USEPA). Child-Specific Exposure Factors Handbook; EPA-600-P-00-002B; National Center for Environmental Assessment: Washington, DC, USA, 2001.
  72. United States Environmental Protection Agency (USEPA). Reference Dose (RfD): Description and Use in Health Risk Assessments; Background Document 1 A; Integrated Risk Information System (IRIS): Washington, DC, USA, 1993.
  73. United States Environmental Protection Agency (USEPA). Estimation of Relative Bioavailablity of Lead in Soil and Soil-Like Materials Using in Vivo and in Vitro Methods; OSWER 9285.7-77; Office of SolidWaste and Emergency Response, U.S. Environmental Protection Agency: Washington, DC, USA, 2010.
  74. United States Environmental Protection Agency (USEPA). Risk Assessment Guidance for Superfund, Volume I: Human Health Evaluation Manual (Part A); EPA/540/1-89/002; Office of Emergency and Remedial Response: Washington, DC, USA, 1989.
  75. Chen, X.; Lu, X.; Yang, G. Sources identification of heavy metals in urban topsoil from inside the Xi’an second ring road, NW China using multivariate statistical methods. Catena 2012, 98, 73–78. [Google Scholar] [CrossRef]
  76. United States of Environmental Protection Agency (USEPA). Supplemental Guidance for Developing Soil Screening Levels for Superfund Sites; OSWER 9355/4-24; Office of Emergency and Remedial Response: Washington, DC, USA, 2002.
  77. ESAG. Environmental Site Assessment Guideline; DB11/T656-2009; Adelaide Airport: Adelaide, Australia, 2009. (In Chinese)
  78. Van den Berg, R. Human Exposure to Soil Contamination: A Qualitative and Quantitative Analysis towards Proposals for Human Toxicological Intervention Values; RIVM Report No. 725201011; National Institute of Public Health and Environmental Protection (RIVM): Bilthoven, The Netherlands, 1995. [Google Scholar]
  79. Li, X.; Poon, C.; Liu, P.S. Heavy metal concentration of urban soils and street dusts in Hong Kong. Appl. Geochem. 2001, 16, 1361–1368. [Google Scholar] [CrossRef]
  80. Li, R.Z.; Zhou, A.J.; Tong, F.; Wu, Y.D.; Zhang, P.; Yu, J. Distribution of metals in urban dusts of Hefei and health risk assessment. Chin. J. Environ. Sci. 2011, 32, 2661–2668. [Google Scholar]
  81. United States Environmental Protection Agency (USEPA). Child-Specific Exposure Factors Handbook; EPA-600-P-00e002B; National Center for Environmental Assessment: Washington, DC, USA, 2002.
  82. Peng, C.; Chen, W.; Liao, X.; Wang, M.; Ouyang, Z.; Jiao, W.; Bai, Y. Polycyclic aromatic hydrocarbons in urban soils of Beijing: Status, sources, distribution and potential risk. Environ. Pollut. 2011, 159, 802–808. [Google Scholar] [CrossRef] [PubMed]
  83. US Department of Energy. RAIS: Risk Assessment Information System; US Department of Energy, Office of Environmental Management: Washington, DC, USA, 2000.
  84. Hu, X.; Zhang, Y.; Luo, J.; Wang, T.J.; Lian, H.Z.; Ding, Z.H. Bioaccessibility and health risk of ar senic, mercury and other metals in urban street dusts from a mega-city, Nanjing, China. Environ. Pollut. 2011, 159, 1215–1221. [Google Scholar] [CrossRef] [PubMed]
  85. Lu, X.; Wang, L.; Li, L.Y.; Lei, K.; Huang, L.; Kang, D. Multivariate statistical analysis of heavy metals in street dust of Baoji NW China. J. Hazard. Mater. 2010, 173, 744–749. [Google Scholar] [CrossRef]
  86. BMRIEP (Beijing Municipal Research Institute of Environmental Protection). Environmental Site Assessment Guideline; DB11/T656–2009; Beijing Municipal Administration of Quality and Technology Supervision: Beijing, China, 2009. (In Chinese)
  87. United States Environmental Protection Agency (USEPA). Supplemental Guidance for Developing Soil Screening Levels for Superfund Sites; Office of Solid Waste and Emergency Response (OSWER): Washington, DC, USA, 2011.
  88. Man, Y.B.; Sun, X.L.; Zhao, Y.G.; Lopez, B.N.; Chung, S.S.; Wu, S.C. Health risk assessment of abandoned agricultural soils based on heavy metal contents in Hong Kong, the world’s most populated city. Environ. Int. 2010, 36, 570–576. [Google Scholar] [CrossRef]
  89. Kabata-Pendias, A. Trace Elements in Soils and Plants; CRC Press: Boca Raton, FL, USA, 2010. [Google Scholar]
  90. Sulaiman, F.R.; Bakri, N.I.F.; Nazmi, N.; Latif, M.T. Assessment of heavy metals in indoor dust of a university in a tropical environment. Environ. Forensics 2017, 18, 74–82. [Google Scholar] [CrossRef]
  91. Ardashiri, S.; Hashem, S.E. Health risk assessment of heavy metals in indoor dust from Bushehr, Iran. Iran. J. Health Saf. Environ. 2017, 5, 966–971. [Google Scholar]
  92. Yap, C.K.; Krishnan, T.; Chew, W. Heavy metal concentrations in ceiling fan dusts sampled at schools around Serdang Area, Selangor. Sains Malays. 2011, 40, 569–575. [Google Scholar]
  93. Darus, F.M.; Nasir, R.A.; Sumari, S.M.; Ismail, Z.S.; Omar, N.A. Heavy metals composition of indoor dust in nursery schools building. Procedia Soc. Behav. Sci. 2012, 38, 169–175. [Google Scholar] [CrossRef] [Green Version]
  94. Del Rio Salas, R.; Ruiz, J.; De la O-Villanueva, M.; Valencia Moreno, M.; Moreno Rodríguez, V.; Gómez Alvarez, A.; Grijalva, T.; Mendivil, H.; Paz-Moreno, F.; Meza-Figueroa, D. Tracing geogenic and anthropogenic sources in urban dusts: Insights from lead isotopes. Atmos. Environ. 2012, 60, 202–210. [Google Scholar] [CrossRef]
  95. Trujillo-Gonzalez, J.M.; Torres-Mora, M.A.; Keesstra, S.; Brevik, E.C.; Jimenez-Ballesta, R. Heavy metal accumulation related to population density in road dust samples taken from urban sites under different land uses. Sci. Total Environ. 2016, 553, 636–642. [Google Scholar] [CrossRef]
  96. Othman, F.; Chowdhury, M.S.U.; Sakai, N.; Shaaban, M.G.; Shimizu, Y. Identification of pollution loading in a tropical river basin: A case study of Selangor River, Malaysia. WIT Trans. Built Environ. 2014, 156, 95–102. [Google Scholar]
  97. Ong, J.; Yean, T.H.; Mahmood, N.Z. Industrial wastestudy in Rawang industrial area. In Proceedings of the 2015 International Conference on Biological and Environmental Science, Phuket, Thailand, 1–3 October 2015; pp. 60–67. [Google Scholar]
  98. Charlesworth, S.; Everett, M.; McCarthy, R.; Ordóñez, A.; de Miguel, E. A comparative study of heavy metal concentration and distribution in deposited street dusts in a large and a small urban area: Birmingham and Coventry, West Midlands, UK. Environ. Int. 2003, 29, 563–573. [Google Scholar] [CrossRef]
  99. Dao, L.; Morrison, L.; Zhang, C. Spatial variation of urban soil geochemistry in a roadside sports ground in Galway, Ireland. Sci. Total Environ. 2010, 408, 1076–1084. [Google Scholar] [CrossRef]
  100. Yousaf, B.; Liu, G.; Wang, R.; Imtiaz, M.; Rizwan, M.S.; Zia-ur-rehman, M.; Qadir, A.; Si, Y. The importance of evaluating metal exposure and predicting human health risks in urban e periurban environments in fluenced by emerging industry. Chemosphere 2016, 150, 79–89. [Google Scholar] [CrossRef]
  101. Imperato, M.; Adamo, P.; Naimo, D.; Arienzo, M.; Stanzione, D.; Violante, P. Spatial distribution of heavy metals in urban soils of Naples city (Italy). Environ. Pollut. 2003, 124, 247–256. [Google Scholar] [CrossRef]
  102. Tan, S.Y.; Praveena, S.M.; Abidin, E.Z.; Cheema, M.S. A review of heavy metals in indoor dust and its human health-risk implications. Rev. Environ. Health 2016, 31, 447–456. [Google Scholar] [CrossRef] [Green Version]
  103. Al-Rajhi, M.A.; Seaward, M.R.D.; Al-Aamar, A.S. Metal levels in indoor and outdoor dust in Riyadh, Saudi Arabia. Environ. Int. 1996, 22, 315–324. [Google Scholar] [CrossRef]
  104. Hassan, S.K.M. Metal concentrations and distribution in the household, stairs and entryway dust of some Egyptian homes. Atmos. Environ. 2012, 54, 207–215. [Google Scholar] [CrossRef]
  105. Ferreira-Baptista, L.; De Miguel, E. Geochemistry and risk assessment of street dust in Luanda, Angola: A tropical urban environment. Atmos. Environ. 2005, 39, 4501–4512. [Google Scholar] [CrossRef] [Green Version]
  106. Hjortenkrans, D.; Bergback, B.; Haggerud, A. New metal emission patterns in road traffic environments. Environ. Monit. Assess. 2006, 117, 85–98. [Google Scholar] [CrossRef] [PubMed]
  107. Almeida, S.M.; Pio, C.A.; Freitas, M.C.; Reis, M.A.; Trancoso, M.A. Source apportionment of atmospheric urban aerosol based on weekdays/weekend variability: Evaluation of road re-suspendeddust contribution. Atmos. Environ. 2006, 40, 2058–2067. [Google Scholar] [CrossRef]
  108. Duong, T.T.T.; Lee, B.K. Determining contamination level of heavy metals in road dust from busy traffic areas with different characteristics. J. Environ. Manag. 2011, 92, 554–562. [Google Scholar] [CrossRef]
  109. Han, S.; Bian, H.; Feng, Y.; Liu, A.; Li, X.; Zeng, F.; Zhang, X. Analysis of the relationship between O3, NO and NO2 in Tianjin, China. Aerosol Air Qual. Res. 2011, 11, 128–139. [Google Scholar] [CrossRef] [Green Version]
  110. Cao, Z.; Chen, Q.; Wang, X.; Zhang, Y.; Wang, S.; Wang, M.; Zhao, L.; Yan, G.; Zhang, X.; Zhang, Z.; et al. Contamination characteristics of trace metals in dust from different levels of roads of a heavily air-polluted city in North China. Environ. Geochem. Health 2018, 40, 2441–2452. [Google Scholar] [CrossRef]
  111. Aburas, H.M.; Zytoon, M.; Abdulsalam, M.I. Atmospheric lead in PM2.5 after leaded gasoline phase-out in Jeddah City, Saudi Arabia. CLEAN Soil Air Water 2011, 39, 711–719. [Google Scholar] [CrossRef]
  112. Yang, Z.; Lu, W.; Long, Y.; Bao, X.; Yang, Q. Assessment of heavy metals contamination in urban top soil from Changchun City, China. J. Geochem. Explor. 2011, 108, 27–38. [Google Scholar] [CrossRef]
  113. Victor, O.; Chukwuemeka, P.-I.K.; Oluchi, N.E. Heavy metals contents and health risk assessment of classroom corner dusts in selected public primary schools in rivers state, Nigeria. J. Environ. Pollut. Hum. Health 2018, 6, 138–147. [Google Scholar] [CrossRef]
  114. Tong, S.T.; Lam, K.C. Are nursery schools and kindergartens safe for our kids? The Hong Kong study. Sci. Total Environ. 1998, 216, 217–225. [Google Scholar] [CrossRef]
  115. Banerjee, A.D.K. Heavy metal level sand solid phase speciation in street dusts of Delhi India. Environ. Pollut. 2003, 123, 95–105. [Google Scholar] [CrossRef]
  116. Aelion, C.; Davis, H.; McDermott, S.; Lawson, A. Metal concentrations in rural top soil in South Carolina: Potential for human health impact. Sci. Total Environ. 2008, 402, 149–156. [Google Scholar] [CrossRef] [Green Version]
  117. Martin, S.; Griswold, W. Human Health Effects of Heavy Metals; Center for Hazardous Substance Research, Kansas State University: Manhattan, KS, USA, 2009; Volume 15, pp. 1–6. [Google Scholar]
  118. He, K.; Wang, S.; Zhang, J. Blood lead levels of children and its trend in China. Sci. Total Environ. 2009, 407, 3986–3993. [Google Scholar] [CrossRef]
  119. Cheng, H.F.; Hu, Y.A. Lead (Pb) isotopic fingerprinting and its applications in lead pollution studies in China: A review. Environ. Pollut. 2010, 158, 1134–1146. [Google Scholar] [CrossRef]
Figure 1. Map of Jeddah showing sampling site distribution in the different functional areas.
Ijerph 16 05017 g001
Figure 2. The mean concentrations of heavy metals in CACF particles of Jeddah schools.
Ijerph 16 05017 g002
Figure 3. Average values of geo-accumulation index for heavy metals in CACF particles collected from schools in different areas.
Ijerph 16 05017 g003
Figure 4. Average enrichment factors for heavy metals in CACF particles collected from schools in different areas.
Ijerph 16 05017 g004
Figure 5. Hazard quotient and hazard index for exposure to ∑heavy metals concentrations for children in schools of different functional areas in Jeddah.
Ijerph 16 05017 g005
Figure 6. Hazard quotient and hazard index of the mean concentrations of heavy metals in all schools of Jeddah.
Ijerph 16 05017 g006
Figure 7. Relative contribution of individual heavy metal non-cancer to total non-cancer risks in children.
Ijerph 16 05017 g007
Figure 8. Lifetime cancer risk (LCR) of heavy metals concentrations for children in schools of Jeddah.
Ijerph 16 05017 g008
Figure 9. Lifetime cancer risk for exposure to ∑heavy metals concentrations for children in schools of different functional areas in Jeddah.
Ijerph 16 05017 g009
Figure 10. Relative contribution of individual heavy metal cancer to total cancer risks in children.
Ijerph 16 05017 g010
Table 1. Description of geo-accumulation index (Igeo) * classes to evaluate the individual heavy metals pollution with respect to schools CACF particles quality.
Igeo Value (log2 (x))Igeo ClassQualitative Designation of Road Dust
Igeo ≤ 00Uncontaminated
0 < Igeo ≤ 11Uncontaminated to moderately contaminated
1 < Igeo ≤ 22Moderately contaminated
2 < Igeo ≤ 33Moderately to heavily contaminated
3 < Igeo ≤ 44Heavily contaminated
4 < Igeo ≤ 55Heavily to extremely contaminated
Igeo > 56Extremely contaminated
* Wei et al. [56], Ali et al. [36].
Table 2. Exposure parameters used for the health risk assessment of heavy metals in school CACF particles for children through different exposure pathways.
ParametersSymbolUnitValueReferences
Concentration of metals in CACF particlesCmg/kgPresent study
Ingestion rate of dustIngRmg/day200ESAG [77]; USEPA [71,72]; Van den Berg [78]
Inhalation rate of dustInhRm3/day7.63Li et al. [79,80]; USEPA [81]
Exposure frequencyEFdays/year167Peng et al. [82]; Zheng et al. [33,34]; ESAG [77]
Absorption factor (Dermal)ABF0.001Wei et al. [56]; USEPA [70,71]; US Department of Energy [83]
Average body weightBWkg15Hu et al. [84]; Lu et al. [85]; Zheng et al. [33,34], ESAG [77], BMRIEP [86]
Exposure durationEDyears6USEPA [81]; USEPA [70,71]
Average exposure time (non-carcinogenic)ATdays365 × EDUSEPA [74]
Average exposure time (carcinogenic)ATdays365 × 70USEPA [74]
Conversion factorCFkg/mg1 × 10−6Li et al. [80]
Particular emission factorPEFm3/kg1.36 × 109USEPA [70,71]
Surface area of skin exposed to dustSAcm21600Zheng et al. [33,34]; ESAG [77]
Skin adherence factorAFmg/cm20.2USEPA [87]; Man et al. [88]
Table 3. Heavy metal concentrations (µg/g) in school CACF particles of different cities around the world.
CountryCityFeMnZnPbCdVCoNiAsCrCuReference
Saudi ArabiaJeddah8751.6391.8342.7121.22.0943.98.235.78.040.287.895This study
MalaysiaSelangor4801144.9253.511.9Latif et al. [11]
MalaysiaJengka108092879.01737.03.197.42Sulaiman et al. [90]
ChinaXi’an565462.6176.243.336.214.5159.774.2Lu et al. [49]
MalaysiaSri Serdang89.11.8953.27Praveena et al. [28]
IranBushehr1423.053.03.143.049.0234Ardashiriand Hashemi [91]
MalaysiaSelangor3445–3852439–880140–7342.9–7.724–6675–442Yap et al. [92]
MalaysiaShah Alam4225.3148.731.29.016.930.19Darus et al. [93]
NigeriaOgun State13.7254.0121.027.685521.721.912.72.041.840.9Olujimi et al. [17]
Table 4. The mean concentrations (µg/g) of heavy metals in CACF particles collected from schools in different functional areas.
ElementUrban SchoolsSuburban SchoolsResidential Schools
MinimumMaximumMeanSDMinimumMaximumMeanSDMinimumMaximumMeanSD
Fe6375.010,575.08650.01732.46000.010,000.08166.71649.97057.311,414.59438.21801.7
Mn362.5582.5481.790.7268.8438.8360.870.1247.0405.4332.865.3
Zn347.5559.5462.387.4236.9389.9319.863.1179.7302.2246.150.5
Pb171.0225.0200.322.3100.0140.0120.016.335.055.043.38.5
Cd1.64.33.11.10.72.81.80.90.91.91.40.4
V60.075.068.36.232.047.040.36.215.030.023.36.2
Co8.016.011.83.35.513.59.33.30.87.53.32.3
Ni38.068.053.012.220.050.035.012.24.034.019.012.2
As9.613.011.71.54.811.18.22.61.85.03.91.4
Cr39.063.052.09.929.448.339.77.821.135.629.06.0
Cu85.6136.6113.321.065.6105.987.416.646.676.863.012.5
Table 5. The CF and PLI of heavy metals in CACF particles collected from school in different functional areas.
SchoolCFPLI
FeMnZnPbCdVCoNiAsCrCu
Urban schools0.150.516.6016.0315.330.510.470.716.520.522.061.57
Suburban schools0.150.384.579.609.100.300.370.474.570.401.591.12
Residential schools0.170.353.523.476.980.170.130.252.160.291.150.71
Mean0.160.414.909.7010.470.330.330.484.420.401.601.15
Notes: CF, contamination factor; PLI, pollution load index.
Table 6. Hazard quotient and hazard index of each heavy metal for children in schools of different functional areas.
RiskAreaHeavy Metals
CrNiCuZnCdPbMnFeCoVAs
HQingUrban schools1.1E-011.6E-021.7E-029.4E-031.9E-023.5E-016.3E-026.3E-033.6E-035.9E-022.4E-01
Suburban schools8.1E-021.1E-021.3E-026.5E-031.1E-022.1E-014.7E-025.9E-032.8E-033.5E-021.7E-01
Residential schools5.9E-025.8E-039.6E-035.0E-038.5E-037.6E-024.3E-026.9E-031.0E-032.0E-027.9E-02
HQinhUrban schools3.1E-044.4E-074.8E-072.6E-075.2E-079.7E-065.8E-036.7E-033.5E-041.7E-066.7E-06
Suburban schools2.4E-042.9E-073.7E-071.8E-073.1E-075.8E-064.3E-036.3E-032.8E-049.8E-074.7E-06
Residential schools1.7E-041.6E-072.7E-071.4E-072.4E-072.1E-064.0E-037.3E-031.0E-045.7E-072.2E-06
HQdermUrban schools1.0E-029.6E-059.2E-057.5E-053.0E-033.7E-032.6E-031.2E-037.2E-069.5E-039.3E-04
Suburban schools7.7E-036.3E-057.1E-055.2E-051.8E-032.2E-031.9E-031.1E-035.7E-065.6E-036.5E-04
Residential schools5.7E-033.4E-055.1E-054.0E-051.4E-038.1E-041.8E-031.3E-032.0E-063.2E-033.1E-04
HIUrban schools1.2E-011.6E-021.7E-029.5E-032.2E-023.5E-017.1E-021.4E-024.0E-036.9E-022.4E-01
Suburban schools8.9E-021.1E-021.3E-026.6E-031.3E-022.1E-015.3E-021.3E-023.1E-034.1E-021.7E-01
Residential schools6.5E-025.8E-039.7E-035.0E-039.9E-037.6E-024.9E-021.6E-021.1E-032.4E-027.9E-02
RfDing3.0E-032.0E-024.0E-023.0E-011.0E-033.5E-034.7E-028.4E+002.0E-027.0E-033.0E-04
RfDinh2.9E-052.1E-024.0E-023.0E-011.0E-033.5E-031.4E-052.2E-045.7E-067.0E-033.0E-04
RfDderm5.0E-055.4E-031.2E-026.0E-021.0E-055.3E-041.8E-037.0E-021.6E-027.0E-051.2E-04
Table 7. LCR of each heavy metal for children in schools of different functional areas.
RiskAreaHeavy Metals
CrNiCdPbCoAs
LCRingUrban schools1.3E-042.7E-041.2E-041.0E-057.1E-041.1E-05
Suburban schools1.0E-041.8E-047.0E-056.2E-065.6E-047.6E-06
Residential schools7.4E-059.7E-055.4E-052.2E-062.0E-043.6E-06
LCRinhUrban schools3.7E-097.6E-093.3E-092.9E-102.0E-083.0E-10
Suburban schools2.8E-095.0E-092.0E-091.7E-101.6E-082.1E-10
Residential schools2.1E-092.7E-091.5E-096.3E-115.6E-091.0E-10
LCRdermUrban schools2.1E-074.3E-071.9E-071.7E-081.1E-061.7E-08
Suburban schools1.6E-072.9E-071.1E-071.0E-088.9E-071.2E-08
Residential schools1.2E-071.6E-078.6E-083.6E-093.2E-075.7E-09
TLCRUrban schools1.3E-042.7E-041.2E-041.0E-057.1E-041.1E-05
Suburban schools1.0E-041.8E-047.0E-056.2E-065.6E-047.6E-06
Residential schools7.4E-059.8E-055.4E-052.3E-062.0E-043.6E-06
Sf4.2E-018.4E-016.3E+008.5E-039.8E+001.5E-01

