Anthropogenic Effects on Hydrogen and Oxygen Isotopes of River Water in Cities

 , , , ,
Abstract
:1. Introduction
2. Data and Methods
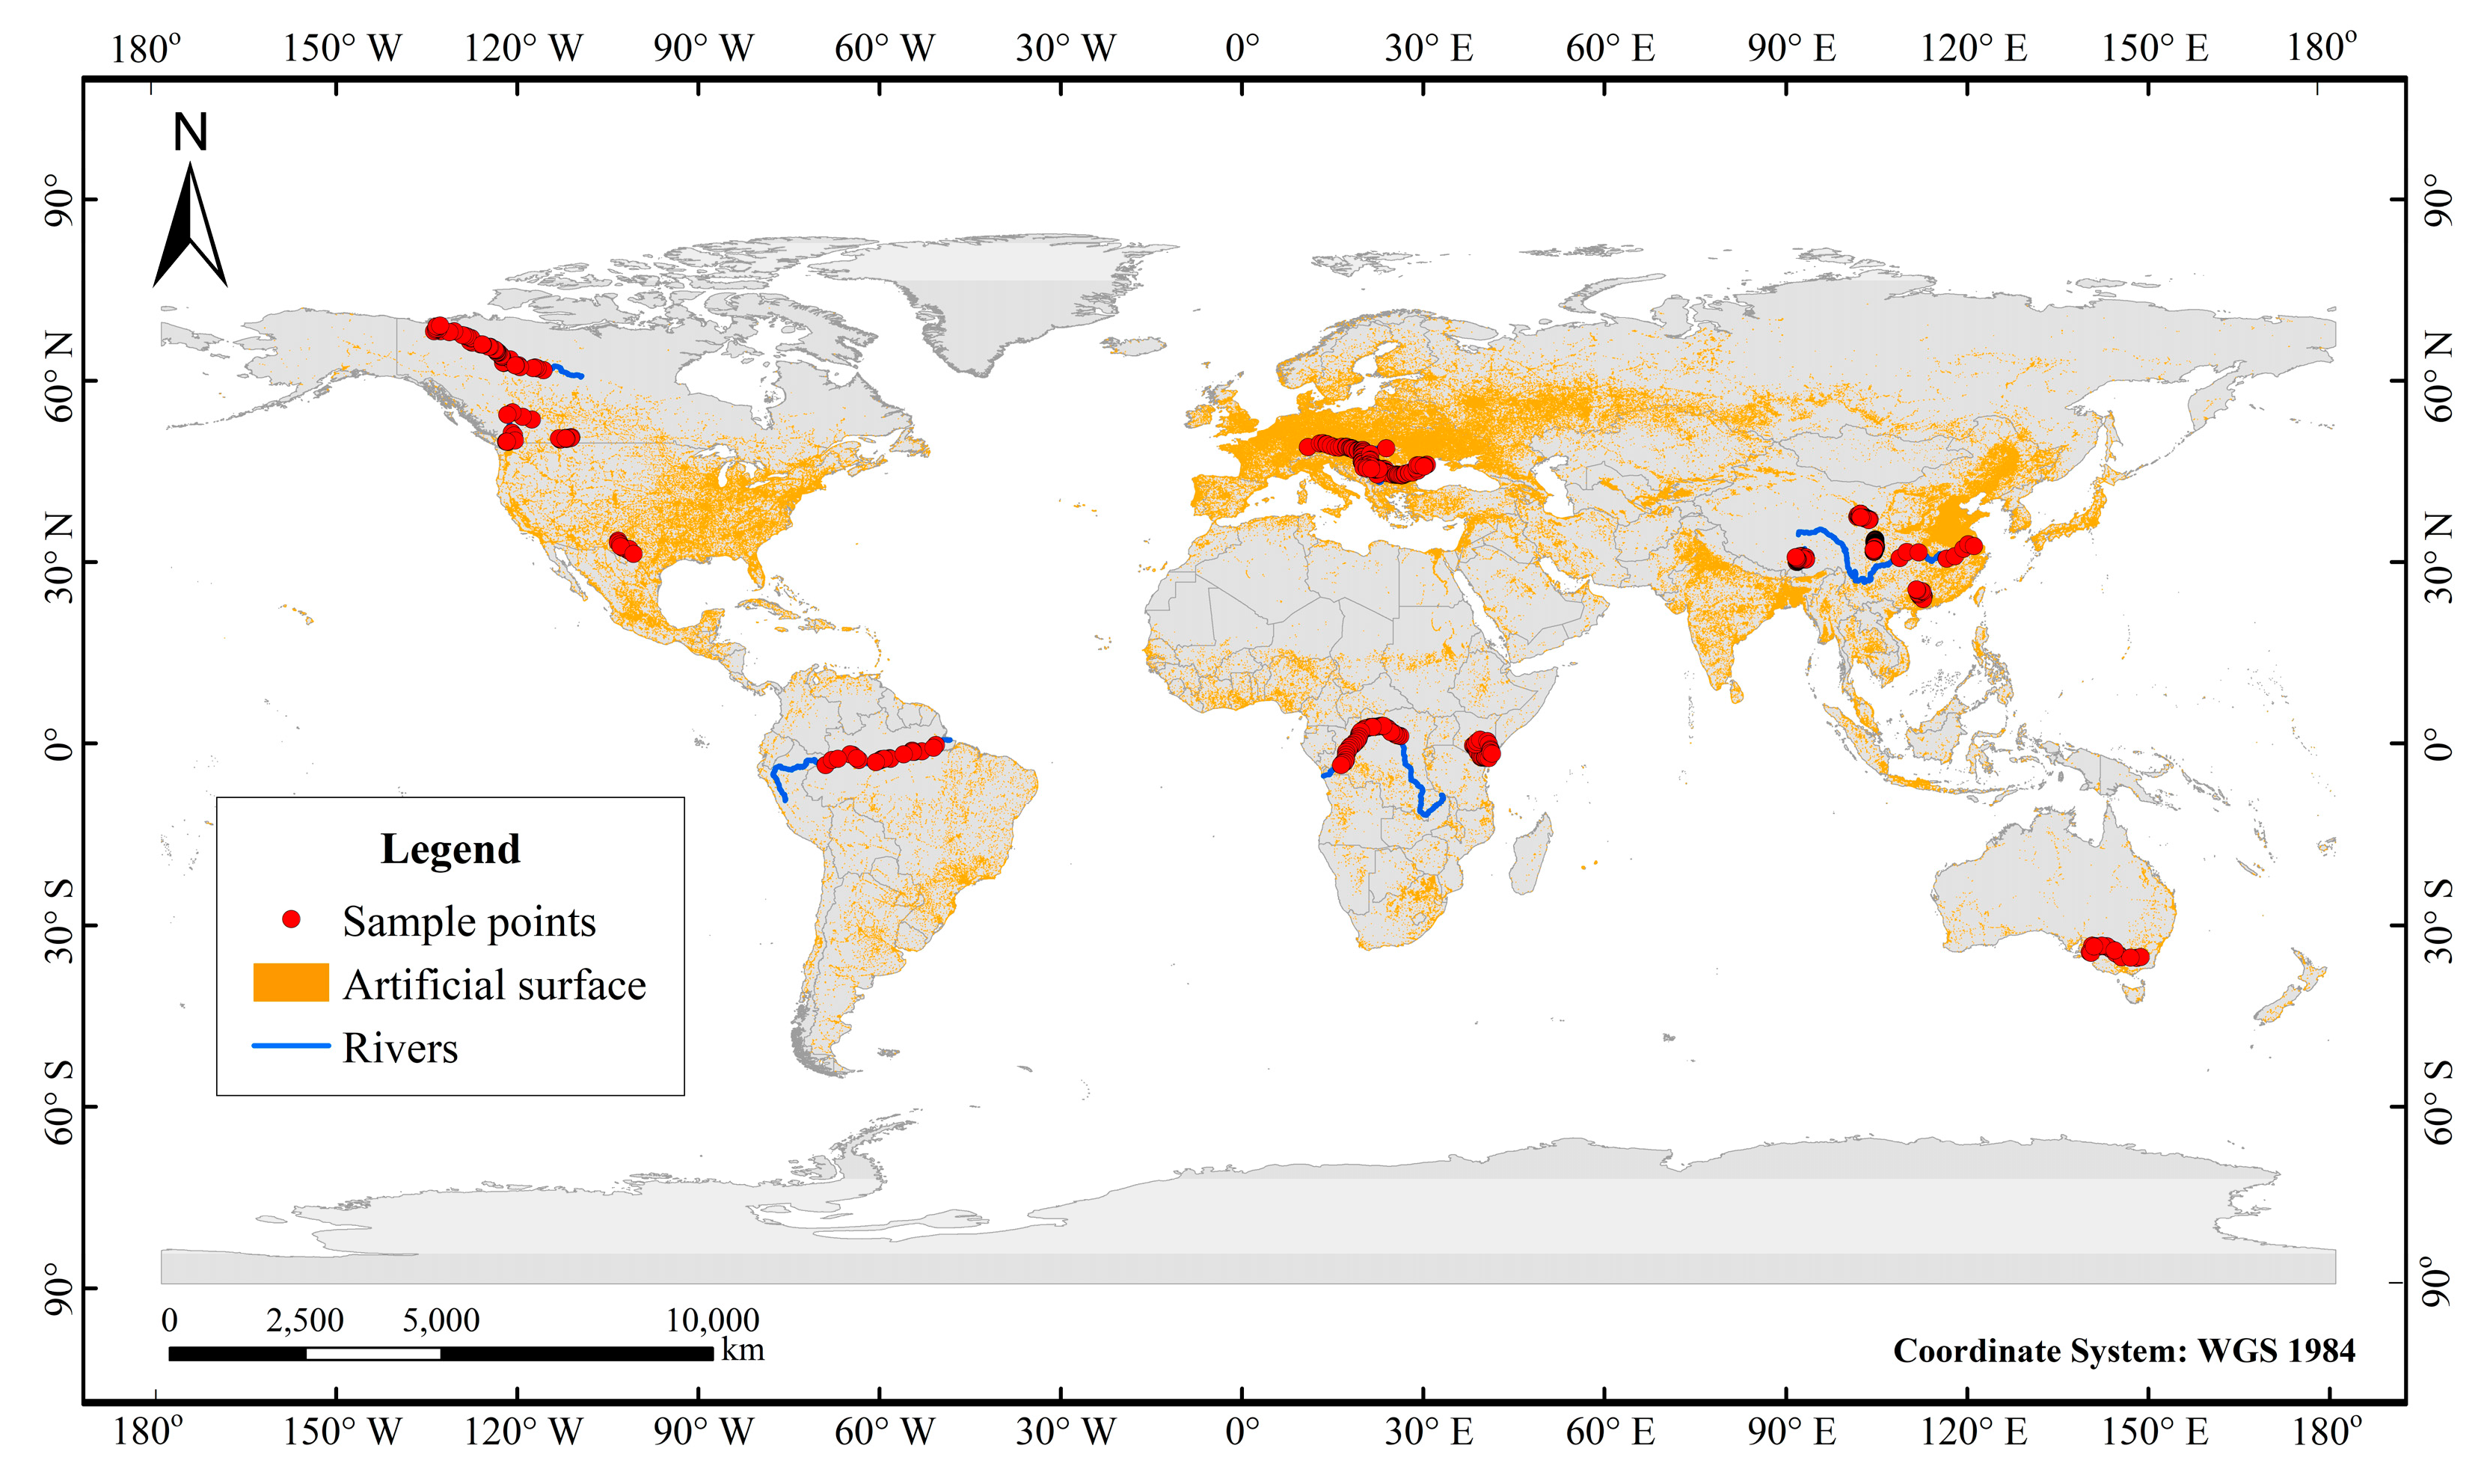
2.1. Data
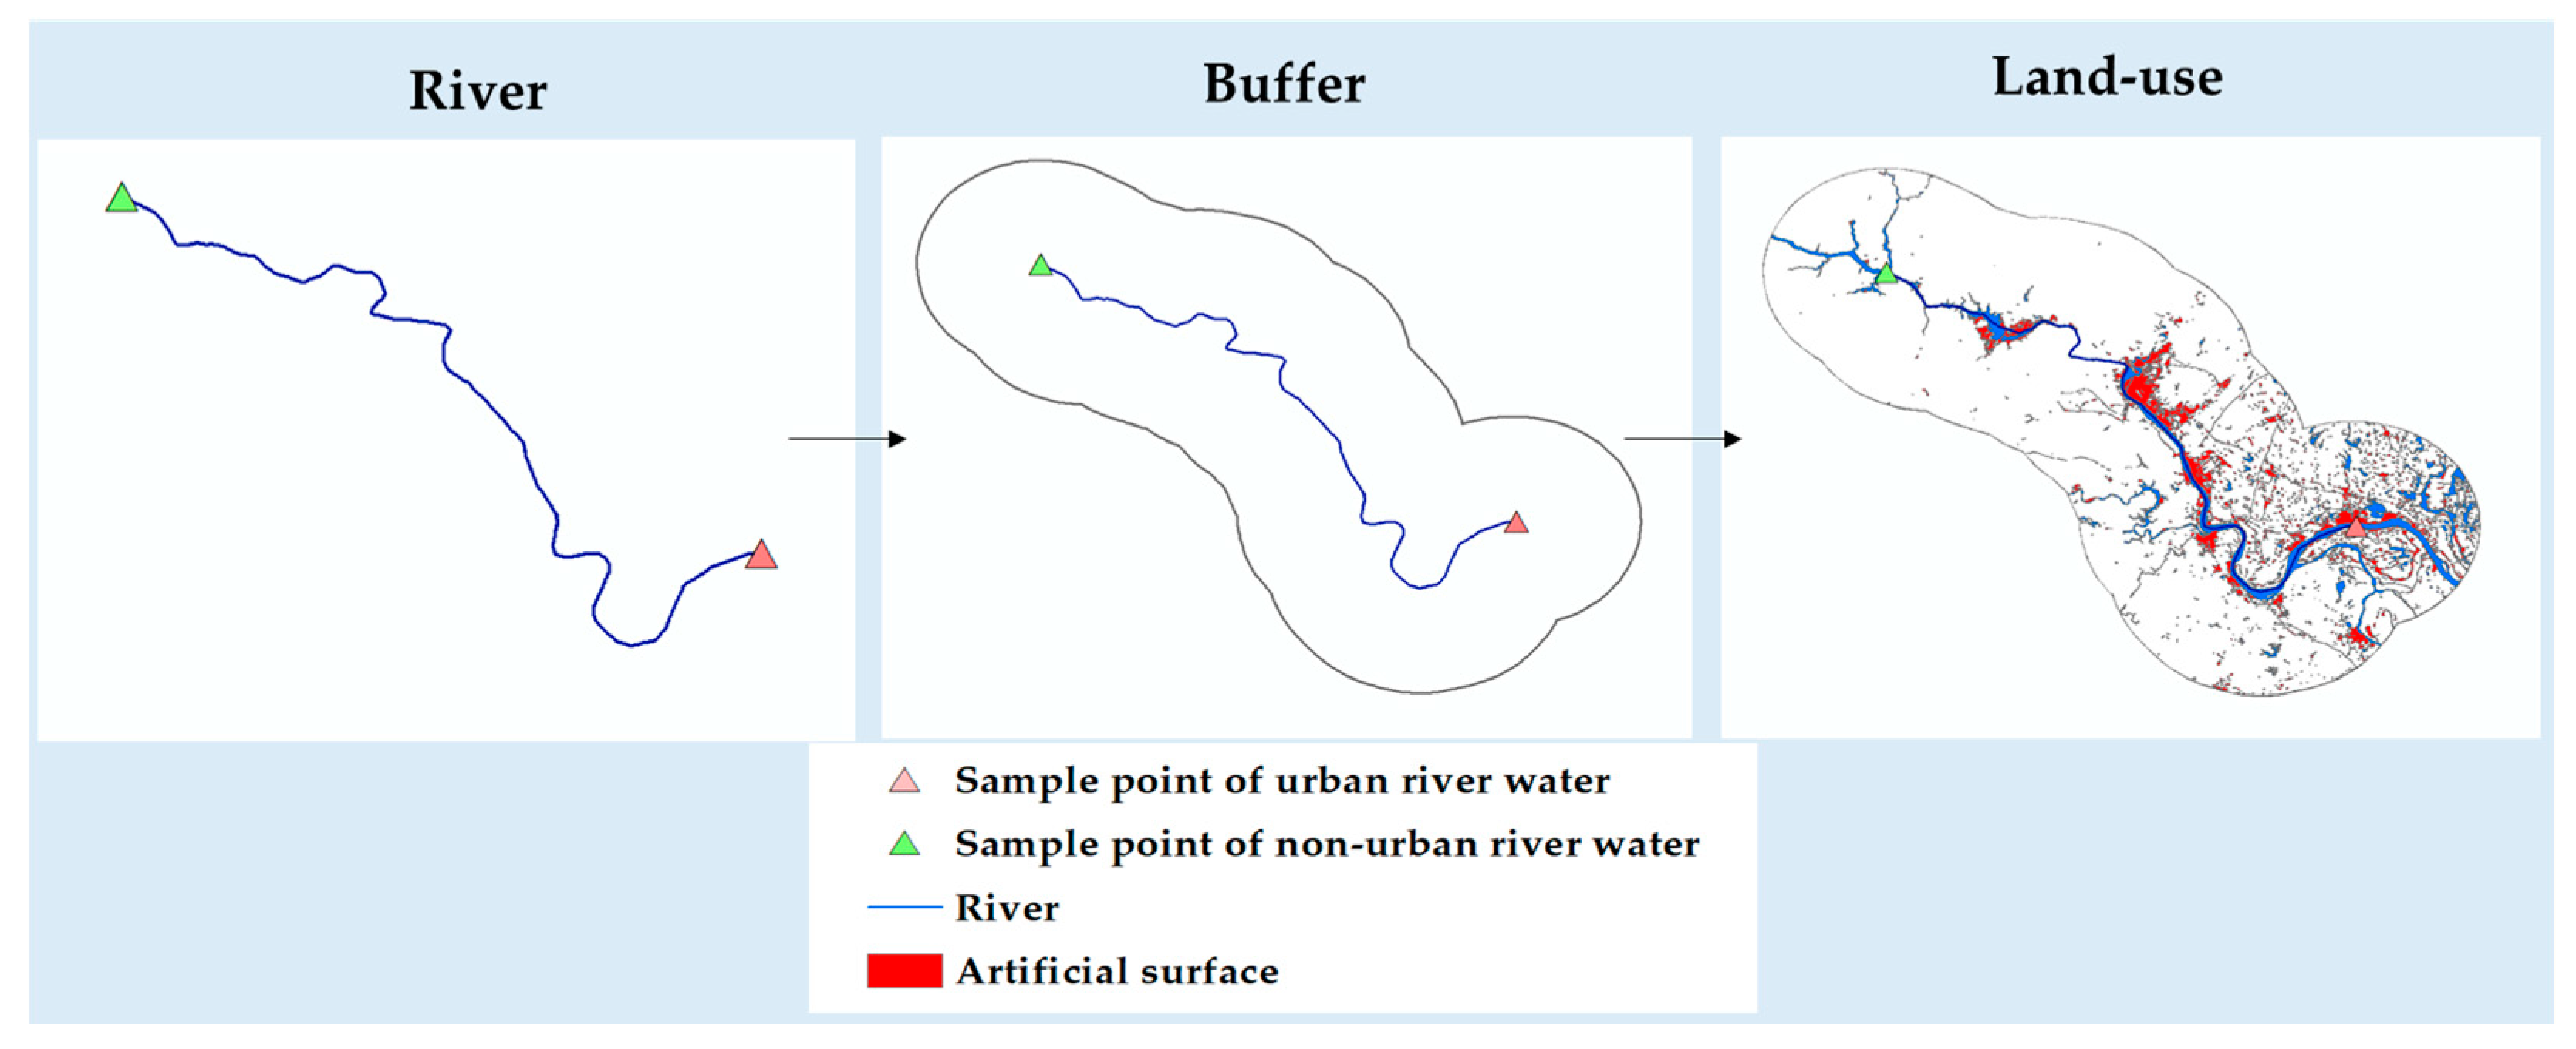
2.2. Methods
3. Results
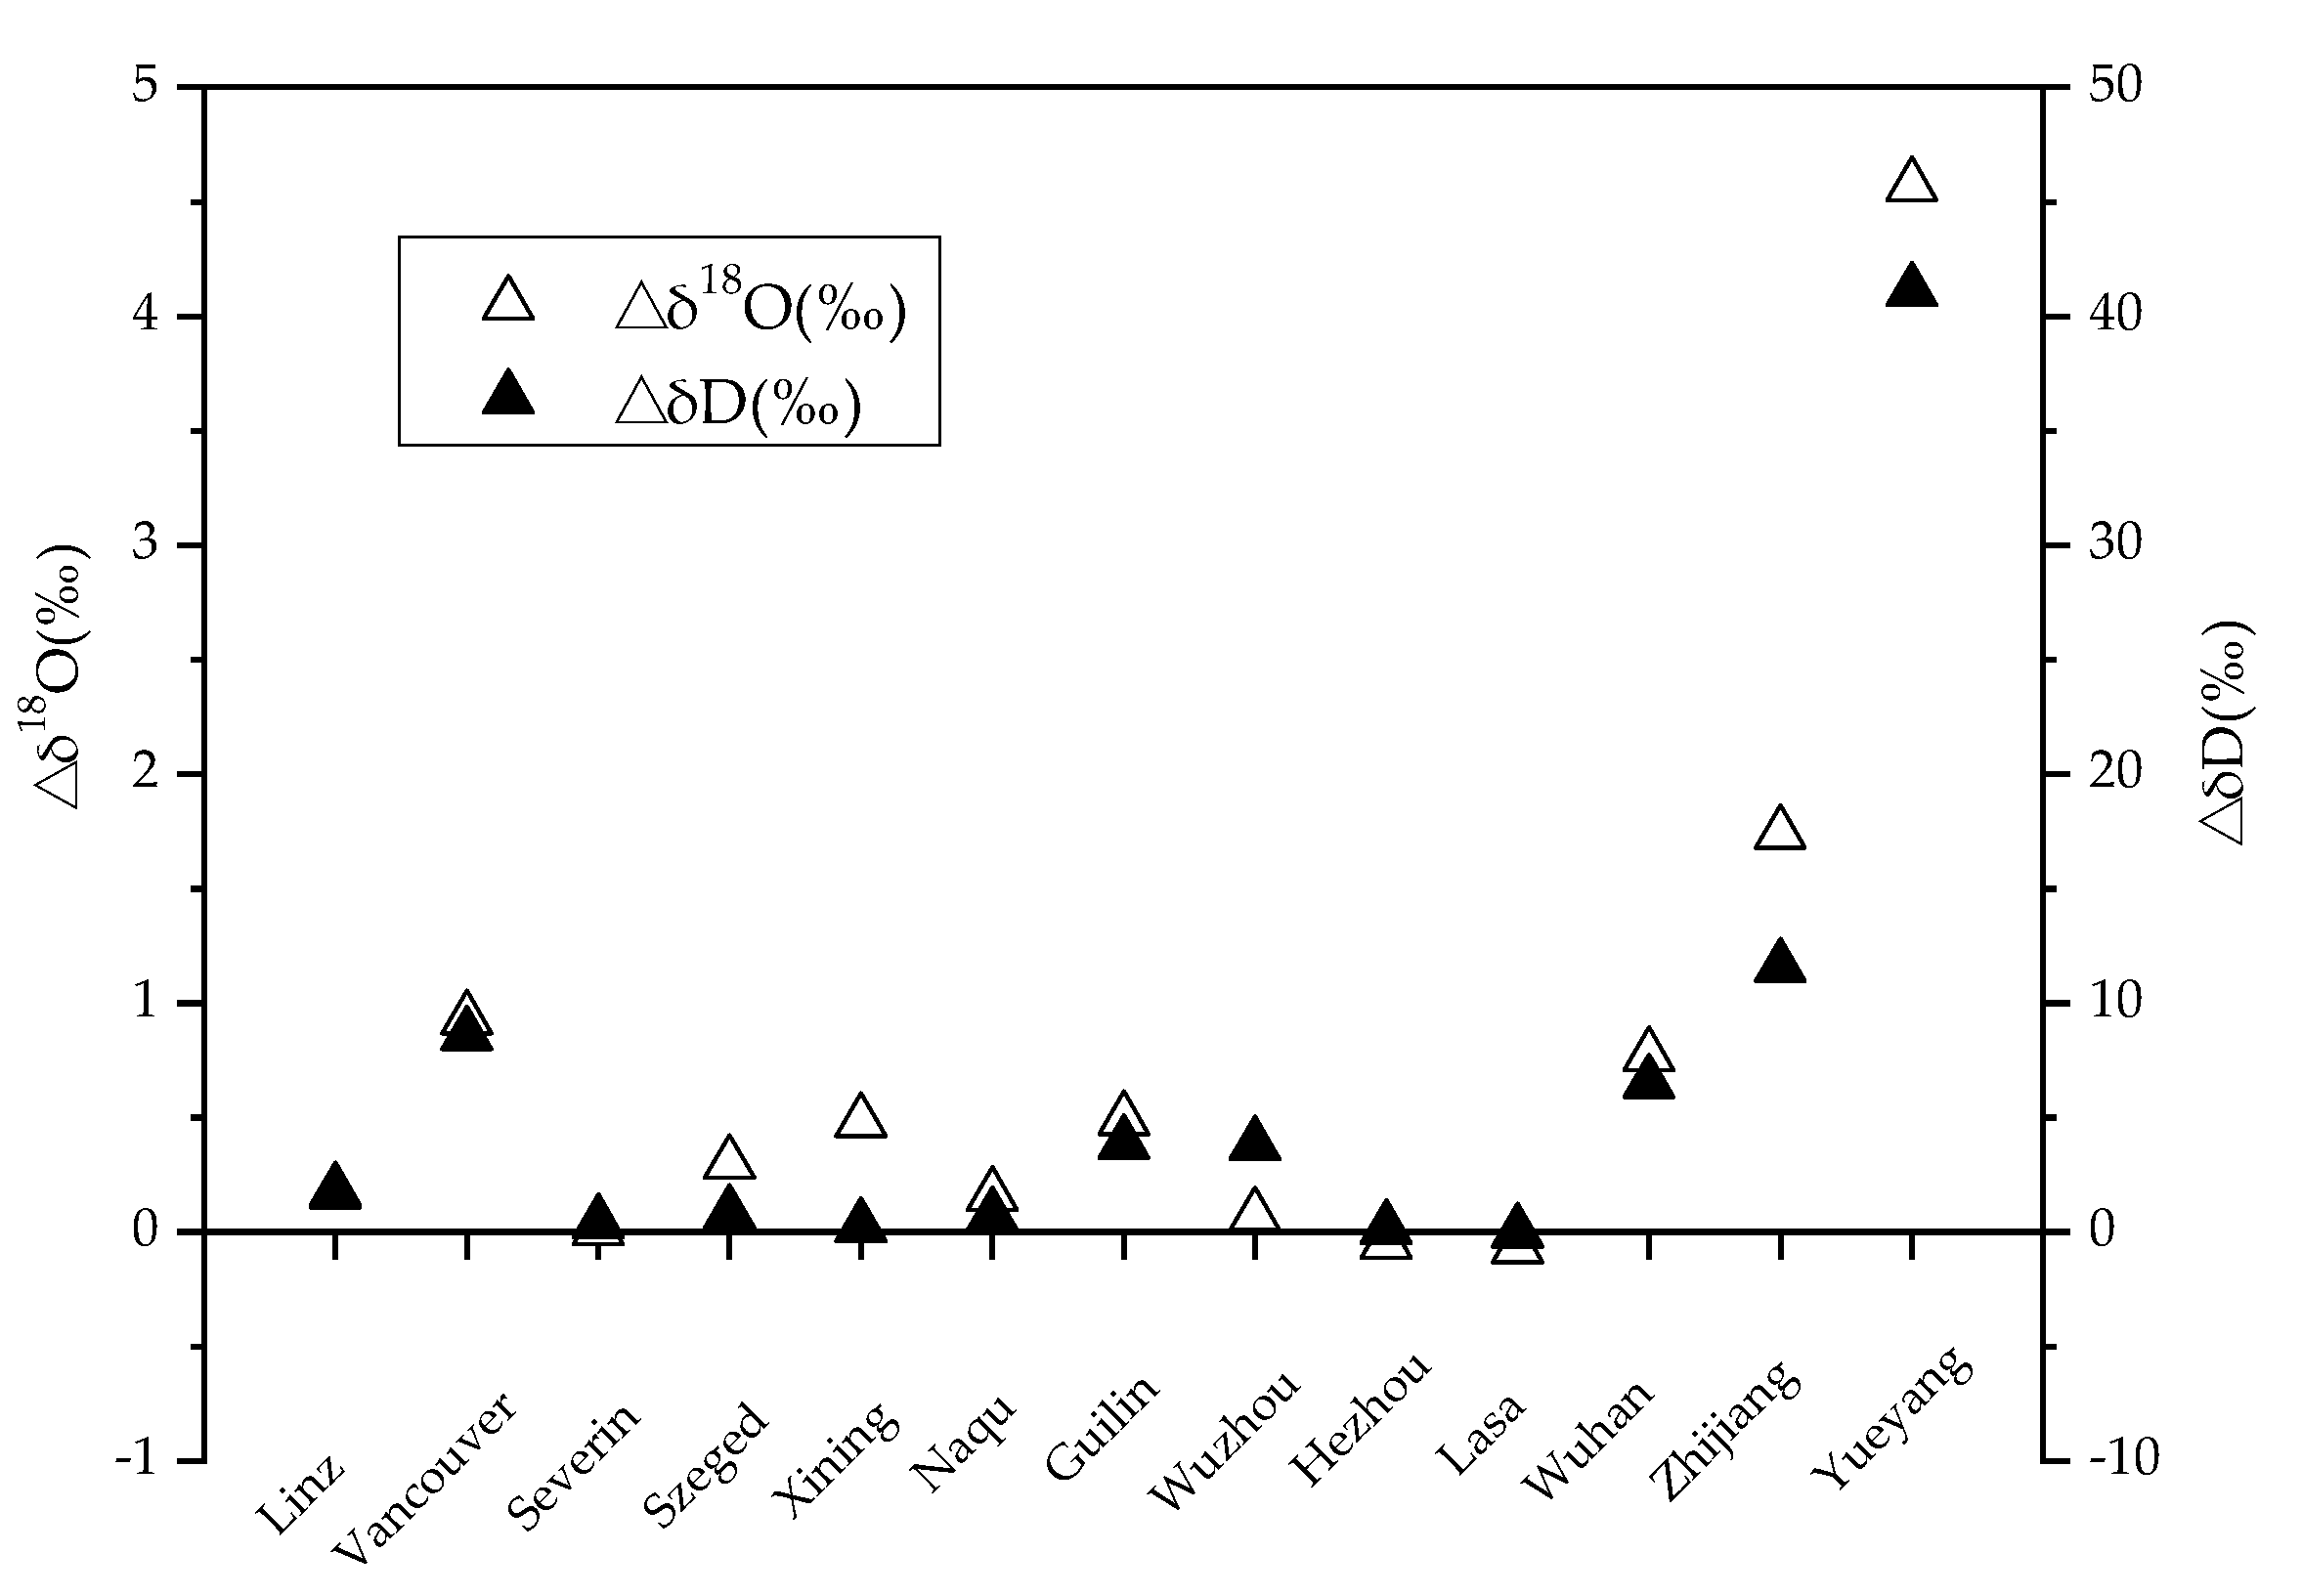
3.1. Local Effects of the Cities
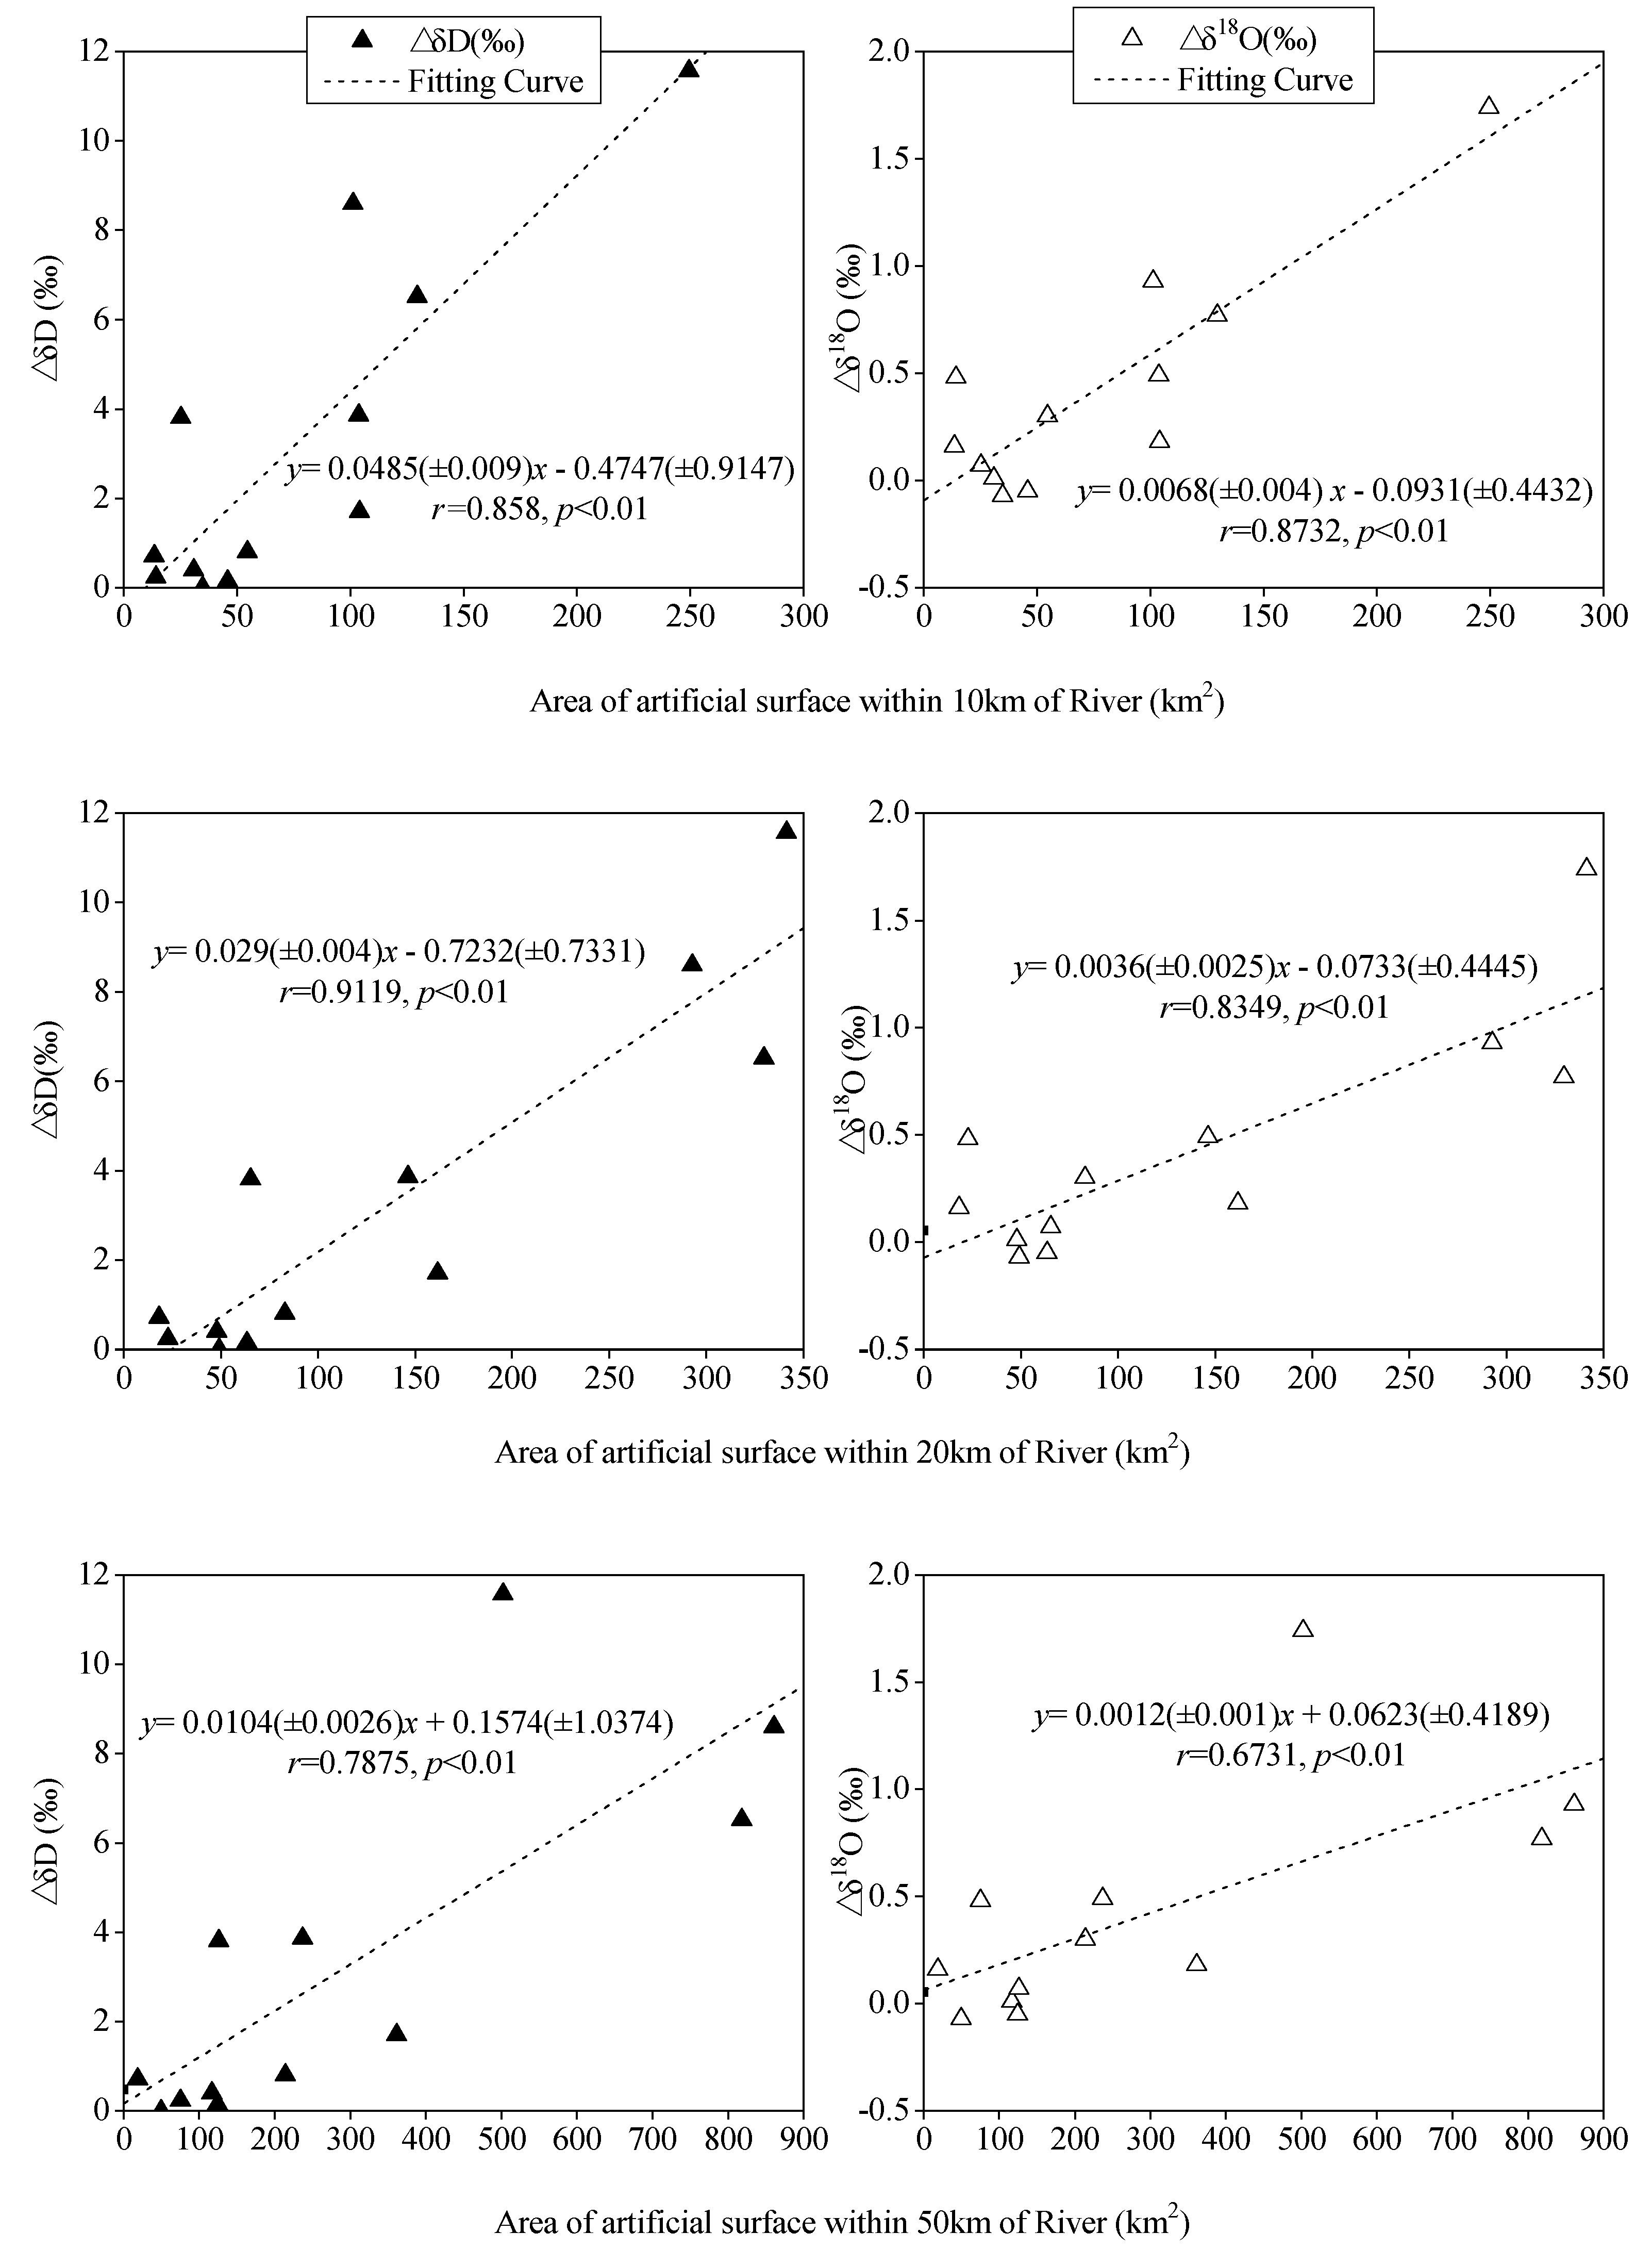
3.2. Cumulative Effects of the Cities
4. Discussion
4.1. Analysis of the Impact Factors
4.2. Similarities and Differences between City Effect and Reservoir Effect
4.3. Other Factors to be Studied
5. Conclusions
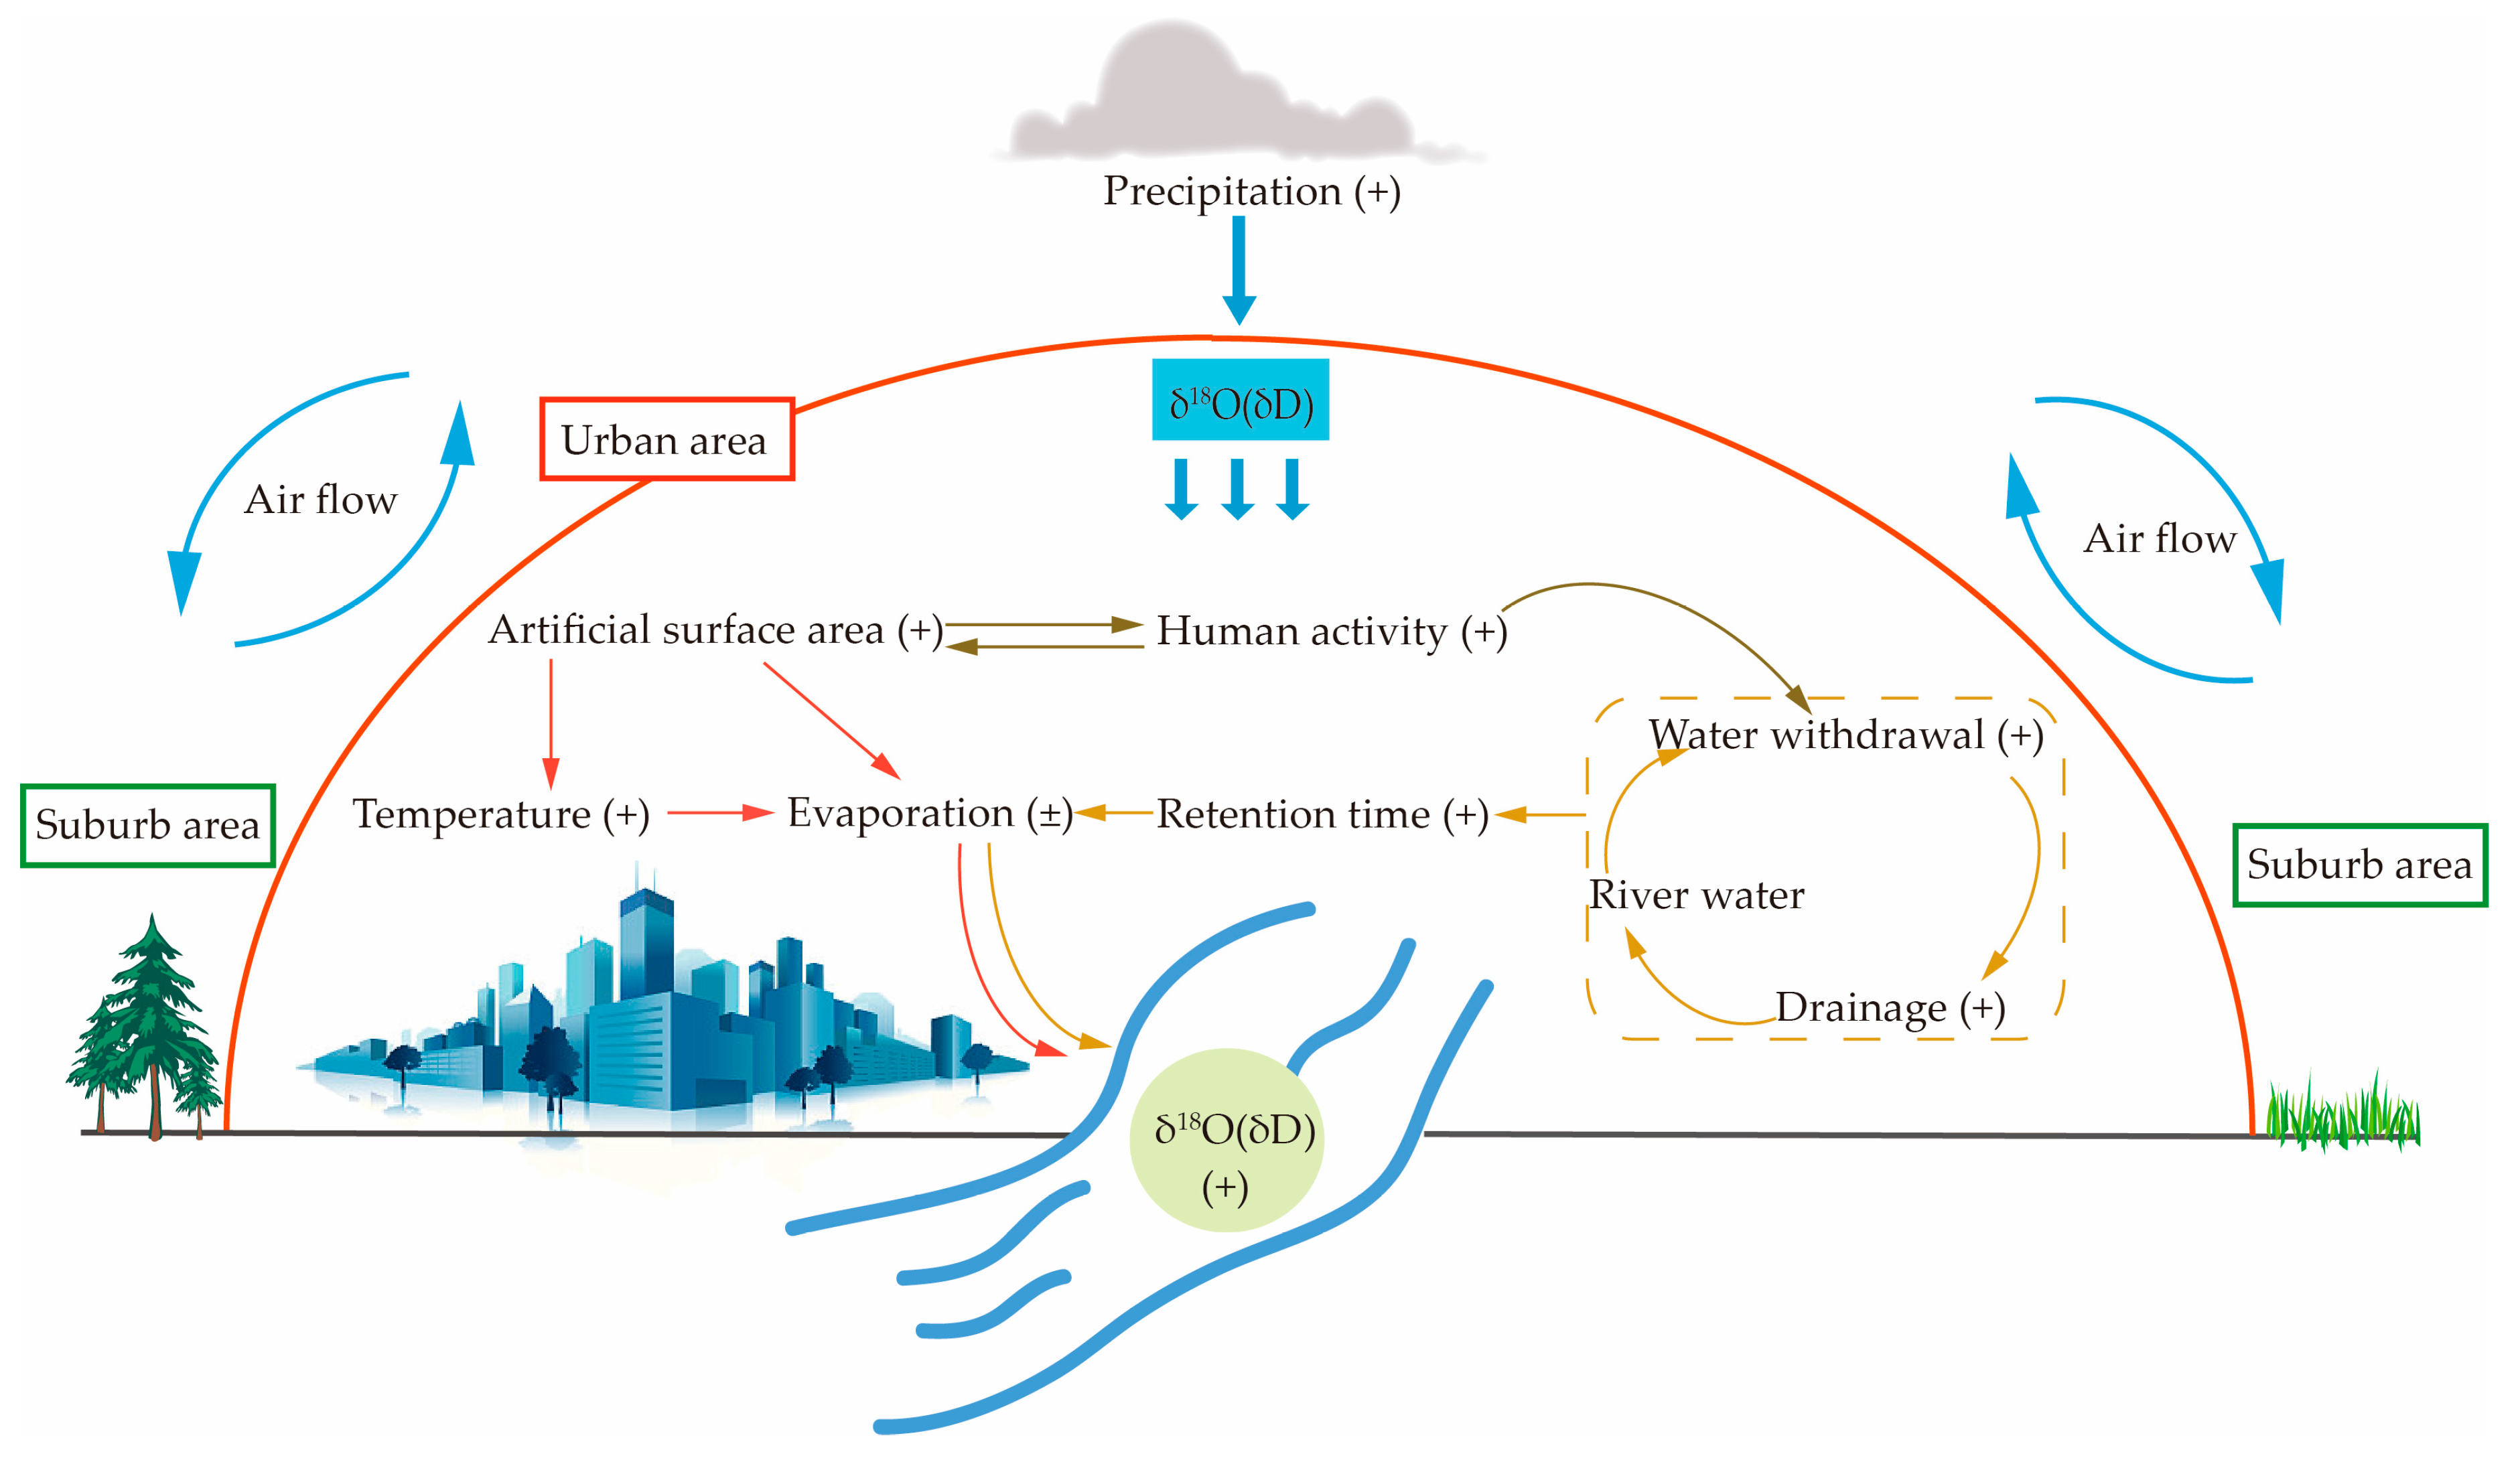
- The values of the hydrogen and oxygen isotopes of urban river are generally higher than that of the corresponding non-urban river water.
- The isotopic variability value of urban and non-urban water is positively correlated with the artificial surface area around the river.
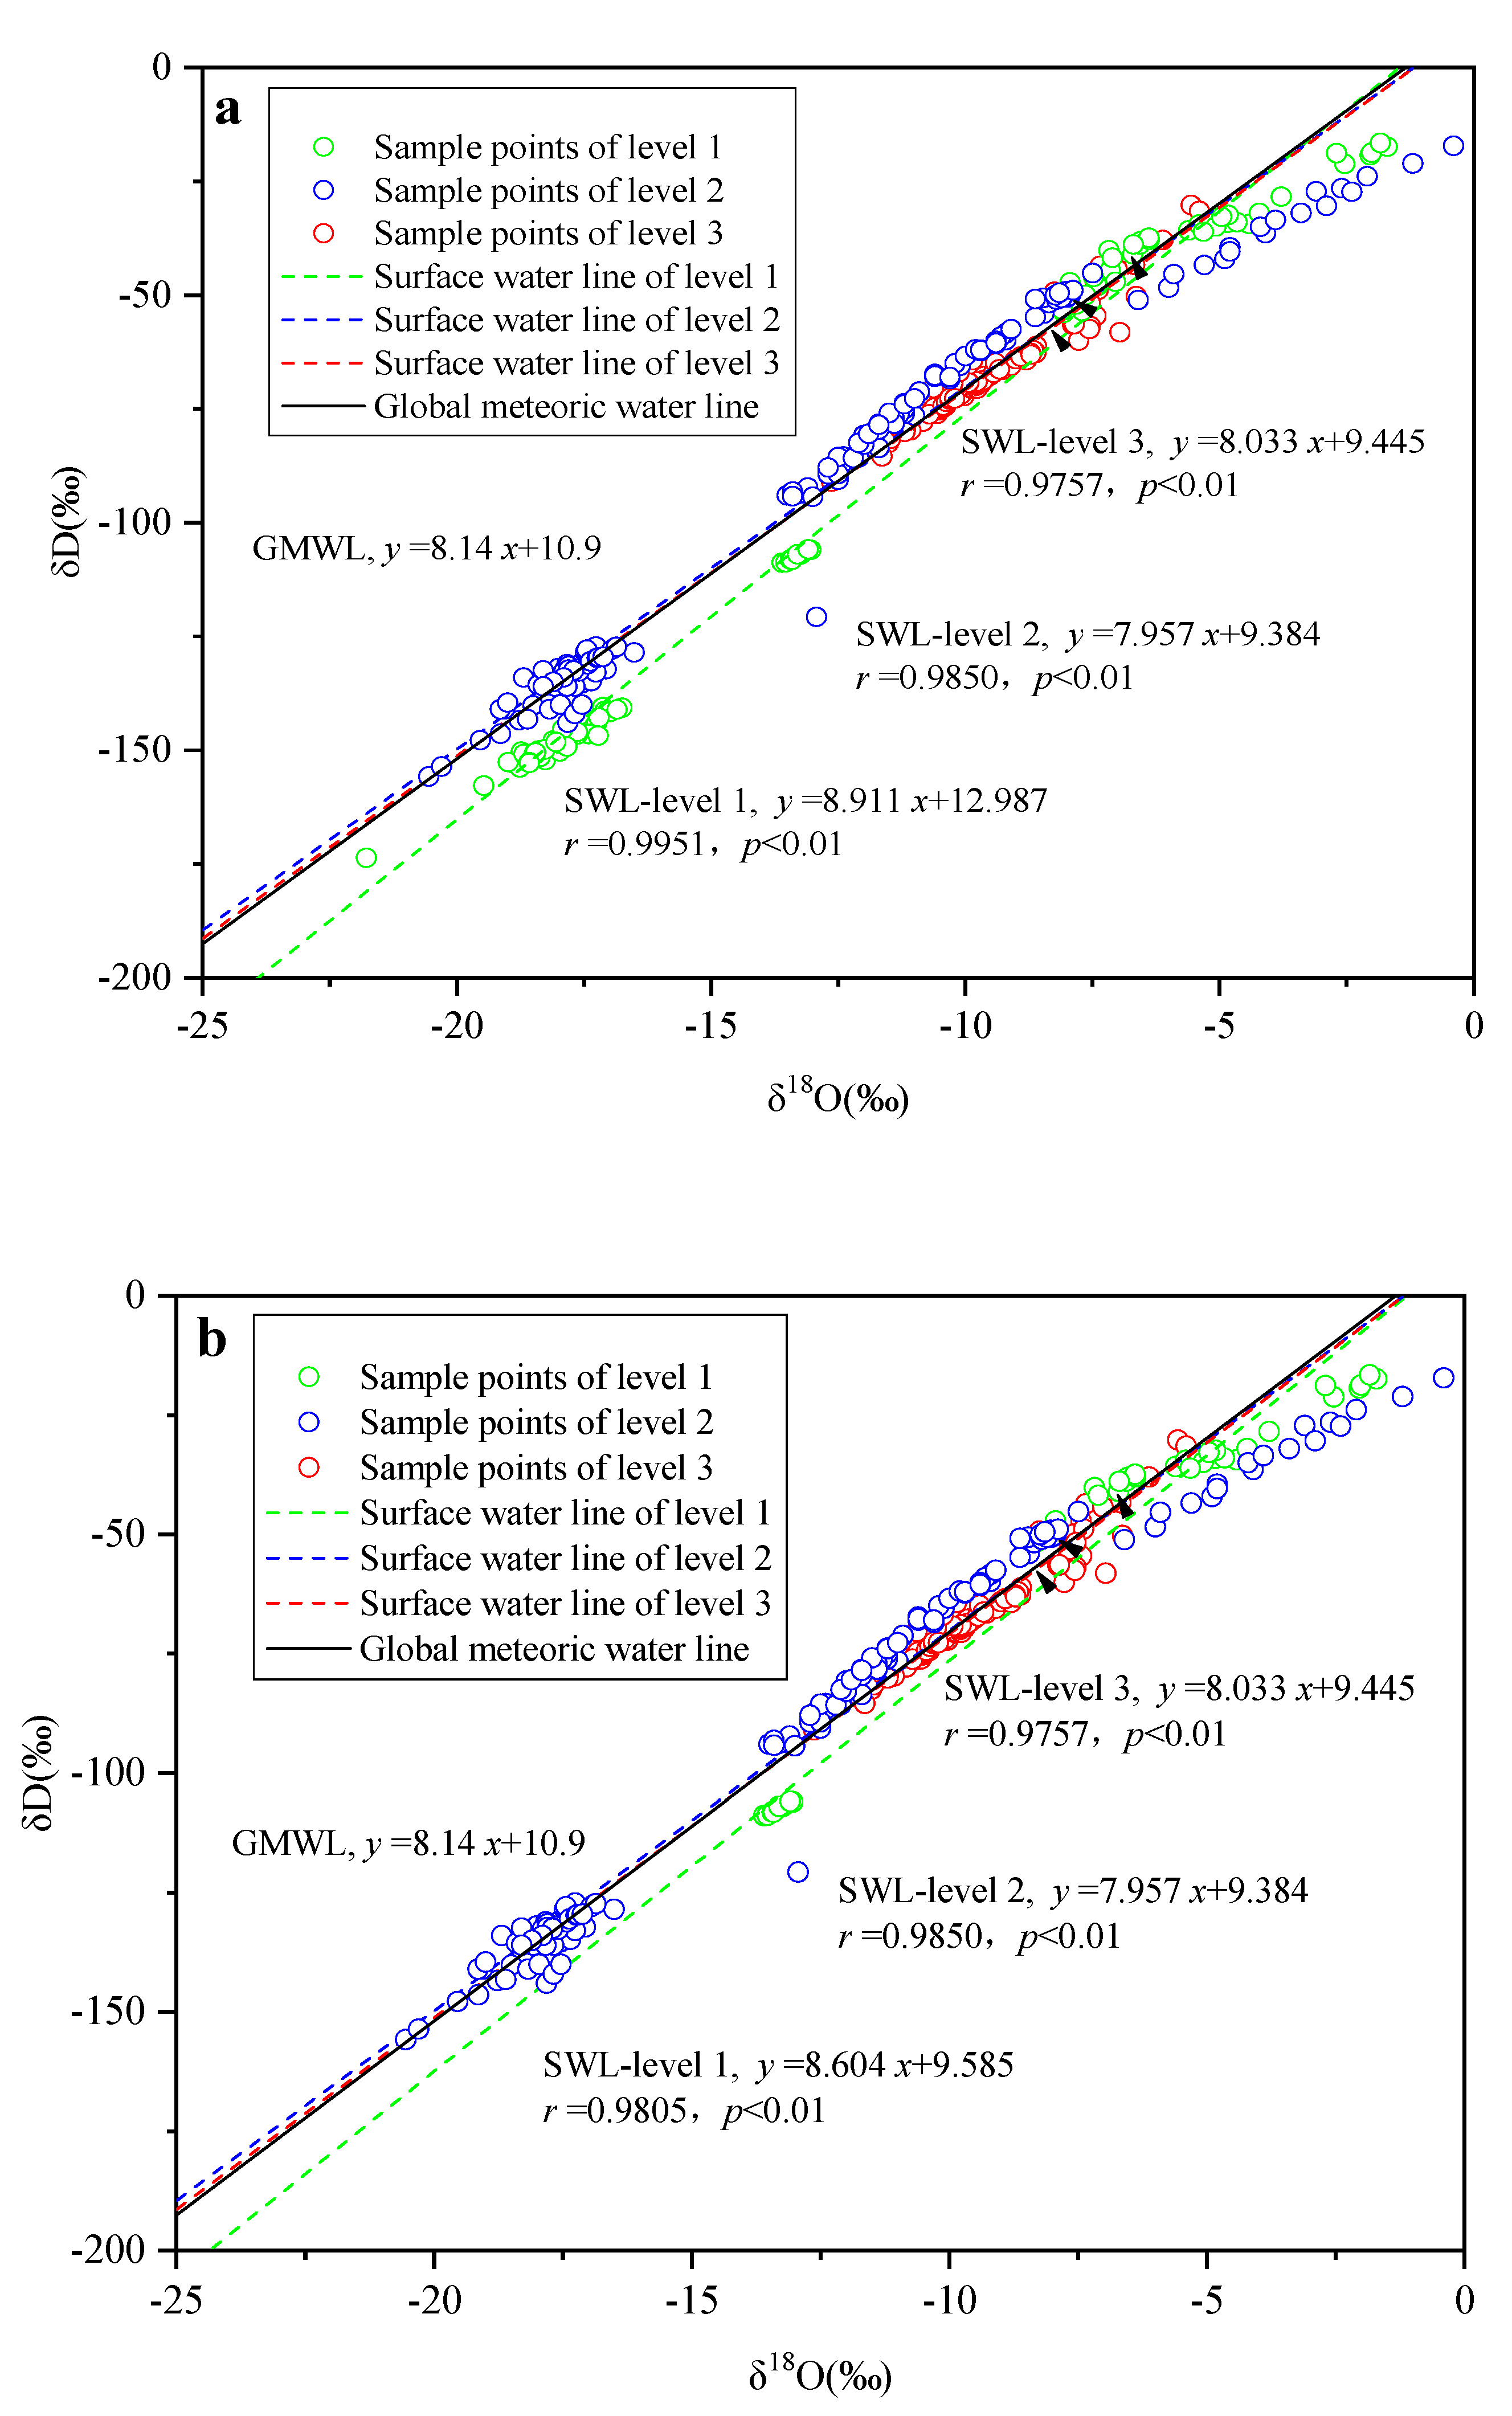
- The more artificial surface area around the river, the smaller the slope and intercept of the surface water line equation.
Supplementary Materials
Author Contributions
Funding
Acknowledgments
Conflicts of Interest
References
- Gat, J.J. Oxygen and hydrogen isotopes in the hydrologic cycle. Annu. Rev. Earth Planet. Sci. 1996, 24, 225–262. [Google Scholar] [CrossRef]
- Gibson, J.J.; Aggarwal, P.; Hogan, I.; Kendall, C.; Martinelli, L.A.; Stichler, W.; Rank, D.; Goni, I.; Choudhry, M.; Gat, J. Isotope studies in large river basins: A new global research focus. EOS Trans. Am. Geophys. Union 2002, 83, 613–617. [Google Scholar] [CrossRef]
- Liotta, M.; Favara, R.; Valenza, M. Isotopic composition of the precipitations in the central Mediterranean: Origin marks and orographic precipitation effects. J. Geophys. Res. Atmos. 2006, 111, D19. [Google Scholar] [CrossRef]
- Halder, J.; Terzer, S.; Wassenaar, L.I.; Araguás-Araguás, L.J.; Aggarwal, P.K. The global network of isotopes in rivers (GNIR): Integration of water isotopes in watershed observation and riverine research. Hydrol. Earth. Syst. Sci. 2015, 19, 3419–3431. [Google Scholar] [CrossRef]
- Barbieri, M. Isotopes in hydrology and hydrogeology. Water 2019, 11, 291. [Google Scholar] [CrossRef]
- Chen, X.; Wang, G.; Wang, F. Classification of stable isotopes and identification of water replenishment in the Naqu River basin, Qinghai-Tibet plateau. Water 2019, 11, 46. [Google Scholar] [CrossRef]
- Bowen, G.J.; Ehleringer, J.R.; Chesson, L.A.; Stange, E.; Cerling, T.E. Stable isotope ratios of tap water in the contingous United States. Water Resour. Res. 2007, 43, 3. [Google Scholar] [CrossRef]
- Tian, L.; Yao, T. Stable isotopic variations in west China: A consideration of moisture sources. J. Geophys. Res. 2007, 112, D10. [Google Scholar] [CrossRef]
- Yi, Y.; Gibson, J.J.; Hélie, J.F.; Dick, T.A. Synoptic and time-series stable isotope surveys of the Mackenzie River from Great Slave Lake to the Arctic Ocean, 2003 to 2006. J. Hydrol. 2010, 383, 223–232. [Google Scholar] [CrossRef]
- Joel, R.G. Isotope Hydrology—A Study of the Water Cycle; Imperial College Press: London, UK, 2010; pp. 9–19. [Google Scholar]
- Rozanski, K.; Araguas-Araguas, L.; Gonfiantini, R. Isotopic patterns in modern global precipitation. Geophys. Monogr. Ser. 1993, 78, 1–36. [Google Scholar]
- Poage, M.A.; Chamberlain, C.P. Empirical relationships between elevation and the stable isotope composition of precipitation and surface waters: Considerations for studies of paleoelevation change. Am. J. Sci. 2001, 301, 1–15. [Google Scholar] [CrossRef]
- Aggarwal, P.K.; Alduchov, O.A.; Froehlich, K.O.; Araguas-Araguas, L.J.; Sturchio, N.C.; Kurita, N. Stable isotopes in global precipitation: A unified interpretation based on atmospheric moisture residence time. Geophys. Res. Lett. 2012, 39, L11705. [Google Scholar] [CrossRef]
- Windhorst, D.; Waltz, T.; Timbe, E.; Frede, H.G.; Breuer, L. Impact of elevation and weather patterns on the isotopic composition of precipitation in a tropical montane forest. Hydrol. Earth. Syst. Sci. 2013, 17, 409–419. [Google Scholar] [CrossRef]
- Dansgaard, W. Stable isotopes in precipitation. Tellus 1964, 16, 436–468. [Google Scholar] [CrossRef]
- Jódar, J.; Custodio, E.; Liotta, M.; Lambán, L.J.; Herrera, C.; Martos-Rosillo, S.; Sapriza, G.; Rigo, T. Correlation of the seasonal isotopic amplitude of precipitation with annual evaporation and altitude in alpine regions. Sci. Total. Environ. 2016, 550, 27–37. [Google Scholar] [CrossRef] [PubMed]
- Gorski, G.; Strong, C.; Good, S.P.; Bares, R.; Ehleringer, J.R.; Bowen, G.J. Vapor hydrogen and oxygen isotopes reflect water of combustion in the urban atmosphere. Proc. Natl. Acad. Sci. USA 2015, 112, 3247–3252. [Google Scholar] [CrossRef] [PubMed]
- Jameel, Y.; Brewer, S.; Good, S.P.; Tipple, B.J.; Ehleringer, J.R.; Bowen, G.J. Tap water isotope ratios reflect urban water system structure and dynamics across a semiarid metropolitan area. Water Resour. Res. 2016, 52, 5891–5910. [Google Scholar] [CrossRef]
- Ehleringer, J.R.; Barnette, J.E.; Jameel, Y.; Tipple, B.J.; Bowen, G.J. Urban water—A new frontier in isotope hydrology. Isot. Environ. Health Sci. 2016, 52, 477–486. [Google Scholar] [CrossRef] [PubMed]
- Jameel, Y.; Brewer, S.; Fiorella, R.P.; Tipple, B.J.; Terry, S.; Bowen, G.J. Isotopic reconnaissance of urban water supply system dynamics. Hydrol. Earth Syst. Sc. 2018, 22, 6109–6125. [Google Scholar] [CrossRef]
- Mahlknecht, J.; Daessle, L.W.; Esteller, M.V.; Torres-Martinez, J.A.; Mora, A. Groundwater flow processes and human impact along the arid US-Mexican border, evidenced by environmental tracers: The case of Tecate, Baja California. Int. J. Environ. Res. Public Health 2018, 15, 887. [Google Scholar] [CrossRef] [PubMed]
- Zhu, M.; Wang, S.; Kong, X.; Zheng, W.; Feng, W.; Zhang, X.; Yuan, R.; Song, X.; Sprenger, M. Interaction of surface water and groundwater influenced by groundwater over-extraction, waste water discharge and water transfer in Xiong’an New Area, China. Water 2019, 11, 539. [Google Scholar] [CrossRef]
- Kummu, M.; Varis, O. Sediment-Related impacts due to upstream reservoir trapping, the Lower Mekong River. Geomorphology 2007, 85, 275–293. [Google Scholar] [CrossRef]
- Vörösmarty, C.J.; Sahagian, D. Anthropogenic disturbance of the terrestrial water cycle. Bioscience 2000, 50, 753–765. [Google Scholar] [CrossRef] [Green Version]
- Jiao, N.; Zhang, Y.; Zeng, Y.; Gardner, W.D.; Mishonov, A.V.; Richardson, M.J.; Vachon, R.; Ichiyanagi, K. Ecological anomalies in the East China Sea: Impacts of the Three Gorges Dam? Water Res. 2007, 41, 1287–1293. [Google Scholar] [CrossRef] [PubMed]
- Humborg, C.; Ittekkot, V.; Cociasu, A.; Bodungen, B.V. Effect of Danube River dam on Black Sea biogeochemistry and ecosystem structure. Nature 1997, 386, 385–388. [Google Scholar] [CrossRef]
- Poff, N.L.; Olden, J.D.; Merritt, D.M.; Pepin, D.M. Homogenization of regional river dynamics by dams and global biodiversity implications. Proc. Natl. Acad. Sci. USA 2007, 104, 5732–5737. [Google Scholar] [CrossRef] [PubMed] [Green Version]
- Jiang, R.; Bao, Y.; Shui, Y.; Wang, Y.; Hu, M.; Cheng, Y.; Cai, A.; Du, P.; Ye, Z. Spatio-Temporal variations of the stable H-O isotopes and characterization of mixing processes between the mainstream and tributary of the three gorges reservoir. Water 2018, 10, 563. [Google Scholar] [CrossRef] [Green Version]
- Deng, K.; Yang, S.; Lian, E.; Li, C.; Yang, C.; Wei, H. Three gorges dam alters the Changjiang (Yangtze) River water cycle in the dry seasons: Evidence from H-O isotopes. Sci. Total. Environ. 2016, 562, 89–97. [Google Scholar] [CrossRef] [PubMed]
- Li, C.; Yang, S.; Lian, E.; Yang, C.; Deng, K.; Liu, Z. Damming effect on the Changjiang (Yangtze River) River water cycle based on stable hydrogen and oxygen isotopic records. J. Geochem. Explor. 2016, 165, 125–133. [Google Scholar] [CrossRef]
- Wang, B.; Zhang, H.; Liang, X.; Li, X.; Wang, F. Cumulative effects of cascade dams on river water cycle: Evidence from hydrogen and oxygen isotopes. J. Hydrol. 2018, 568, 604–610. [Google Scholar] [CrossRef]
- Bhaduri, B.; Harbor, J.; Engel, B.; Grove, M. Assessing watershed-scale, long-term hydrologic impacts of land-use change using a GIS-NPS Model. Environ. Manag. 2000, 26, 643–658. [Google Scholar] [CrossRef] [PubMed]
- Walsh, C.J. Urban impacts on the ecology of receiving waters: A framework for assessment, conservation and restoration. Hydrobiologia 2000, 431, 107–114. [Google Scholar] [CrossRef]
- Shuster, W.D.; Bonta, J.; Thurston, H.; Warnemuende, E.; Smith, D.R. Impacts of impervious surface on watershed hydrology: A review. Urban Water J. 2005, 2, 263–275. [Google Scholar] [CrossRef]
- Vörösmarty, C.J.; McIntyre, P.; Gessner, M.O.; Dudgeon, D.; Prusevich, A.; Green, P.; Glidden, S.; Bunn, S.E.; Sullivan, C.A.; Liermann, C.R. Global threats to human water security and river biodiversity. Nature 2010, 467, 555–561. [Google Scholar] [CrossRef] [PubMed]
- Xu, Q.; Li, J.; Sun, P.; He, S.; Yu, S. Spatial variation and environmental significance of δ18O and δD isotope composition in Xijiang River. Environ. Sci. 2017, 38, 2308–2316. [Google Scholar]
- Yu, T.; Gan, Y.; Zhou, A.; Liu, C.; Liu, Y.; Li, X.; Cai, H. Characteristics of oxygen and hydrogen isotope distribution of surface runoff in the Lhasa River basin. Earth Sci. J. Chin. Geosci. 2010, 35, 873–878. [Google Scholar]
- Sun, T. Study on the Variable Characteristic of the Water Stable Isotopic Compositions in Yangtze River Basin; Hohai University: Nanjing, China, 2007; pp. 31–40. [Google Scholar]
- Watkins, R.; Palmer, J.; Kolokotroni, M. Increased temperature and intensification of the urban heat island: Implications for human comfort and urban design. Built Environ. 2007, 33, 85–96. [Google Scholar] [CrossRef]
- Boschetti, T.; Cifuentes, J.; Iacumin, P.; Selmo, E. Local meteoric water line of Northern Chile (18 S–30 S): An application of error-in-variables regression to the oxygen and hydrogen stable isotope ratio of precipitation. Water 2019, 11, 791. [Google Scholar] [CrossRef] [Green Version]
- Crawford, J.; Hughes, C.E.; Lykoudis, S. Alternative least squares methods for determining the meteoric water line, demonstrated using GNIP data. J. Hydrol. 2014, 519, 2331–2340. [Google Scholar] [CrossRef]
- Craig, H. Isotopic variations with meteoric water. Science 1961, 133, 1702–1703. [Google Scholar] [CrossRef] [PubMed]
- Gourcy, L.L.; Groening, M.; Aggarwal, P.K. Stable oxygen and hydrogen isotopes in precipitation. In Isotopes in the Water Cycle: Past, Present and Future of Developing Science; Aggarwal, P.K., Gat, J.R., Froehlich, K.F.O., Eds.; Springer: Dordrecht, The Netherlands, 2005; pp. 39–51. [Google Scholar]
- Bornstein, R.; LeRoy, M. Urban Barrier Effects on Convective and Frontal Thunderstorms. In Proceedings of the Fourth AMS Conference on Mesoscale Processes, Boulder, CO, USA, 25–29 June 1990. [Google Scholar]
- Dixon, P.G.; Mote, T.L. Patterns and causes of Atlanta’s urban heat island-initiated precipitation. J. Appl. Meteorol. 2003, 42, 1273–1284. [Google Scholar] [CrossRef]
- Shepherd, J.M.; Pierce, H.; Negri, A.J. Rainfall modification by major urban areas: Observation from spaceborne rain radar on the TRMM satellite. J. Appl. Meteorol. 2002, 41, 689–701. [Google Scholar] [CrossRef]
- Albrecht, J.C. Alterations in the Hydrologic Cycle Induced by Urbanization in Northern New Castle County, Delaware: Magnitudes and Projections; U.S. Environmental Protection Agency Library Report Number: DI-14-31-0001-3508; DI-14-31-0001-3808; OWRR-A-017-DEL.; W74- 07729; OWRR-A-017-DEL(2); U.S. Environmental Protection Agency: Washington, DC, USA, 1974.
- Wang, H.; Wang, J.H.; Qin, D.Y.; Jia, Y.W. Theory and methodology of water resources assessment based on dualistic water cycle model. J. Hydraul. Eng. 2006, 37, 1496–1502. [Google Scholar]
- Wang, H.; Jia, Y.W. Theory and study methodology of dualistic water cycle in river basins under changing conditions. J. Hydraul. Eng. 2016, 47, 1219–1226. [Google Scholar]
- Jasechko, S.; Kirchner, J.W.; Welker, J.M.; McDonnell, J.J. Substantial proportion of global streamflow less than three months old. Nat. Geosci. 2016, 9, 126–129. [Google Scholar] [CrossRef]
- Bornstein, R.; Lin, Q. Urban heat islands and summertime convective thunderstorms in Atlanta: Three case studies. Atmos. Environ. 2000, 34, 507–515. [Google Scholar] [CrossRef]


| City | Water in Urban Area | Water in Non−Urban Area | Analytical Precision | Sample Date | Data Source | |||||||
|---|---|---|---|---|---|---|---|---|---|---|---|---|
| δ18O (‰) | δD (‰) | Latitude (°) | Longitude (°) | δ18O (‰) | δD (‰) | Latitude (°) | Longitude (°) | δ18O (‰) | δD (‰) | |||
| Linz | −10.65 | −76.1 | 48.255 | 14.417 | −10.83 | −77.8 | 48.524 | 13.693 | ±0.2 | ±2 | 2007-08-18 | GNIR |
| Vancouver | −16.45 | −125.1 | 49.214 | −122.782 | −17.38 | −133.7 | 49.180 | −122.567 | ±0.2 | ±2 | 2009-07-28 | GNIR |
| Drobeta-Turnu Severin | −9.86 | −69.9 | 44.599 | 22.714 | −9.87 | −70.3 | 44.692 | 22.407 | ±0.2 | ±2 | 2007-09-11 | GNIR |
| Szeged | −8.61 | −62.7 | 46.255 | 20.202 | −8.91 | −63.5 | 46.129 | 20.099 | ±0.2 | ±2 | 2007-08-31 | GNIR |
| Xining | −7.991 | −50.375 | 36.632 | 101.783 | −8.472 | −50.609 | 36.570 | 101.874 | ±0.025 | ±0.1 | 2018-11-9 | Sampling points |
| Naqu | −13.44 | −108.102 | 31.479 | 92.042 | −13.6 | −108.809 | 31.528 | 92.037 | ±0.025 | ±0.1 | 2018-05-20 | Sampling points |
| Guilin | −5.04 | −29.98 | 25.281 | 110.301 | −5.53 | −33.84 | 24.779 | 110.495 | ±0.2 | ±0.6 | 2015-01-15 | Xu et al., 2017 [36] |
| Wuzhou | −6.16 | −42.01 | 23.468 | 111.31 | −6.23 | −45.82 | 23.417 | 111.493 | ±0.2 | ±0.6 | 2015-01-17 | Xu et al., 2017 [36] |
| Hezhou | −5.19 | −33.93 | 24.409 | 111.505 | −5.14 | −34.07 | 23.964 | 111.735 | ±0.2 | ±0.6 | 2015-01-17 | Xu et al., 2017 [36] |
| Lasa | −17.32 | −129 | 29.642 | 91.113 | −17.25 | −129 | 29.667 | 91.301 | ±0.1 | ±1 | 2009-08 | Yu et al., 2010 [37] |
| Wuhan | −6.64 | −38.58 | 30.568 | 114.294 | −7.41 | −45.1 | 30.437 | 114.189 | ±0.1 | ±0.8 | 2003-01 | Sun, 2007 [38] |
| Zhijiang | −9.9 | −71.57 | 30.416 | 111.766 | −11.64 | −83.14 | 30.962 | 110.755 | ±0.1 | ±0.8 | 2003-01 | Sun, 2007 [38] |
| Yueyang | −5.55 | −29.76 | 29.452 | 113.143 | −10.12 | −70.86 | 29.786 | 112.861 | ±0.1 | ±0.8 | 2003-01 | Sun, 2007 [38] |
| Level | Code | River | Length of the Reach (km) | Artificial Surface Area (km2) | Proportion of the Artificial Surface Area | Latitude |
|---|---|---|---|---|---|---|
| 1 | 1 | Athi | 327.08 | 36.66 | 0.3% | 0°–30° S |
| 2 | Amazon | 1176.98 | 99.96 | 0.2% | 0°–30° S | |
| 3 | Galana | 174.1 | 3 | 0.05% | 0°–30° S | |
| 4 | Mackenzie | 1719.91 | 66.73 | 0.1% | 60° N–90° N | |
| 5 | Murray | 1908.21 | 247.2 | 0.5% | 30° S–60° S | |
| 6 | Solimoes | 1641.26 | 70.99 | 0.1% | 0°–30° S | |
| 7 | Tana | 868.69 | 30.02 | 0.1% | 0°–30° S | |
| 8 | Chenqu | 18.98 | 12.01 | 0.6% | 30° N–60° N | |
| 2 | 9 | Congo | 1720.26 | 672.17 | 1% | 0°–30° S |
| 10 | Fraser | 1359.87 | 1208.21 | 2.8% | 30° N–60° N | |
| 11 | Min | 329.92 | 156.01 | 1.3% | 30° N–60° N | |
| 12 | Oldman | 290.19 | 128.79 | 1.4% | 30° N–60° N | |
| 13 | Pecos | 556.61 | 471.98 | 2.6% | 30° N–60° N | |
| 14 | Huangshui | 212.48 | 190.66 | 2% | 30° N–60° N | |
| 15 | Beichuan | 114.75 | 133.25 | 2.5% | 30° N–60° N | |
| 16 | Lhasa River | 255.63 | 97 | 1% | 30° N–60° N | |
| 3 | 17 | Danube | 3034.89 | 6573.2 | 6.6% | 30° N–60° N |
| 18 | Great Morava | 180.81 | 377.86 | 6.1% | 30° N–60° N | |
| 19 | Sava | 225.02 | 490.59 | 7.5% | 30° N–60° N | |
| 20 | Tisza | 838.37 | 1435.87 | 5.7% | 30° N–60° N | |
| 21 | Yangtze | 2233.13 | 3865.3 | 5.2% | 30° N–60° N |
| City | River Basin | Length of River Reach (km) | Artificial Surface Area (km2) | ||
|---|---|---|---|---|---|
| 10 km | 20 km | 50 km | |||
| Linz | Danube | 88.84 | 104.1 | 161.65 | 361.54 |
| Vancouver | Fraser | 18.60 | 101.26 | 292.78 | 860.98 |
| Drobeta-Turnu Severin | Danube | 32.52 | 30.98 | 48.02 | 116.73 |
| Szeged | Tisza | 23.97 | 54.62 | 83.12 | 213.94 |
| Xining | Huangshui | 12.56 | 14.21 | 22.80 | 75.25 |
| Naqu | Chenqu | 13.49 | 13.49 | 18.32 | 18.51 |
| Guilin | Lijiang | 81.71 | 103.68 | 146.38 | 237.11 |
| Wuzhou | Xijiang | 22.83 | 25.19 | 65.43 | 125.79 |
| Hezhou | Hejiang | 88.79 | 45.95 | 63.47 | 124.34 |
| Lhasa | Lhasa River | 22.09 | 34.81 | 49.27 | 49.65 |
| Wuhan | Yangtze | 19.20 | 129.49 | 329.57 | 818.33 |
| Zhijiang | Yangtze | 172.30 | 249.52 | 341.25 | 502.43 |
| Yueyang | Yangtze | 86.67 | 46.9 | 121.28 | 252.17 |
© 2019 by the authors. Licensee MDPI, Basel, Switzerland. This article is an open access article distributed under the terms and conditions of the Creative Commons Attribution (CC BY) license (http://creativecommons.org/licenses/by/4.0/).
Share and Cite
Li, X.; Weng, B.; Yan, D.; Qin, T.; Wang, K.; Bi, W.; Yu, Z.; Dorjsuren, B. Anthropogenic Effects on Hydrogen and Oxygen Isotopes of River Water in Cities. Int. J. Environ. Res. Public Health 2019, 16, 4429. https://doi.org/10.3390/ijerph16224429
Li X, Weng B, Yan D, Qin T, Wang K, Bi W, Yu Z, Dorjsuren B. Anthropogenic Effects on Hydrogen and Oxygen Isotopes of River Water in Cities. International Journal of Environmental Research and Public Health. 2019; 16(22):4429. https://doi.org/10.3390/ijerph16224429
Chicago/Turabian StyleLi, Xiangnan, Baisha Weng, Denghua Yan, Tianling Qin, Kun Wang, Wuxia Bi, Zhilei Yu, and Batsuren Dorjsuren. 2019. "Anthropogenic Effects on Hydrogen and Oxygen Isotopes of River Water in Cities" International Journal of Environmental Research and Public Health 16, no. 22: 4429. https://doi.org/10.3390/ijerph16224429