Air Pollution as a Cause of Obesity: Micro-Level Evidence from Chinese Cities


1
Donlinks School of Economics and Management, University of Science and Technology Beijing, Beijing 100083, China
2
Center for Central China Economic and Social Development Research, Nanchang University, Nanchang 330031, China
3
School of Economics and Management, Nanchang University, Nanchang 330031, China
4
Department of Epidemiology and Biostatistics, School of Public Health, Medical College, Wuhan University of Science and Technology, Wuhan 430065, China
5
Hubei Province Key Laboratory of Occupational Hazard Identification and Control, Wuhan University of Science and Technology, Wuhan 430065, China
*
Author to whom correspondence should be addressed.
Int. J. Environ. Res. Public Health 2019, 16(21), 4296; https://doi.org/10.3390/ijerph16214296
Submission received: 30 September 2019
/
Revised: 1 November 2019
/
Accepted: 3 November 2019
/
Published: 5 November 2019
(This article belongs to the Special Issue Air Pollution and Cardiopulmonary Health)
Abstract
:Chinese air pollution is obviously increasing, and the government makes efforts to strengthen air pollution treatment. Although adverse health effects gradually emerge, research determining individual vulnerability is limited. This study estimated the relationship between air pollution and obesity. Individual information of 13,414 respondents from 125 cities is used in the analysis. This study employs ordinary least squares (OLS) and multinomial logit model (m-logit) to estimate the impact of air pollution on obesity. We choose different air pollution and Body Mass Index (BMI) indicators for estimation. Empirical results show Air Quality Index (AQI) is significantly positively associated with the BMI score. As AQI adds one unit, the BMI score increases 0.031 (SE = 0.002; p < 0.001). The influence coefficients of particle size smaller than 2.5 μm (PM2.5), particle size smaller than 10 μm (PM10), carbon monoxide (CO), nitrogen dioxide (NO2), ozone (O3), and sulfur dioxide (SO2) to the BMI score are 0.034 (SE = 0.002; p < 0.001), 0.023 (SE = 0.001; p < 0.001), 0.52 (SE = 0.095; p < 0.001), 0.045 (SE = 0.004; p < 0.001), 0.021 (SE = 0.002; p < 0.001), 0.008 (SE = 0.003; p = 0.015), respectively. Generally, air pollution has an adverse effect on body weight. CO is the most influential pollutant, and female, middle-aged, and low-education populations are more severely affected. The results confirm that the adverse health effects of air pollution should be considered when making the air pollution policies. Findings also provide justification for health interventions, especially for people with obesity.
1. Introduction
China has achieved remarkable economic development over the past 30 years; however, an unintended consequence of this growth is its negative influence on the natural environment. For example, regional pollution incidents in China have increased, which not only influence human well-being but also threaten residents’ health. Many studies have explained the impact of air pollution on human health and the incidence of diseases such as respiratory and cardiovascular diseases [1,2,3]. Several studies focused on various pollutants in the air and found that these pollutants could negatively affect multiple systems and organs in the human body at a specific concentration, thereby having a significant impact on population mortality and susceptibility to other diseases [4,5,6]. Specifically, most recent literature paid attention to the adverse effects of air pollution on cancer and chronic diseases [7,8,9,10,11,12]. For example, Jaganathan et al. (2019) [8] reviewed the relationship between long-term exposure to fine particulate matter and cardio-metabolic diseases in developing countries; Filippini et al. (2019) [10] analyzed the association between outdoor air pollution and childhood leukemia based on meta-analysis; and Gaio et al. (2019) [11] focused on air pollution and lipid profile. A large amount of evidence depicted the adverse effects of air pollution on human health problems.
Obesity is defined by the World Health Organization (WHO) as a disease characterized by the excessive accumulation of body fat [13]. In 2019, the WHO listed air pollution and obesity among the top ten threats to human health [14]. Obesity is considered as a public health problem, leading to serious social, psychological, and physical problems [13]. Existing literature has demonstrated that air pollution is one of the major factors influencing obesity in developed countries [15,16]. Therefore, it is of considerable significance to assess the impact of air pollution on obesity. However, to the best of our knowledge, few studies focus on the relationship between air pollution and obesity in developing countries, particularly in China.
Air pollution could affect obesity from several aspects. On the one hand, air pollution could increase the risk of a number of diseases. For example, Xu et al. (2010) [17], Toledo-Corral et al. (2018) [18], and An et al. (2018) [16] found that air pollution leads to metabolic disorder, which is closely related to body weight; WHO (2018) [19] proposes that air pollution increases the possibility of cardiovascular and respiratory diseases, heart diseases, and some cancers, which, in turn, affect body weight. On the other hand, pollution could also affect people’s behavior responses that influence body weight. For example, people choose to stay indoors in days with heavier pollution and reduce time for physical activities [20,21,22,23], which, in turn, reduce calories expended and cause obesity.
Most literature on the relationship between air pollution and obesity is concentrated in developed countries [15,16]. In developing countries, especially China, there are growing concerns regarding children’s exposure to pollution and increased obesity rates. Epidemiologic evidence suggests that air pollution is a risk factor in childhood obesity [16,24,25,26,27,28,29]. Childhood obesity has emerged as a major public health problem in the United States and elsewhere [30]. Children are a special group considered to be more susceptible to epidemics and air pollution. Unlike childhood obesity, we know little about the effects of obesity from air pollution on the Chinese adult population.
The above studies provide a basis for analyzing the relationship between air pollution and obesity in adults across the country. At present, few studies specifically investigate whether air pollution leads to obesity in China. Given this lack of research, the primary aim of the study is to obtain micro-level evidence from Chinese cities to research and assess the impact of air pollution on obesity in developing countries.
2. Methods
2.1. Data
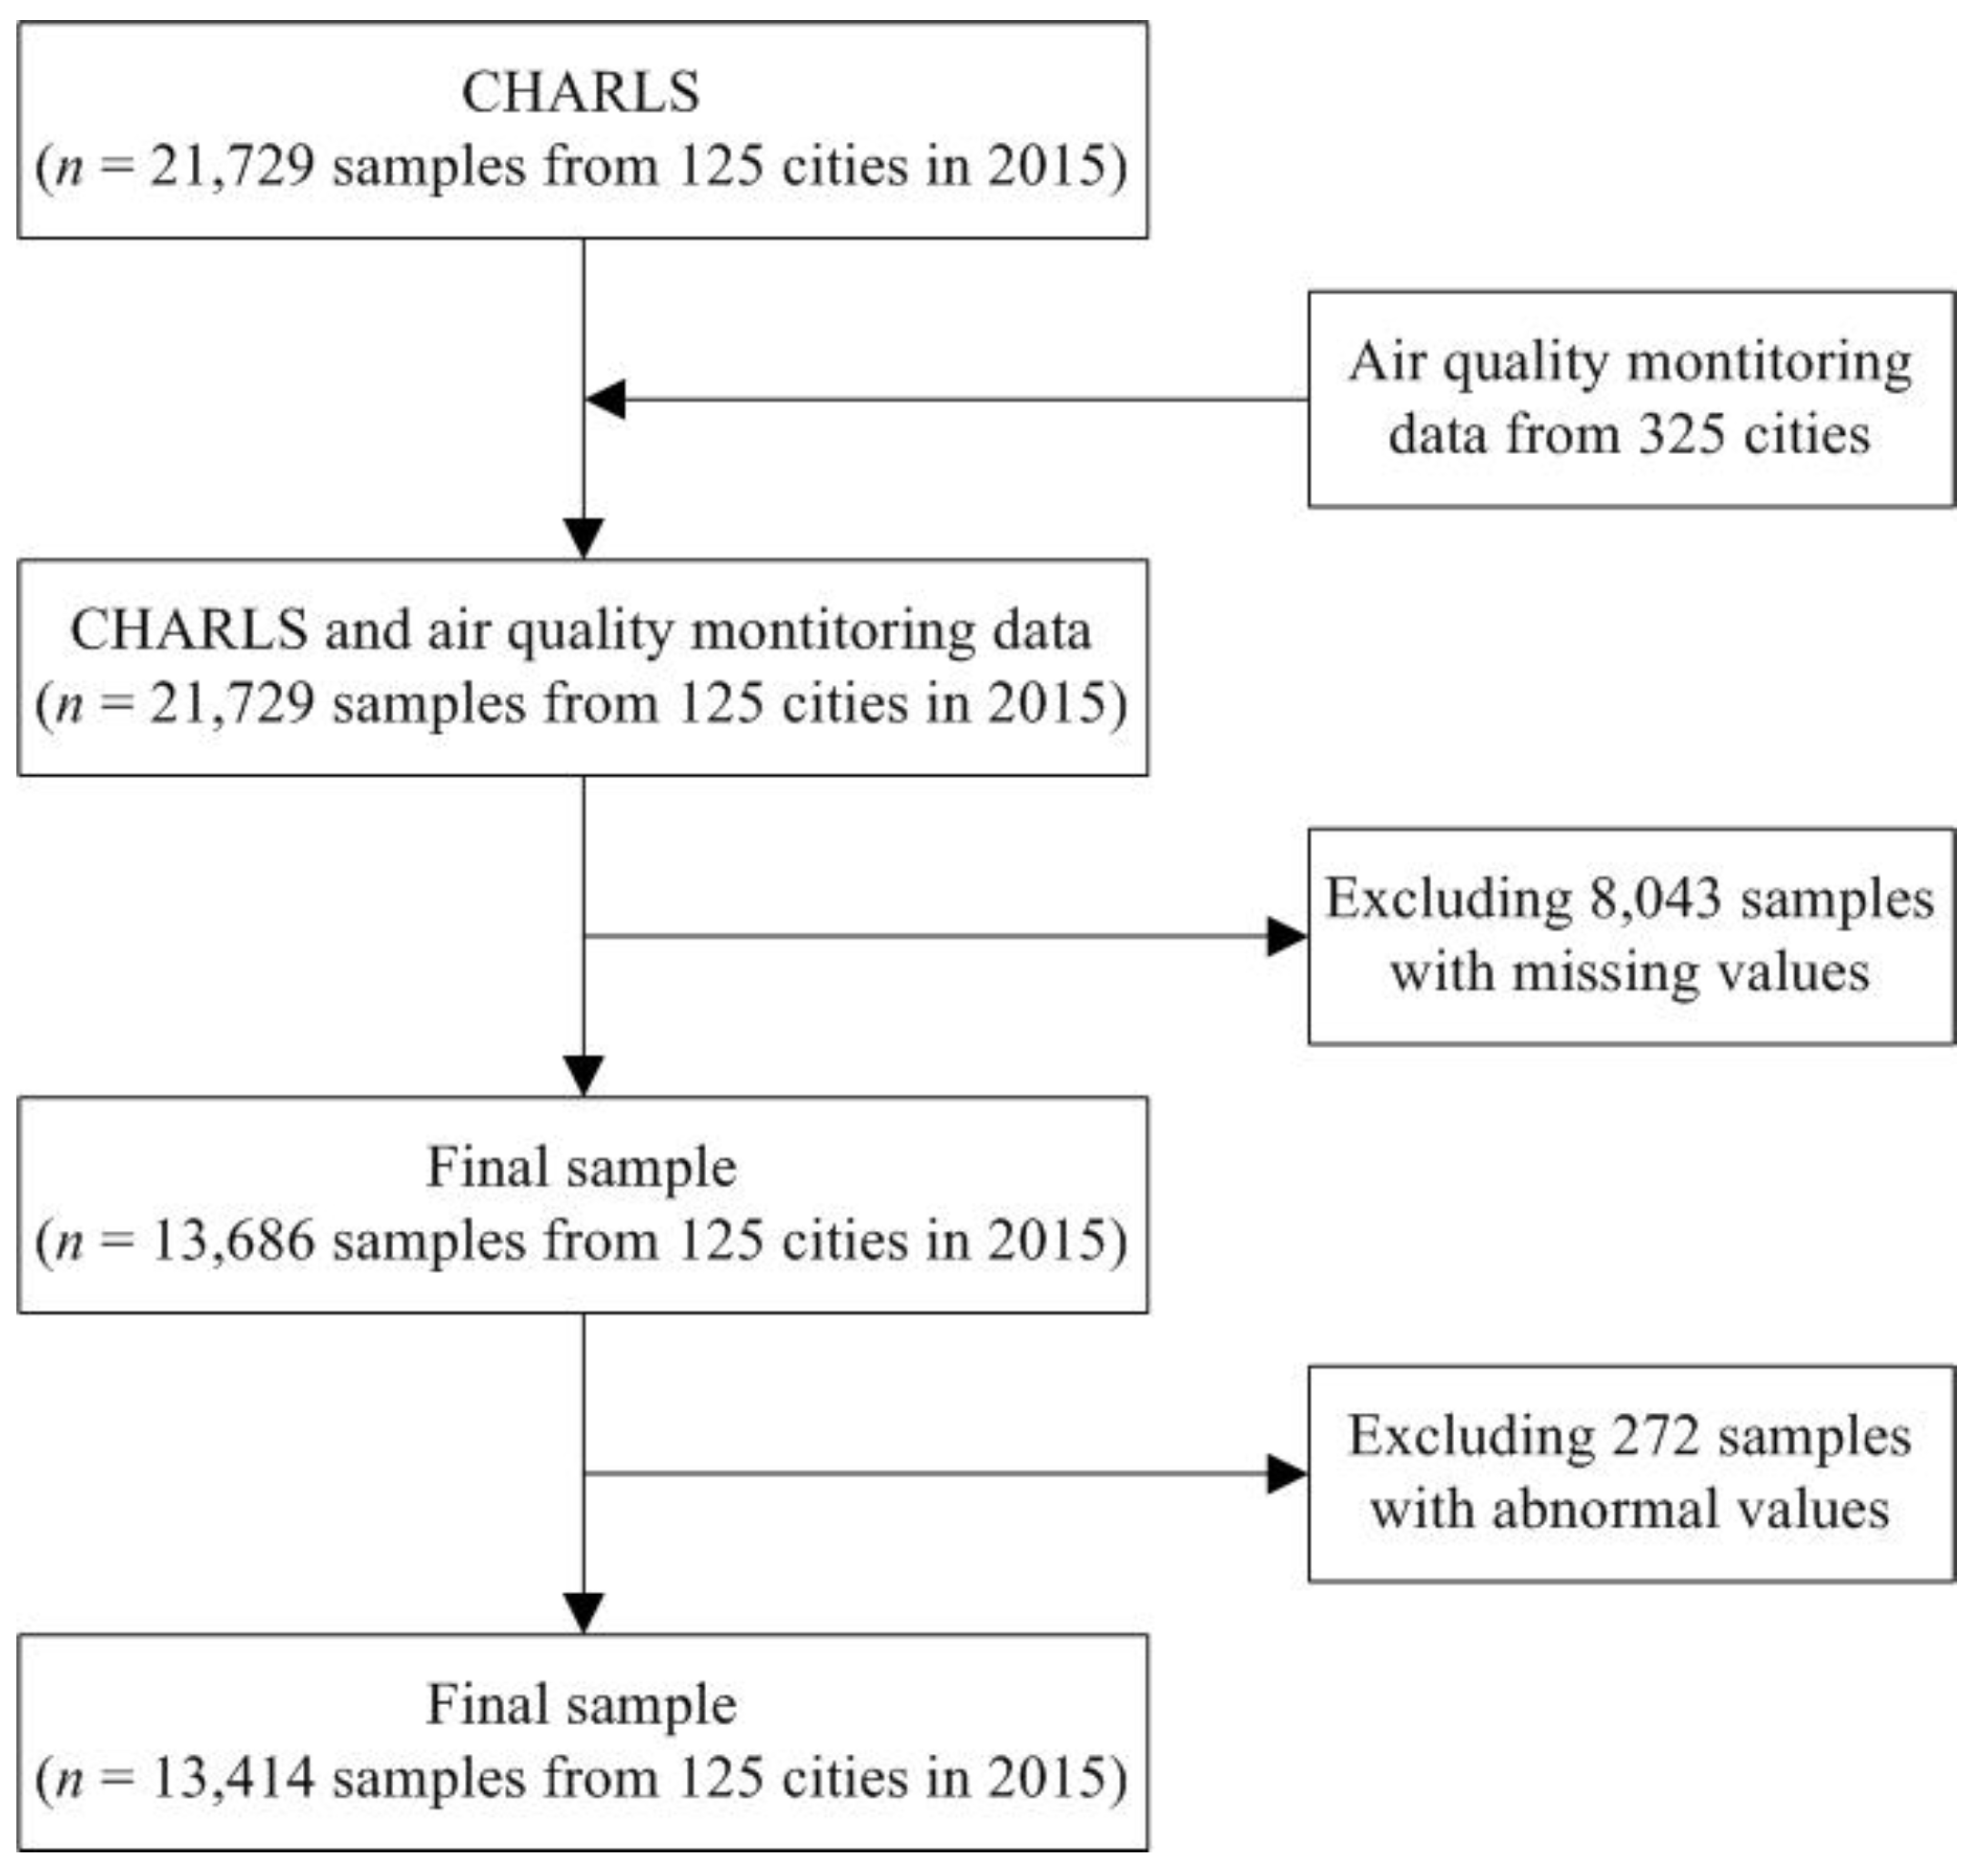
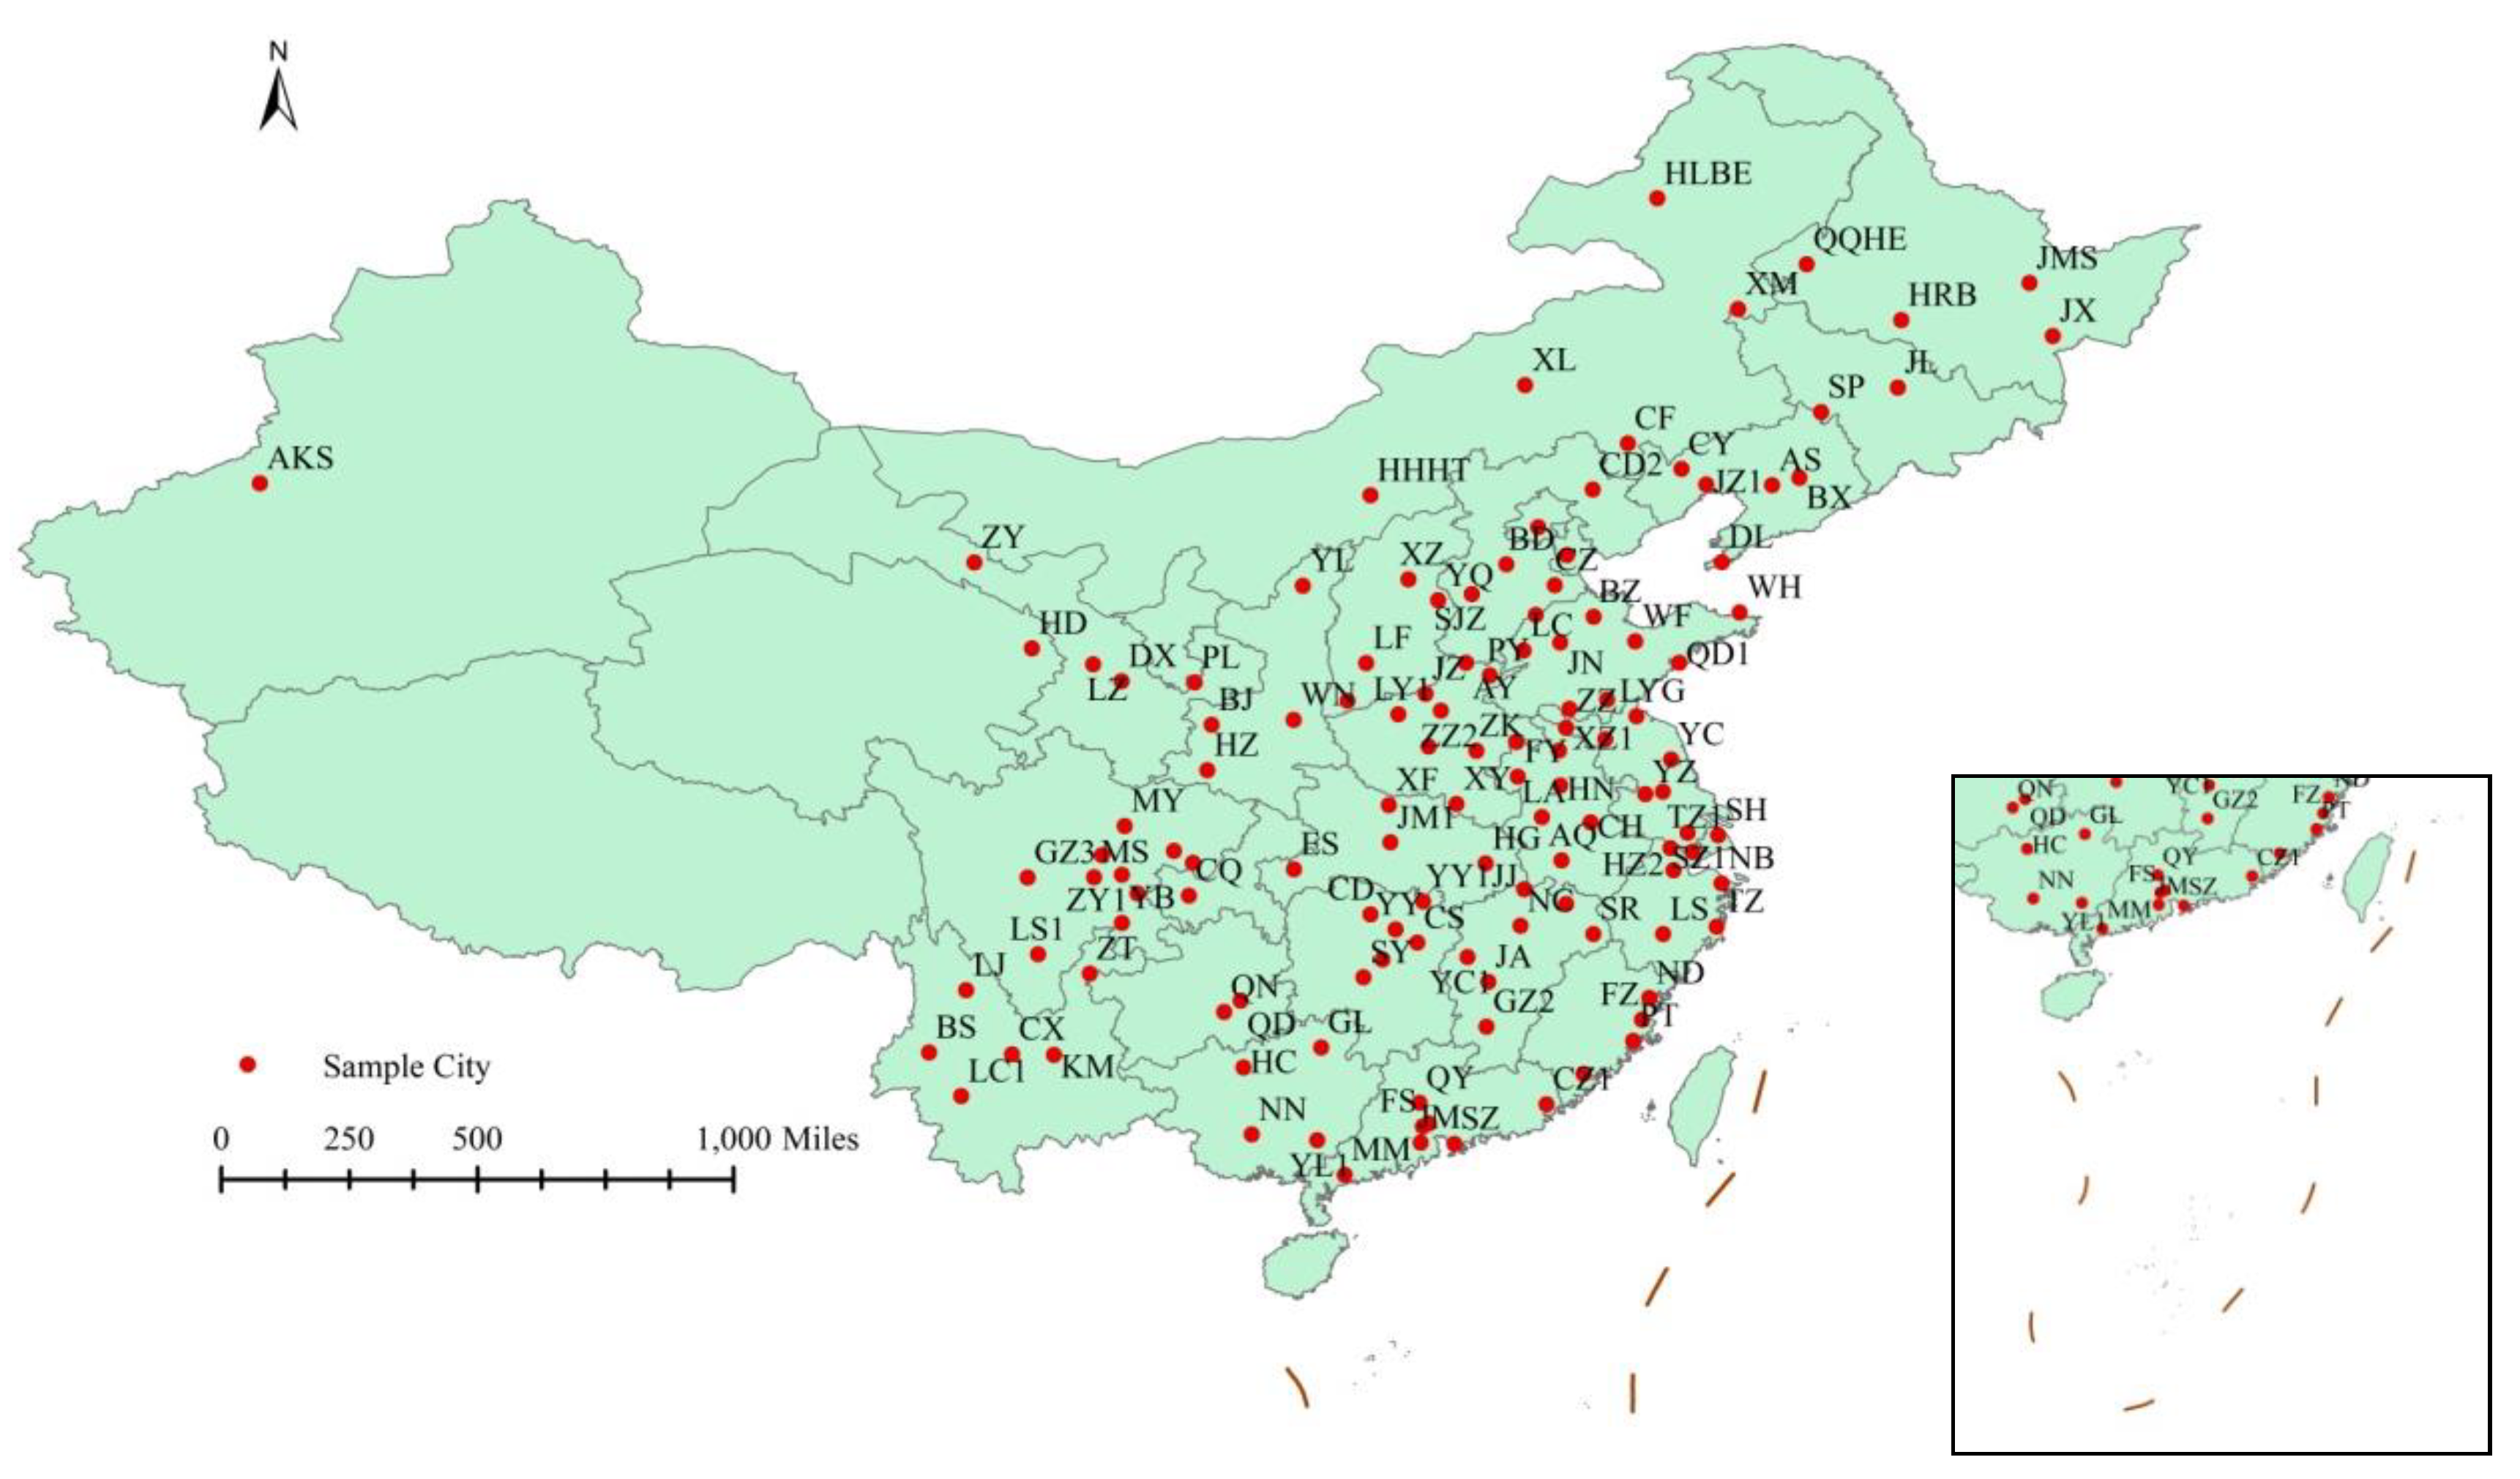
This study collects a dataset consisting of individual information and city-level variables to evaluate the relationship between air pollution and obesity. Individual data were derived from the China Health and Retirement Longitudinal Study (CHARLS) in 2015, which is a nationally representative survey conducted among middle-aged and elderly Chinese residents (aged 45 years and above) using face-to-face computer-assisted personal interviews. The CHARLS questionnaire included the following modules: demographics, family structure, health status and functioning capabilities, biomarkers, health care and insurance, work, retirement and pension, income and consumption, assets (individual and household), and community-level information [31,32]. The ethics committee of Peking University Health Science Center approved this study, and all participants gave written informed consent before participation [33]. Using multi-stage stratified probability-proportionate-to-size sampling, the sample in CHARLS represented approximately 12,400 households in 150 counties/districts (a total of 450 villages/resident communities). A total of 21,729 respondents participated in the interview. In this study, data from CHARLS were constructed to estimate the obesity problem and control variables. Before measurement, raw data had to be properly processed. As some respondents have missing values, 13,686 respondents in 2015 were considered. Furthermore, as the measurement error is most likely to affect the extreme value, to ensure the stability of the data and improve the accuracy and standardization of the analysis, the samples with height and weight at 1% before and after (about 272 respondents) are excluded. In the end, 13,414 respondents in 2015 are considered. Figure 1 presents a flow chart of the study process. Meanwhile, the hourly pollutant levels from 125 cities were evaluated using data from the national urban air quality monitoring network. Figure 2 presents the 125 cities in China.
2.2. Variables
2.2.1. Body Mass Index (BMI)
Body Mass Index (BMI) is an important standard used to measure the degree of obesity and the health of the human body [13]. BMI is a relatively objective parameter to measure body mass and is calculated as weight (in kilograms) divided by the square of the height (in meters) (BMI unit: kg/m2). Therefore, the higher the BMI, the greater the obesity [34]. BMI as a tool for measurement is recommended by the WHO and is also widely used in epidemiological studies to assess excessive weight and obesity levels in people of different ages, sexes, and ethnicities. In addition, BMI is widely used to assess the degree of obesity and the risk of obesity-related diseases [35].
As the percentage of body fat and cardiovascular risk in Asians are usually higher for a given BMI value than in the Western population, it is recommended to establish appropriate thresholds for each country [36]. In this study, we use multiple standards, Chinese, WHO, and Asian standards, to define obesity, rather than just using one standard (see Table 1).
2.2.2. Air Pollution
We obtained the hourly pollutant data from the national urban air quality monitoring network from 1 April 2015 to 31 August 2015. We primarily used the Air Quality Index (AQI) to measure air pollution. AQI is China’s new air quality evaluation standard [37] and monitors the levels of six pollutants: particle size smaller than 2.5 μm (PM2.5), particle size smaller than 10 μm (PM10), carbon monoxide (CO), nitrogen dioxide (NO2), ozone (O3) and sulfur dioxide (SO2). The higher the indicator values, the higher the pollution levels. According to the environmental AQI technical regulations, AQI can be divided as: 0–50, 51–100, 101–150, 151–200, 201–300, and >300, corresponding to the air quality index level 1 (excellent), level 2 (good), level 3 (mild pollution), level 4 (moderate pollution), level 5 (heavy pollution), and level 6 (serious pollution). Generally, if the air quality is excellent or good, it has less impact on outdoor activities. To test the stability of the model, we also chose other air pollution indicators for robust estimation, such as PM2.5, PM10, CO, O3, NO2, and SO2.
2.3. Estimation Strategy
Descriptive analysis is first performed to describe the sample characteristics for the total sample and by BMI according to Chinese criteria. Frequencies with percentages for categorical variables (e.g., sex, marital status, insurance status, education, health behavior, categorical BMI, and AQI levels), and means with standard deviations were reported for continuous variables (e.g., age, BMI, and air pollution indicators) were presented.
We employed the ordinary least squares (OLS) method to analyze the relationship between air pollution and the degree of obesity, which can be presented as follows:
where the subscript i and c denote individual and city respectively, BMIic is the degree of obesity of individual i in city c; Airic denotes the air pollution of person i in city c; Xic represents individual characteristics and health behavior of person i in city c, including sex, age, education, etc.; a0, a1, a2 are the parameters to be estimated; eic is the idiosyncratic error term and it obeys a normal distribution.
BMIic = a0 + Airica1 + Xica2 + eic
Given the existence of the BMI standard and the categorical variables, the OLS estimation may provide inconsistent estimates. Therefore, we chose multinomial logit model (m-logit), which can be expressed as:
where BMIic has 4 levels: Underweight, Normal, Overweight and Obese; b0, b1, b2 are the parameters to be estimated; and BMI*ic is a latent variable and BMIic is its observable variable. In addition, we chose different air pollution and BMI indicators for estimation and examined the impact of lagging air pollution. A stratified analysis approach was used to discuss the role of sex, age, and education in air pollution and obesity. Dependent variable is BMI score, and we used OLS estimation, with robust standard errors. Dependent variable is BMI according to Chinese criteria, and we used m-logit estimation. Stata 14 was applied to statistical analysis.
BMI*ic = b0 + Airicb1 + Xicb2 + eic
BMI*ic = 0, if BMIic <18.5
= 1, if 18.5 ≤ BMIic < 23.9
= 2, if 24 ≤ BMIic < 27.9
= 3, if BMIic ≥28
3. Results
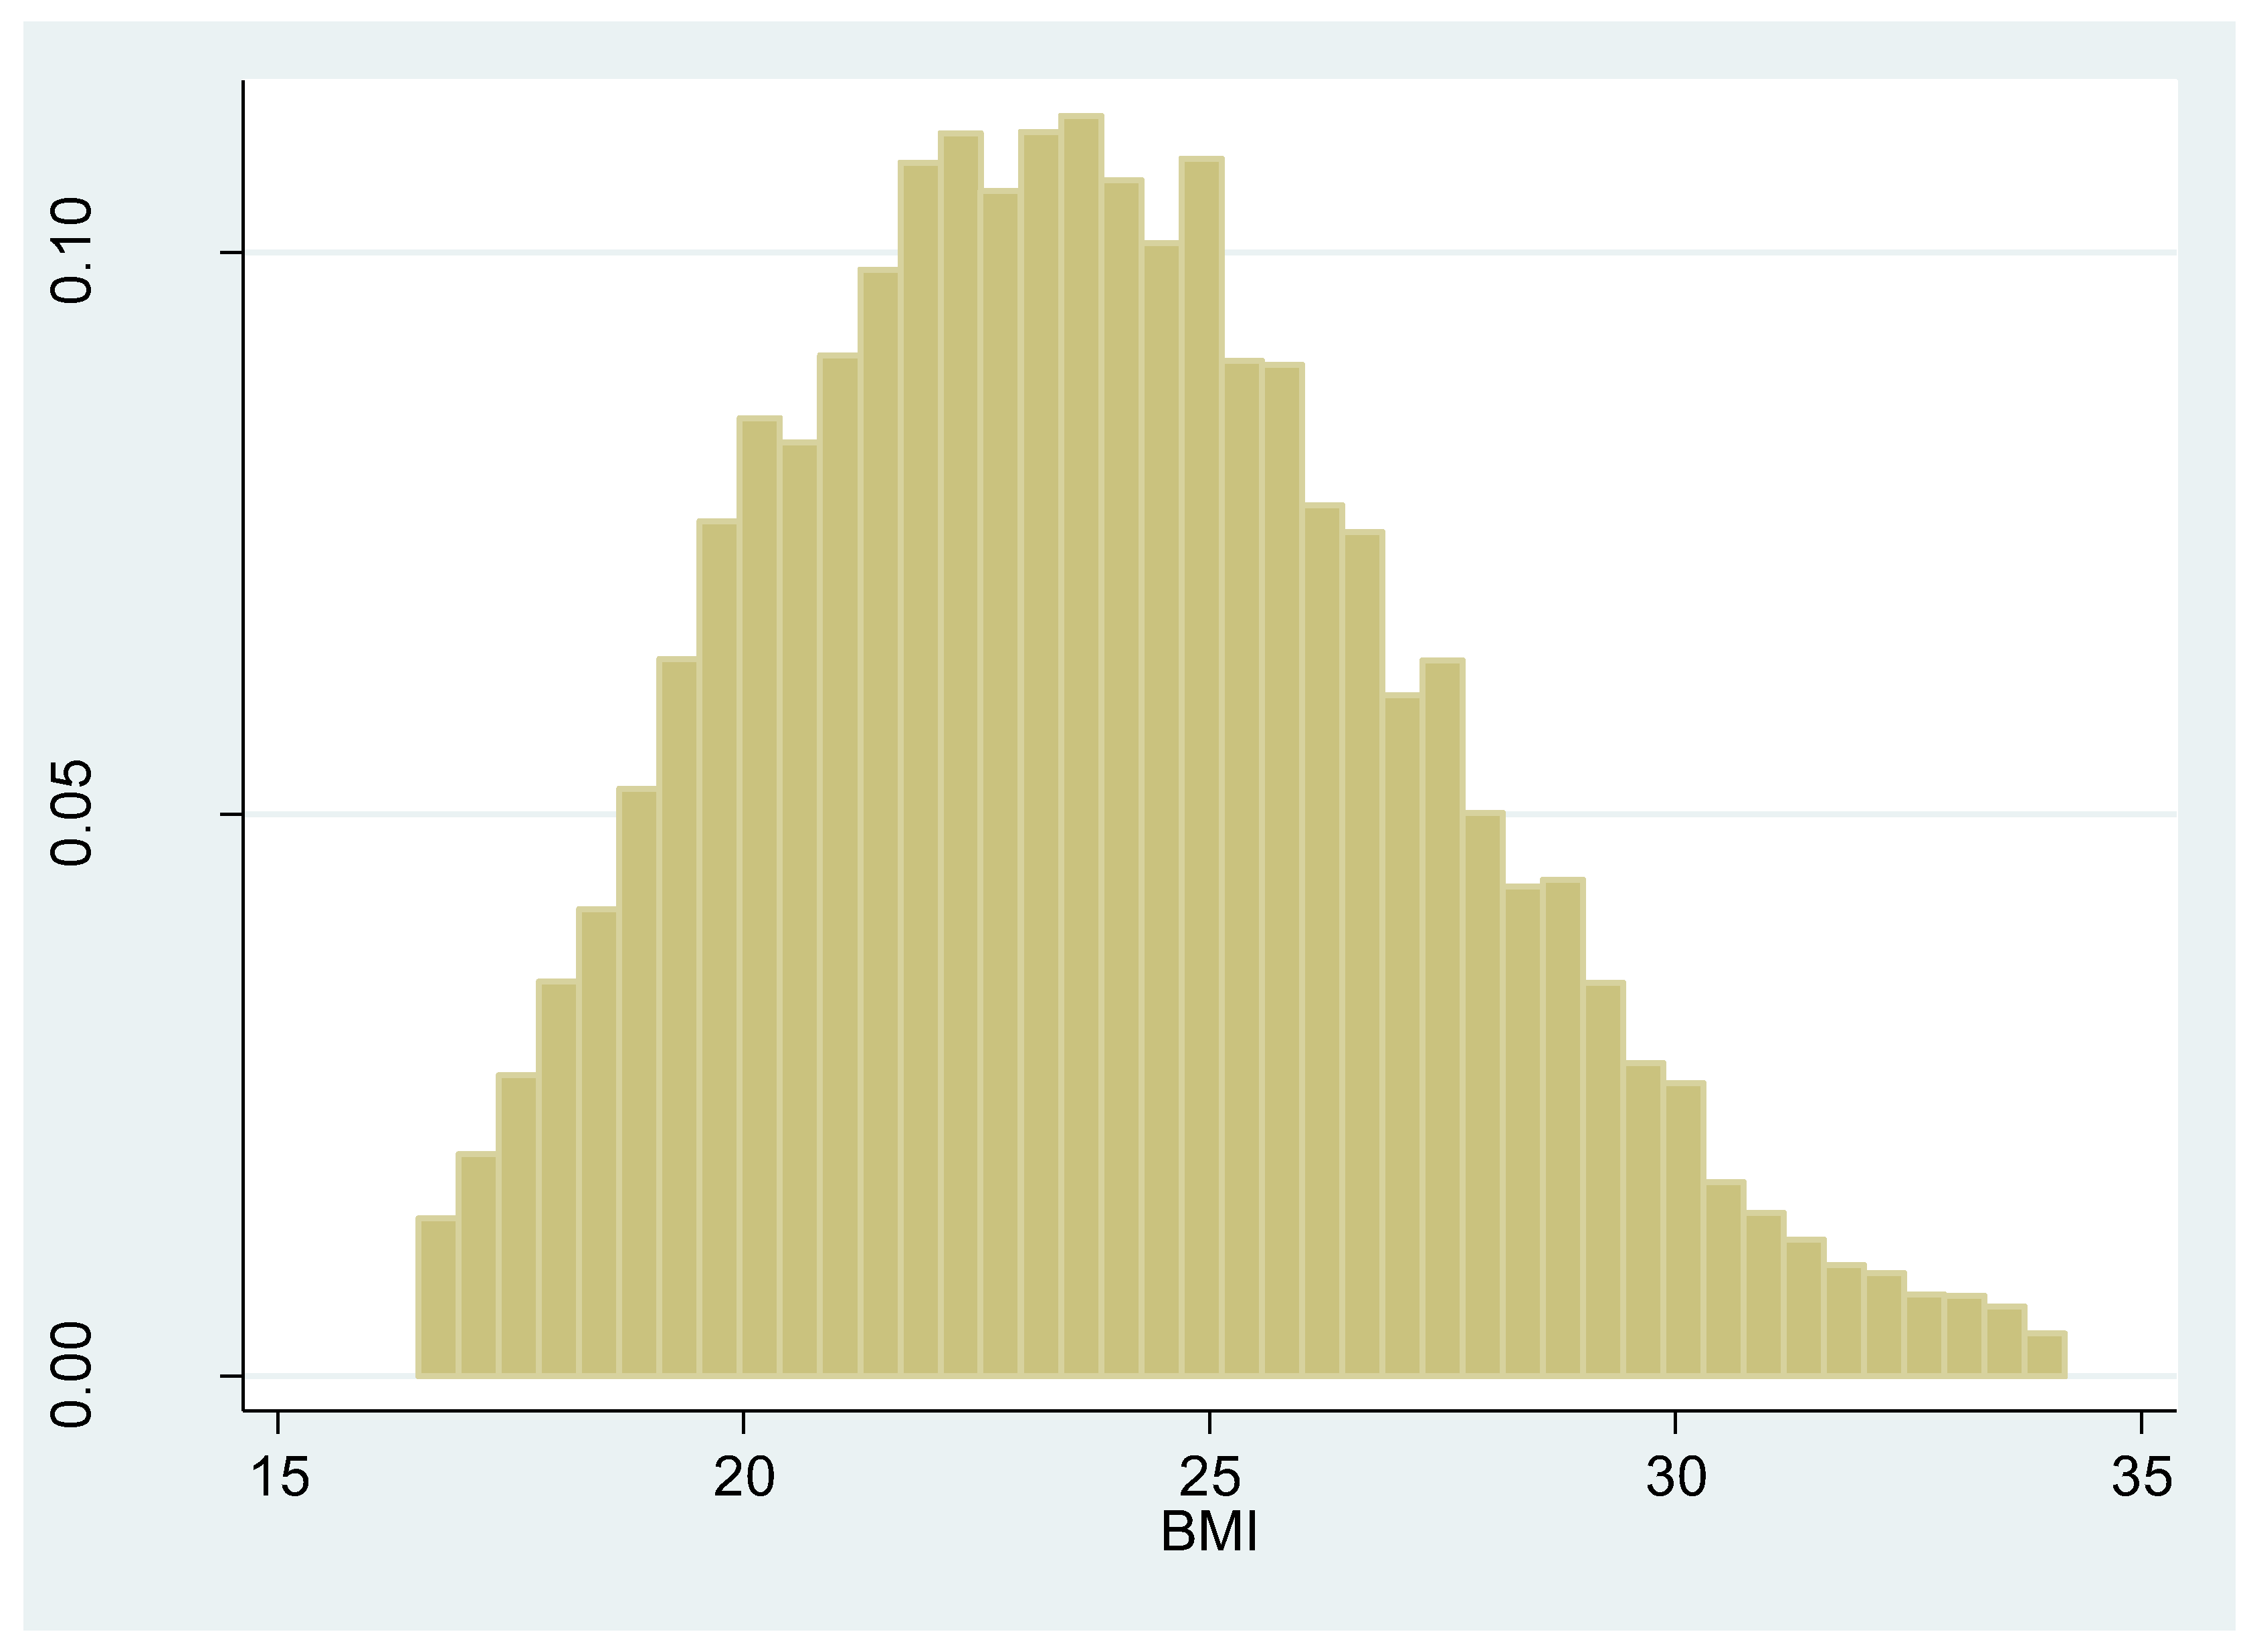
Respondents’ characteristics and average AQI levels across BMI levels are shown in Table 2. The total study population consisted of 13,414 respondents with a mean age of 61 years; 46.7% were male, 86.64% were married, and 8.12% were uninsured. A minority, 25.70% of participants had no formal education, 19.69% did not finish primary school and home school, 22.68% elementary school, and 31.93% had middle school education and above. A total of 30.77% respondents smoked, and 26.09% reported that they drank alcohol frequently. The average BMI was 23.77 and 12.02% were obese (Meanwhile, Figure 3 depicts the histogram of the BMI score). The average monthly AQI was 64.39 and a minority, 20.8% of samples had low AQI categorical levels (<49.9); the vast majority (76.9%) of samples had moderate categorical AQI levels (50–99.9), 2.3% of samples have a higher AQI categorical levels (>100). The average continuous AQI was 67.1 when we used a one-month lag, 74.04 when we used a two-month lag, and 79.72 when we used a three-month lag.
AQI on BMI is shown in Table 3. In Table 3, the second and third columns represent the results from the OLS regression, which are the results of Equation (1). Columns 4 to 9 denote the results of m-logit, which are the results of Equation (2). Generally, Coefficients and robust standard errors are reported for the OLS regression model, while the adjusted odds ratio and 95% confidence interval values are used for the m-logit. The coefficient of AQI on BMI is 0.031 (SE = 0.002; p < 0.001), which is significantly positive, indicating a positive association between air pollution and obesity. This result is consistent with those of previous Chinese studies and results from the USA. As AQI added one unit, the BMI score increased by 0.031 (SE = 0.002; p < 0.001). Specifically, the coefficient for obese participants is higher than those who were underweight. The effects of AQI on “Normal”, “Overweight”, and “Obese” levels based on Chinese criteria were 1 percent (95% CI: 1.005, 1.015), 2.4 percent (95% CI: 1.019, 1.029) and 3.2 percent (95% CI: 1.027, 1.038), respectively.
The interpretation of other control variables is also necessary. Taking the OLS estimation results as an example, the coefficient of males on the BMI score was −0.229 (SE = 0.078; p = 0.003), meaning that if the respondent was a male, the BMI score was 0.229 lower than that of a female. The coefficient of age was −0.052 (SE = 0.003; p < 0.001), which has a significantly negative effect on BMI. With an increase in age, the BMI score gradually decreased. As the level of education increased, BMI increased. Compared with “No formal education”, respondents of “Did not finish primary school and home school”, “Elementary school”, “Middle school and above” had higher BMI scores. The coefficients are 0.146 (SE = 0.089; p = 0.1), 0.287 (SE = 0.087; p = 0.001), and 0.527 (SE = 0.085; p < 0.001), respectively. That is, the higher the education level, the higher the BMI scores. Married couples significantly increased the BMI score, and the BMI score of the married respondents was 0.219 (SE = 0.087; p = 0.012) higher than that of unmarried respondents. That is, keeping other factors constant, the body weight would also increase gradually in the wedded life.
Concerning health behavior, an interesting conclusion was that only those who smoke displayed significant effects on BMI. Compared with non-smoking respondents, the BMI score of the smokers was reduced by 1.183 (SE = 0.075; p < 0.001). Although drinking wine also had negative effect on body weight, the impact was not significant even at 10% significant level for both regression model and m-logit model. Furthermore, we illustrated the impact of exercises on body weight. The amount of time spending on physical activity (exercise or work which is hard enough to make you breathe more heavily and to make your heart beat faster) in a usual week was used to measure respondent’s exercise level for at least 10 min. Examples include aerobics, fast bicycling, brisk walking, and heavy labor, e.g., heavy lifting, digging, plowing. Three levels of physical activity were coded as 0 times/wk, 1 to 3 times/wk, and 4 times/wk. The three levels of physical activity were also named as sedentary, moderately active, and very active. The results indicated that exercise had negative effect on body weight. The coefficient for moderately active exercise and very active exercise are −0.28 (SE = 0.142; p = 0.048) and −0.663 (SE = 0.096; p < 0.001), respectively. That is, the more exercise the people do, the thinner they are. As only 6505 respondents were asked the questions about the time of physical activity, we put the results including exercise in the Appendix A.
Table 4 depicts the effects of AQI on BMI according to WHO and Asian criteria. We divided the BMI values based on the WHO and Asian classification standards, respectively, and we obtained similar results to Table 3 in which we used Chinese criteria.
We changed the AQI calculation method and used the median AQI for the month to calculate the AQI indicator. Table 5 depicts the effects of the median AQI on BMI. With an increase in AQI, the BMI score increased by 0.03 (SE = 0.002; p < 0.001). Specifically, obese participants had a closer positive correlation than those who were underweight and overweight. The coefficient of “Underweight” Chinese criteria BMI scores was 1.0, and a BMI of “Normal”, “Overweight”, and “Obese” were more likely to be reported by 1 percent (95% CI: 1.005, 1.015), 2.3 percent (95% CI: 1.018, 1.029) and 3.1 percent (95% CI: 1.026, 1.037), respectively. Although we changed the AQI calculation method and we obtained similar results to Table 3.
The effect of AQI on BMI with categorical AQI levels is shown in Table 6. Each categorical AQI level has significantly positive effects on the BMI score. Compared with excellent air quality (0–49.9), the influence of good air quality (50–99.9) and mild pollution (100–149.9) on BMI score is 0.752 (SE = 0.069; p < 0.001) and 1.364 (SE = 0.207; p < 0.001). Under the same pollution level, the influence of AQI increased as the obesity of participants increased, for example, AQI belonged to 50–99.9.
Effect of AQI on BMI with AQI lag is shown in Table 7. The results reveal a significantly positive relationship between each lagged AQI and the BMI score. When we used a one-month lag, the BMI score increased by 0.027 (SE = 0.001; p < 0.001) with AQI growth. When we used a two-month lag, with AQI increasing, the BMI score increased by 0.022 (SE = 0.001; p < 0.001). When we used a three-month lag, the BMI score increased by 0.024 (SE = 0.001; p < 0.001).
From Table 3; Table 7, we found that both the current AQI and the lagged AQI (one-month lag, two-month lag and three-month lag) had a positive effect on BMI. However, the impact from AQI gradually decreased. That is, the farther away from the month of the interview, the smaller the impact.
Effects of other air pollution on BMI are shown in Table 8. All other air pollutants (PM2.5, PM10, CO, NO2, O3 and SO2) represent a significantly positive impact on the BMI score. When one unit of PM2.5, PM10, CO, NO2, O3, or SO2 was added, the BMI score increased by 0.034 (SE = 0.002; p < 0.001), 0.023 (SE = 0.001; p < 0.001), 0.52 (SE = 0.095; p < 0.001), 0.045 (SE = 0.004; p < 0.001), 0.021 (SE = 0.002; p < 0.001), 0.008 (SE = 0.003; p = 0.015), respectively. We found that CO (the coefficient: 0.52 (SE = 0.095; p < 0.001)) had relatively larger impacts than other air pollutants. That is, from the perspective of the one-unit air pollution increase, the order of the impact for the six pollutants from large to small is: CO, NO2, PM2.5, PM10, O3, and SO2, respectively.
Table 9 reports the effect of AQI on BMI from the perspective of sex, age, and education. We split the samples by sex, age, and education, respectively, and obtained results similar to Table 5 regarding the effects of AQI on the BMI score. All air pollution consistently led to an increase in the BMI score. Additionally, from the results of the OLS model, females were more susceptible to AQI in terms of obesity than males were (0.034 (SE = 0.002; p < 0.001) vs. 0.027 (SE = 0.002; p < 0.001)). There was no significant difference for young people and elderly people in the OLS regression analysis (0.03 (SE = 0.002; p < 0.001) vs. 0.03 (SE = 0.002; p < 0.001)), while in the m-logit model, young people were more susceptible to AQI than the elderly (1.015 (95%: 1.005, 1.025) vs. 1.008 (95%: 1.002, 1.014) for normal weight; 1.027 (95%: 1.017, 1.037) vs 1.023 (95%: 1.017, 1.03) for overweight and 1.036 (95%: 1.026, 1.047) vs 1.031 (95%: 1.024, 1.038) for obese). That is, age had much greater influence on body weight in young people, and people lower than 60 should pay more attention to body weight. For education levels, the higher the level of education, the less the BMI was affected by AQI (0.037 (SE = 0.003; p < 0.001) vs. 0.029 (SE = 0.003; p < 0.001) vs. 0.027 (SE = 0.003; p < 0.001)). The results estimated by the m-logit method were consistent with the OLS results. The difference was that the age group test that indicated the impact of pollution on middle-aged people was greater than that of the elderly.
4. Discussion
The 2015 CHARLS information and air pollution data for 125 cities from a national urban air quality monitoring network were used with ordinary least squares (OLS) and multinomial logit model (m-logit) estimation to assess the impact of air pollution on obesity in China. We chose different air pollution and BMI indicators for estimation and examined the impact of lagging air pollution. The similarity in results indicates a relatively stable relationship. We also used sex, age, and academic characteristics to stratify the samples and study their impact on the relationship between air pollution and obesity. As expected, air pollution can induce obesity, and the higher the degree of air pollution, the more serious is the effect on obesity. The closer to the survey month, the more serious the impact; it can be concluded that pollution has a cumulative effect on health. In addition, we found that CO is the most influential pollutant; we must, therefore, pay special attention to the changes in their concentration. We also identified that women, the middle-aged, and those with low levels of education were especially susceptible [22]. In the Public Health and Air Pollution in Asia (PAPA) study, Kan et al. (2008) [38] found that women were more susceptible to the effects of air pollution. In a pooled study of 130,000 respiratory deaths in 27 US. communities, Franklin et al. (2007) [39] revealed that community air pollution better predicted death among women than among men. Sex-specific lifestyle explanations (increased smoking among men may obscure pollution effects) and biological explanations (females’ smaller airways and higher airway reactivity) [40] might partially account for these effects. Although we observed that the effect of air pollution exposure on obesity was evident in females, additional inquiry into why this is the case is needed. Additionally, when stratified by age, the results showed that air pollution and obesity were more strongly correlated among older participants, especially for the prevalence of obesity, suggesting that older subgroups may be more sensitive to ambient air pollutants [26].
Our research adds evidence to the relationship between air pollution and obesity, which could provide important recommendations to minimize the risk of obesity due to air pollution. To avoid obesity, we should try our best to live in an environment with good air quality. Our findings provide significant evidence for people to choose an urban life, as high concentrations of air pollution could lead to health risks such as obesity. In daily life, residents should take necessary measures to reduce health risks from air pollution, such as wearing a mask, avoiding outdoor sports on heavy pollution days, using an air purifier, and placing green plants indoors. Past air pollution still has an impact on obesity, and the longer the lag period, the weaker the impact, relative to the current period. This means that air pollution will accumulate in the human body. Furthermore, identifying susceptible populations helps the government to formulate health policies.
It is necessary to discuss the limitations of the current study. First, genetics is an important factor that affects obesity [41,42]. Due to data limitations, we could not calculate the contribution from genetics on obesity. Further, because air pollution data at the city level were launched only in 2014, this study used a cross-sectional design and the findings cannot be applied to demonstrate a causal relationship between long-term air pollution and obesity. In the future, with the enrichment of micro-individual and air pollution data, we could use panel data to improve our analysis.
5. Conclusions
This study evaluated the relationship between air pollution and obesity based on data from the Chinese middle-aged and elderly populations. It found that air pollution is an important factor affecting obesity: the higher the air pollution level, the more serious the impact, and this impact has a cumulative effect. Additionally, CO is the most influential pollutant and women, the middle-aged, and those with low levels of education are the most severely affected. Therefore, when developing public health policies, the adverse health effects of air pollution should be considered.
Author Contributions
Methodology, Z.Y.; writing—original draft, Q.S.; writing—review and editing, J.L. and Y.Z.
Funding
This research is supported by Fundamental Research Funds for the Central Universities (No. FRF-TP-19-007A2; FRF-BD-19-006A) and the he Youth Program of the National Social Science Foundation of China (Grant No.15CJL011).
Acknowledgments
The authors would like to thank Qing Wang for helping with data.
Conflicts of Interest
The authors declare no conflict of interest.
Appendix A

Table A1.
Effect of Air Quality Index (AQI) on Body Mass Index (BMI): add physical activity variable.
Table A1.
Effect of Air Quality Index (AQI) on Body Mass Index (BMI): add physical activity variable.
| Variables | The BMI Score | BMI According to Chinese Criteria | ||||||
|---|---|---|---|---|---|---|---|---|
| Normal | Overweight | Obese | ||||||
| Coef. | Std. Err. | Adjusted OR | 95% CI | Adjusted OR | 95% CI | Adjusted OR | 95% CI | |
| AQI | 0.027 *** | 0.002 | 1.006 * | 0.999, 1.013 | 1.018 *** | 1.011, 1.026 | 1.027 *** | 1.019, 1.035 |
| Male | −0.088 | 0.113 | 1.751 ** | 1.25, 2.452 | 1.434 ** | 1.014, 2.027 | 1.565 ** | 1.071, 2.288 |
| Age | −0.055 *** | 0.005 | 0.952 *** | 0.939, 0.965 | 0.936 *** | 0.923, 0.949 | 0.92 *** | 0.905, 0.934 |
| Education | ||||||||
| Did Not Finish Primary School and Home School | 0.195 | 0.126 | 1.269 | 0.908, 1.773 | 1.406 * | 0.992, 1.993 | 1.405 * | 0.951, 2.076 |
| Elementary School | 0.348 *** | 0.123 | 1.252 | 0.892, 1.759 | 1.715 *** | 1.208, 2.436 | 1.434 * | 0.968, 2.124 |
| Middle School and Above | 0.475 *** | 0.122 | 1.17 | 0.822, 1.665 | 1.747 *** | 1.216, 2.511 | 1.409 * | 0.945, 2.099 |
| Married | 0.303 ** | 0.13 | 0.934 | 0.672, 1.297 | 1.101 | 0.779, 1.556 | 1.016 | 0.681, 1.514 |
| Uninsured | −0.176 | 0.146 | 1.263 | 0.821, 1.942 | 1.185 | 0.758, 1.852 | 0.986 | 0.592, 1.643 |
| Smoking | −1.312 *** | 0.107 | 0.562 *** | 0.413, 0.764 | 0.327 *** | 0.237, 0.450 | 0.218 *** | 0.151, 0.314 |
| Drinking | −0.011 | 0.099 | 1.158 | 0.856, 1.566 | 1.247 | 0.912, 1.704 | 1.099 | 0.774, 1.561 |
| Moderately Active | −0.28 ** | (0.142) | 0.814 | 0.541, 1.224 | 0.716 | 0.470, 1.091 | 0.712 | 0.446, 1.136 |
| Very Active | −0.663 *** | (0.096) | 0.757 ** | 0.576, 0.994 | 0.57 *** | 0.430, 0.757 | 0.507 *** | 0.369, 0.697 |
| Constant | 25.495 *** | 0.388 | 143.007 *** | 45.414, 450.323 | 127.245 *** | 39.133, 413.766 | 96.041 *** | 26.265, 351.186 |
| R-Squared | 0.097 | 0.043 | ||||||
| Log Likelihood | −6994 | |||||||
Notes: N = 6505. * p < 0.10; ** p < 0.05; *** p < 0.01.
References
- Ferris, B.G., Jr.; Speizer, F.E.; Spengler, J.D.; Dockery, D.; Bishop, Y.M.; Wolfson, M.; Humble, C. Effects of sulfur oxides and respirable particles on human health. Methodology and demography of populations in study. Am. Rev. Respir. Dis. 1979, 120, 767–779. [Google Scholar] [PubMed]
- Hoek, G.; Brunekreef, B.; Goldbohm, S.; Fischer, P.; van den Brandt, P.A. Association between mortality and indicators of traffic-related air pollution in the Netherlands: A cohort study. Lancet 2002, 360, 1203–1209. [Google Scholar] [CrossRef]
- Ghorani-Azam, A.; Riahi-Zanjani, B.; Balali-Mood, M. Effects of air pollution on human health and practical measures for prevention in Iran. J. Res. Med. Sci. 2016, 21, 65. [Google Scholar] [PubMed]
- Thibodeau, L.A.; Reed, R.B.; Bishop, Y.M.; Kammerman, L.A. Air pollution and human health: A review and reanalysis. Environ. Health Perspect. 1980, 34, 165–183. [Google Scholar] [CrossRef]
- Brunekreef, B.; Holgate, S.T. Air Pollution and Health. Lancet 2002, 360, 1233–1242. [Google Scholar] [CrossRef]
- Dhital, S.; Rupakheti, D. Bibliometric analysis of global research on air pollution and human health: 1998–2017. Environ. Sci. Pollut. Res. 2019, 26, 13103–13114. [Google Scholar] [CrossRef]
- Franklin, B.A.; Brook, R.; Arden Pope, C., 3rd. Air pollution and cardiovascular disease. Curr. Probl. Cardiol. 2015, 40, 207–238. [Google Scholar] [CrossRef]
- Jaganathan, S.; Jaacks, L.M.; Magsumbol, M.; Wang, C.; Liu, S.; Li, N.; Mao, S.; Hou, Y.; Lu, Y.; Xiang, H. Association of Long-Term Exposure to Fine Particulate Matter and Cardio-Metabolic Diseases in Low- and Middle-Income Countries: A Systematic Review. Int. J. Environ. Res. Public Health 2019, 16, 2541. [Google Scholar] [CrossRef]
- Liu, F.; Chen, G.; Huo, W.; Wang, C.; Liu, S.; Li, N.; Mao, S.; Hou, Y.; Lu, Y.; Xiang, H. Associations between long-term exposure to ambient air pollution and risk of type 2 diabetes mellitus: A systematic review and meta-analysis. Environ. Pollut. 2019, 252, 1235–1245. [Google Scholar] [CrossRef]
- Filippini, T.; Hatch, E.E.; Rothman, K.J.; Heck, J.E.; Park, A.S.; Crippa, A.; Orsini, N.; Vinceti, M. Association between Outdoor Air Pollution and Childhood Leukemia: A Systematic Review and Dose-Response Meta-Analysis. Environ. Health Perspect. 2019, 127, 46002. [Google Scholar] [CrossRef]
- Gaio, V.; Roquette, R.; Dias, C.M.; Nunes, B. Ambient air pollution and lipid profile: Systematic review and meta-analysis. Environ. Pollut. 2019, 254, 113036. [Google Scholar] [CrossRef] [PubMed]
- Kasdagli, M.I.; Katsouyanni, K.; Dimakopoulou, K.; Samoli, E. Air pollution and Parkinson’s disease: A systematic review and meta-analysis up to 2018. Int. J. Hyg. Environ. Health 2019, 222, 402–409. [Google Scholar] [CrossRef] [PubMed]
- Materko, W.; Benchimol-Barbosa, P.R.; Silva Carvalho, A.R.; Jurandir, N.; Edil, L.S. Accuracy of the WHO’s body mass index cut-off points to measure gender- and age-specific obesity in middle-aged adults living in the city of Rio de Janeiro, Brazil. J. Public Health Res. 2017, 6, 904. [Google Scholar] [CrossRef] [PubMed]
- World Health Organization. Ten Threats to Global Health in 2019. Available online: https://www.who.int/emergencies/ten-threats-to-global-health-in-2019 (accessed on 30 September 2019).
- Aranceta, B.J. Prevalence of obesity in developed countries: Current status and perspectives. Nutr. Hosp. 2012, 17, 34–41. [Google Scholar]
- An, R.; Ji, M.; Yan, H.; Guan, C. Impact of ambient air pollution on obesity: A systematic review. Int. J. Obes. 2018, 42, 1112–1126. [Google Scholar] [CrossRef]
- Xu, Z.; Xu, X.; Zhong, M.; Hotchkiss, L.P.; Lewandowski, R.P.; Wagner, J.G.; Bramble, L.A.; Yang, Y.; Wang, A.; Harkema, J.R.; et al. Ambient particulate air pollution induces oxidative stress and alterations of mitochondria and gene expression in brown and white adipose tissues. Part. Fibre Toxicol. 2011, 8, 20. [Google Scholar] [CrossRef]
- Toledo-Corral, CM.; Alderete, T.L.; Habre, R.; Berhane, K.; Lurmann, F.W.; Weigensberg, M.J.; Goran, M.I.; Gilliland, F.D. Effects of air pollution exposure on glucose metabolism in Los Angeles minority children. Pediatr. Obes. 2018, 13, 54–62. [Google Scholar] [CrossRef]
- World Health Organization. Ambient (Outdoor) Air Quality and Health; World Health Organization: Geneva, Switzerland, 2018; Available online: http://www.who.int/news-room/fact-sheets/detail/ambient-(outdoor)-air-quality-and-health (accessed on 4 November 2018).
- Wen, X.J.; Balluz, L.; Mokdad, A. Association Between Media Alerts of Air Quality Index and Change of Outdoor Activity Among Adult Asthma in Six States, BRFSS, 2005. J. Community Health 2009, 34, 40–46. [Google Scholar] [CrossRef]
- Roberts, J.D.; Voss, J.D.; Knight, B. The Association of Ambient Air Pollution and Physical Inactivity in the United States. PLoS ONE 2014, 9. [Google Scholar] [CrossRef]
- Li, M.; Qian, Z.; Vaughn, M.; Boutwell, B.; Ward, P.; Lu, T.; Lin, S.; Zhao, Y.; Zeng, X.; Liu, R.; et al. Sex-specific difference of the association between ambient air pollution and the prevalence of obesity in Chinese adults from a high pollution range area: 33 Communities Chinese Health Study. Atmos. Environ. 2015, 117, 227–233. [Google Scholar] [CrossRef]
- An, R.; Zhang, S.; Ji, M.; Guan, C. Impact of ambient air pollution on physical activity among adults: A systematic review and meta-analysis. Perspect. Public Health 2018, 138, 111–121. [Google Scholar] [CrossRef] [PubMed]
- Dong, G.H.; Qian, Z.; Liu, M.M.; Wang, D.; Ren, W.; Flick, L.; Fu, J.; Wang, J.; Chen, W.; Simckes, M.; et al. Ambient air pollution and the prevalence of obesity in Chinese children: The seven northeastern cities study. Obesity 2014, 22, 795–800. [Google Scholar] [CrossRef]
- Excretion, E.; Rates, C.O. Cities in China with higher levels of air pollution had a higher percentage of overweight and obesity in children. J. Clin. Endocrinol. Metab. 2014, 99, 21–22. [Google Scholar]
- Mcconnell, R.; Gilliland, F.D.; Goran, M.; Allayee, H.; Hricko, A.; Mittelman, S. Does near-roadway air pollution contribute to childhood obesity? Pediatr. Obes. 2016, 11, 1–3. [Google Scholar] [CrossRef] [PubMed]
- Michalaki, E.; Margetaki, K.; Roumeliotaki, T.; Vafeiadi, M.; Karachaliou, M.; Sarri, K.; Vassilaki, M.; Lakovides, M.; Stephanou, E.; Kogevinas, M.; et al. Air pollution during pregnancy and childhood obesity risk: Potential protective effect of diet. Clin. Nutr. Espen 2018, 24, 187. [Google Scholar] [CrossRef]
- Ghosh, R.; Gauderman, W.J.; Minor, H.; Youn, H.A.; Lurmann, F.; Cromar, K.R.; Chatzi, L.; Belcher, B.; Fielding, C.R.; Mcconnell, R. Air pollution, weight loss and metabolic benefits of bariatric surgery: A potential model for study of metabolic effects of environmental exposures. Pediatr. Obes. 2018, 13, 312–320. [Google Scholar] [CrossRef]
- Wei, Y.; Zhang, J.; Li, Z.; Gow, A.; Chung, K.F.; Hu, M.; Sun, Z.; Zeng, L.; Zhu, T.; Jia, G.; et al. Chronic exposure to air pollution particles increases the risk of obesity and metabolic syndrome: Findings from a natural experiment in Beijing. FASEB J. 2016, 30, 2115–2122. [Google Scholar] [CrossRef]
- Redd, S.C. Asthma in the United States: Burden and current theories. Environ. Health Perspect. 2002, 110, 557–560. [Google Scholar] [CrossRef]
- Zhao, Y.; Hu, Y.; Smith, J.P.; Strauss, J.; Yang, G. Cohort Profile: The China Health and Retirement Longitudinal Study (CHARLS). Int. J. Epidemiol. 2014, 43, 61–68. [Google Scholar] [CrossRef]
- Wang, Q.; Yang, Z.M. Does chronic disease influence susceptibility to the effects of air pollution on depressive symptoms in China? Int. J. Ment. Health Syst. 2018, 12, 33. [Google Scholar] [CrossRef] [Green Version]
- Wang, S.; Chen, R.; Liu, Q.; Zhan, S.; Li, L. Comprehensive treatment of hypertension middle-aged and elderly people: Cross-sectional survey data from the China Health and Retirement Longitudinal Study (CHARLS). Lancet 2015, 386, S67. [Google Scholar] [CrossRef]
- Willett, W.C.; Manson, J.E.; Stampfer, M.J.; Colditz, G.A.; Rosner, B.; Speizer, F.E.; Hennekens, C.H. Weight, Weight Change, and Coronary Heart Disease in Women. Risk within the ‘normal’ weight range. JAMA 1995, 273, 461–465. [Google Scholar] [CrossRef] [PubMed]
- Taghizadeh, N.; Boezen, H.M.; Schouten, J.P.; Schröder, C.P.; Elisabeth de Vries, E.G.; Vonk, J.M. BMI and Lifetime Changes in BMI and Cancer Mortality Risk. PLoS ONE 2015, 10, e0125261. [Google Scholar] [CrossRef] [PubMed]
- Qian, J.; Li, N.; Ren, X. Obesity and depressive symptoms among Chinese people aged 45 and over. Sci. Rep. 2017, 7, 45637. [Google Scholar] [CrossRef]
- Ministry of Ecology and Environment of the Peoples Republic of China. Technical Regulation on Ambient Air Quality Index (on Trial). Available online: http://kjs.mee.gov.cn/hjbhbz/bzwb/jcffbz/201203/t20120302_224166.shtml (accessed on 30 September 2019).
- Kan, H.; London, S.J.; Chen, G.; Zhang, Y.; Song, G.; Zhao, N.; Jiang, L.; Chen, B. Season, sex, age, and education as modifiers of the effects of outdoor air pollution on daily mortality in Shanghai, China: The Public Health and Air Pollution in Asia (PAPA) Study. Environ. Health Perspect. 2008, 116, 1183–1188. [Google Scholar] [CrossRef]
- Franklin, M.; Zeka, A.; Schwartz, J. Association between PM2.5 and all-cause and specific-cause mortality in 27 US communities. J. Expo. Sci. Environ. Epidemiol. 2007, 17, 279–287. [Google Scholar] [CrossRef]
- Yunginger, J.W.; Reed, C.E.; O’Connell, E.J.; Melton, L.J., 3rd; O’Fallon, W.M.; Silverstein, M.D. A community-based study of the epidemiology ofasthma. Incidence rates, 1964–1983. Am. Rev. Respir. Dis. 1992, 146, 888–894. [Google Scholar] [CrossRef]
- Fioravanti, S.; Cesaroni, G.; Badaloni, C.; Michelozzi, P.; Forastiere, F.; Porta, D. Traffic-related air pollution and childhood obesity in an Italian birth cohort. Environ. Res. 2018, 160, 479–486. [Google Scholar] [CrossRef]
- Chaput, J.P.; Pérusse, L.; Després, J.P.; Tremblay, A.; Bouchard, C. Findings from the Quebec Family Study on the Etiology of Obesity: Genetics and Environmental Highlights. Curr. Obes. Rep. 2014, 3, 54–66. [Google Scholar] [CrossRef] [Green Version]
Figure 1.
Flow chart.

Figure 2.
The geographical distribution of sample cities.

Figure 3.
Histogram of the Body Mass Index (BMI) score.

Table 1.
BMI according to WHO, Asian and Chinese criteria.
| Chinese Criteria | WHO Criteria | Asian Criteria | |
|---|---|---|---|
| Underweight | <18.5 | <18.5 | <18.5 |
| Normal | 18.5–23.9 | 18.5–24.9 | 18.5–22.9 |
| Overweight | 24–27.9 | 25–29.9 | 23–24.9 |
| Obese | ≥28 | ≥30 | ≥25 |
Table 2.
Characteristics of the study population.
| Full Sample | BMI According to Chinese Criteria | ||||
|---|---|---|---|---|---|
| (N = 13,414) | BMI < 18.5 | 18.5 ≤ BMI < 23.9 | 24 ≤ BMI < 27.9 | BMI ≥ 28 | |
| (N = 700) | (N = 6651) | (N = 4451) | (N = 1612) | ||
| Frequency | Frequency | Frequency | Frequency | Frequency | |
| Male | 6264 | 348 | 3413 | 1918 | 585 |
| Married | 11,622 | 563 | 5662 | 3949 | 1448 |
| Uninsured | 1089 | 70 | 562 | 345 | 112 |
| Education | |||||
| No Formal Education | 3447 | 257 | 1793 | 998 | 399 |
| Did not Finish Primary School and Home School | 2641 | 153 | 1396 | 795 | 297 |
| Elementary School | 3042 | 143 | 1519 | 1028 | 352 |
| Middle School and Above | 4284 | 147 | 1943 | 1630 | 564 |
| Smoking | 4127 | 288 | 2406 | 1136 | 297 |
| Drinking | 3500 | 171 | 1892 | 1111 | 326 |
| Categorical BMI Levels | |||||
| BMI < 18.5 | 700 | 700 | 0 | 0 | 0 |
| 18.5 ≤ BMI < 24 | 6651 | 0 | 6651 | 0 | 0 |
| 24 ≤ BMI < 28 | 4451 | 0 | 0 | 4451 | 0 |
| BMI ≥ 28 | 1612 | 0 | 0 | 0 | 1612 |
| Categorical AQI Levels | |||||
| AQI < 49.9 | 2790 | 196 | 1558 | 801 | 235 |
| 50 < AQI ≤ 99.9 | 10,316 | 491 | 4970 | 3542 | 1313 |
| 100 < AQI ≤ 149.9 | 308 | 13 | 123 | 108 | 64 |
| Mean (SD) | Mean (SD) | Mean (SD) | Mean (SD) | Mean (SD) | |
| Age | 60.932 (9.908) | 66.556 (10.762) | 61.794 (10.071) | 59.638 (9.295) | 58.51 (9.084) |
| BMI | 23.767 (3.45) | 17.72 (0.535) | 21.586 (1.496) | 25.758 (1.122) | 29.89 (1.511) |
| Continuous AQI | |||||
| Interview Month | 64.391 (17.656) | 59.726 (16.905) | 62.29 (16.892) | 66.525 (17.851) | 69.193 (18.71) |
| One-Month Lag | 67.104 (22.311) | 60.322 (20.102) | 64.261 (21.25) | 69.887 (22.674) | 74.097 (23.698) |
| Two-Month Lag | 74.038 (22.811) | 68.243 (21.767) | 71.573 (22.424) | 76.488 (22.815) | 79.956 (22.849) |
| Three-Month Lag | 79.716 (20.948) | 74.615 (19.843) | 77.42 (20.015) | 81.927 (21.445) | 85.3 (21.941) |
| Other Air Pollution | |||||
| PM2.5 | 37.655 (14.121) | 34.676 (13.29) | 36.117 (13.365) | 39.184 (14.516) | 41.069 (15.25) |
| PM10 | 66.193 (24.413) | 59.764 (22.35) | 63.12 (22.968) | 69.264 (25.153) | 73.183 (26.24) |
| CO | 0.837 (0.306) | 0.794 (0.261) | 0.825 (0.296) | 0.847 (0.316) | 0.875 (0.333) |
| NO2 | 23.14 (8.201) | 21.684 (8.006) | 22.508 (8.13) | 23.775 (8.209) | 24.632 (8.2) |
| O3 | 67.888 (16.914) | 65.07 (16.215) | 66.661 (16.846) | 69.057 (16.78) | 70.948 (17.2) |
| SO2 | 16.099 (9.109) | 16.122 (9.028) | 15.884 (9.01) | 16.374 (9.309) | 16.213 (8.976) |
Table 3.
Effect of Air Quality Index (AQI) on Body Mass Index (BMI).
| Variables | The BMI Score | BMI According to Chinese Criteria | ||||||
|---|---|---|---|---|---|---|---|---|
| Normal | Overweight | Obese | ||||||
| Coef. | Std. Err. | Adjusted OR | 95% CI | Adjusted OR | 95% CI | Adjusted OR | 95% CI | |
| AQI | 0.031 *** | 0.002 | 1.01 *** | 1.005, 1.015 | 1.024 *** | 1.019, 1.029 | 1.032 *** | 1.027, 1.038 |
| Male | −0.229 *** | 0.078 | 1.32 ** | 1.06, 1.645 | 1.106 | 0.881, 1.388 | 1.091 | 0.847, 1.406 |
| Age | −0.052 *** | 0.003 | 0.954 *** | 0.945, 0.962 | 0.938 *** | 0.929, 0.946 | 0.924 *** | 0.914, 0.933 |
| Education | ||||||||
| Did Not Finish Primary School and Home School | 0.146 * | 0.089 | 1.114 | 0.891, 1.392 | 1.198 | 0.948, 1.514 | 1.123 | 0.861, 1.464 |
| Elementary School | 0.287 *** | 0.087 | 1.225 * | 0.971, 1.546 | 1.548 *** | 1.216, 1.97 | 1.302 * | 0.992, 1.708 |
| Middle School and Above | 0.527 *** | 0.085 | 1.241 * | 0.974, 1.581 | 1.826 *** | 1.443, 2.343 | 1.488 *** | 1.13, 1.96 |
| Married | 0.219 ** | 0.087 | 0.831 * | 0.666, 1.036 | 0.949 | 0.752, 1.198 | 0.984 | 0.75, 1.293 |
| Uninsured | −0.049 | 0.103 | 1.004 | 0.768, 1.313 | 1.013 | 0.765, 1.341 | 0.908 | 0.657, 1.257 |
| Smoking | −1.183 *** | 0.075 | 0.612 *** | 0.5, 0.75 | 0.391 *** | 0.316, 0.484 | 0.279 *** | 0.218, 0.357 |
| Drinking | −0.062 | 0.07 | 1.16 | 0.95, 1.416 | 1.141 | 0.927, 1.404 | 0.99 | 0.781, 1.256 |
| Constant | 24.989 *** | 0.266 | 110.851 *** | 52.671, 233.293 | 79.481 *** | 36.842, 171.468 | 49.531 *** | 21.065, 116.466 |
| R-Squared | 0.092 | 0.039 | ||||||
| Log Likelihood | –14,466 | |||||||
Notes: N = 13,414. * p < 0.10; ** p < 0.05; *** p < 0.01.
Table 4.
Effect of Air Quality Index (AQI) on Body Mass Index (BMI): BMI according to WHO and Asian criteria.
Table 4.
Effect of Air Quality Index (AQI) on Body Mass Index (BMI): BMI according to WHO and Asian criteria.
| Variables | BMI According to Chinese Criteria | |||||
|---|---|---|---|---|---|---|
| Normal | Overweight | Obese | ||||
| Adjusted OR | 95% CI | Adjusted OR | 95% CI | Adjusted OR | 95% CI | |
| A. BMI According to WHO Criteria | ||||||
| AQI | 1.012 *** | 1.007, 1.017 | 1.026 *** | 1.021, 1.032 | 1.036 *** | 1.029, 1.043 |
| R-Squared | 0.04 | |||||
| Log Likelihood | −12,369 | |||||
| B. BMI According to Asian Criteria | ||||||
| AQI | 1.008 *** | 1.003, 1.013 | 1.02 *** | 1.014, 1.025 | 1.028 *** | 1.023, 1.033 |
| R-Squared | 0.038 | |||||
| Log Likelihood | −15,733 | |||||
Notes: N = 13,414. *** p < 0.01.
Table 5.
Effect of Air Quality Index (AQI) on Body Mass Index (BMI): median AQI.
| Variables | The BMI Score | BMI According to Chinese Criteria | ||||||
|---|---|---|---|---|---|---|---|---|
| Normal | Overweight | Obese | ||||||
| Coef. | Std. Err. | Adjusted OR | 95% CI | Adjusted OR | 95% CI | Adjusted OR | 95% CI | |
| AQI | 0.03 *** | 0.002 | 1.01 *** | 1.005, 1.015 | 1.023 *** | 1.018, 1.029 | 1.031 *** | 1.026, 1.037 |
| R-Squared | 0.091 | 0.039 | ||||||
| Log Likelihood | −14,471 | |||||||
Notes: N = 13,414. *** p < 0.01. AQI is constructed using median AQI for the month.
Table 6.
Effect of Air Quality Index (AQI) on Body Mass Index (BMI): categorical AQI levels.
| Variables | The BMI Score | BMI According to Chinese Criteria | ||||||
|---|---|---|---|---|---|---|---|---|
| Normal | Overweight | Obese | ||||||
| Coef. | Std. Err. | Adjusted OR | 95% CI | Adjusted OR | 95% CI | Adjusted OR | 95% CI | |
| 50 < AQI ≤ 99.9 | 0.752 *** | 0.069 | 1.296 *** | 1.085, 1.548 | 1.799 *** | 1.492, 2.168 | 2.336 *** | 1.872, 2.914 |
| 100 < AQI ≤ 149.9 | 1.364 *** | 0.207 | 1.215 | 0.67, 2.206 | 2.049 ** | 1.117, 3.758 | 4.24 *** | 2.238, 8.03 |
| R-squared | 0.076 | 0.033 | ||||||
| Log likelihood | −14,556 | |||||||
Notes: N = 13,414. ** p < 0.05; *** p < 0.01.
Table 7.
Effect of Air Quality Index (AQI) on Body Mass Index (BMI): AQI lag.
| Variables | The BMI Score | BMI According to Chinese Criteria | ||||||
|---|---|---|---|---|---|---|---|---|
| Normal | Overweight | Obese | ||||||
| Coef. | Std. Err. | Adjusted OR | 95% CI | Adjusted OR | 95% CI | Adjusted OR | 95% CI | |
| One-Month Lag | 0.027 *** | 0.001 | 1.01 *** | 1.006, 1.014 | 1.022 *** | 1.017, 1.026 | 1.03 *** | 1.025, 1.034 |
| R-Squared | 0.098 | 0.042 | ||||||
| Log Likelihood | −14,433 | |||||||
| Two-Month Lag | 0.022 *** | 0.001 | 1.007 *** | 1.003, 1.01 | 1.016 *** | 1.012, 1.02 | 1.023 *** | 1.019, 1.027 |
| R-Squared | 0.088 | 0.038 | ||||||
| Log Likelihood | −14,491 | |||||||
| Three-Month lag | 0.024 *** | 0.001 | 1.008 *** | 1.003, 1.012 | 1.018 *** | 1.014, 1.022 | 1.025 *** | 1.02, 1.03 |
| R-Squared | 0.089 | 0.038 | ||||||
| Log Likelihood | −14,489 | |||||||
Notes: N = 13,414. *** p < 0.01. AQI is constructed using the median 1–3 month prior to the interview.
Table 8.
Effect of other air pollution on Body Mass Index (BMI).
| Variables | The BMI Score | BMI According to Chinese Criteria | ||||||
|---|---|---|---|---|---|---|---|---|
| Normal | Overweight | Obese | ||||||
| Coef. | Std. Err. | Adjusted OR | 95% CI | Adjusted OR | 95% CI | Adjusted OR | 95% CI | |
| PM2.5 | 0.034 *** | 0.002 | 1.009 *** | 1.003, 1.016 | 1.025 *** | 1.018, 1.032 | 1.034 *** | 1.027, 1.041 |
| R-Squared | 0.087 | 0.037 | ||||||
| Log Likelihood | −14,498 | |||||||
| PM10 | 0.023 *** | 0.001 | 1.007 *** | 1.003, 1.011 | 1.017 *** | 1.013, 1.021 | 1.024 *** | 1.019, 1.028 |
| R-Squared | 0.093 | 0.04 | ||||||
| Log Likelihood | −14,458 | |||||||
| CO | 0.52 *** | 0.095 | 1.385 ** | 1.036, 1.851 | 1.631 *** | 1.213, 2.193 | 2.145 *** | 1.56, 2.949 |
| R-Squared | 0.07 | 0.03 | ||||||
| Log Likelihood | −14,602 | |||||||
| NO2 | 0.045 *** | 0.004 | 1.013 ** | 1.003, 1.024 | 1.032 *** | 1.022, 1.043 | 1.046 *** | 1.034, 1.058 |
| R-Squared | 0.079 | 0.034 | ||||||
| Log Likelihood | −14,552 | |||||||
| O3 | 0.021 *** | 0.002 | 1.006 ** | 1.001, 1.011 | 1.015 *** | 1.01, 1.02 | 1.022 *** | 1.016, 1.028 |
| R-Squared | 0.078 | 0.033 | ||||||
| Log Likelihood | −14,555 | |||||||
| SO2 | 0.008 ** | 0.003 | 0.999 | 0.99, 1.007 | 1.005 | 0.996, 1.014 | 1.003 | 0.993, 1.013 |
| R-Squared | 0.068 | 0.03 | ||||||
| Log Likelihood | −14615 | |||||||
Notes: N = 13,414. ** p < 0.05; *** p < 0.01.
Table 9.
Effect of Air Quality Index (AQI) on Body Mass Index (BMI): by sex, age, and education.
| Variables | The BMI Score | BMI According to Chinese Criteria | ||||||
|---|---|---|---|---|---|---|---|---|
| Normal | Overweight | Obese | ||||||
| Coef. | Std. Err. | Adjusted OR | 95% CI | Adjusted OR | 95% CI | Adjusted OR | 95% CI | |
| A. Sex | ||||||||
| Male (N = 6264) | ||||||||
| AQI | 0.027 *** | 0.002 | 1.012 *** | 1.005, 1.019 | 1.026 *** | 1.018, 1.034 | 1.032 *** | 1.024, 1.041 |
| R-Squared | 0.104 | 0.047 | ||||||
| Log Likelihood | –6420 | |||||||
| Female (N = 7150) | ||||||||
| AQI | 0.034 *** | 0.002 | 1.009 ** | 1.002, 1.016 | 1.023 *** | 1.015, 1.03 | 1.033 *** | 1.024, 1.04 |
| R-Squared | 0.064 | 0.028 | ||||||
| Log Likelihood | −8012 | |||||||
| B. Age | ||||||||
| Age < 60 (N = 7271) | ||||||||
| AQI | 0.03 *** | 0.002 | 1.015 *** | 1.005, 1.025 | 1.027 *** | 1.017, 1.037 | 1.036 *** | 1.026, 1.047 |
| R-Squared | 0.056 | 0.023 | ||||||
| Log Likelihood | −6689 | |||||||
| Age ≥ 60 (N = 6143) | ||||||||
| AQI | 0.03 *** | 0.002 | 1.008 *** | 1.002, 1.014 | 1.023 *** | 1.017, 1.03 | 1.031 *** | 1.024, 1.038 |
| R-Squared | 0.097 | 0.041 | ||||||
| Log Likelihood | −7748 | |||||||
| C. Education | ||||||||
| Edu = 1 or 2 (N = 6182) | ||||||||
| AQI | 0.037 *** | 0.003 | 1.009 *** | 1.002, 1.015 | 1.025 *** | 1.018, 1.032 | 1.034 *** | 1.026, 1.041 |
| R-Squared | 0.092 | 0.046 | ||||||
| Log Likelihood | −6774 | |||||||
| Edu = 4 (N = 3042) | ||||||||
| AQI | 0.029 *** | 0.003 | 1.01 * | 0.999, 1.022 | 1.025 *** | 1.013, 1.037 | 1.031 *** | 1.018, 1.044 |
| R-Squared | 0.097 | 0.041 | ||||||
| Log Likelihood | −3229 | |||||||
| Edu = 5 (N = 4284) | ||||||||
| AQI | 0.027 *** | 0.003 | 1.012 ** | 1.001, 1.023 | 1.023 *** | 1.012, 1.034 | 1.033 *** | 1.021, 1.044 |
| R-Squared | 0.06 | 0.026 | ||||||
| Log Likelihood | −4628 | |||||||
Notes: * p < 0.10; ** p < 0.05; *** p < 0.01.
© 2019 by the authors. Licensee MDPI, Basel, Switzerland. This article is an open access article distributed under the terms and conditions of the Creative Commons Attribution (CC BY) license (http://creativecommons.org/licenses/by/4.0/).
Share and Cite
MDPI and ACS Style
Yang, Z.; Song, Q.; Li, J.; Zhang, Y. Air Pollution as a Cause of Obesity: Micro-Level Evidence from Chinese Cities. Int. J. Environ. Res. Public Health 2019, 16, 4296. https://doi.org/10.3390/ijerph16214296
AMA Style
Yang Z, Song Q, Li J, Zhang Y. Air Pollution as a Cause of Obesity: Micro-Level Evidence from Chinese Cities. International Journal of Environmental Research and Public Health. 2019; 16(21):4296. https://doi.org/10.3390/ijerph16214296
Chicago/Turabian StyleYang, Zhiming, Qianhao Song, Jing Li, and Yunquan Zhang. 2019. "Air Pollution as a Cause of Obesity: Micro-Level Evidence from Chinese Cities" International Journal of Environmental Research and Public Health 16, no. 21: 4296. https://doi.org/10.3390/ijerph16214296
Note that from the first issue of 2016, this journal uses article numbers instead of page numbers. See further details here.